this report is strictly confidential - john piper · 1 nigel playing a round of golf! john piper...
TRANSCRIPT
THIS REPORT IS STRICTLY CONFIDENTIAL
IT IS NOT TO BE COPIED TO ANY OTHER PERSON
© John Piper 2012
Risk Disclaimer – No responsibility for loss occasioned to any person or corporate body
acting or refraining to act as a result of reading material in this report can be accepted by
the Publisher, the Author or any employees or agents of either – please read this page
carefully.
It is up to the reader to ensure that any trade or trades he or she places, if any, give effect
to his or her wishes. If you have any doubt on this matter you should seek appropriate
professional advice.
Never risk more than you can afford to lose.
For legal reasons we are obliged to state the following:
Disclaimer: To the fullest extent permitted by law, the authors and publisher are providing
this written material, its subsidiary elements, including correspondence by email, and its
contents on an ‘as is’ basis and make no (and expressly disclaim all) representations or
warranties of any kind with respect to this material or its contents including, without
limitation, advice and recommendations, warranties or merchantability and fitness for a
particular purpose. The information is given for educational and entertainment (we want
you to enjoy this manual) purposes only. In addition, the authors and publisher do not
represent or warrant that the information accessible via this material is accurate, complete
or current (although we have made every effort to ensure that it is so). To the fullest extent
permitted by law, neither the authors or publisher or any of his affiliates, partners,
directors, employees or other representatives will be liable for damages arising out of or in
connection with the use of this material. This is a comprehensive limitation of liability that
applies to all damages of any kind, including (without limitation) compensatory, direct,
indirect or consequential damages, loss of data, income or profit, loss of or damage to
property and claims of third parties.
All rights reserved. No reproduction, copying or transmission of this publication may be
made without written permission. No paragraph of this publication may be reproduced,
copied or transmitted without written permission.
Please Note
IT IS ALWAYS ADVISABLE TO RISK SMALL SUMS WHEN STARTING ANY NEW
TRADING PLAN – you can also “paper trade” initially - bear in mind there is no
rush. Take your time learning this thoroughly. If you rush you may ruin the
opportunity. Remember Trading is a “life” skill meaning if you get it right it
will set you up for life!
1
Nigel playing a round of Golf!
John Piper – Successful
Trader and Author
Welcome
And so we begin our journey together…
Savour this moment, because one day you may look back on it and realise this was
the start of a new life. A life of prosperity and achievement which started from what
you are about to read in this course.
You are about to learn how to trade financial markets for a living. If you get it right,
this can lead to a life of financial freedom for you and
your family.
Introduction
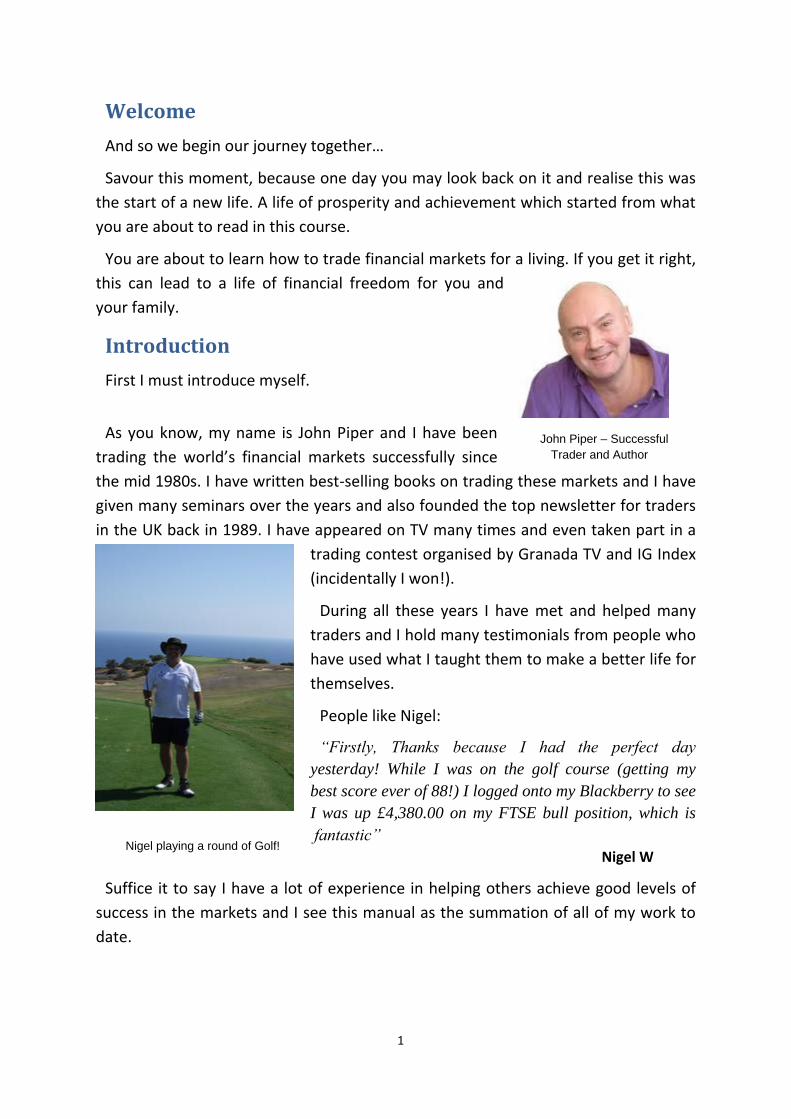
First I must introduce myself.
As you know, my name is John Piper and I have been
trading the world’s financial markets successfully since
the mid 1980s. I have written best-selling books on trading these markets and I have
given many seminars over the years and also founded the top newsletter for traders
in the UK back in 1989. I have appeared on TV many times and even taken part in a
trading contest organised by Granada TV and IG Index
(incidentally I won!).
During all these years I have met and helped many
traders and I hold many testimonials from people who
have used what I taught them to make a better life for
themselves.
People like Nigel:
“Firstly, Thanks because I had the perfect day
yesterday! While I was on the golf course (getting my
best score ever of 88!) I logged onto my Blackberry to see
I was up £4,380.00 on my FTSE bull position, which is
fantastic”
Nigel W
Suffice it to say I have a lot of experience in helping others achieve good levels of
success in the markets and I see this manual as the summation of all of my work to
date.
2
I also spend time with experienced traders and in 2010
met up with “LifeStyle” trader Mark Austin who spends
his time travelling the exotic locations of the world. One
of the great advantages of this business is that it sets you
free to do what you want to do. I mention Mark because
he is the “guru” of gap trading and, whereas KrautGap is
all my own work, the inspiration behind it comes from Mark
and I want to acknowledge that.
My Aim in Producing KrautGap
I have three aims in this course:
1. To condense all I have learnt over the last 25+ years into this course, both from
the perspective of trading markets and from the perspective of helping others to
trade. With this in mind I have included material in addition to what you need to
trade KrautGap successfully.
2. To provide all levels of trader (from beginners to those who have been trading for
some years) with a simple step-by-step guide to how to get this system making
good profits. In that way, beginners can learn the ropes whilst more advanced
traders can take away useful ideas and improve their trading techniques.
3. To provide simple rules as we go along so that you can take very low-stake, low-
risk trades and get a feel for what trading is all about – there is no substitute for
direct experience! To put this another way, you either do this and start to learn, or
you don’t do it and you get nowhere!
A great deal of thought has gone into this manual and it consists of 10 modules so
you can understand how and why KrautGap has developed as it has. My suggestion
is that you work through each section carefully and do the exercises as these will
provide a powerful learning experience.
Each section consists of a lesson which will be stated clearly in language we will all
understand (at least that is the intention) and followed by an exercise to do – don’t
worry, this is not going to take up very much of your time.
But this is a serious endeavour, by the end of this course you will have built the
solid foundations required to become self sufficient and make money in the markets
with the view of making this your main source of income.
That will set you free!
Mark Austin
3
So I would encourage you to spend more time on this rather than less – it is worth
it.
All of the material is in this course, so you move forward as quickly as you want BUT
you will gain more by taking it slowly.
The Name – KrautGap
I want to say a quick word about the name of this course. I am not trying to be
offensive to my German friends! Rather the opposite. I like ‘KrautRock’ music and the
term ‘Kraut’ is used endearingly in that context.
Since this course concerns the German DAX Index, and since it is a gap-trading
system (to be explained) the name KrautGap sprang to mind. I liked it, so it stayed!
A Brief Word For Total Beginners
If you are a complete beginner I want to say a quick word about
what this is all about.
What we traders do is to place a bet on which way a market
will move.
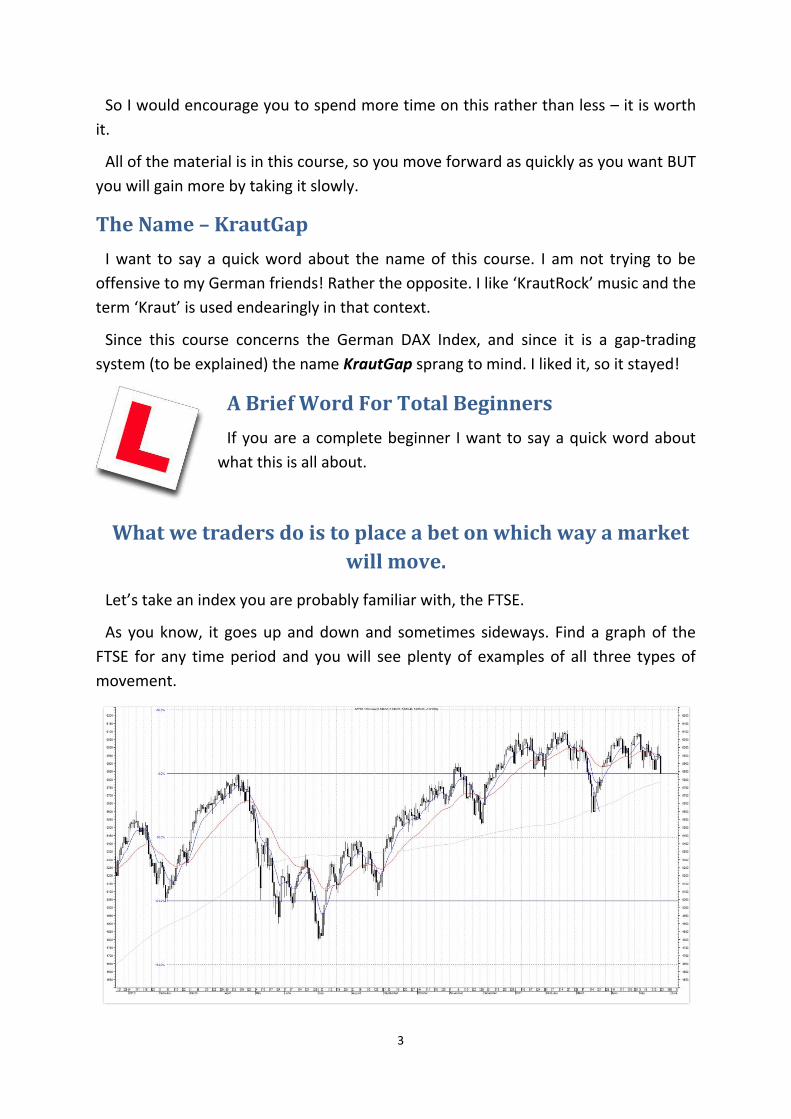
Let’s take an index you are probably familiar with, the FTSE.
As you know, it goes up and down and sometimes sideways. Find a graph of the
FTSE for any time period and you will see plenty of examples of all three types of
movement.

4
I hope you can see that if we place a bet that the FTSE (say) will go UP... and it does,
then we will win that bet at so many pounds per point. E.g. if we bet £1 a point and it
went up 50 points, we’d make £50.
So far so good.
We can do this the opposite way of course and I know this is something which
confuses the total beginner – but it’s really very easy! We can place a bet that the
market will go DOWN... and if it does, then we will win that bet at so many pounds
per point. So if we bet £2 a point that the market will fall, and it does fall by (say) 70
points, we would win £140.
What about sideways markets? Well, we don’t like those because we cannot win
money. The market has to move one way or the other for us to cash in. Actually
there are techniques for making money in sideways markets but these are more
advanced.
I hope that was easy.
One of the wonderful things about KrautGap is how simple it is to understand and
operate. For example, we only look at one Index. It isn’t the FTSE as it happens (for
reasons I’ll explain). It is the German equivalent called the DAX.
All we do is place simple bets on which way this Index (the DAX) is going to move.
We aim to be right more often than we are wrong and hence make steady profits.
It really is that easy.
So without more ado let’s get to the meat of how this amazingly simple and
profitable system works…
You only need to get to grips with these THREE
TECHNIQUES!
Yes, just three and I am going to set them all out for you as we go along.
The Trading System
The first technique is your system for extracting cash from the markets. Believe me
they are very willing to give you money as long as you approach them in the right
way – meaning if you use what I will teach you.
But you need to be aware that if you approach the markets in the wrong way they
can be voracious in taking your hard-earned cash away from you – so be warned.
5
Money Management
The second technique is known as Money Management. This may sound complex
but it’s really quite simple in principle.
I will be covering this in detail, so don’t worry about it for the moment.
Your Psychology
The third technique is knowing yourself, or to be more
precise it is knowing the psychology with which you
approach the markets.
In particular it is all about ensuring your psychology
remains cool, calm and collected as you place your bets on
the biggest casino in the world – for you are in for one hell
of a ride, that I can promise you!
But you will be totally safe as long as you follow the rules –
be sure not to forget that.
Introducing The Trading Idea
In this section I am going to introduce what I call the “trading idea” and by this I
mean the pattern of market action on which we base our trading system.
What we are looking for (what every successful trader needs) is an “edge” – an
‘unfair’ advantage so that we make money.
Without an edge we will always be at a disadvantage and
that is not what I am about.
What we are looking for are low-risk trading opportunities, by which I mean
opportunities where the risk is strictly controlled and the potential profit is excellent
– so if we lose (and this is bound to happen in the markets from time to time) we
only lose a little and when we win, we have the opportunity to win big!
Please read that again to make sure you have fully understood it.
So you can see how important it is to have a trading edge – it is the foundation
stone of all that follows. We certainly do not trade randomly. And although we place
bets on which way the Index will move, this is NOT gambling in the conventional
sense.
In order to introduce this idea I am going to show you a chart of price action.

6
The chart below shows you what this system is all about:
Don’t panic if this is all completely new to you. I want to make this understandable
to seasoned traders and to absolute beginners, so bear with me if some things are
obvious to you (remember how you struggled when you started out!)
So let me walk you through the chart, nice and slowly.
The first thing to notice is that it is a chart of the DAX – the German stock exchange.
It’s the German equivalent of the FTSE of course.
Now look at the bottom axis and notice it covers a period approximately from 27
April 2012 to the close of play on 3 May 2012 – four trading sessions.
The right hand vertical axis is, of course, the level of the DAX index.
So far so good.
Spotting Gaps
Now I want to draw your attention to the ‘gaps’.
There are actually four of them on this chart. Have a quick look to see if you can
spot them, before reading on. (I have left some massive clues!)
A ‘gap’ is when the Index takes a sudden jump up or down in value, with no
intervening price bars. I’m sure you can see when this will happen most frequently.
It’s when the market closes for the day at one level, and then something happens
7
overnight (usually good or bad news) and when the market opens first thing in the
morning, it is sharply higher or lower than the previous close, leaving a ‘gap’ in the
chart. Actually sometimes nothing at all happens overnight but that is markets for
you! (In fact it is often these moves which are the most tradable.)
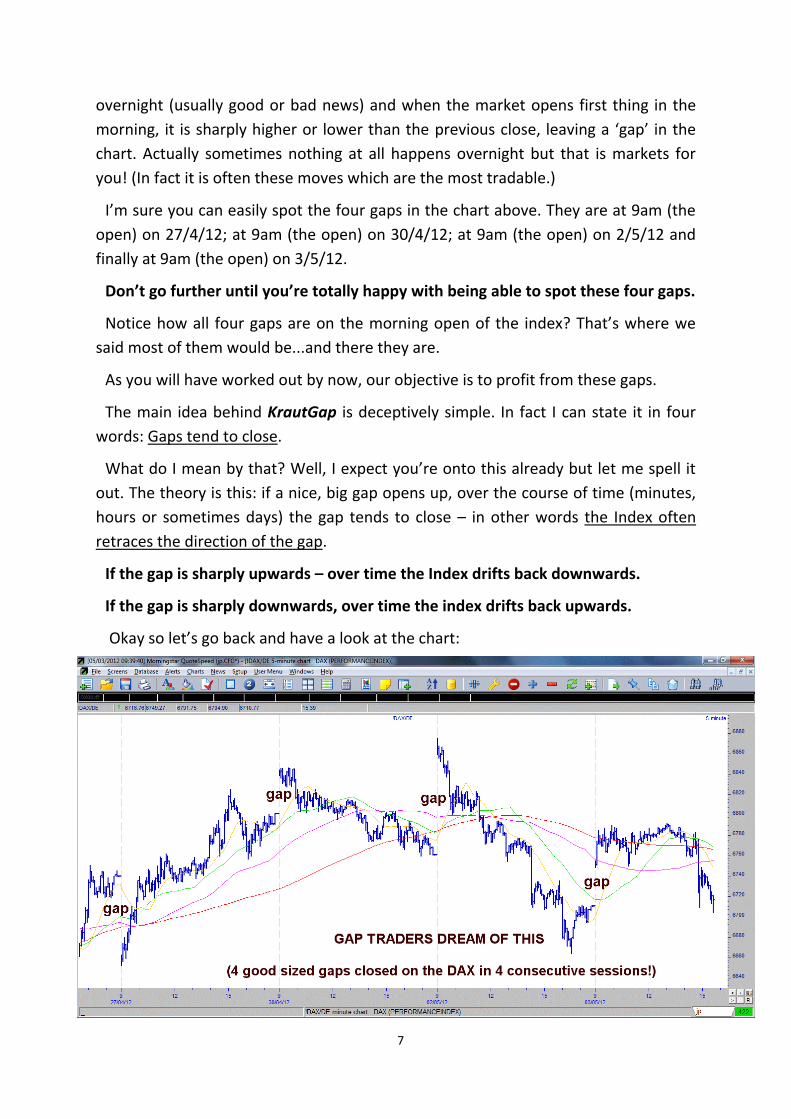
I’m sure you can easily spot the four gaps in the chart above. They are at 9am (the
open) on 27/4/12; at 9am (the open) on 30/4/12; at 9am (the open) on 2/5/12 and
finally at 9am (the open) on 3/5/12.
Don’t go further until you’re totally happy with being able to spot these four gaps.
Notice how all four gaps are on the morning open of the index? That’s where we
said most of them would be...and there they are.
As you will have worked out by now, our objective is to profit from these gaps.
The main idea behind KrautGap is deceptively simple. In fact I can state it in four
words: Gaps tend to close.
What do I mean by that? Well, I expect you’re onto this already but let me spell it
out. The theory is this: if a nice, big gap opens up, over the course of time (minutes,
hours or sometimes days) the gap tends to close – in other words the Index often
retraces the direction of the gap.
If the gap is sharply upwards – over time the Index drifts back downwards.
If the gap is sharply downwards, over time the index drifts back upwards.
Okay so let’s go back and have a look at the chart:
8
First look at 9am on 27 April 2012. You can see a big downward gap. The Index
closed at about 6740 on the previous day (26 April 2012) and opened sharply
downwards at about 6660 on the 27th.
But look what happened then! The Index retraced its lost ground until, a mere one
hour later, it was back at 6740 again.
Now look at the smaller gap on 30 April 2012 at 9am.
The Index closed at about 6800 on the previous day and opened sharply upwards at
about 6840 on the 30th.
But what happened next? Again, in about one hour the Index lost all that ground
and found itself back at 6800 again.
These Gaps Keep Closing!
Let’s look at the next one on 2 May 2012. Again at 9am. The previous close was at
about 6755 but the opening on the 2nd of May was massively higher at 6875. Hard to
make up that ground, you may be thinking? But look how the chart drifts downwards
until just over 3 hours later it is back again at 6755 having “closed the gap!”
Finally let’s look at the gap on 3 May 2012.
The close on 2 May 2012 was about the 6710 level. The opening the following
morning (3 May 2012) was sharply higher at about 6750. Now this gap took a bit
longer to close, but close it did. By 3pm (15h00) on the same day, the Index had lost
all the points gained by the upward spiking gap and had reached 6710 once again.
Now I hope you’re thinking: “Hmmm.... I like the look of this. If I see a gap and then
bet the opposite way to that gap, over time the gap will close and I’ll make lots of
money.”
Well you would be right, because that is the basic idea behind KrautGap.
Again, please don’t go any further until you have understood the theory behind
making money from this which is: wait for a gap, bet the opposite way, watch the
gap close, make a profit.
Why The DAX?
I want to briefly mention something you might be thinking. “Why the DAX? Why
don’t we do this on the FTSE?” The answer is that the gaps in the FTSE are ‘hidden’
and it always opens at the previous day’s close. That’s why we use the DAX. Actually
there is more to it than that. The DAX is far more dynamic, meaning we make more
money more quickly and it is better at closing gaps!
9
Now I have to say straight away that the chart above is exceptional. Four nice big
gaps of which three were closed directly after the opening and the third closed later
in the day – that equals profit in any language!
Having said this, it is not rare to see a chart like this and there are often plenty of
nice gaps for us to profit from.
With this system you get steps that are 100% mechanical so you know exactly what
to do every day. This does not mean the system has to be completely inflexible
though and you may well find yourself “improving” the system so that it suits your
trading style more precisely. But when starting out I suggest you just follow my
simple steps and gain experience (and in the trading world experience equals
success, as long as you follow the rules!)
A Brief Look at Price Charts
Before I continue I want to show you how price charts are constructed. Again be
patient if this is old hat to you.
Charts come in various different formats but I prefer what is known as a “bar”
chart. Each day a market will see an open (the opening level), a high (the highest
level traded during the session), a low (the lowest level traded during the session),
and a close (the closing level).
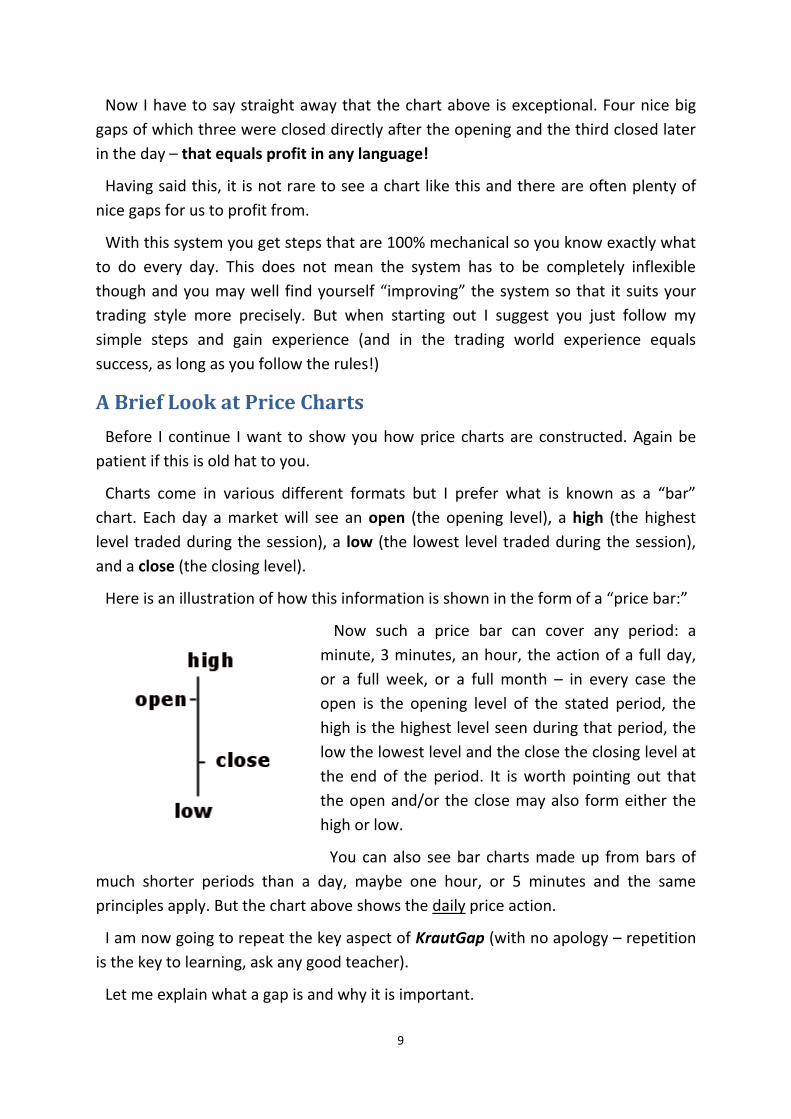
Here is an illustration of how this information is shown in the form of a “price bar:”
Now such a price bar can cover any period: a
minute, 3 minutes, an hour, the action of a full day,
or a full week, or a full month – in every case the
open is the opening level of the stated period, the
high is the highest level seen during that period, the
low the lowest level and the close the closing level at
the end of the period. It is worth pointing out that
the open and/or the close may also form either the
high or low.
You can also see bar charts made up from bars of
much shorter periods than a day, maybe one hour, or 5 minutes and the same
principles apply. But the chart above shows the daily price action.
I am now going to repeat the key aspect of KrautGap (with no apology – repetition
is the key to learning, ask any good teacher).
Let me explain what a gap is and why it is important.
10
What is a Gap?
A gap occurs when a market closes at a certain level and
then opens at a different level. Technically this is known as
a “closing” gap and there are other varieties but these
need not concern us here.
If you look at the chart above you will see the word “gap”
appears on four occasions amongst the price action and in every case you will see
that the end of the previous day’s price action (known as the close) is at a different
level from the start of the next day’s price action (known as the open).
These are the gaps that interest us and, more importantly you will see how the
market fully closed each gap within the session that created it – this is our edge!
Simply put, we can trade on the basis that a gap will close
and make money when that happens, whilst minimising our
losses on the time when it does not happen.
This concept is important so I will explain it again. The market closes at one level,
say 6000. It then opens at another level, say 6050. This means there is no trading
between 6000 and 6050 – this is a gap and rather as nature abhors a vacuum, a
market abhors a gap and tends to close it as soon as possible.
Why? Because the job of the market is to maximise trade, rather as our “job” on
earth is to maximise our individual potential. And at every price point between 6000
and 6050 there will be traders willing to trade and the market wants that action!
For this reason most gaps close and this gives us a great opportunity. If the market
opens at 6050 we need only SELL and we would then close the trade and win if the
gap is closed at 6000. If the market opens lower, say at 5950, we need only BUY and
we would then close the trade and win if the gap is closed at 6000.
That is our trading idea and it’s a good one. Gaps have been tested over the years
and they are HIGHLY reliable. In fact roughly 70% to 80% of gaps close and that
means you will generally make money on 70% to 80% of your trades – much, much
better than most other techniques!
However markets can be tricky and, as we go through the course you will learn a
number of key techniques which will prove highly useful in extracting cash from the
markets.
11
Hidden Gaps
I touched on this before and now I want to say a bit more about something that is
quite odd about gaps – they are usually “hidden!” I have chosen one of the few
Indices (the DAX) and one of the few charts of that index which actually shows the
gaps.
If you use your spread betting company’s charts the gaps vanish.
Why? Because they use 24 hour charting and there are very few gaps left visible.
Plus if you look at major indices like the UK’s FTSE 100 and the US DOW you will
NEVER see gaps because these indices artificially open at the closing level. The gaps
are hidden!
In my view this is deliberate. Professional traders use gaps because they are very
reliable so why leave them lying around for anyone to see? Much better to hide
them away – this really is buried treasure!
This brings us to your “homework” for this section and this is designed to meet two
objectives…
First to get you familiar with looking at price charts and seeing gaps.
Second to get you thinking about how to trade the gaps.
This a step-by-step course so your “homework” is duly explained step-by-step.
STEP ONE
Your homework is based on the German DAX Index and the first step is to establish
where the DAX closed the night before. There are various ways in which you can do
this.
First you need to know the trading hours. As the DAX is a German Index the timings
are in CET (Central European Time) which is generally one hour ahead of UK time.
The DAX opens at 09h00 CET each morning which is usually 08h00 in the UK. The DAX
closes at 17h30 CET, which is usually 16h30 – in fact the DAX basically trades at the
same time as the UK FTSE 100 Index.
However one point of order is that it can take a minute or two before official prices
come through after the open at 09h00 CET
If you pay for a price service such as Morning Star (for a free trial visit…
http://www.morningstar.co.uk/uk/membership/FeatureMatrix.aspx) then this will
give you the data, but failing that you will find the DAX on free services like ADVFN
12
(www.advfn.com) – on ADVFN the full name is DAX Performance Index – and Yahoo
Finance (http://finance.yahoo.com) – the symbol here is ^GDAXI and the URL is…
http://finance.yahoo.com/q?s=%5EGDAXI&ql=0
Personally I use Yahoo Finance and suggest you do the same.
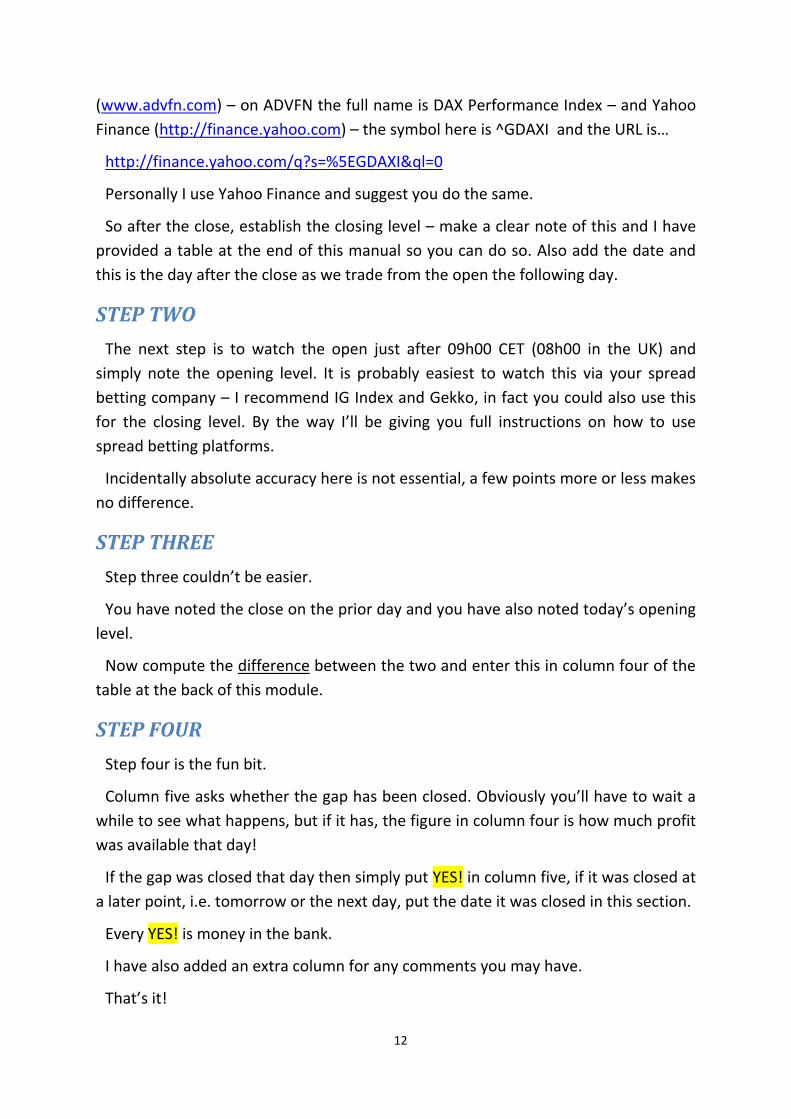
So after the close, establish the closing level – make a clear note of this and I have
provided a table at the end of this manual so you can do so. Also add the date and
this is the day after the close as we trade from the open the following day.
STEP TWO
The next step is to watch the open just after 09h00 CET (08h00 in the UK) and
simply note the opening level. It is probably easiest to watch this via your spread
betting company – I recommend IG Index and Gekko, in fact you could also use this
for the closing level. By the way I’ll be giving you full instructions on how to use
spread betting platforms.
Incidentally absolute accuracy here is not essential, a few points more or less makes
no difference.
STEP THREE
Step three couldn’t be easier.
You have noted the close on the prior day and you have also noted today’s opening
level.
Now compute the difference between the two and enter this in column four of the
table at the back of this module.
STEP FOUR
Step four is the fun bit.
Column five asks whether the gap has been closed. Obviously you’ll have to wait a
while to see what happens, but if it has, the figure in column four is how much profit
was available that day!
If the gap was closed that day then simply put YES! in column five, if it was closed at
a later point, i.e. tomorrow or the next day, put the date it was closed in this section.
Every YES! is money in the bank.
I have also added an extra column for any comments you may have.
That’s it!

13
In the next module we will be moving towards showing you how to turn the figures
you have entered into hard cash!
14
Appendix I – Notes on the DAX closing/opening levels
Date
Closing
Level
Opening
Level
(next day)
Difference
Was The
Gap
Closed?
Comments
15
16