this report has been prepared for the department of energy ... · industrial decarbonisation &...
TRANSCRIPT
Industrial Decarbonisation &Energy Efficiency Roadmapsto 2050
MARCH 2015
This report has been prepared for the
Department of Energy and Climate Change and
the Department for Business, Innovation and Skills
Cement
INDUSTRIAL DECARBONISATION AND ENERGY EFFICIENCY ROADMAPS TO 2050 – CEMENT
Pathways to Decarbonisation in 2050 Page i
CONTENTS
LIST OF FIGURES ..................................................................................................................................... V
LIST OF TABLES ..................................................................................................................................... VII
ACRONYMS ............................................................................................................................................ VIII
1. EXECUTIVE SUMMARY ............................................................................................................... 1
1.1 Introduction: What is the ‘Decarbonisation and Energy Efficiency Roadmap’ for theCement Sector? 1
1.2 Developing the Cement Sector Roadmap 1
1.3 Sector Findings 2
1.4 Enablers and Barriers for Decarbonisation in the cement sector 3
1.5 Analysis of Decarbonisation Potential in the Cement Sector 3
1.6 Conclusions and Key Technology Groups 5
2. INTRODUCTION, INCLUDING METHODOLOGY ......................................................................... 8
2.1 Project Aims and Research Questions 8
2.1.1 Introduction 8
2.1.2 Aims of the Project 9
2.1.3 What is a Roadmap? 9
2.2 Overall Methodology 10
2.2.1 Data Collection 11
2.2.2 Pathways 14
2.2.3 Conclusions and Next Steps 18
3. FINDINGS................................................................................................................................... 19
3.1 Key Points 19
3.2 Cement Processes 20
3.3 Current Emissions and Energy Use - Principal Question 1 23
3.3.1 Evolution of emission reductions 23
3.3.2 Emissions 23
3.3.3 Heat and Power Demand 25
INDUSTRIAL DECARBONISATION AND ENERGY EFFICIENCY ROADMAPS TO 2050 – CEMENT
Pathways to Decarbonisation in 2050 Page ii
3.3.4 Fuels Used 25
3.3.5 Lifespan of Equipment and Key Timings 26
3.4 Business Environment - Principal Question 2 27
3.4.1 Market Structure 27
3.4.2 Business Strategies 28
3.4.3 Decision-Making Processes 31
3.4.4 Financing Investments 31
3.4.5 Enablers and Barriers 32
3.5 Technologies to Reduce Carbon Emissions 41
3.5.1 Biomass Carbon Intensity 42
3.5.2 Cost of Options 43
4. PATHWAYS ................................................................................................................................ 44
4.1 Key Points 44
4.2 Pathways and Scenarios – Introduction and Guide 46
4.3 Baseline evolution - Principal Question 3 49
4.4 Emission-Reduction Potential and Pathway Analysis – Principal Question 4 and 5 49
4.4.1 Baseline - Business as Usual Pathway 49
4.4.2 20-40% CO2 Reduction Pathway 54
4.4.3 Maximum Technical with no CCS Pathway 56
4.4.4 Maximum Technical with CCS Pathway 59
4.4.5 MPA Cement GHG Strategy 2050 Scenarios 63
4.5 Scenario Analysis 63
4.5.1 Current Trends 64
4.5.2 Challenging World 65
4.5.3 Collaborative Growth 66
4.6 Sensitivity Analysis 67
4.7 Pathway Costs 68
4.7.1 Introduction 68
4.7.2 Calculation of Pathway Costs 68
INDUSTRIAL DECARBONISATION AND ENERGY EFFICIENCY ROADMAPS TO 2050 – CEMENT
Pathways to Decarbonisation in 2050 Page iii
4.7.3 Limitations 69
4.7.4 Cost Analysis Results 70
4.8 Implications of Enablers and Barriers 71
4.8.1 Alternative cements 72
4.8.2 Cementitious Substitution 73
4.8.3 Carbon Capture and Storage (CCS) 73
4.8.4 Fuel switching to biomass 74
4.8.5 Oxygen Enrichment Technology 75
4.8.6 Others 75
5. CONCLUSIONS - PRINCIPAL QUESTION 6 .............................................................................. 77
5.1 Key Points 77
5.2 Strategic Conclusions 80
5.2.1 Strategy, Leadership and Organisation 80
5.2.2 Business Case Barriers 80
5.2.3 Future Energy Costs, Energy Supply Security, Market Structure and Competition 81
5.2.4 Industrial energy policy context 81
5.2.5 Life-cycle Accounting 82
5.2.6 Value Chain Collaboration 83
5.2.7 Research, Development and Demonstration (RD&D) 83
5.2.8 People and Skills 83
5.3 Key Technology Groups 84
5.3.1 Electricity Grid Decarbonisation 84
5.3.2 Fuel and Feedstock Availability (including biomass) 84
5.3.3 Energy Efficiency and Heat Recovery 85
5.3.4 Clustering 85
5.3.5 Carbon Capture 85
5.3.6 Technologies Specific to the Cement Sector 86
5.4 Closing Statement 86
6. REFERENCES ........................................................................................................................... 87
INDUSTRIAL DECARBONISATION AND ENERGY EFFICIENCY ROADMAPS TO 2050 – CEMENT
Pathways to Decarbonisation in 2050 Page iv
7. GLOSSARY ................................................................................................................................ 91
8. ACKNOWLEDGEMENTS............................................................................................................ 94
INDUSTRIAL DECARBONISATION AND ENERGY EFFICIENCY ROADMAPS TO 2050 – CEMENT
Pathways to Decarbonisation in 2050 Page v
LIST OF FIGURES
Figure 1: Overview of the different decarbonisation and energy efficiency pathways ..................................... 4
Figure 2: Roadmap methodology ................................................................................................................11
Figure 3: Evidence gathering process .........................................................................................................13
Figure 4: The cement making process (IEA et al., 2009) ..............................................................................22
Figure 5: Average gross CO2 emissions per tonne (cementitious) (all GNR participants – World) (CSI, 2012) ...................................................................................................................................................................24
Figure 6 Annual CO2 emissions from UK cement production .......................................................................25
Figure 7: Fuels used in the calcination and clinker production process in the UK cement sector (DECC, 2014) ...................................................................................................................................................................26
Figure 8: Annual CO2 emissions from UK cement production (MPA, 2014) ..................................................28
Figure 9: Industry electricity prices in EU member states and the average in EU-27 2008-2012 (EuropeanCommission, 2012) .....................................................................................................................................29
Figure 10: Performance of pathways for the current trends scenario ............................................................45
Figure 11: Summary of analysis and methodology ......................................................................................47
Figure 12: Option deployment for the BAU pathway under current trends ....................................................50
Figure 13: Contribution of principal options to the absolute emissions reduction throughout study period, forthe BAU pathway, current trends scenario ...................................................................................................51
Figure 14: Reference trends for the three scenarios ....................................................................................51
Figure 15: Breakdown of 2050 emissions reduction, for the BAU pathway, current trends scenario..............52
Figure 16: BAU pathway for the different scenarios .....................................................................................53
Figure 17: Option deployment for the 20-40% CO2 reduction pathway under current trends .........................54
Figure 18: Contribution of principal options to the absolute emissions reduction throughout study period, forthe 20-40% CO2 reduction pathway, current trends scenario .......................................................................55
Figure 19: Breakdown of 2050 emissions reduction, for the 20-40% CO2 reduction pathway, current trendsscenario ......................................................................................................................................................56
Figure 20: Option deployment for the Max Tech with no CCS pathway under current trends ........................57
Figure 21: Contribution of principal options to the absolute savings throughout the study period, for the MaxTech 1 pathway, current trends scenario .....................................................................................................58
Figure 22: Breakdown of 2050 emissions reduction, for the Max Tech no CCS pathway, current trendsscenario ......................................................................................................................................................59
Figure 23: option deployment for the Max Tech with CCS pathway under current trends .............................60
INDUSTRIAL DECARBONISATION AND ENERGY EFFICIENCY ROADMAPS TO 2050 – CEMENT
Pathways to Decarbonisation in 2050 Page vi
Figure 24: Contribution of principal options to the absolute emissions reduction throughout the study period,for the Max Tech with CCS pathway, current trends scenario ......................................................................61
Figure 25: Breakdown of 2050 emissions reduction, for the Max Tech 2 pathway, current trends scenario...62
Figure 26: Max Tech with carbon capture pathway for the different scenarios ..............................................62
Figure 27: Performance of pathways for the current trends scenario ............................................................64
Figure 28: Performance of pathways for the challenging world scenario ......................................................65
Figure 29: Performance of pathways for the collaborative growth scenario ..................................................66
Figure 30: Pathways for current trends sensitivity analysis ..........................................................................67
INDUSTRIAL DECARBONISATION AND ENERGY EFFICIENCY ROADMAPS TO 2050 – CEMENT
Pathways to Decarbonisation in 2050 Page vii
LIST OF TABLES
Table 1: Energy intensive industry total direct and indirect carbon emissions in 2012 (data sources includeCCA agreements, EU ETS and NAEI) .......................................................................................................... 2
Table 2: Industrial sectors evaluated in this project ....................................................................................... 8
Table 3: Inputs and outputs for the industrial decarbonisation and energy efficiency roadmap to 2050 .........10
Table 4: Sector production growth data (MPA, 2014) ...................................................................................28
Table 5: Top enablers .................................................................................................................................33
Table 6: Top barriers ...................................................................................................................................37
Table 7: Pathway and scenarios matrix .......................................................................................................48
Table 8: Summary costs and impacts of decarbonisation for the pathways ..................................................71
INDUSTRIAL DECARBONISATION AND ENERGY EFFICIENCY ROADMAPS TO 2050 – CEMENT
Pathways to Decarbonisation in 2050 Page viii
ACRONYMS
ADOP Adoption RateAPP ApplicabilityBAT Best Available TechnologyBAU Business as usualcapex Capital ExpenditureCC Carbon CaptureCCA Climate Change AgreementCCS Carbon Capture and StorageCCU Carbon Capture and UtilisationCHP Combined Heat and PowerCO2 Carbon DioxideCRCs Carbon Reduction CommitmentsEU ETS European Emissions Trading SystemMPA Mineral Products AssociationR&D Research and DevelopmentRD&D Research Development and DemonstrationREA Rapid Evidence AssessmentROI Return on InvestmentSIC Codes Standard Industrial Classification codesSWOT Strengths, Weaknesses, Opportunities and ThreatsTRL Technology Readiness LevelUK PRTR UK Pollutant Release and Transfer Register
INDUSTRIAL DECARBONISATION AND ENERGY EFFICIENCY ROADMAPS TO 2050 – CEMENT
Section 1 – Executive Summary Page 1 of 94
1. EXECUTIVE SUMMARY
1.1 Introduction: What is the ‘Decarbonisation and Energy EfficiencyRoadmap’ for the Cement Sector?
This report is a ‘decarbonisation and energy efficiency roadmap’ for the cement sector, one of a series ofeight reports that assess the potential for a low-carbon future across the most energy intensive industrialsectors in the UK. It investigates how the industry could decarbonise and increase energy efficiency whilstremaining competitive.
Changes in the international economy and the need to decarbonise mean that UK businesses faceincreasing challenges, as well as new opportunities. The UK government is committed to moving to a low-carbon economy, including the most energy-intensive sectors. These sectors consume a considerableamount of energy but also play an essential role in delivering the UK’s transition to a low-carbon economy,as well as in contributing to economic growth and rebalancing the economy.
The roadmap project aims were to:
· Improve understanding of the emissions abatement potential of individual industrial sectors, therelative costs of alternative abatement options and the related business environment includinginvestment decisions, barriers and issues of competitiveness.
· Establish a shared evidence base to inform future policy and identify strategic conclusions andpotential next steps to help deliver cost effective decarbonisation in the medium to long term (overthe period from 2020 to 2050).
Each roadmap aims to present existing and new evidence, analysis and conclusions to inform subsequentmeasures with respect to issues such as industry leadership, industrial policy, decarbonisation and energyefficiency technologies, business investments, research, development and demonstration (RD&D) and skills.
This roadmap is the result of close collaboration between industry, academics and government (Departmentof Energy and Climate Change (DECC) and Department for Business, Innovation and Skills (BIS)), whichhas been facilitated and delivered by independent consultants Parsons Brinckerhoff and DNV GL; theauthors of the reports.
1.2 Developing the Cement Sector Roadmap
The development of the cement sector roadmap consisted of three main phases:
1. Collection of evidence relating to technical options and business-related enablers and barriers fordecarbonisation. Evidence was collected via a literature review, analysis of publicly available data,interviews, workshops and a survey of cement manufacturing companies. Validation of evidence andearly development of the decarbonisation potential took place during an initial workshop.
2. Development of decarbonisation ‘pathways’ to 2050 to identify and investigate an illustrativetechnology mix for a range of emissions reduction levels. Draft results were validated at a secondworkshop.
3. Interpretation and analysis of the technical and business-related evidence to draw conclusions andidentify potential next steps. These example actions, informed by the evidence and analysis, aim toassist with overcoming barriers to delivery of technologies within the decarbonisation and energyefficiency pathways while maintaining competitiveness.
INDUSTRIAL DECARBONISATION AND ENERGY EFFICIENCY ROADMAPS TO 2050 – CEMENT
Section 1 – Executive Summary Page 2 of 94
A sector team comprising representatives from the cement industry and its trade association (the MineralsProduct Association (MPA), the Government and Imperial College) acted as a steering group as well ascontributing evidence and reviewing draft project outputs. It should be noted that the findings from theinterviews and workshops represent the opinions and perceptions of particular industrial stakeholders, andmay not therefore be representative of the entire sector. Where possible we have tried to include alternativefindings or viewpoints, but this has not always been possible; this needs to be taken into account whenreading this report.
1.3 Sector Findings
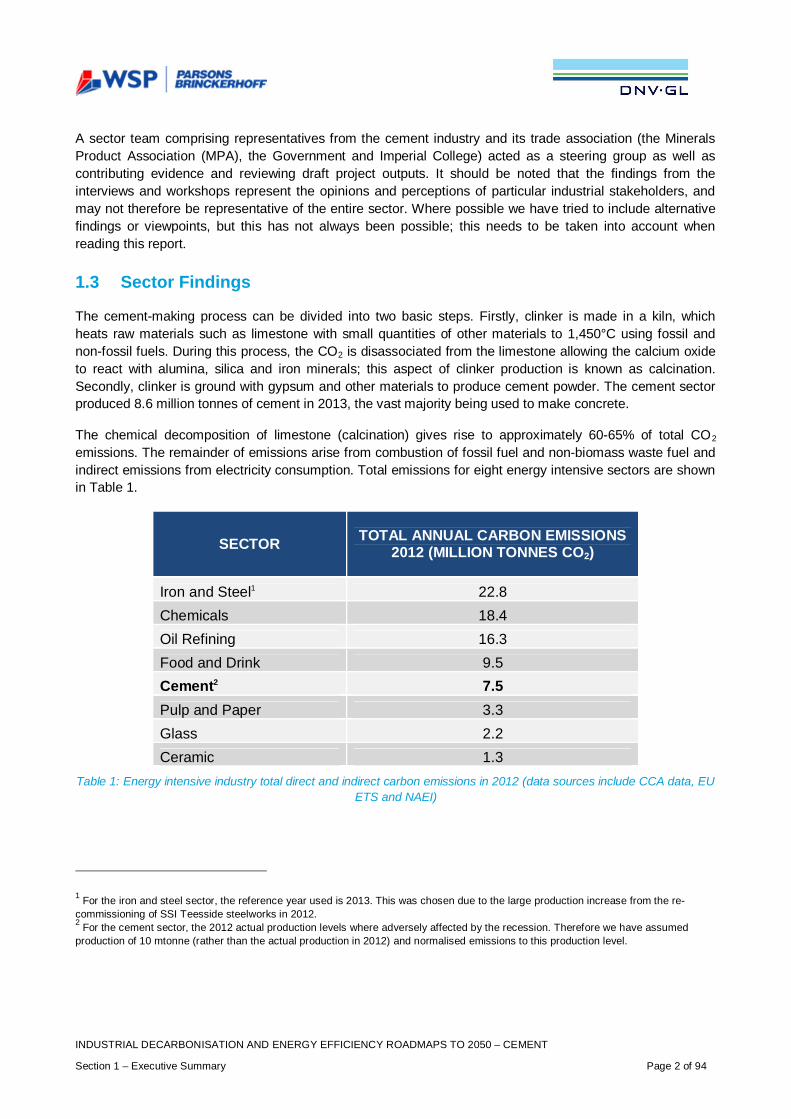
The cement-making process can be divided into two basic steps. Firstly, clinker is made in a kiln, whichheats raw materials such as limestone with small quantities of other materials to 1,450°C using fossil andnon-fossil fuels. During this process, the CO2 is disassociated from the limestone allowing the calcium oxideto react with alumina, silica and iron minerals; this aspect of clinker production is known as calcination.Secondly, clinker is ground with gypsum and other materials to produce cement powder. The cement sectorproduced 8.6 million tonnes of cement in 2013, the vast majority being used to make concrete.
The chemical decomposition of limestone (calcination) gives rise to approximately 60-65% of total CO2
emissions. The remainder of emissions arise from combustion of fossil fuel and non-biomass waste fuel andindirect emissions from electricity consumption. Total emissions for eight energy intensive sectors are shownin Table 1.
SECTOR TOTAL ANNUAL CARBON EMISSIONS2012 (MILLION TONNES CO2)
Iron and Steel1 22.8Chemicals 18.4Oil Refining 16.3Food and Drink 9.5Cement2 7.5Pulp and Paper 3.3Glass 2.2Ceramic 1.3
Table 1: Energy intensive industry total direct and indirect carbon emissions in 2012 (data sources include CCA data, EUETS and NAEI)
1 For the iron and steel sector, the reference year used is 2013. This was chosen due to the large production increase from the re-commissioning of SSI Teesside steelworks in 2012.2 For the cement sector, the 2012 actual production levels where adversely affected by the recession. Therefore we have assumedproduction of 10 mtonne (rather than the actual production in 2012) and normalised emissions to this production level.
INDUSTRIAL DECARBONISATION AND ENERGY EFFICIENCY ROADMAPS TO 2050 – CEMENT
Section 1 – Executive Summary Page 3 of 94
Cement is an energy intensive sector; energy is one of the largest operational costs in cement making. In2012 it was estimated to emit 7 million tonnes/year of CO2, with a further 0.37 million tonnes CO2/yearemitted in electricity production for use within the sector.
The companies operating within the cement sector are predominantly owned by international businessesheadquartered outside of the UK. UK cement revenues were £426 million in 2012 (ONS, 2013).
The sector has been consolidating over a long period of time and the recession has further exacerbated thistrend. In addition, an increasing market share is being taken by imports. However, there has been an upturnin production since the economy returned to growth.
1.4 Enablers and Barriers for Decarbonisation in the cement sector
In this report, we look at ‘enablers’, ‘barriers’ and ‘technical options’ for decarbonisation of the cement sector.Enablers for decarbonisation and, in particular, decarbonisation and energy efficiency projects include theability to overcome significant technical and economic complexity and business risk associated with availableenergy efficiency measures. For example, cement companies noted that they have pipelines of variousenergy reduction projects awaiting funding but all companies interviewed cautioned that the majority of ideaswith high impacts and lower risks have already been deployed by the sector. Projects with multiple benefits(including decarbonisation and energy reduction) have a higher chance of success.
Companies reported that a stable and profitable business environment coupled with a steady, consistent andpredictable regulatory environment would encourage further capital investment and innovation in the UK.Companies emphasised that UK climate change and energy regulations, taxes and incentives must enablecompanies to operate competitively relative to other countries in Europe and beyond.
Other key enablers identified by this research included collaboration on and identification of suitable fundingfor the development and demonstration of technologies with the potential to significantly reduce carbon suchas carbon capture and recognition of whole-life impacts of concrete as a building material.
The main barriers to decarbonisation and energy efficiency often relate closely to the enablers as theyprovide different perspectives on the same issue. These include issues relating to business casedevelopment for projects, such as capital and resource availability, a requirement for short payback periodsand production risks. This is compounded by the fact that many UK cement companies have alreadyimplemented significant energy efficiency projects (and, in doing so as a sector, reduced CO2 emissionssignificantly since 1990, for example).
Short term barriers relate to the need for policy to support decarbonisation and energy efficiency in a waythat enables industry to compete in its markets. For example, the Renewable Heat Incentive (RHI) and otherrenewable fuel systems increase biomass costs for the cement sector (the sector is not currently eligible forthe RHI and is reportedly being outcompeted for some biomass fuels by other sectors).
1.5 Analysis of Decarbonisation Potential in the Cement Sector
A ‘pathway’ represents a particular selection and deployment of options from 2012 to 2050 chosen toachieve reductions falling into a specific carbon reduction band relative to a reference trend in which nooptions are deployed. Two further pathways with specific definitions were also created, assessing (i) whatwould happen if no particular additional interventions were taken to accelerate decarbonisation (business asusual, BAU) or (ii) the maximum possible technical potential for decarbonisation in the sector (Max Tech).These pathways include deployment of options comprising (i) incremental improvements to existing
INDUSTRIAL DECARBONISATION AND ENERGY EFFICIENCY ROADMAPS TO 2050 – CEMENT
Section 1 – Executive Summary Page 4 of 94
technology (ii) upgrades to utilise the best available technology and (iii) the application of significant processchanges using technologies that have the potential to become commercially viable in the medium term .
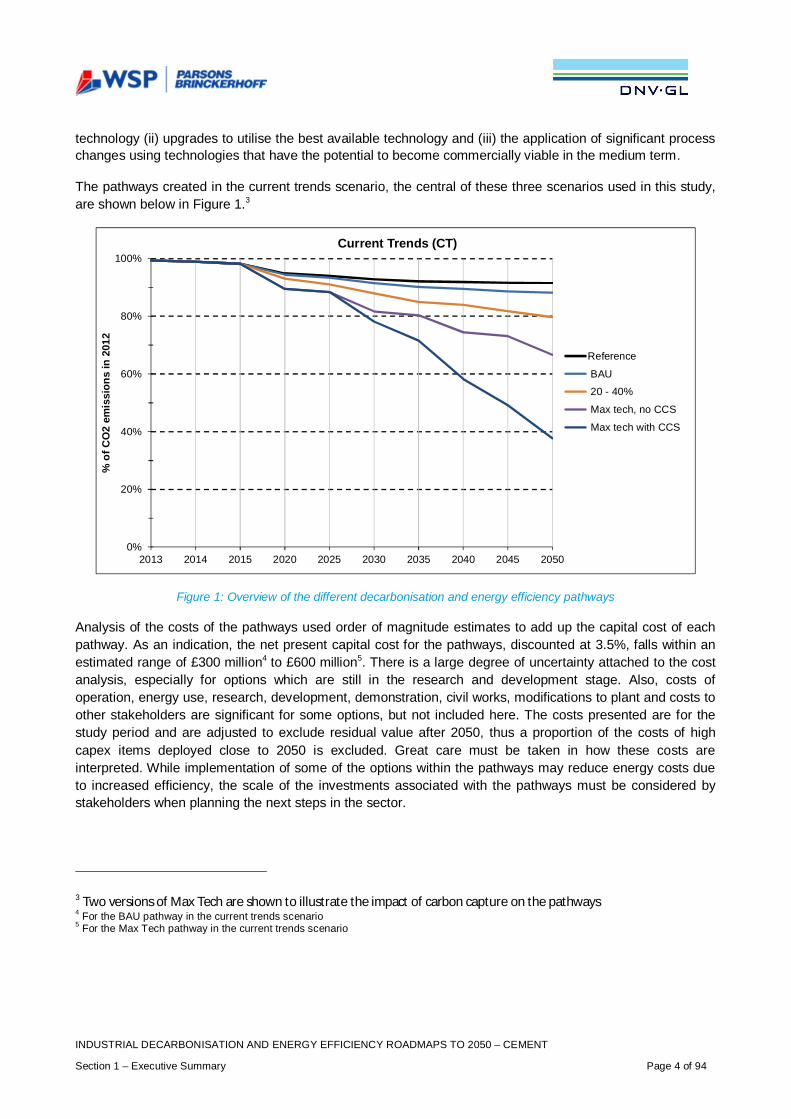
The pathways created in the current trends scenario, the central of these three scenarios used in this study,are shown below in Figure 1.3
Figure 1: Overview of the different decarbonisation and energy efficiency pathways
Analysis of the costs of the pathways used order of magnitude estimates to add up the capital cost of eachpathway. As an indication, the net present capital cost for the pathways, discounted at 3.5%, falls within anestimated range of £300 million4 to £600 million5. There is a large degree of uncertainty attached to the costanalysis, especially for options which are still in the research and development stage. Also, costs ofoperation, energy use, research, development, demonstration, civil works, modifications to plant and costs toother stakeholders are significant for some options, but not included here. The costs presented are for thestudy period and are adjusted to exclude residual value after 2050, thus a proportion of the costs of highcapex items deployed close to 2050 is excluded. Great care must be taken in how these costs areinterpreted. While implementation of some of the options within the pathways may reduce energy costs dueto increased efficiency, the scale of the investments associated with the pathways must be considered bystakeholders when planning the next steps in the sector.
3 Two versions of Max Tech are shown to illustrate the impact of carbon capture on the pathways4 For the BAU pathway in the current trends scenario5 For the Max Tech pathway in the current trends scenario
0%
20%
40%
60%
80%
100%
2013 2014 2015 2020 2025 2030 2035 2040 2045 2050
%of
CO
2em
issi
ons
in20
12
Current Trends (CT)
Reference
BAU
20 - 40%
Max tech, no CCS
Max tech with CCS
INDUSTRIAL DECARBONISATION AND ENERGY EFFICIENCY ROADMAPS TO 2050 – CEMENT
Section 1 – Executive Summary Page 5 of 94
1.6 Conclusions and Key Technology Groups
The following conclusions have been drawn from the evidence and analysis:
Leadership, Organisation and Strategy
Leadership is important at company, sector, regional and UK government level. It links to all of the themesbelow. Leadership is required to drive programmes forward and involves developing solutions in response toevidence and analysis. The cement sector continues to illustrate good practice in relation to strategy, forexample with publication of the 2050 greenhouse gas reduction strategy published by the MPA.
Business Case Barriers
The RD&D and commercial deployment of energy efficiency projects and major technologies requiressignificant upfront capital. Decisions to invest are impacted by a number of technical and economic factorssuch as policy costs and certainty, availability and access to internal finance and an evaluation of technicaland commercial risks and returns. A range of options could be developed to overcome business casebarriers including incentive-based policy and external project finance.
Future Energy Costs, Energy Supply Security, Market Structure and Competition
Some of the key technological options considered by the pathways, such as carbon capture (plus storage oruse), will require significant capital costs and higher energy consumption and thus increase operating costs.This will reduce the overall cost-competitiveness of the sector compared to businesses overseas withoutmeasures to level the international playing field. For example, future action needs to address concerns on allcomponents of the future electricity price relative to other regions.
Industrial Energy Policy Context
There are concerns in the industry that the long-term direction of energy and climate change policies andregulations in the UK may put at risk international competitiveness of the cement industry. Uncertainty(perceived or real) reduces investors’ confidence and reduces the ability of the sector to justify the businesscase for major investments in energy efficiency and decarbonisation technologies. It is reported by the sectorthat the business case for investment needs to be very strong and to include risk identification and effectiverisk mitigation and control measures. Industry would encourage that policy should consider the right balanceof incentives to encourage such investments.
Life-Cycle Accounting
The sector uses raw materials from, and provides its products to, other parts of the economy. There needs tobe further development of the understanding the overall carbon impact of the entire product life-cycle. Forexample, by constructing buildings from concrete, which increases their thermal inertia, there can besignificant long-term carbon benefit through reduced energy use and long-term durability. Recarbonisation ofconcrete (reabsorbing CO2) could form part of this assessment. The sector is active in the communication ofthese messages but the recognition of whole life benefits in construction is very limited. Government andindustry could do more to achieve this market acceptance.
Value Chain Collaboration
The value chain for the cement sector extends from feedstock supply (quarries and alternative feedstocksources) through cement manufacture, concrete production, procurement and specification ofcement/concrete products by customers and their architects / engineers. Transportation of materials throughthe supply chain is an integral element. The carbon emissions of the cement sector are affected by the
INDUSTRIAL DECARBONISATION AND ENERGY EFFICIENCY ROADMAPS TO 2050 – CEMENT
Section 1 – Executive Summary Page 6 of 94
expectations of consumers, the business needs of builders and other industrial users of concrete productstogether with product standards and the requirements of building regulations. Collaboration across the valuechain could enable products with lower lifecycle carbon emissions to be developed and adopted. The cementsector utilises waste materials from the power generation and iron and steel sectors as alternativefeedstocks. Future actions should include maintaining strong dialogue to understand the future strategies inthese sectors, the future availability of these materials with the aim of maximising synergies and benefits.
Research, Development and Demonstration
The research, development and demonstration (RD&D) of new technologies required to deliverdecarbonisation is challenging for companies and government alone, for example due to lack of confidencefrom industry on a stable policy framework and technical challenges. This includes early research activity butalso, crucially, progressing technology to successful commercial demonstration so that it is de-risked forfuture deployment. Technologies should be selected through a collaborative process. It should be noted thatRD&D largely happens at a group global level rather than in the UK businesses, so groups will tend to putthe effort into where the benefits are maximised on a group-wide level – hence government support forRD&D in the UK could potentially bring such projects to the UK rather than elsewhere.
People and Skills
New manpower resources with specialised skills and knowledge in energy and heat engineering areincreasingly needed by the UK cement sector. Currently, key responsibilities of energy teams includeensuring compliance with existing regulation which diverts attention and effort from identification andimplementation of energy efficiency activities.
The key technology groups that, in this investigation, make the largest contributions to sectordecarbonisation or energy efficiency are as follows:
Electricity Grid Decarbonisation
Decarbonisation of electricity imported to cement sites could provide a significant contribution to the overalldecarbonisation of the sector. Actions (mainly by government and utilities) will be required to ensure that thistakes place while maintaining cost-competitiveness. The Government’s reforms of the electricity market arealready driving electricity grid decarbonisation and this report uses assumptions of a future electricitydecarbonisation trajectory that is consistent with Government methodology and modelling.
Fuel and Feedstock Availability (Including Biomass)
The availability of low carbon fuels and feedstocks is a key issue for cement sector decarbonisation, giventhe important role biomass could play. This availability is affected by demand in the cement sector and othersectors and/or with other demand (for example, the use of biomass for electricity generation or in the non-manufacturing sector such as domestic heating). The challenges are to understand where the greatestdecarbonisation potential can be achieved with a limited resource, as well as to maximise the availability ofthe resource (links to life-cycle carbon accounting).
Energy Efficiency and Heat Recovery Technology
There are opportunities to increase heat recovery in the cement sector, both to improve energy efficiencyand to produce electric power. However, the payback periods of such projects are typically above the 2-3year threshold defined by industrial companies in the sector. Alternative financing mechanisms to facilitateinvestment in energy efficiency projects could increase their implementation across the sector.
INDUSTRIAL DECARBONISATION AND ENERGY EFFICIENCY ROADMAPS TO 2050 – CEMENT
Section 1 – Executive Summary Page 7 of 94
Carbon Capture
Individual cement plants are not considered to be of a sufficient scale to justify their own CO2 pipeline andstorage infrastructure. Collaboration both within the sector and externally is necessary to establish thenetworks, along with the availability of sources of funding appropriate to this type of shared infrastructure.The scale of CO2 emissions from each site in the cement sector means that carbon capture and utilisationapplications would need extensive technical breakthrough to be developed into large scale options for use ofCO2 in products with associated value (this is a key area of current and future research where significantdevelopment is needed). A future strategy for the development of a CO2 transportation network should beconsidered with government taking a lead. This would enable industry to understand if and when there islikely to be access to a CO2 pipeline from their site for storage or use and to then plan accordingly.
Next Steps
This roadmap report is intended to provide an evidence-based foundation upon which future policy can beimplemented and actions delivered. The report has been compiled with the aim that is has credibility withindustrial, academic and other stakeholders and is recognised by government as a useful contribution whenconsidering future policy.
INDUSTRIAL DECARBONISATION AND ENERGY EFFICIENCY ROADMAPS TO 2050 – CEMENT
Section 2 - Introduction, Including Methodology Page 8 of 94
2. INTRODUCTION, INCLUDING METHODOLOGY
2.1 Project Aims and Research Questions
2.1.1 Introduction
Changes in the international economy, coupled with the need to decarbonise, mean that UK businesses faceincreased competition as well as new opportunities. The government wants to enable UK businesses tocompete and grow while moving to a low-carbon economy. The UK requires a low-carbon economy butcurrently includes industries that consume significant amounts of energy. These energy-intensive industrieshave an essential role to play in delivering the UK’s transition to a low-carbon economy, as well contributingto economic growth and rebalancing the economy.
Overall, industry is responsible for nearly a quarter of the UK’s total emissions (DECC, 2011)6. By 2050, thegovernment expects industry to have delivered a proportionate share of emissions cuts, achieving reductionsof up to 70% from 2009 levels (DECC, 2011). Nonetheless, the government recognises the risk of ‘carbonleakage’ and is committed to ensuring that energy-intensive industries are able to remain competitive duringthe transition to a low-carbon economy.
The Department of Energy and Climate Change (DECC) and the Department of Business, Innovation andSkills (BIS) have set up a joint project focusing on the eight industrial sectors which use the greatest amountof energy7. The project aims to improve the understanding of technical options available to sectors to reducecarbon emissions and increase energy efficiency while remaining competitive. This includes includeinvestigating the costs involved, the related business environment, and how investment decisions are madein sector firms. This will provide the industry and government with a better understanding of the technical andeconomic abatement potential, set in the relevant business context, with the aim to agree measures thatboth the government and these industries can take to reduce emissions while maintaining sectorcompetitiveness.
The project scope covers both direct emissions from sites within the sector and indirect emissions from theuse of electricity at the sites but generated off site.
The different industrial sectors evaluated in this project are listed in Table 2:
Cement GlassCeramics Iron and SteelChemicals Oil Refining
Food and Drink Pulp and Paper
Table 2: Industrial sectors evaluated in this project
6 It has also been estimated that 70% of industrial energy use is for heat generation (Source: Energy Consumption in the UK 2014:https://www.gov.uk/government/statistics/energy-consumption-in-the-uk)7 The ‘non-metallic minerals’ sector has been divided into three sectors: glass, ceramics and cement.
INDUSTRIAL DECARBONISATION AND ENERGY EFFICIENCY ROADMAPS TO 2050 – CEMENT
Section 2 - Introduction, Including Methodology Page 9 of 94
This report addresses the cement sector.
2.1.2 Aims of the Project
The DECC 2011 Carbon Plan outlined the UK’s plans to reduce greenhouse gas emissions and make thetransition to a low-carbon economy while maintaining energy security and minimising negative economicimpacts. This project aims to improve evidence on decarbonisation and energy efficiency for eight energy-intensive industry sectors, with the cement sector the subject of this report.
The project consortium of Parsons Brinckerhoff and DNV GL was appointed by DECC and BIS in 2013 towork with stakeholders, including Mineral Products Association (MPA), to establish a shared evidence baseto support decarbonisation. The roadmap process consisted of three main phases:
i. Information and evidence gathering on existing technical options and potential breakthroughtechnologies, together with research to identify the social and business enablers and barriers todecarbonisation
ii. Development of sector decarbonisation and energy efficiency pathwaysiii. Conclusions and identify potential next steps
A series of questions were posed by DECC and BIS as part of the project. These ‘principal questions’ guidedthe research undertaken and the conclusions of this report. The questions and the report section in whichthey are addressed are stated below:
1. What are the current emissions from each sector and how is energy used? - section 3.32. For each sector, what is the business environment, what are the business strategies of companies,
and how does it impact on decisions to invest in decarbonisation? - section 3.43. How might the baseline level of energy and emissions in the sectors change over the period to 2050?
- section Emission-Reduction Potential and Pathway Analysis – Principal Question 4 and 54.34. What is the potential to reduce emissions in these sectors beyond the baseline over the period to
2050? - section 4.45. What emissions pathways might each sector follow over the period to 2050 under different scenarios?
- section 4.46. What next steps into the future might be required by industry, the government and others to
overcome the barriers in order to achieve the pathways in each sector? - section 5
2.1.3 What is a Roadmap?
A ‘roadmap’, in the context of this research, is a mechanism to visualise future paths, the relationshipbetween them and the required actions to achieve a certain goal. A technology roadmap is a plan thatmatches short-term and long-term goals with specific technology solutions to help meet those goals.Roadmaps for achieving policy objectives go beyond technology solutions into broader consideration ofstrategic planning, market demands, supplier capabilities, and regulatory and competitive information.
The roadmaps developed by this project investigate decarbonisation in various UK industries, including howmuch carbon abatement potential currently exists, what technologies will need to be implemented in order toextend that potential and how businesses will be affected. The roadmap aims to present existing and newevidence, analysis and conclusions as a ‘consensual blueprint’ to inform subsequent action with respect toissues such as future energy and manufacturing industrial strategy and policy, decarbonisation and energyefficiency business investments, research and development, and skills. The roadmaps consist of three
INDUSTRIAL DECARBONISATION AND ENERGY EFFICIENCY ROADMAPS TO 2050 – CEMENT
Section 2 - Introduction, Including Methodology Page 10 of 94
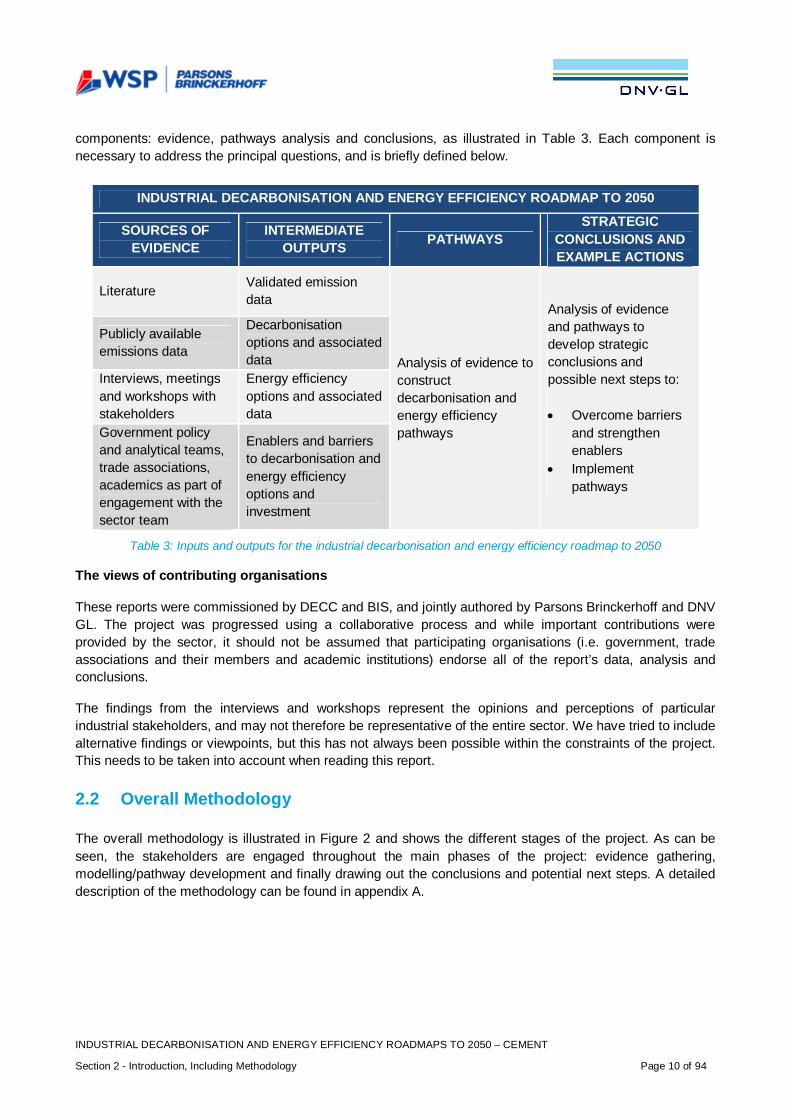
components: evidence, pathways analysis and conclusions, as illustrated in Table 3. Each component isnecessary to address the principal questions, and is briefly defined below.
INDUSTRIAL DECARBONISATION AND ENERGY EFFICIENCY ROADMAP TO 2050
SOURCES OFEVIDENCE
INTERMEDIATEOUTPUTS PATHWAYS
STRATEGICCONCLUSIONS ANDEXAMPLE ACTIONS
LiteratureValidated emissiondata
Analysis of evidence toconstructdecarbonisation andenergy efficiencypathways
Analysis of evidenceand pathways todevelop strategicconclusions andpossible next steps to:
· Overcome barriersand strengthenenablers
· Implementpathways
Publicly availableemissions data
Decarbonisationoptions and associateddata
Interviews, meetingsand workshops withstakeholders
Energy efficiencyoptions and associateddata
Government policyand analytical teams,trade associations,academics as part ofengagement with thesector team
Enablers and barriersto decarbonisation andenergy efficiencyoptions andinvestment
Table 3: Inputs and outputs for the industrial decarbonisation and energy efficiency roadmap to 2050
The views of contributing organisations
These reports were commissioned by DECC and BIS, and jointly authored by Parsons Brinckerhoff and DNVGL. The project was progressed using a collaborative process and while important contributions wereprovided by the sector, it should not be assumed that participating organisations (i.e. government, tradeassociations and their members and academic institutions) endorse all of the report’s data, analysis andconclusions.
The findings from the interviews and workshops represent the opinions and perceptions of particularindustrial stakeholders, and may not therefore be representative of the entire sector. We have tried to includealternative findings or viewpoints, but this has not always been possible within the constraints of the project.This needs to be taken into account when reading this report.
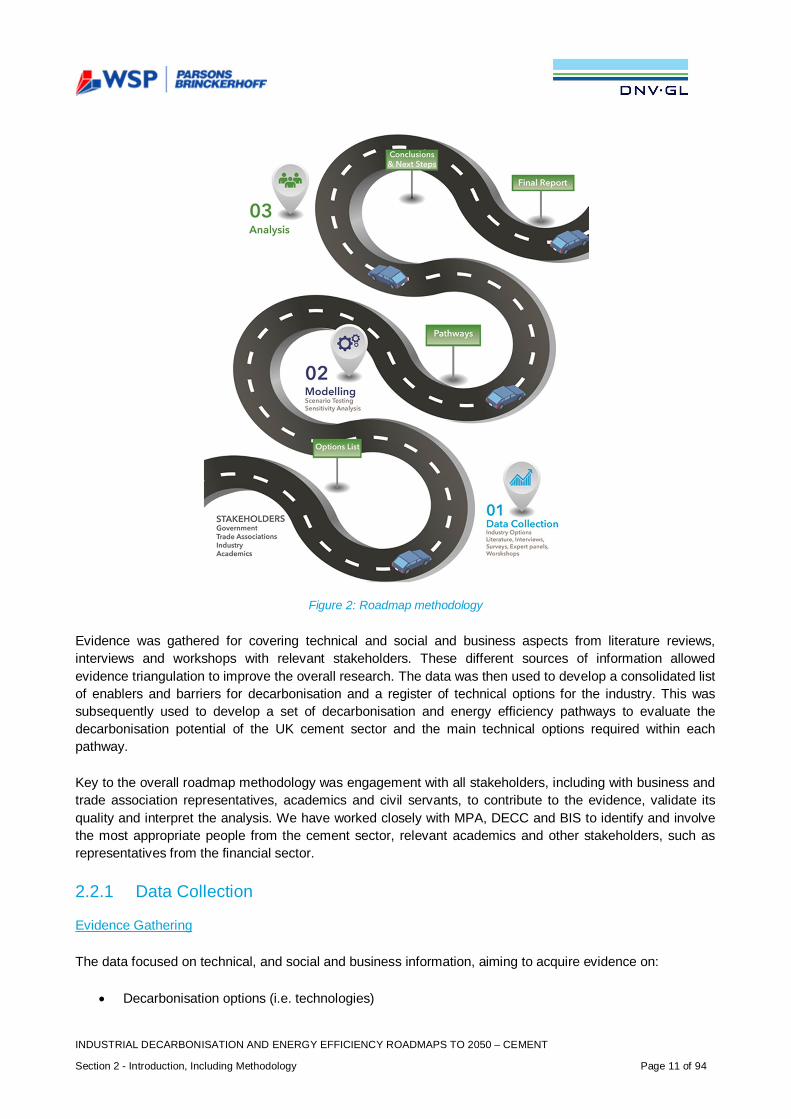
2.2 Overall Methodology
The overall methodology is illustrated in Figure 2 and shows the different stages of the project. As can beseen, the stakeholders are engaged throughout the main phases of the project: evidence gathering,modelling/pathway development and finally drawing out the conclusions and potential next steps. A detaileddescription of the methodology can be found in appendix A.
INDUSTRIAL DECARBONISATION AND ENERGY EFFICIENCY ROADMAPS TO 2050 – CEMENT
Section 2 - Introduction, Including Methodology Page 11 of 94
Figure 2: Roadmap methodology
Evidence was gathered for covering technical and social and business aspects from literature reviews,interviews and workshops with relevant stakeholders. These different sources of information allowedevidence triangulation to improve the overall research. The data was then used to develop a consolidated listof enablers and barriers for decarbonisation and a register of technical options for the industry. This wassubsequently used to develop a set of decarbonisation and energy efficiency pathways to evaluate thedecarbonisation potential of the UK cement sector and the main technical options required within eachpathway.
Key to the overall roadmap methodology was engagement with all stakeholders, including with business andtrade association representatives, academics and civil servants, to contribute to the evidence, validate itsquality and interpret the analysis. We have worked closely with MPA, DECC and BIS to identify and involvethe most appropriate people from the cement sector, relevant academics and other stakeholders, such asrepresentatives from the financial sector.
2.2.1 Data Collection
Evidence Gathering
The data focused on technical, and social and business information, aiming to acquire evidence on:
· Decarbonisation options (i.e. technologies)
INDUSTRIAL DECARBONISATION AND ENERGY EFFICIENCY ROADMAPS TO 2050 – CEMENT
Section 2 - Introduction, Including Methodology Page 12 of 94
· Enablers and barriers to decarbonisation and energy efficiency· Background to the sector· Current state of the sector and possible future changes within the sector· Business environment and markets· Potential next steps
Such evidence was required to either answer the principal questions directly and/or to inform thedevelopment of pathways for 2050. Four methods of research were used in order to gather as muchevidence as possible (and to triangulate the information) within a short timescale. These methods were:
· Literature review: A short, focused review of 39 documents published over the last 10 years. Thedocuments were either related to energy efficiency and decarbonisation of the sector or to energy-intensive industries in general. This was not a thorough literature review or rapid evidenceassessment (REA) but a desktop research exercise deemed sufficient by the project team8 in itsbreadth and depth to capture the evidence required for the purpose of this project. The literaturereview was not intended to be exhaustive and aimed to capture key documentation that applied tothe UK. This included the sector structure, recent history and context including consumption,demand patterns and emissions, the business environment, organisational and decision-makingstructures and the impacts of UK policy and regulation. Further details are provided in appendix A.
· Interviews: In liaison with MPA, DECC and BIS, seven face-to-face and telephone semi-structuredinterviews were carried out with MPA, CEMEX, Lafarge Tarmac, Hanson and Hope ConstructionMaterials. The purpose of the interviews was to gain a deeper understanding of the principalquestions, including how companies make investment decisions, how advanced technologies arefinanced, what a company’s strategic priorities are and where climate change sits within this. Theinterviewees were interviewed using an Interview Protocol template, developed in liaison with DECCand BIS. This template was used to ensure consistency across interviews, fill gaps in the literaturereview, identify key success stories and extract key barriers to investment in low carbon technologies.The interview protocol can be found in appendix A. Interviewees were selected to maximisecoverage across subsectors and emissions and also take into account company headquarterslocation, production processes and company size.
· Workshops: Two workshops were held with attendees identified in consultation with MPA, DECCand BIS. The first workshop focused on reviewing potential technological decarbonisation andenergy efficiency options (that had been provisionally generated from the literature review) anddiscussing adoption rate, applicability, improvement potential, ease of implementation, capex, returnon investment (ROI), savings potential and timeline for the different options. This was done throughtwo breakout sessions: one focused on collecting more data and the other one on timelines underdifferent scenarios. The second activity involved group discussions on enablers and barriers toenergy efficiency and decarbonisation investment, and how to overcome them. The secondworkshop focused on reviewing the draft pathways and identifying potential actions for deliveringthem. The workshop participants included the relevant trade associations, large companies with theaim of achieving representation of key companies and/or subsectors and academics with expertknowledge of the sector, PB and DNV GL consultants, DECC and BIS project managers and seniorcivil servants. The average size of a workshop was 40 people.
8 DECC, BIS and the consultants of PB and DNV GL.
INDUSTRIAL DECARBONISATION AND ENERGY EFFICIENCY ROADMAPS TO 2050 – CEMENT
Section 2 - Introduction, Including Methodology Page 13 of 94
By using a range of information sources, the evidence could be triangulated to improve the overall research.Themes that were identified during the literature review were then used as a focus or a starting point duringthe interviews and workshops. The data from the literature was corroborated by comparing it with informationfrom the interviews and workshops. Likewise, information gaps identified during the interviews andworkshops were, where possible, populated using literature data. In addition, MPA collected data from itsmembers that further helped to fill gaps and triangulate multiple data sources. It should be noted that theevidence-gathering exercise was subject to several limitations based upon the scale of activities that couldbe conducted within the time and resources available. Interview and survey samples were gathered throughpurposive and snowball sampling techniques in collaboration with trade associations, DECC and BIS experts.But due to time, sampling and resource constraints the samples may be limited in terms of their numbersand/or diversity. Where possible we have attempted to triangulate the findings to counter any bias in thesample, but in some areas this has not been possible. Some caution should therefore be used in interpretingthe findings. The literature review, while not intended to be exhaustive, aimed to capture key documentationthat applied to the UK. The criteria for identifying and selecting literature is detailed in appendix A.Interviewees included UK decision makers and technical specialists in the sector.
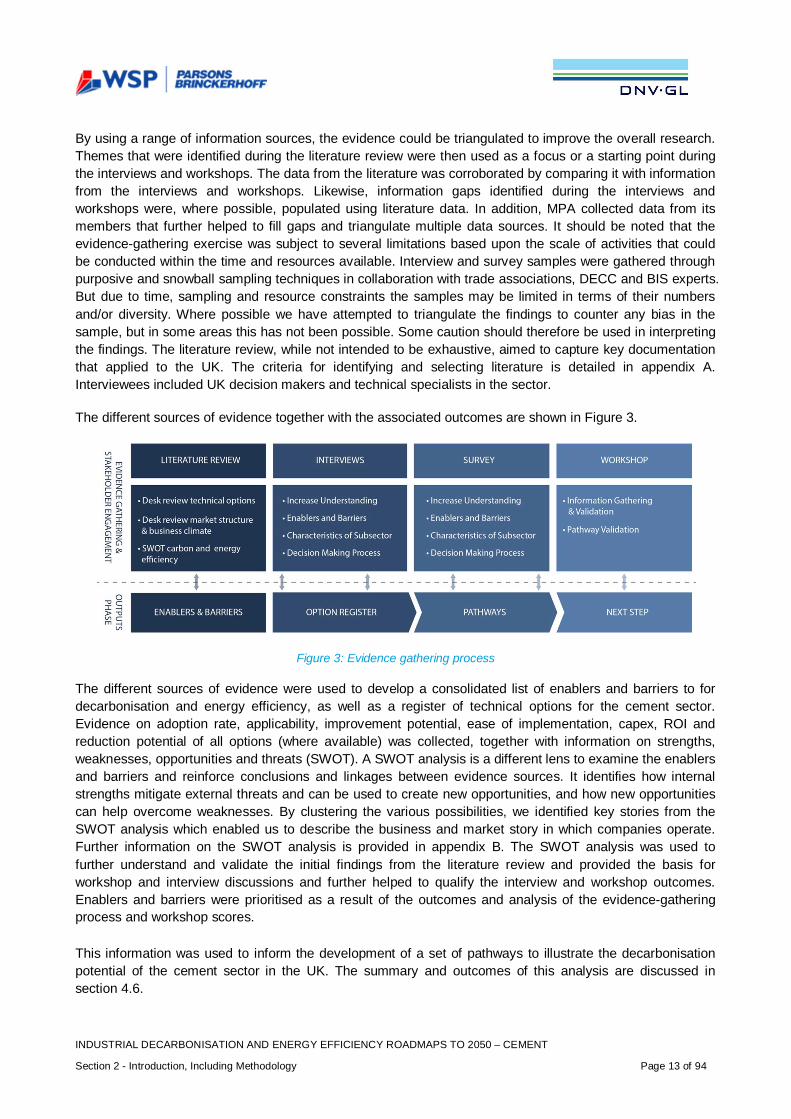
The different sources of evidence together with the associated outcomes are shown in Figure 3.
Figure 3: Evidence gathering process
The different sources of evidence were used to develop a consolidated list of enablers and barriers to fordecarbonisation and energy efficiency, as well as a register of technical options for the cement sector.Evidence on adoption rate, applicability, improvement potential, ease of implementation, capex, ROI andreduction potential of all options (where available) was collected, together with information on strengths,weaknesses, opportunities and threats (SWOT). A SWOT analysis is a different lens to examine the enablersand barriers and reinforce conclusions and linkages between evidence sources. It identifies how internalstrengths mitigate external threats and can be used to create new opportunities, and how new opportunitiescan help overcome weaknesses. By clustering the various possibilities, we identified key stories from theSWOT analysis which enabled us to describe the business and market story in which companies operate.Further information on the SWOT analysis is provided in appendix B. The SWOT analysis was used tofurther understand and validate the initial findings from the literature review and provided the basis forworkshop and interview discussions and further helped to qualify the interview and workshop outcomes.Enablers and barriers were prioritised as a result of the outcomes and analysis of the evidence-gatheringprocess and workshop scores.
This information was used to inform the development of a set of pathways to illustrate the decarbonisationpotential of the cement sector in the UK. The summary and outcomes of this analysis are discussed insection 4.6.
INDUSTRIAL DECARBONISATION AND ENERGY EFFICIENCY ROADMAPS TO 2050 – CEMENT
Section 2 - Introduction, Including Methodology Page 14 of 94
The evidence-gathering process was supported by high levels of engagement with a wide range ofstakeholders including industry members, trade association representatives, academics and staff from DECCand BIS.
The evidence-gathering exercise (see appendix A for details) was subject to inherent limitations based uponthe scale of activities and sample sizes that could be conducted within the time and resources available. Theliterature review was not intended to be exhaustive and aimed to capture key documentation that applied tothe UK. There are only four operational cement manufacturing companies in the UK at present. All of thecompanies agreed to be interviewed, and interviewees included UK decision-makers and technicalspecialists in the sector. These interviews were conducted to provide greater depth and insight to the issuesfaced by companies.
The identification of relevant information and data was approached from a ‘global’ and UK viewpoint. Theglobal outlook examined dominating technologies and process types, global production, CO2 emissions (inthe EU27) and the global outlook to 2050, including the implications for cement producers and consumers.The UK outlook examined the sector structure, recent history and context including consumption, demandpatterns, emissions, the business environment, organisational and decision-making structures and theimpacts of UK policy and regulation.
Evidence Analysis
The first stage in the analysis was to assess the strength of the evidence for the identification of the enablersand barriers. This was based on the source and strength of the evidence, and whether the findings werevalidated by more than one information source. The evidence was also analysed and interpreted using avariety of analytical techniques. SWOT analysis and system analysis were used to conduct the analysis ofthe business environment and the enablers and barriers (section 3.4.5); while concepts from storytelling androot cause analysis were used during the interviews with stakeholders. These different techniques arediscussed in appendix B.
The options register of the technology options for decarbonisation was developed based on the literaturereview, interviews, the evidence gathering workshop and additional information provided by MPA and itsmembers. The strengths, weaknesses, enablers and barriers of each option were taken into account torefine the options register, which was then used to build up the different pathways in the pathway model.
A second stage in the analysis was the classification of technological options and an assessment of theirreadiness.
Limitations of these findings
The scope of the study did not cover a full assessment of the overall innovation chain or of presentlandscape of policies and actors. Direct and indirect impacting policies, gaps in the current policy portfolio,and how future actions would fit into that portfolio (e.g. whether they would supplement or supplant existingpolicies) are not assessed in the report in any detail.
2.2.2 Pathways
The pathways analysis is an illustration of how the cement industry could potentially decarbonise from thebase year 2012 to 2050. Together the set of pathways developed in the study help give a view of the rangeof technology mixes that the sector could deploy over coming decades. Each pathway consists of differenttechnology options that are implemented over time at different levels. Each technology option included a
INDUSTRIAL DECARBONISATION AND ENERGY EFFICIENCY ROADMAPS TO 2050 – CEMENT
Section 2 - Introduction, Including Methodology Page 15 of 94
number of key input parameters including CO2 reduction, cost, fuel use change, applicability, currentadoption (in the base year) and deployment (both rate and extent). A ‘pathway’ represents a particularselection and deployment of options from 20149 to 2050 chosen to achieve reductions falling into a specificdecarbonisation band.
In this project, up to five pathways were developed, three of which were created to explore possible ways todeliver CO2 emissions to different decarbonisation bands by 2050, as shown below:
· 20-40% CO2 reduction pathway relative to the base year· 40-60% CO2 reduction pathway relative to the base year· 60-80% CO2 reduction pathway relative to the base year
Two further pathways - with specific definitions - were also created, assessing (i) what would happen if noadditional interventions were taken to accelerate decarbonisation (business as usual, BAU) or (ii) themaximum possible technical potential for decarbonisation in the sector (Max Tech)10.
The BAU pathway consisted of the continued deployment of technologies that are presently being deployedacross the sector as each plant or site reaches the appropriate point to implement the technology. For thecement industry, two different Max Tech pathways were developed to test different configurations of options.
Pathways were developed in an iterative manual process and not through a mathematical optimisationprocess. This was done to facilitate the exploration of uncertain relationships that would be difficult toexpress analytically. This process started with data collected in the evidence gathering phase regarding thedifferent decarbonisation options, current production levels and the current use of energy or CO2 emissionsof the sector. This data was then enriched through discussion with the sector team and in the first workshop.Logic reasoning (largely driven by option interaction), sector knowledge and technical expertise were appliedwhen selecting technical options for the different pathways. These pathways were discussed by the sectorteam, modelled, and finally tested by the stakeholders participating in the second workshop. This feedbackwas then taken into account and final pathways were developed. All quantitative data and references aredetailed in the options register and relevant worksheets of the model. The pathway model, which is availablefrom DECC and BIS, is summarised in appendix A.
Scenario Testing
The different pathways developed have been tested under different scenarios (i.e. there are three differentscenarios for each pathway). A scenario is a specific set of conditions that could directly or indirectly affectthe ability of the sector to decarbonise. Examples of these are: future decarbonisation of the grid, futuregrowth of the sector, future energy costs and future cost of carbon. Since we do not know what the future willlook like, using scenarios is a way to test the robustness of the different pathways.
For each pathway, the following three scenarios were tested (a detailed description of these scenarios isprovided in appendix A):
9 Model anticipates deployment from 2014 (assuming 2012 and 2013 are too early).10 Definitions are provided in the glossary.
INDUSTRIAL DECARBONISATION AND ENERGY EFFICIENCY ROADMAPS TO 2050 – CEMENT
Section 2 - Introduction, Including Methodology Page 16 of 94
· Current trends: This would represent a future world very similar to our world today with lowcontinuous growth of the industry in the UK.
· Challenging world: This would represent a future world with a more challenging economic climateand where decarbonisation is not a priority and the industry is declining in the UK.
· Collaborative growth: This would represent a future world with a positive economic climate andwhere there is collaboration across the globe to decarbonise and where the industry has a highergrowth rate in the UK.
In order to produce pathways for the same decarbonisation bands under the different scenarios, thedeployment rate of the options varied according to the principals set out in the scenarios. For example, inorder to achieve a specific decarbonisation band in 2050 in the collaborative growth scenario, options weretypically deployed at a faster rate and to a higher degree as compared to the current trends scenario(provided this was considered to be consistent with the conditions set out in the scenarios).
Key Assumptions and Limitations
The pathway model was developed and used to estimate the impact on emissions and costs of alternativetechnology mixes and macro-economic scenarios. Modelled estimates of decarbonisation over the period(2013 to 2050) are presented as percentage reductions in emissions meaning the percentage differencebetween emissions in 2050 and emissions in the base year (2012). CO2 emissions reductions and costs arereported compared to a future in which there was no further take up of decarbonisation options (referred toas the reference trend).
The model inputs and option deployments are based on literature review, interviews and stakeholder input atworkshops and sector meetings. Parsons Brinckerhoff and DNV GL sector leads used these sources toinform judgements for these key parameters. Key input values (e.g. decarbonisation factors for options) areadapted from literature or directly from stakeholder views. If data values were still missing then values wereestimated based on consultant team judgements. Decarbonisation inputs and pathways were reviewed andchallenged at workshops. The uncertainties in this process are large given this level of judgement, however,uncertainties are not quantified. A range of sensitivity analysis was carried out including the development ofalternative versions of the Max Tech pathway and also testing of different availabilities of biomass.Deployment of options at five-year intervals is generally restricted to 25% steps unless otherwise indicated.For example, an option cannot be incrementally deployed by 25% over ten years but has to deploy over fiveyears and flat-line over the other five years.
In this report, when we report carbon dioxide – this represents CO2 equivalent. However, other GHGs werenot the focus of the study which centred on both decarbonisation and improving energy efficiency inprocesses, combustion and indirect emissions from electricity used on site but generated off site. Also,technical options assessed in this work result primarily in CO2 emissions reduction and improved energyefficiency. In general, emissions of other GHGs, relative to those of CO2, are very low.
Assumptions in relation to the Max Tech pathway
Max Tech pathway: A combination of carbon abatement options and energy savings that is both highlyambitious but also reasonably foreseeable. It is designed to investigate what might be technically possiblewhen other barriers are set to one side. Options selected in Max Tech take into account barriers todeployment but are not excluded based on these grounds. Where there is a choice between one option oranother, the easier or cheaper option is chosen or two alternative Max Tech pathways are developed.
The following assumptions apply:
INDUSTRIAL DECARBONISATION AND ENERGY EFFICIENCY ROADMAPS TO 2050 – CEMENT
Section 2 - Introduction, Including Methodology Page 17 of 94
1. Technology Readiness Level (TRL): process or technology at least demonstrated at a pilot scaletoday, even if that is in a different sector.
2. Other disruptive technology options that could make a significant difference but that are not matureenough for inclusion in the pathways are covered in the commentary.
3. Cost is not a constraint: it has been assumed that there are strong and growing financial incentivesto decarbonise which mean that the cost of doing so is not generally a barrier.
4. Option deployment rate: the sector team followed the roadmap method process to develop and testoption deployments in all pathways, including Max Tech. Hence, in each sector, rates at which theoptions can be deployed were considered as ‘highly ambitious but also reasonably foreseeable’.
5. Biomass: maximum penetration of biogenic material as fuel or feedstock assuming unlimitedavailability. Carbon intensity and sensitivities are included in each sector.
6. Carbon Capture (CC): All sectors have made individual (sector) assessments of the maximumpossible potential by 2050 based on what is ‘highly ambitious but also reasonably foreseeable’. Thisassessment included the most suitable CO2 capture technology or technologies for application in thesector, the existing location of the sites relative to each other and anticipated future CC infrastructure,the space constraints on sites, the potential viability of relocation, the scale of the potential CO2
captured and potential viability of both CO2 utilisation and CO2 storage of the captured CO2.7. Electricity Grid: three decarbonisation grid trends were applied through the scenario analysis.
Option Interaction Calculation
The pathway model incorporated two methods of evaluating potential interaction of options. The first methodreflected the assumption that all options interacted maximally and the second method reflected theassumption that the options did not interact. Neither of these cases was likely to be representative of reality;however the actual pathway trends would lie between the two. The two methods therefore provided atheoretical bound on the uncertainty of this type of interaction in results that was introduced by the choice ofa top down modelling approach. Figures calculated based on the assumption of maximum interaction arepresented exclusively in the report unless otherwise stated.
Cumulative Emissions
An important aspect of an emission pathway is the total emission resulting from it. The pathways presentedin this report are not designed or compared on the basis of cumulative emissions over the course to 2050.Only end-targets are assessed e.g., it is possible for a pathway of lower 2050 emission to have largercumulative emissions, and thus a greater impact on the global climate system. The exception to this is in thecost analysis section where total CO2 abated under each pathway – as calculated by the model – is quoted.
Scope of Emissions Considered
Only emissions from production or manufacturing sites were included in scope (from combustion of fuels,process emissions and indirect emissions from imported electricity). Consumed and embedded emissionswere outside the scope of this project.
Complexity of the Model
The model provided a simplified top down representation of the sector to which decarbonisation options wereapplied. It does not include any optimisation algorithm to automatically identify a least cost or optimalpathway.
Material Efficiency
Demand reduction through material efficiency was outside the scope of the quantitative analysis. It isincluded in the conclusions as material efficiency opportunities are considered to be significant in terms of
INDUSTRIAL DECARBONISATION AND ENERGY EFFICIENCY ROADMAPS TO 2050 – CEMENT
Section 2 - Introduction, Including Methodology Page 18 of 94
the long-term reduction of industrial emissions: see for example Allwood et al. (2012) and the ongoing workof the UK INDEMAND Centre.
Base Year (2012)
The Climate Change Act established a legally binding target to reduce the UK’s greenhouse gas (GHG)emissions by at least 80% below base year (1990) levels by 2050. DECC’s 2011 Carbon Plan set out howthe UK will achieve decarbonisation within the framework of the carbon budgets and policy objectives: tomake the transition to a low-carbon economy while maintaining energy security and minimising costs toconsumers. The Carbon Plan proposed that decarbonising the UK economy “could require a reduction inoverall industry emissions of up to 70% by 2050” (against 2009 emissions).
In this project for the analytical work, we have set 2012 as the base year. This is the most recent datasetavailable to the project and was considered to be a suitable date to assess how sectors (as they currentlyare) can reduce emissions to 2050. This separates the illustrative pathways exercise from national targets,which are based on 1990 emissions.
2.2.3 Conclusions and Next Steps
The conclusions and potential next steps are drawn from the outcomes of the pathways modelling, thescenario testing and the potential actions to overcome barriers and enhance enablers that were identifiedtogether with stakeholders. The strategic conclusions can include high-level and/or longer term issues, ormore specific, discrete example actions which can lead to tangible benefits. The potential next steps arepresented in the context of eight strategic conclusions (or themes) and a number of key technology groups.The strategic conclusions or themes are:
· Strategy, leadership and organisation· Business case barriers· Future energy costs, energy supply security, market structure and competition· Industrial energy policy context· Life-cycle accounting· Value chain collaboration· Research, development and demonstration· People and skills
The main technology groups as presented in section 5 are:
· Electricity grid decarbonisation· Fuel and feedstock availability (including cementious substitution and biomass)· Energy efficiency and heat recovery· Clustering· Carbon capture· Sector-specific technologies
INDUSTRIAL DECARBONISATION AND ENERGY EFFICIENCY ROADMAPS TO 2050 – CEMENT
Section 3 - Findings Page 19 of 94
3. FINDINGS
3.1 Key Points
The UK cement industry has reduced absolute CO2 emissions by 55 per cent between 1990 and 2011 (MPA,2013). However, around half of this absolute reduction is a result of declining production, with the remainderresulting from decarbonisation and energy efficiency improvements.
The cement industry argues that increased competition from other countries with lower environmentalregulations and energy costs is making it more challenging for UK cement companies to obtain internalfunding due to a reduction in profits. Investments are going to other countries rather than the UK.
The UK cement sector has developed a decarbonisation roadmap, “MPA cement GHG Strategy: Roadmapto 2050” (MPA, 2013). It sets out a clear vision and qualitative objectives for increased research intodecarbonisation and specific work streams on decarbonisation. This demonstrates that decarbonisation isbecoming a more prominent issue for the sector.
The main enablers for decarbonisation for the cement sector are:
· Financial and Technological feasibility – if technology is proven and financially viable it is more likelyto be deployed.
· Management and organisation – Pipeline of technological innovations to reduce energy and carbonemissions – ideas waiting for investment so the opportunity for energy improvements couldpotentially be implemented relatively quickly if funding is made available.
· Market and Economy - A stable and profitable business environment – this would encourage furthercapital investment and innovation in the UK.
· Legislation – A more stable, consistent and predictable regulatory environment – this would enablebetter long term planning and investment.
· Legislation - A level regulatory playing field – Reform of UK climate change and energy regulations,taxes and incentives to allow UK-based cement producers to be more cost competitive with both EUand global competitors.
· Market and Economy – Better recognition of whole-life impacts of cement and concrete as a buildingmaterial to promote the use of concrete as a sustainable material.
· Innovation – Funding for the development and successful deployment of CCS/U would enable thesector to significantly reduce emissions.
· Innovation – Government funding and investment support for decarbonisation R&D activities andcapex costs.
· Management and organisation – Agreed and achievable, sector-wide targets and carbon-reductionroadmaps.
The main barriers that hamper decarbonisation are:
· Financial – Requirement for short payback periods and high rates of return on energy efficiencyprojects.
· Financial – Lack of access to and competition for capital – internal competition for funds from cementplants outside UK.
· Operational – Longevity of current equipment and investment cycle. High capital costs for new plantsor significant projects.
INDUSTRIAL DECARBONISATION AND ENERGY EFFICIENCY ROADMAPS TO 2050 – CEMENT
Section 3 - Findings Page 20 of 94
· Financial – Risk aversion – companies are wary of being locked in to the ‘wrong’ investment choices(in part due to high technology costs, long investment cycles and concerns over product qualityimpacts).
· Market and Economy/Legislation – Increasing competition of diversion of alternative fuels andbiomasses. Specifically, the Renewable Heat Incentive increases biomass costs for the cementsector as it is not eligible.
· Organisational – Shortage of qualified engineers and specialists skills and knowledge.· Legislation – Uneven EU and global playing field with overseas competition due to differences in
climate change and energy policies and pricing.· Legislation – EU ETS – Risk induced by future uncertainty (unknown future carbon prices, caps,
proportion of allocations, etc.).· Market and Economy – UK demand for cement is below 2007 levels and growth forecasting is
difficult. Also at risk from low cost imports.· Innovation – industry perception that the UK government is not backing CCS R&D as strongly as
other countries.· Innovation – CCS forms integral part of established sector roadmaps, but the technological feasibility
or affordability is still highly uncertain.
Future UK cement production is projected to grow in the short term, as the economy recovers from therecent recession. However, longer term, production is uncertain, and will be linked to the future economicenvironment in the UK, EU and beyond. MPA has provided the following growth projections used in theanalysis. Depending on the scenario, cement production is expected to grow by -0.5%, 0% and +0.5% forthe challenging world, current trends and collaborative growth scenarios, respectively. An initialrepresentative production figure of 10 mtpa is assumed (with emissions based on this production level), toeliminate short-term volatility in cement production resulting from the economic climate of recent years. Thesector’s growth is reliant on trends downstream in the construction sector and the level of competition fromimports. Under current trends, for example, any increase in demand would be met from an increased level ofimports.
The energy savings and decarbonisation opportunities for the cement sector distilled from the literaturereview, interviews and workshops can be classified into nine categories: Kiln Process Technology, ElectricalEfficiency Improvements, Electricity from Waste Heat, cementitious Substitution, Alternative Raw Materials,Fuel Switching, Alternative cements, Carbon Capture and Oxygen Enrichment.
3.2 Cement Processes
Cement is a fine, soft powdery-type substance, mainly used to bind fine sand and coarse aggregatestogether in concrete. Cement is a hydraulic binder, meaning it hardens when water is added which acts as aglue to the concrete mixture. Cement is a key ingredient in both concrete and mortar and is always mixedwith other materials before use:
· Cement mixed with water, sand and gravel forms concrete, which is what the vast majority of cementis used for
· Cement mixed with water, lime and sand forms mortar
From BS EN 197-1, there are 27 types of common cements that can be grouped into five general categories(CEM I Portland cement, CEM II Portland-composite cement, CEM III Blastfurnace cement, CEM IVPozzolanic cement, and CEM V Composite cement) and three strength classes: ordinary, high and veryhigh. The standard for common cements further specifies seven sulfate resisting common cements, threedistinct low early-strength blast furnace cements and two sulfate resisting low early strength blast furnace
INDUSTRIAL DECARBONISATION AND ENERGY EFFICIENCY ROADMAPS TO 2050 – CEMENT
Section 3 - Findings Page 21 of 94
cements. There are also a number of special cements, such as super sulphate-cement, very low-heatcement and calcium aluminate cement (CEMBUREAU, 2013).
Concrete is a mixture of cement, water, aggregates and, in some cases, small quantities of chemicaladmixtures. Aggregates make up approximately 60-75% of the mixture and cement and water make up therest. Aggregates are usually inert coarse materials like gravel, crushed stone, sand or recycled concrete. Thetypes of aggregate and cement selected depend on the application of the concrete. Thanks to the specialbinding properties of cement, concrete is a very resilient, durable material that can bear heavy loads andresist environmental extremes (CEMBUREAU, 2013).
The vast majority of cement is used to make concrete. For this reason, any roadmap must also take intoaccount the final product, i.e. concrete. This is especially relevant because as more new cement types aredeveloped, the amount of cement needed to make concrete could vary.
The cement-making process can be divided into two basic steps:
· Clinker (the main constituent of cement) is first made in a kiln, which heats raw materials such aslimestone (calcium carbonate) with small quantities of other materials (e.g. clay) to 1,450°C. Duringthis process, known as calcination, the calcium carbonate (limestone) is transformed into calciumoxide (lime), which then reacts with the other constituents from the raw material to form newminerals, collectively called clinker. This near-molten material is rapidly cooled to a temperature of100-200°C.
· Clinker is then ground with gypsum and other materials to produce the grey powder known ascement.
A more detailed cement-making process has been described, in order, below and is illustrated in Figure 4.
Quarrying raw materials: Natural occurring calcareous deposits such as limestone, marl or chalk providecalcium carbonate (CaCO3) and are extracted from quarries, often located close to the cement plant. Verysmall amounts of ‘corrective’ materials such as iron ore, bauxite, shale, clay or sand may be needed toprovide extra iron oxide (Fe2O3), alumina (Al2O3) and silica (SiO2) to adapt the chemical composition of theraw mix to the process and product requirements (IEA et al., 2009).
Crushing: The raw material is quarried and transported to the primary and secondary crushers and brokeninto 10cm large pieces (IEA et al., 2009).
Prehomogenization and raw meal grinding: takes place in which different raw materials are mixed tomaintain the required chemical composition, and the crushed pieces are then milled together to produce ‘rawmeal’. To ensure high cement quality, the chemistry of the raw materials and raw meal is very carefullymonitored and controlled (IEA et al., 2009).
Preheating (assuming all plants have pre-heaters): is the next stage in cement production. The preheateris a series of vertical cyclones through which the raw meal is passed, coming into contact with swirling hotkiln exhaust gases moving in the opposite direction. In these cyclones, thermal energy is recovered from thehot flue gases, and the raw meal is preheated before it enters the kiln, so the necessary chemical reactionsoccur faster and more efficiently. Depending on the raw material moisture content, a kiln may have up to sixstages of cyclones with increasing heat recovery with each extra stage (IEA et al., 2009).
Precalcining (assuming all plants have a pre-calciner): Calcination is the decomposition of limestone tolime. Part of the reaction takes place in the ‘precalciner’, a combustion chamber at the bottom of thepreheater above the kiln, and part in the kiln. Here, the chemical decomposition of limestone typically emits60-65% of total CO2 emissions. Fuel combustion generates the rest; typically 65% of fuel is combusted in theprecalciner (IEA et al., 2009).
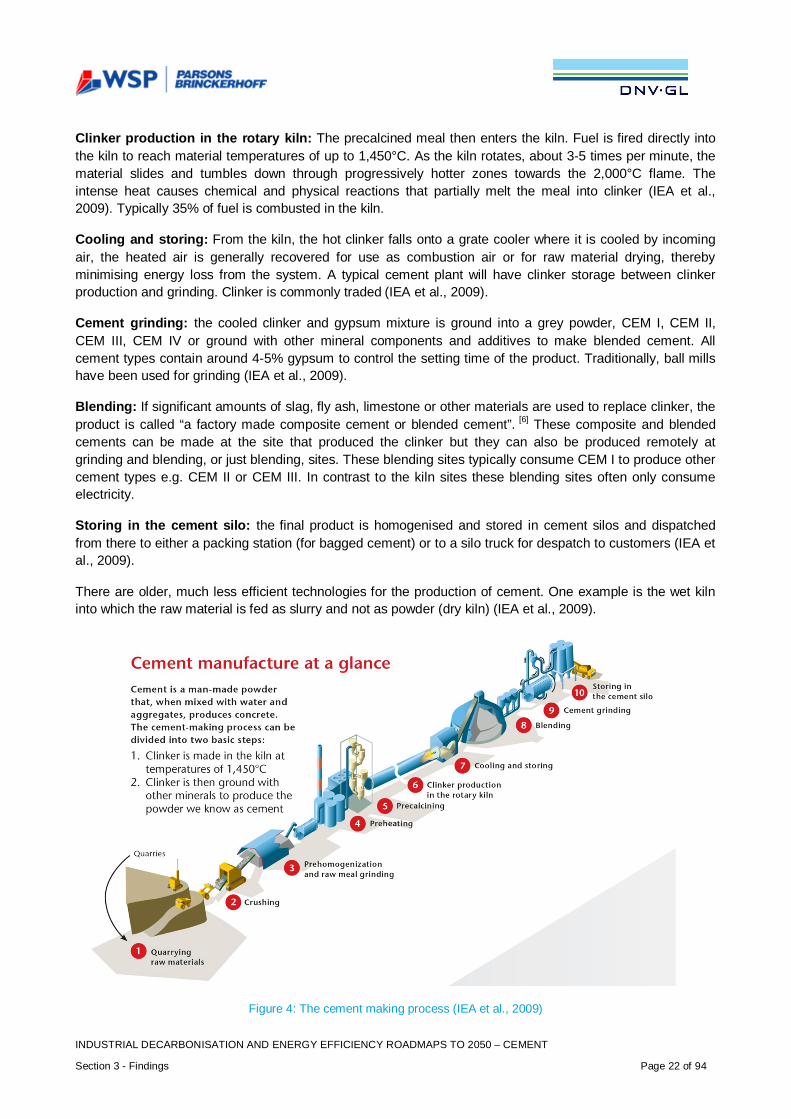
INDUSTRIAL DECARBONISATION AND ENERGY EFFICIENCY ROADMAPS TO 2050 – CEMENT
Section 3 - Findings Page 22 of 94
Clinker production in the rotary kiln: The precalcined meal then enters the kiln. Fuel is fired directly intothe kiln to reach material temperatures of up to 1,450°C. As the kiln rotates, about 3-5 times per minute, thematerial slides and tumbles down through progressively hotter zones towards the 2,000°C flame. Theintense heat causes chemical and physical reactions that partially melt the meal into clinker (IEA et al.,2009). Typically 35% of fuel is combusted in the kiln.
Cooling and storing: From the kiln, the hot clinker falls onto a grate cooler where it is cooled by incomingair, the heated air is generally recovered for use as combustion air or for raw material drying, therebyminimising energy loss from the system. A typical cement plant will have clinker storage between clinkerproduction and grinding. Clinker is commonly traded (IEA et al., 2009).
Cement grinding: the cooled clinker and gypsum mixture is ground into a grey powder, CEM I, CEM II,CEM III, CEM IV or ground with other mineral components and additives to make blended cement. Allcement types contain around 4-5% gypsum to control the setting time of the product. Traditionally, ball millshave been used for grinding (IEA et al., 2009).
Blending: If significant amounts of slag, fly ash, limestone or other materials are used to replace clinker, theproduct is called “a factory made composite cement or blended cement”. [6] These composite and blendedcements can be made at the site that produced the clinker but they can also be produced remotely atgrinding and blending, or just blending, sites. These blending sites typically consume CEM I to produce othercement types e.g. CEM II or CEM III. In contrast to the kiln sites these blending sites often only consumeelectricity.
Storing in the cement silo: the final product is homogenised and stored in cement silos and dispatchedfrom there to either a packing station (for bagged cement) or to a silo truck for despatch to customers (IEA etal., 2009).
There are older, much less efficient technologies for the production of cement. One example is the wet kilninto which the raw material is fed as slurry and not as powder (dry kiln) (IEA et al., 2009).
Figure 4: The cement making process (IEA et al., 2009)
INDUSTRIAL DECARBONISATION AND ENERGY EFFICIENCY ROADMAPS TO 2050 – CEMENT
Section 3 - Findings Page 23 of 94
3.3 Current Emissions and Energy Use - Principal Question 1
This section covers the findings in response to principal question 1: ‘What are the current emissions fromeach sector and how is energy used?’ It focuses on technologies that are currently used in the sector, theemissions associated with the activities, the heat and power demand of cement plants and the fuels that areused to deliver this energy and the lifespan of equipment and key timings for replacement or rebuild.
3.3.1 Evolution of emission reductions
In 2011, the EU (EU27 and Turkey) cement Industry accounted for 7.6% of total global cement production.China was responsible for 57.3% and India for 6.2% (CEMBUREAU, 2013). European companies use by farthe highest quantity of alternative fuels in cement production, with 8.7% of these fuels originating frombiomass waste and 25.6% from other waste in 2011 – this tendency is increasing steadily (CEMBUREAU,2013). In 2011, the European cement Industry used over 7 million tonnes of alternative fuels, a six foldincrease compared to 1990 – this translates into a reduction the equivalent of 17 million tonnes of CO2
(CEMBUREAU, 2013). Over the past 20 years, the European cement industry has reduced CO2 emissionsper tonne of cement from 719 kg in 1990 to 660 kg in 2010, translating into a reduction of 40 million tonnesof absolute European CO2 emissions from 1990 levels (CEMBUREAU, 2013). Three of the five world’slargest global cement producers are headquartered in the EU28 (CEMBUREAU, 2013). It has beenestimated that by 2050, alternative fuels will provide 60% of kiln energy, including 40% biomass in the sector(CEMBUREAU, 2013).
3.3.2 Emissions
In 2009 the global cement sector published a 2050 Technology Roadmap under the auspices of theinternational Energy Agency (IEA) and the World Business Council for Sustainable development (WBCSD)cement Sustainability Initiative (CSI). As the first global sector to outline its contribution to GHG abatementand mitigation the CSI Roadmap paved the way for technological development in the sector (MPA, 2013).
On a global scale, in 2012, 638 kg of CO2 were produced per tonne of cementitious product11. Compared to761 kg of CO2 per tonne of cementitious being produced in 1990, this represents a reduction of 16% - asshown in Figure 5 (CSI, 2012).
For the UK the CO2 emissions in 2013 from cement production totalled 6.0 million tonnes of CO2 for aproduction of 11.6 million tonnes of cement. Direct emissions originate largely from fossil fuel combustionand raw material degradation in the kiln (process emissions), and indirect emissions from electricity from thegrid, with the kiln accounting for about three quarters of all energy use in a typical UK cement plant. Thepredominant fuels used include coal and petroleum coke. Fossil fuels accounted for 60% of combustion fueluse in 2012, down from 94% in 1998 (MPA, 2013). As such, the cement sector has already takenconsiderable early action in decarbonising its fuel demand by switching to waste derived and biomass fuels.
11 Comprise the glue that holds concrete together. These materials include traditional Portland cement, fly ash, ground granulatedblastfurnace slage (GGBS), limestone fines and silica fume.
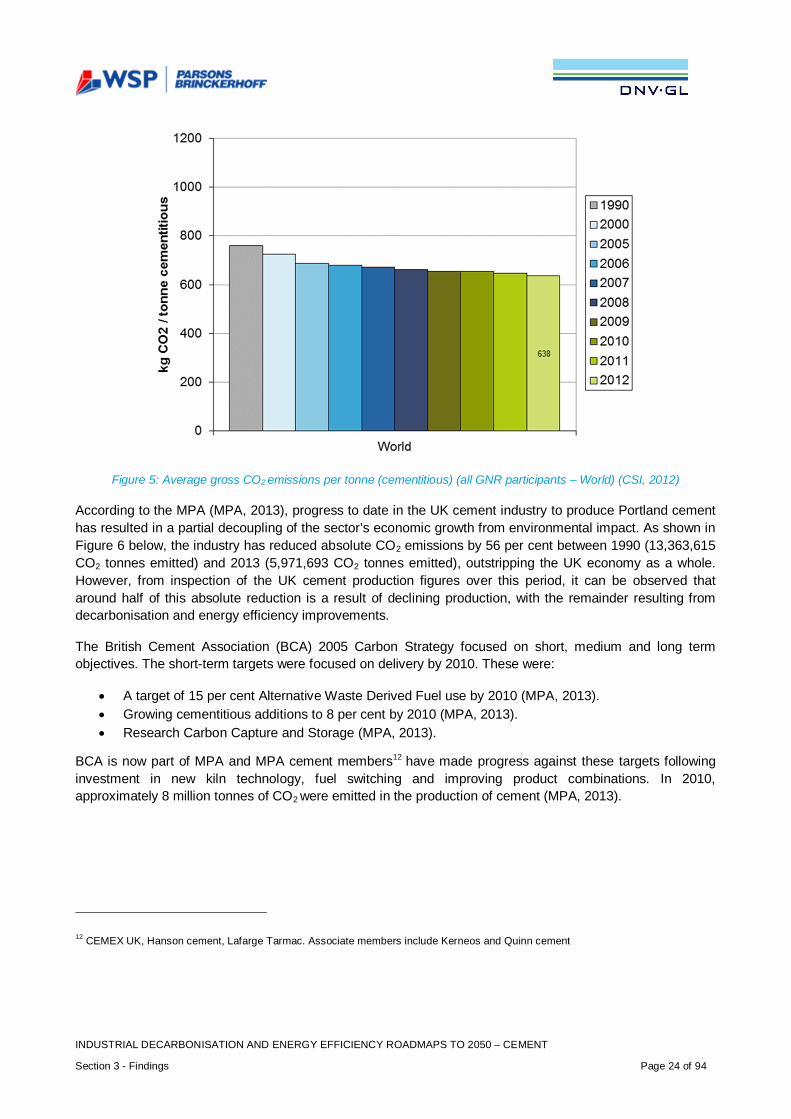
INDUSTRIAL DECARBONISATION AND ENERGY EFFICIENCY ROADMAPS TO 2050 – CEMENT
Section 3 - Findings Page 24 of 94
Figure 5: Average gross CO2 emissions per tonne (cementitious) (all GNR participants – World) (CSI, 2012)
According to the MPA (MPA, 2013), progress to date in the UK cement industry to produce Portland cementhas resulted in a partial decoupling of the sector’s economic growth from environmental impact. As shown inFigure 6 below, the industry has reduced absolute CO2 emissions by 56 per cent between 1990 (13,363,615CO2 tonnes emitted) and 2013 (5,971,693 CO2 tonnes emitted), outstripping the UK economy as a whole.However, from inspection of the UK cement production figures over this period, it can be observed thataround half of this absolute reduction is a result of declining production, with the remainder resulting fromdecarbonisation and energy efficiency improvements.
The British Cement Association (BCA) 2005 Carbon Strategy focused on short, medium and long termobjectives. The short-term targets were focused on delivery by 2010. These were:
· A target of 15 per cent Alternative Waste Derived Fuel use by 2010 (MPA, 2013).· Growing cementitious additions to 8 per cent by 2010 (MPA, 2013).· Research Carbon Capture and Storage (MPA, 2013).
BCA is now part of MPA and MPA cement members12 have made progress against these targets followinginvestment in new kiln technology, fuel switching and improving product combinations. In 2010,approximately 8 million tonnes of CO2 were emitted in the production of cement (MPA, 2013).
12 CEMEX UK, Hanson cement, Lafarge Tarmac. Associate members include Kerneos and Quinn cement
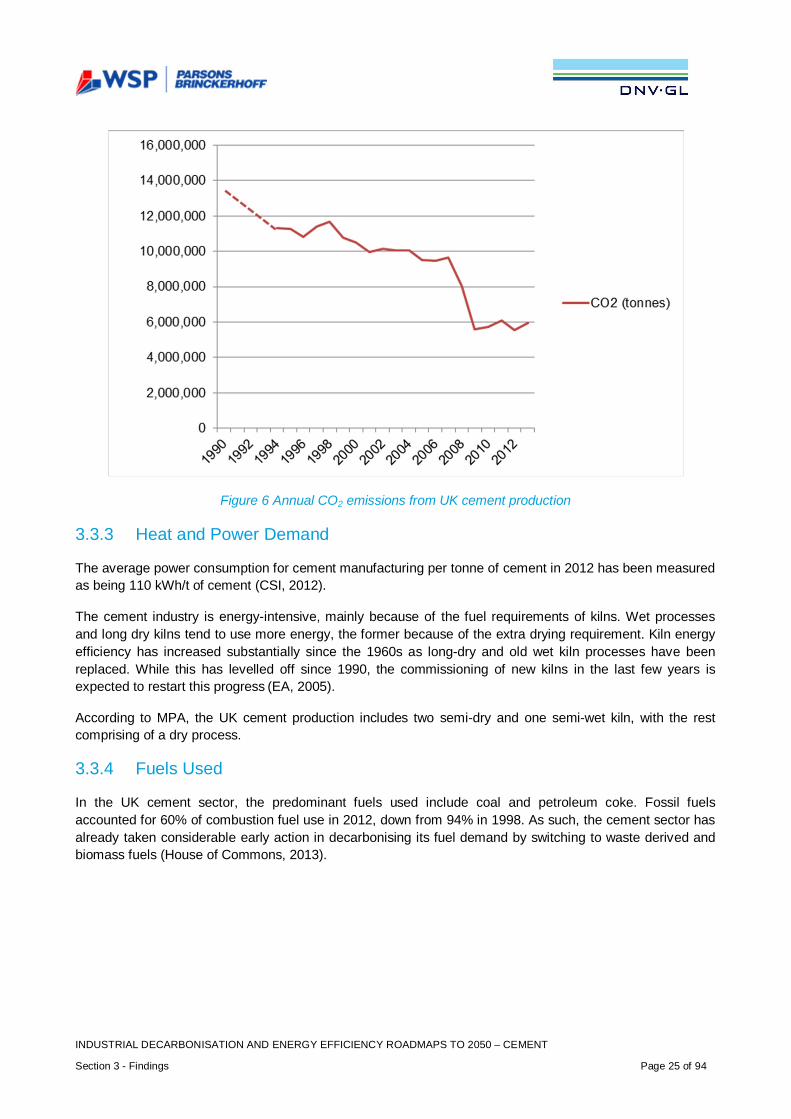
INDUSTRIAL DECARBONISATION AND ENERGY EFFICIENCY ROADMAPS TO 2050 – CEMENT
Section 3 - Findings Page 25 of 94
Figure 6 Annual CO2 emissions from UK cement production
3.3.3 Heat and Power Demand
The average power consumption for cement manufacturing per tonne of cement in 2012 has been measuredas being 110 kWh/t of cement (CSI, 2012).
The cement industry is energy-intensive, mainly because of the fuel requirements of kilns. Wet processesand long dry kilns tend to use more energy, the former because of the extra drying requirement. Kiln energyefficiency has increased substantially since the 1960s as long-dry and old wet kiln processes have beenreplaced. While this has levelled off since 1990, the commissioning of new kilns in the last few years isexpected to restart this progress (EA, 2005).
According to MPA, the UK cement production includes two semi-dry and one semi-wet kiln, with the restcomprising of a dry process.
3.3.4 Fuels Used
In the UK cement sector, the predominant fuels used include coal and petroleum coke. Fossil fuelsaccounted for 60% of combustion fuel use in 2012, down from 94% in 1998. As such, the cement sector hasalready taken considerable early action in decarbonising its fuel demand by switching to waste derived andbiomass fuels (House of Commons, 2013).
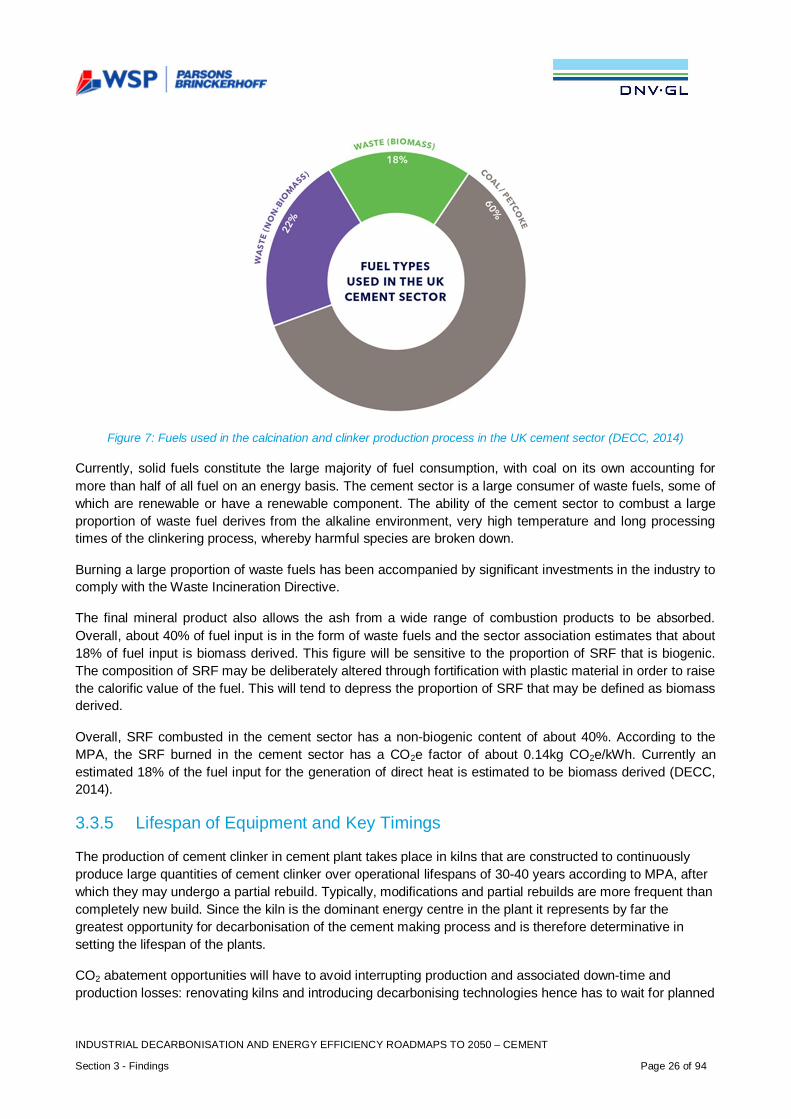
INDUSTRIAL DECARBONISATION AND ENERGY EFFICIENCY ROADMAPS TO 2050 – CEMENT
Section 3 - Findings Page 26 of 94
Figure 7: Fuels used in the calcination and clinker production process in the UK cement sector (DECC, 2014)
Currently, solid fuels constitute the large majority of fuel consumption, with coal on its own accounting formore than half of all fuel on an energy basis. The cement sector is a large consumer of waste fuels, some ofwhich are renewable or have a renewable component. The ability of the cement sector to combust a largeproportion of waste fuel derives from the alkaline environment, very high temperature and long processingtimes of the clinkering process, whereby harmful species are broken down.
Burning a large proportion of waste fuels has been accompanied by significant investments in the industry tocomply with the Waste Incineration Directive.
The final mineral product also allows the ash from a wide range of combustion products to be absorbed.Overall, about 40% of fuel input is in the form of waste fuels and the sector association estimates that about18% of fuel input is biomass derived. This figure will be sensitive to the proportion of SRF that is biogenic.The composition of SRF may be deliberately altered through fortification with plastic material in order to raisethe calorific value of the fuel. This will tend to depress the proportion of SRF that may be defined as biomassderived.
Overall, SRF combusted in the cement sector has a non-biogenic content of about 40%. According to theMPA, the SRF burned in the cement sector has a CO2e factor of about 0.14kg CO2e/kWh. Currently anestimated 18% of the fuel input for the generation of direct heat is estimated to be biomass derived (DECC,2014).
3.3.5 Lifespan of Equipment and Key Timings
The production of cement clinker in cement plant takes place in kilns that are constructed to continuouslyproduce large quantities of cement clinker over operational lifespans of 30-40 years according to MPA, afterwhich they may undergo a partial rebuild. Typically, modifications and partial rebuilds are more frequent thancompletely new build. Since the kiln is the dominant energy centre in the plant it represents by far thegreatest opportunity for decarbonisation of the cement making process and is therefore determinative insetting the lifespan of the plants.
CO2 abatement opportunities will have to avoid interrupting production and associated down-time andproduction losses: renovating kilns and introducing decarbonising technologies hence has to wait for planned
INDUSTRIAL DECARBONISATION AND ENERGY EFFICIENCY ROADMAPS TO 2050 – CEMENT
Section 3 - Findings Page 27 of 94
kiln replacement. The implementation of opportunities requiring retrofit will either have to wait until plannedshut-down periods or during unplanned down-time and lost production.
In conclusion, cement plants operate continuously and have long life cycles of at least 30 years and oftenconsiderably longer. Not all decarbonisation measures need to be delayed until major rebuild but can beimplemented on operating sites, but opportunities to finance large-scale disruptive technologies are atspecific times, with 1 or 2 opportunities per site prior to 2050. The specific refurbishment dates for each kilnhave not been identified because this information is commercially confidential; however, these dates areplanned well in advance by the companies, so they can make plans to implement major decarbonisationopportunities at these times.
3.4 Business Environment - Principal Question 2
This section provides an assessment of the range of questions under principal question 2: ‘For each sector,what is the business environment, what are the business strategies of companies, and how do these havean impact on decisions to invest in decarbonisation?’
3.4.1 Market Structure
The UK cement industry is a mature market, with high capital intensity requirements. It is a highlyconcentrated (i.e. small number of manufacturing sites) and regulated industry. It is dependent on trends indownstream construction and public sectors in particular. Total turnover for the manufacture of cement in theUK was £426 million in 2012 (Office for National Statistics, 2014). Market share data is only available from2012 which at that time showed that Lafarge had 37% of the market share, CEMEX 21%, Hanson 19%, andTarmac 10%. Lafarge and Tarmac subsequently formed a joint venture company Lafarge Tarmac, but as aresult the company was required to divest part of its cement and concrete business to form a new, separatecompetitor called Hope Construction Materials who are the smallest of the four cement companies currentlymanufacturing in the UK (Global Cement, 2013).
Domestic cement production tonnage was 8.6m in 2013 which represents a 3% increase on 2012 (7.95m)(MPA, 2014). However, while demand is currently forecast to increase, market demand remains volatilesince the 2007 financial crash and the UK cement sector has experienced significant consolidation sincethen. UK domestic cement demand is still approximately 30% lower than it was in 2007 (11.9m tonnes)(MPA, 2014). However, despite the reduction of UK production, imports have risen steadily over the last tenyears and now represent approximately 12-14% of all cement purchased in the UK (MPA, 2014).
Key drivers for growth include demand from building and construction. The public sector and governmenthave a large market influence over the cement sector as one of the key drivers of construction of homes,public buildings and infrastructure. Cement (concrete) structures can last over 100 years and concrete iswidely reused at end of life as a raw aggregate material, although it is infrequently recycled into new cementaccording to UK cement companies who stated that the logistical, financial and energy implications ofcollecting and transporting old concrete back to cement factories does not usually make this option viable.
Production figures from the MPA, shown in Table 4: Sector production growth data (MPA, 2014)
Table 4 and Figure 8 below, were provided showing production for recent years and the MPA’s annualgrowth forecast. As all companies in every industrial sector are subject to competition law the industry issubject to particularly tight competition rules, the discussion of revenues, prices and projected revenues is ahighly sensitive subject. Therefore the MPA and companies speak in terms of production volumes. However,the most recent ONS data on cement sector revenues indicated sector revenues of £431m in 2012, downfrom £623m in 2008 and £753m in 2010 (Office for National Statistics, 2014).The MPA cautions that it doesnot have full confidence in these figures - although it does provide an approximate outlook.
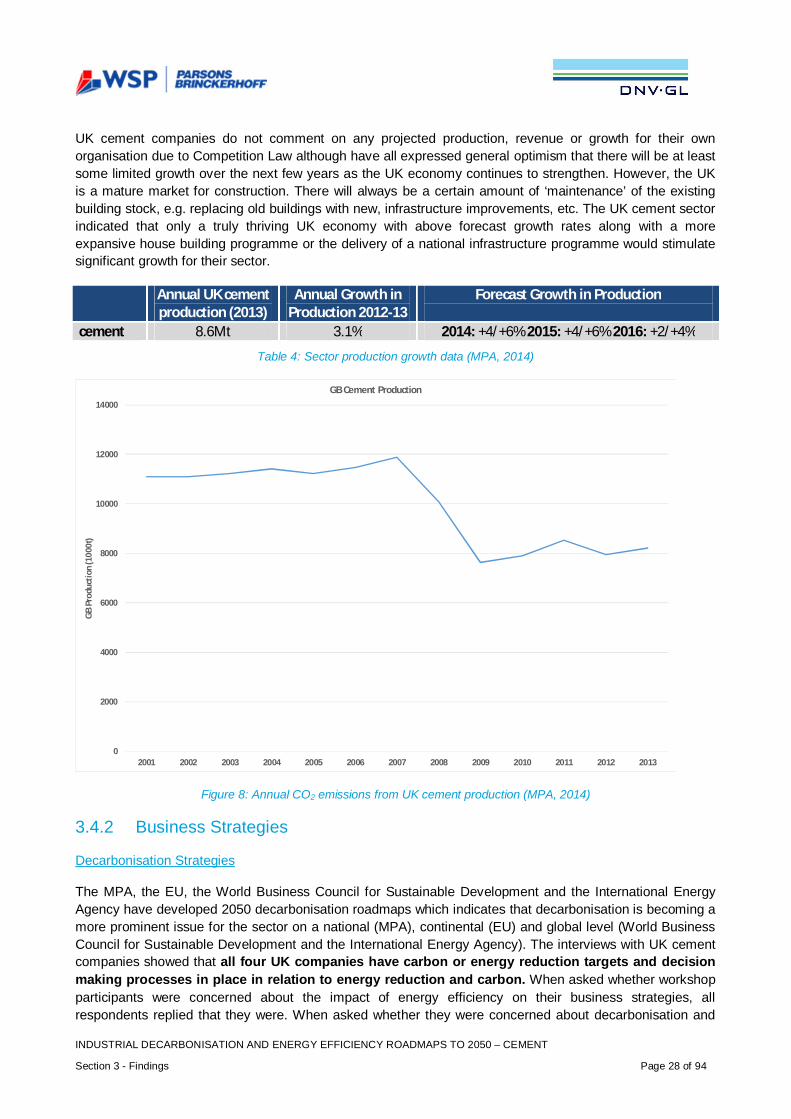
INDUSTRIAL DECARBONISATION AND ENERGY EFFICIENCY ROADMAPS TO 2050 – CEMENT
Section 3 - Findings Page 28 of 94
UK cement companies do not comment on any projected production, revenue or growth for their ownorganisation due to Competition Law although have all expressed general optimism that there will be at leastsome limited growth over the next few years as the UK economy continues to strengthen. However, the UKis a mature market for construction. There will always be a certain amount of ‘maintenance’ of the existingbuilding stock, e.g. replacing old buildings with new, infrastructure improvements, etc. The UK cement sectorindicated that only a truly thriving UK economy with above forecast growth rates along with a moreexpansive house building programme or the delivery of a national infrastructure programme would stimulatesignificant growth for their sector.
Annual UK cementproduction (2013)
Annual Growth inProduction 2012-13
Forecast Growth in Production
cement 8.6Mt 3.1% 2014: +4/+6% 2015: +4/+6% 2016: +2/+4%
Table 4: Sector production growth data (MPA, 2014)
Figure 8: Annual CO2 emissions from UK cement production (MPA, 2014)
3.4.2 Business Strategies
Decarbonisation Strategies
The MPA, the EU, the World Business Council for Sustainable Development and the International EnergyAgency have developed 2050 decarbonisation roadmaps which indicates that decarbonisation is becoming amore prominent issue for the sector on a national (MPA), continental (EU) and global level (World BusinessCouncil for Sustainable Development and the International Energy Agency). The interviews with UK cementcompanies showed that all four UK companies have carbon or energy reduction targets and decisionmaking processes in place in relation to energy reduction and carbon. When asked whether workshopparticipants were concerned about the impact of energy efficiency on their business strategies, allrespondents replied that they were. When asked whether they were concerned about decarbonisation and
0
2000
4000
6000
8000
10000
12000
14000
2001 2002 2003 2004 2005 2006 2007 2008 2009 2010 2011 2012 2013
GB
Prod
ucti
on(1
000t
)
GB Cement Production
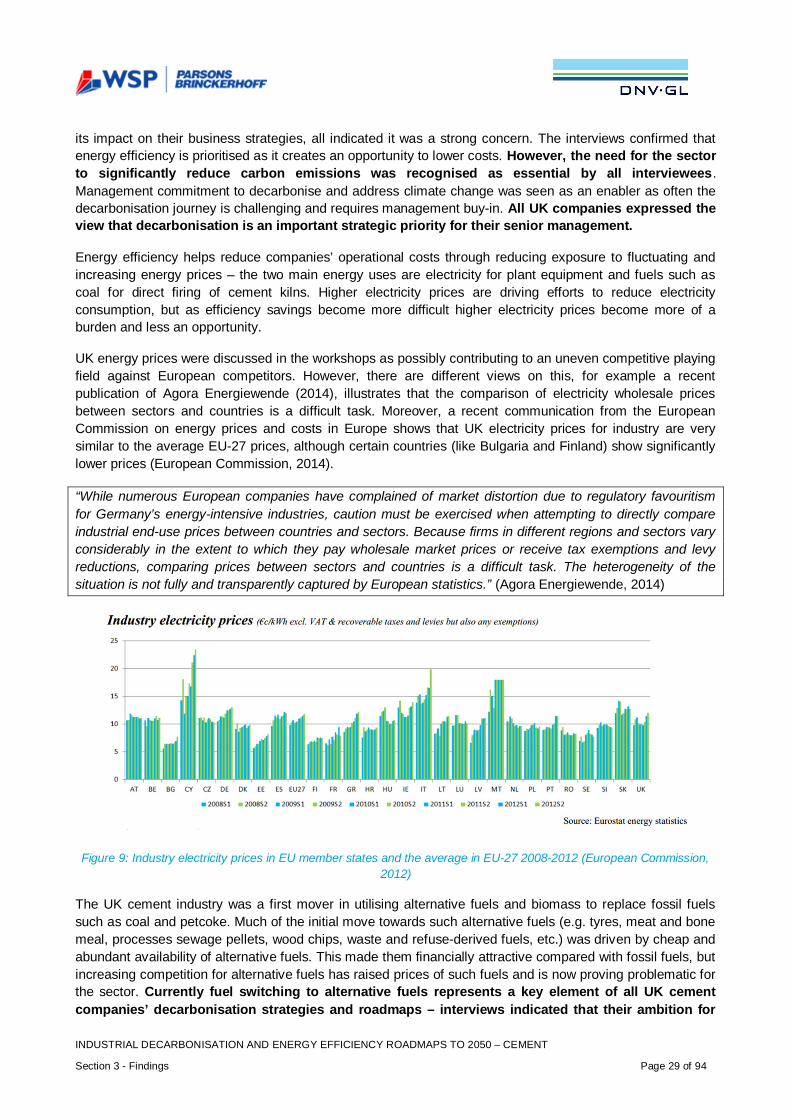
INDUSTRIAL DECARBONISATION AND ENERGY EFFICIENCY ROADMAPS TO 2050 – CEMENT
Section 3 - Findings Page 29 of 94
its impact on their business strategies, all indicated it was a strong concern. The interviews confirmed thatenergy efficiency is prioritised as it creates an opportunity to lower costs. However, the need for the sectorto significantly reduce carbon emissions was recognised as essential by all interviewees.Management commitment to decarbonise and address climate change was seen as an enabler as often thedecarbonisation journey is challenging and requires management buy-in. All UK companies expressed theview that decarbonisation is an important strategic priority for their senior management.
Energy efficiency helps reduce companies’ operational costs through reducing exposure to fluctuating andincreasing energy prices – the two main energy uses are electricity for plant equipment and fuels such ascoal for direct firing of cement kilns. Higher electricity prices are driving efforts to reduce electricityconsumption, but as efficiency savings become more difficult higher electricity prices become more of aburden and less an opportunity.
UK energy prices were discussed in the workshops as possibly contributing to an uneven competitive playingfield against European competitors. However, there are different views on this, for example a recentpublication of Agora Energiewende (2014), illustrates that the comparison of electricity wholesale pricesbetween sectors and countries is a difficult task. Moreover, a recent communication from the EuropeanCommission on energy prices and costs in Europe shows that UK electricity prices for industry are verysimilar to the average EU-27 prices, although certain countries (like Bulgaria and Finland) show significantlylower prices (European Commission, 2014).
“While numerous European companies have complained of market distortion due to regulatory favouritismfor Germany’s energy-intensive industries, caution must be exercised when attempting to directly compareindustrial end-use prices between countries and sectors. Because firms in different regions and sectors varyconsiderably in the extent to which they pay wholesale market prices or receive tax exemptions and levyreductions, comparing prices between sectors and countries is a difficult task. The heterogeneity of thesituation is not fully and transparently captured by European statistics.” (Agora Energiewende, 2014)
Figure 9: Industry electricity prices in EU member states and the average in EU-27 2008-2012 (European Commission,2012)
The UK cement industry was a first mover in utilising alternative fuels and biomass to replace fossil fuelssuch as coal and petcoke. Much of the initial move towards such alternative fuels (e.g. tyres, meat and bonemeal, processes sewage pellets, wood chips, waste and refuse-derived fuels, etc.) was driven by cheap andabundant availability of alternative fuels. This made them financially attractive compared with fossil fuels, butincreasing competition for alternative fuels has raised prices of such fuels and is now proving problematic forthe sector. Currently fuel switching to alternative fuels represents a key element of all UK cementcompanies’ decarbonisation strategies and roadmaps – interviews indicated that their ambition for
INDUSTRIAL DECARBONISATION AND ENERGY EFFICIENCY ROADMAPS TO 2050 – CEMENT
Section 3 - Findings Page 30 of 94
switching to alternative fuels ranges from 60-80% of total raw fuel use at all cement plants. Switchingbeyond 80% is not seen as technically feasible in most existing plants due to the need for consistent heatpatterns to ensure product quality.
Increasing demand for sustainable building materials resulting from voluntary agreements, regulations, andfor public housing is also increasing the importance of decarbonisation to cement manufacturers althoughsome companies expressed concern that the government is not promoting sustainable building standardsand certifications strongly enough. One example cited was the recent scrapping of the Code for SustainableHomes.
Cement companies are interested in decarbonisation from the lifecycle perspective and are promoting thethermal properties of concrete that can significantly reduce energy use throughout the lifetime of a building.Cement companies also stressed that the re-carbonisation properties of cement and concrete during theirlifetime, and particularly when broken down and reused, are not being appropriately recognised or accountedfor at present. Cement companies have a further interest in the issue of climate change as the sectorconsiders its product to be vital in the construction of UK low-carbon infrastructure such as nuclear and windpower installations as well as being important for climate change adaptation measures such as flood andcoastal defences.
All of the companies interviewed had climate change strategies in place. All interviewees also haddecarbonisation targets in place at group level and site level energy efficiency targets or KPIs thatare closely monitored. Energy efficiency is not a new issue for them it was reported that cement companieshave been investing in energy efficiency and are reaching a ‘peak’ of what is achievable in terms ofefficiency. While there are opportunities to invest in options like biomass fuel where availability, policy andeconomics allow, further equipment investments are only likely to yield incremental energy savings anddecarbonisation. This is because companies feel they have already implemented the majority of innovationsthat are considered to actually make a significant difference or are affordable by offering a suitable ROI.
Building new plants and kilns is seen as the critical point at which any major step changes can occur. Thecurrent generation of kilns, however, is relatively new with most being built or modified within the last 15years as the sector switched from wet process kilns to significantly more energy efficient dry kilns. Plants andkilns have a typical lifespan of 30 to 50 years so it is likely there will be only one more generation of kilnsbetween now and 2050. While all companies indicated that it was standard practice to incorporate the mostefficient, cutting-edge technology available when a new plant is built, they had reservations that there wereany new significant carbon-reducing technological solutions on the horizon other than CCS/CCU. As a resultthe focus of UK cement companies in recent years and at present is on fuel switching to biomass andalternative fuels where possible – along with making incremental plant equipment improvements wherecommercially viable.
All UK cement companies are interested in CCS/U, but all expressed the view that it was not currentlyan affordable option for them to pursue without external support. The industry is risk-averse due to highcapital costs, low revenue margins and fear of being ‘locked into’ investment mistakes due the long life cycleof plants and equipment. As a result no UK company is currently willing to be the ‘first mover’ on pilotingCCS/U as the risk is deemed too great and in any case it is currently extremely unlikely that any of the UKcompanies would be able to gain management or shareholder buy-in due to the excessive costs of CCS/U.
The industry consensus expressed by all four UK cement producers and the MPA in the sector workshops isthat a typical scale cement plant costs £250-300m to build. This cost would double with the inclusion ofCCS/U as would the physical size of the plant itself. However, the UK cement sector expressed interest inworking on CCS/U with suitable government support and with cross-sector collaboration.
INDUSTRIAL DECARBONISATION AND ENERGY EFFICIENCY ROADMAPS TO 2050 – CEMENT
Section 3 - Findings Page 31 of 94
Ultimately all UK companies indicated that without CCS/U then the sector would not be able to reach thetarget of reducing sector emissions by 80% by 2050. This is due to the unavoidable calcination process bywhich cement clinker is made and which represents almost half of the total emissions footprint of UK-produced cement.
3.4.3 Decision-Making Processes
Decision making processes vary by company and the most important factor in regards to the level ofauthority of investment expenditure includes size of the company and ownership structure. For largemultinational companies there are decision-making hierarchies and expenditure thresholds that UK basedleaders must abide by or seek additional approval from the Group if the project is above this level ofexpenditure. While UK decision-makers have significant autonomy over smaller investment decisions(e.g. >£250k), investments that may run into the millions of pounds typically require Group approval.
Project managers must come up with the business case for projects and payback criteria under threeyears must usually be met in order for the project to move forward. Longer paybacks of four to fiveyears are accepted by some companies if the project has additional production benefits beyond energysavings and decarbonisation or could hold strategic value to the company. The longest payback periodmentioned as having been accepted by any company for even a strategic project with energy/carbon-reducing co-benefits was 7 years. All companies interviewed used commercial and productivity criteriato inform their decision making as well as calculations on energy savings and decarbonisation.Projects are usually carefully monitored to assess subsequent performance improvements and allcompanies have good data management systems in place. All companies also have a pipeline of futureprojects (e.g. plant energy efficiency projects) that they are interested in implementing depending onavailable capital and feasibility study outcomes. However, companies cautioned that there were no morestep change projects waiting to be implemented [other than CCS/U] such as the step change in energysavings due to switching UK kilns from wet processing to dry processing over the last 15 years. All but one ofthe UK’s kilns are now dry process kilns while the sole remaining semi - wet process kiln has remained assuch as the majority of raw materials used for cement clinker manufacture are transported as a slurry via a92km pipeline.
The cost of energy is as much, if not more of a driver to reduce energy (with reducing carbon as a positiveadditional benefit). This means that decisions to reduce energy are often driven more from concernsover cost than based on carbon concerns. This approach also initially applied to alternative fuels whichfrom the 1990s were attractive to cement companies as they represented a cheap source of direct firing fuelcompared with fossil fuels rather than because they represented a decarbonisation. However, all UK cementcompanies currently recognise that alternative fuels and biomass constitute a highly significant element oftheir on-going decarbonisation activities.
Overall, the main factor that have implications for the adoption of disruptive advanced technologies areavailability of capital to invest, competition for internal funds with other parts of the business or priorities,commercial risks, potential impact on production, potential impact on product quality, ROI and cost savings.Climate change policies are considered as part of the decision-making process yet an attractive ROI andpayback remain highly important.
3.4.4 Financing Investments
Companies are less likely to finance investments in decarbonisation if the payback period is greaterthan three years and 1-2 year payback projects would be much more likely to be approved. Workshopparticipants also categorised this as significant and all interviewees indicated payback was one of the mostsignificant barriers to implementing new projects. Another key barrier to financing disruptive technologies is
INDUSTRIAL DECARBONISATION AND ENERGY EFFICIENCY ROADMAPS TO 2050 – CEMENT
Section 3 - Findings Page 32 of 94
the availability of capital, mainly due to competition for internal funds in multinational companies and otherprojects more closely related to the core business.
There were experiences of companies having applied for external funding through government grant andschemes, but said that academic applicants such as universities were much more experienced with locatingand applying for such funding and therefore they were usually unsuccessful in this approach. They alsoquestioned whether the money might be better spent by companies and their internal experts rather than byacademic institutions. The workshops and interviews indicated that third party financing would be agood way to overcome paybacks over 3 years, but that not much activity had taken place in thisregard. Typically the companies prefer to source capital internally through established channels if possible.One company had investigated funding via the Green Investment Bank but found that the required returnswere not dissimilar from usual market rates and therefore not useful for their needs.
Workshop participants indicated that there may be an opportunity to collaborate and share the costs ofdemonstration projects – particularly on CCS/U. However, concerns regarding the impact on competitivenessand competition law requirements would need to be addressed first.
Linked to payback is the fact that cement plants operate continuously and have long life cycles around 30 to40 years. This means there are limited opportunities to finance large scale disruptive technologies prior to2050.
3.4.5 Enablers and Barriers
One of the outcomes of the analysis of the sector is a list of the most prevalent enablers and barriers fordecarbonisation. The enablers and barriers have been identified through a number of different researchmethods, namely literature review, interviews and workshops. Triangulating data has been of utmostimportance. Seen below are details of the enablers and barriers that have not only been triangulated withregards to research methods, but were also selected at the workshops as the most important enablers andbarriers.
Table 5 and Table 6 below indicate the most prevalent enablers and barriers across literature and interviews,as well as the perceived level of impact to decarbonisation as assessed by workshop participants. Althoughthe number of times an enabler or barrier was referenced or highlighted could provide some guidance as tothe strength of sentiment towards a particular enabler or barrier, the discussions during workshops andinterviews provided a greater understanding as to the detail and context behind each enabler and barrier.
· There were over 20 documents reviewed as part of the social and business literature review. Thenumber in the literature column below represents the prevalence in occurrence of the enabler orbarrier; or in other words the number of sources that discuss it.
· There were seven telephone and face-to-face semi-structured interviews in total. The number in theinterview column below represents the prevalence in occurrence of the enabler or barrier; or in otherwords the number of interviewees that discussed it.
· The workshop column shows the impact level of the enabler and barrier as discussed and agreed bythe evidence-gathering workshop group
· The numbers on the left-hand side do not present a ranking but provide an easy point of reference tothe order of analysis
These enablers and barriers are illustrated throughout the text with supporting quotes and citations frominterviews, workshops and literature. Further depth and interpretation is provided in the following paragraphs:
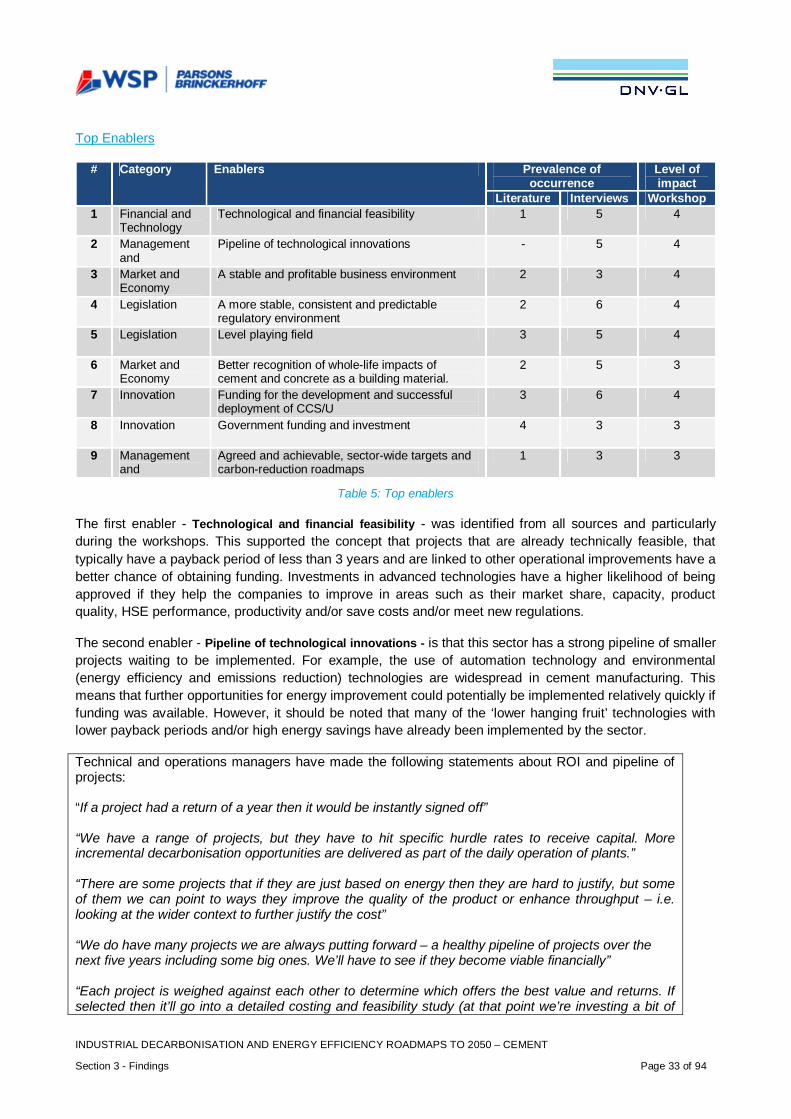
INDUSTRIAL DECARBONISATION AND ENERGY EFFICIENCY ROADMAPS TO 2050 – CEMENT
Section 3 - Findings Page 33 of 94
Top Enablers
# Category Enablers Prevalence ofoccurrence
Level ofimpact
Literature Interviews Workshop1 Financial and
TechnologyTechnological and financial feasibility 1 5 4
2 Managementandorganisation
Pipeline of technological innovations - 5 4
3 Market andEconomy
A stable and profitable business environment 2 3 4
4 Legislation A more stable, consistent and predictableregulatory environment
2 6 4
5 Legislation Level playing field 3 5 4
6 Market andEconomy
Better recognition of whole-life impacts ofcement and concrete as a building material.
2 5 3
7 Innovation Funding for the development and successfuldeployment of CCS/U
3 6 4
8 Innovation Government funding and investment 4 3 3
9 Managementandorganisation
Agreed and achievable, sector-wide targets andcarbon-reduction roadmaps
1 3 3
Table 5: Top enablers
The first enabler - Technological and financial feasibility - was identified from all sources and particularlyduring the workshops. This supported the concept that projects that are already technically feasible, thattypically have a payback period of less than 3 years and are linked to other operational improvements have abetter chance of obtaining funding. Investments in advanced technologies have a higher likelihood of beingapproved if they help the companies to improve in areas such as their market share, capacity, productquality, HSE performance, productivity and/or save costs and/or meet new regulations.
The second enabler - Pipeline of technological innovations - is that this sector has a strong pipeline of smallerprojects waiting to be implemented. For example, the use of automation technology and environmental(energy efficiency and emissions reduction) technologies are widespread in cement manufacturing. Thismeans that further opportunities for energy improvement could potentially be implemented relatively quickly iffunding was available. However, it should be noted that many of the ‘lower hanging fruit’ technologies withlower payback periods and/or high energy savings have already been implemented by the sector.
Technical and operations managers have made the following statements about ROI and pipeline ofprojects:
“If a project had a return of a year then it would be instantly signed off”
“We have a range of projects, but they have to hit specific hurdle rates to receive capital. Moreincremental decarbonisation opportunities are delivered as part of the daily operation of plants.”
“There are some projects that if they are just based on energy then they are hard to justify, but someof them we can point to ways they improve the quality of the product or enhance throughput – i.e.looking at the wider context to further justify the cost”
“We do have many projects we are always putting forward – a healthy pipeline of projects over thenext five years including some big ones. We’ll have to see if they become viable financially”
“Each project is weighed against each other to determine which offers the best value and returns. Ifselected then it’ll go into a detailed costing and feasibility study (at that point we’re investing a bit of
INDUSTRIAL DECARBONISATION AND ENERGY EFFICIENCY ROADMAPS TO 2050 – CEMENT
Section 3 - Findings Page 34 of 94
money to get this study done). We have a team of engineers with projects they’ll work on each year.”
The third enabler - A stable and profitable business environment - is that a stable and profitable UK businessenvironment would encourage further capital investment and innovation in the UK. The importance of thiscan be understood in the context of the market structure section. There are a range of enablers and barriersthat impact upon the sector’s ability to compete and grow, such as product demand and competition fromoverseas. The cement companies indicated that only a truly thriving UK economy with above forecast growthrates combined with a more expansive house building programme or the delivery of a national infrastructureprogramme would stimulate significant growth for their sector.
MPA 2009 states that: “Growth in the construction sector will provide a platform for investment in newproducts. Without construction sector growth UK assets will continue to decline and will place the UKvulnerable to imports when demand returns”
Boston Consulting Group 2008 found that: “Based on the expected cost of production in the EUassuming the carbon cost of CO2 versus the cost of producing in non-ETS countries, clinker andcement production in the EU is not competitive without free allowances allocation. As a result, the‘wise businessman’ will prefer to relocate production to more competitive countries.”
This is supported by statements from senior level decision-maker interviewees:
“A stable and buoyant cement market would be the biggest enabler! So if we have higherconsumption we’ll have excess capital to invest in more improvements”
“Cement consumption in the UK per capita is the lowest in Europe. So we’re not spending enough onconstruction or we’re using different materials.”
“There is a need for long term growth to enable more investment. We need delivery of governmentinfrastructure pipeline...”
Legislation related to enablers four and five - A more stable, consistent and predictable regulatoryenvironment and a Level playing field - describe how a stable, consistent and predictable regulatoryenvironment would enable better long term planning and investment and specifically how reform of UKclimate change and energy regulations, taxes and incentives would allow UK-based cement producers to bemore cost competitive. This is also described as a barrier in the next section.
Boston Consulting Group found that (to reduce carbon and remain competitive cement companiesrequire):“− A consistent and predictable legal framework which allows for long-term investment planning andintegrates economic, environmental and social considerations within a coordinated and consistentindustrial policy at European level− Climate change and energy legislation that is characterised by a legal framework where parametersare fixed long-term, and continued security of supply is guaranteed with competitive energy prices, ina unified European market..”
Senior level decision-maker interviewees stated:
“A big barrier is regulatory risk and uncertainty – at both UK and EU level (especially at EU level) andthe degree of interference into emissions markets is a big problem. Phase 3 was only a few monthsold before the whole debate on backloading began and now we’re working on Phase 4. Ourtimetables are much longer than these phases so constant interference results in much more cost forus to address.”
INDUSTRIAL DECARBONISATION AND ENERGY EFFICIENCY ROADMAPS TO 2050 – CEMENT
Section 3 - Findings Page 35 of 94
The sixth enabler - Better recognition of whole-life impacts of cement and concrete as a building material - isregulatory promotion of thermal properties of concrete in buildings to reduce building energy use duringlifetime. Cement companies are interested in decarbonisation from the lifecycle perspective and state thatthe re-carbonisation properties of concrete structures during their lifetime, and particularly when brokendown and reused, are not being appropriately recognised at present. In addition, cement and concrete arevery durable and are utilised for low-carbon infrastructure such as wind farms as well as flood defences.
The impact of whole life costings has been recognised in literature:
CEMBUREAU (2009) found that: “Some national design codes and standards place undue emphasison minimising embodied impacts and energy use of products, whilst little or no attention is paid to thewhole-life performance of buildings. The benefits of heavyweight materials used in construction worksshould be recognised in existing and future legislation, such as the Energy Performance of BuildingsDirective (EPBD). In addition, national compliance tools for assessing both energy consumption andsustainable performance of buildings need to be amended to take due account of thermal mass andclimate change.”
Senior level decision-maker interviewees stated:
“There is a drive to reduce carbon which is not just based on compliance costs – it’s also to do withoverall company sustainability strategy including enhancing our product attractiveness to clients.. TheUK definitely has much higher demand for low-carbon building materials – this is a driver from thegovernment who want to lead on climate change.”
“We explain the carbon profile of our product to our customers if they want to understand the impacts.In future the industry could include full life cycle benefits (of concrete) and sell these benefits toclients”
“We also need to look more at the impact in buildings and where we improve their carbonperformance over lifetime”
“Cement is essential for carbon savings down the line in terms of its use, not just manufacture.”
Enablers seven and eight - Funding for the development and successful deployment of CCS/U and Governmentfunding and investment - are concerned with gaining funding for the innovation and technologies needed tohave a significant impact on decarbonisation in the cement sector. Enabler seven concerns gaining fundingfor the successful deployment of CCS/U. All UK companies indicated that without CCS/U then the sectorwould not be able to reduce emissions by 80% by 2050. However, the cement sector expressed interest inworking on CCS/CCU with suitable government support and with cross-sector collaboration. Enabler eightconcerns how to gain government funding and investment support for decarbonisation R&D activities andassociated costs to facilitate collaboration and investment in this area.
The potential impact of CCS/U has been identified in literature:
DECC (2013) found that: “Industrial CCS could be a key technology for the decarbonisation ofindustry sector, potentially allowing energy intensive industries to continue using fossil fuels whilesignificantly reducing emissions. ESME (Energy System Modelling Environment) modelling suggeststhat a significant component of long-term industrial abatement potential lies in CCS technology.Industries which emit carbon from their manufacturing process itself (for example CO2 emitted as aconsequence of chemical reactions [e.g. cement]) are likely to need to implement CCS todecarbonise. Industries which are most likely to be suitable for CCS are iron and steel, cement, oilrefining and chemicals. 29 Industrial facilities which are located close to other industries or powerstations and storage sites are more likely to be able to implement CCS if they can share transport andstorage infrastructure. Cement: Post-combustion capture technology using amines is considered mostsuitable for current cement production methods although research into Oxyfuel methods is also under
INDUSTRIAL DECARBONISATION AND ENERGY EFFICIENCY ROADMAPS TO 2050 – CEMENT
Section 3 - Findings Page 36 of 94
way.”
IEAGHG (2013) found that: “CCS will be required if cement manufacturers are to meet overalldecarbonisation targets as efficiency savings have limitations. Most cement companies feel CCS isrelevant to them, but only a third are willing to contribute to a pilot project due to high costs”
CEMBUREAU found that: “Carbon capture and storage is currently being researched by the cementindustry. Although not proven on an industrial scale, research on carbon capture (post combustionand oxyfuel technologies) is being undertaken by the European cement Research Academy (ECRA)to identify the possibilities it has to offer.”
The MPA and senior level decision-maker interviewees stated:
“Low carbon cements are being developed by some of the companies globally, but the research is nothappening in the UK itself”
“There is some R&D going on in the sector at universities such as Sheffield, Birmingham andImperial. However, UK R&D tends towards cement types and formulas rather than plant andequipment related research which tends to be done abroad. Some of the new cement/concreteformulas are based on lower carbon outcomes”
“With some funding for R&D, academic bodies tend to be much better than the cement companies atclaiming this funding. However the funding would be very useful for the industry, but it all happens soquickly with so little visibility that the companies miss the opportunity to take some of this money. Thismoney for R&D might be much better spent by the operators rather than academic and researchbodies.”
Enabler 10 - Agreed and achievable, sector-wide targets and carbon-reduction roadmaps - is thatagreed and achievable, sector-wide targets and carbon-reduction roadmaps would assist sector in reducingemissions in coordinated manner. The MPA, the EU, the World Business Council for SustainableDevelopment and the International Energy Agency have developed 2050 decarbonisation roadmaps whichindicates that decarbonisation is becoming a more prominent issue for the sector. During the workshop,many participants noted that they felt government were simply not particularly aware that this roadmappingwork had already been completed and agreed to by the sector companies and if there was better awarenessthis could facilitate coordination and understanding of efforts and impacts.
MPA literature stated:
“MPA cement launched its first Carbon Strategy in 2005. The short term period of action in the originalstrategy ended in 2010. Since then there has been a considerable effort by policy makers, NGO’s andindustry groups to map the necessary reductions in emissions to address the scientific imperative tominimize anthropogenic induced climate change. There has also been considerable research into lowcarbon pathways and carbon footprinting.”
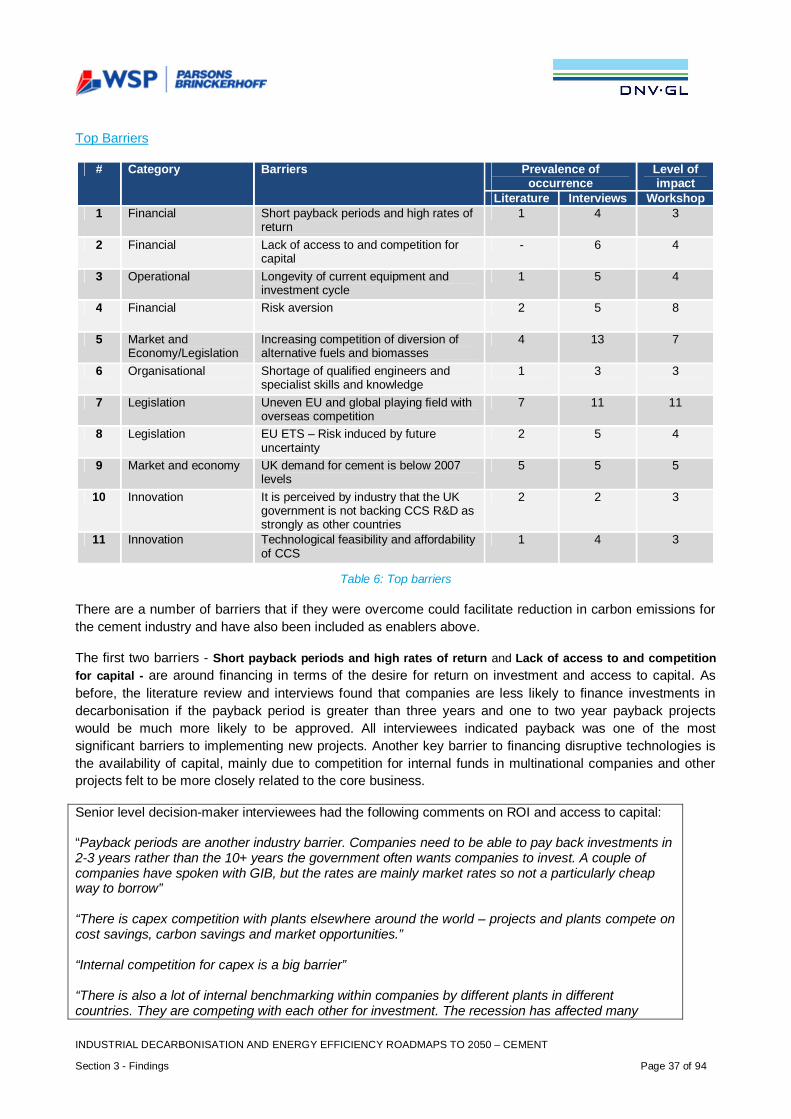
INDUSTRIAL DECARBONISATION AND ENERGY EFFICIENCY ROADMAPS TO 2050 – CEMENT
Section 3 - Findings Page 37 of 94
Top Barriers
# Category Barriers Prevalence ofoccurrence
Level ofimpact
Literature Interviews Workshop1 Financial Short payback periods and high rates of
return1 4 3
2 Financial Lack of access to and competition forcapital
- 6 4
3 Operational Longevity of current equipment andinvestment cycle
1 5 4
4 Financial Risk aversion 2 5 8
5 Market andEconomy/Legislation
Increasing competition of diversion ofalternative fuels and biomasses
4 13 7
6 Organisational Shortage of qualified engineers andspecialist skills and knowledge
1 3 3
7 Legislation Uneven EU and global playing field withoverseas competition
7 11 11
8 Legislation EU ETS – Risk induced by futureuncertainty
2 5 4
9 Market and economy UK demand for cement is below 2007levels
5 5 5
10 Innovation It is perceived by industry that the UKgovernment is not backing CCS R&D asstrongly as other countries
2 2 3
11 Innovation Technological feasibility and affordabilityof CCS
1 4 3
Table 6: Top barriers
There are a number of barriers that if they were overcome could facilitate reduction in carbon emissions forthe cement industry and have also been included as enablers above.
The first two barriers - Short payback periods and high rates of return and Lack of access to and competitionfor capital - are around financing in terms of the desire for return on investment and access to capital. Asbefore, the literature review and interviews found that companies are less likely to finance investments indecarbonisation if the payback period is greater than three years and one to two year payback projectswould be much more likely to be approved. All interviewees indicated payback was one of the mostsignificant barriers to implementing new projects. Another key barrier to financing disruptive technologies isthe availability of capital, mainly due to competition for internal funds in multinational companies and otherprojects felt to be more closely related to the core business.
Senior level decision-maker interviewees had the following comments on ROI and access to capital:
“Payback periods are another industry barrier. Companies need to be able to pay back investments in2-3 years rather than the 10+ years the government often wants companies to invest. A couple ofcompanies have spoken with GIB, but the rates are mainly market rates so not a particularly cheapway to borrow”
“There is capex competition with plants elsewhere around the world – projects and plants compete oncost savings, carbon savings and market opportunities.”
“Internal competition for capex is a big barrier”
“There is also a lot of internal benchmarking within companies by different plants in differentcountries. They are competing with each other for investment. The recession has affected many
INDUSTRIAL DECARBONISATION AND ENERGY EFFICIENCY ROADMAPS TO 2050 – CEMENT
Section 3 - Findings Page 38 of 94
companies in the sector, not just in the UK. Financial investment has declined across the world sointernal competition for capital investment is very strong.”
“We are competing for capital within an international business. This is a barrier for us.”
Barriers three and four - Longevity of current equipment and investment cycle and Risk aversion - arealso related to financing and approach to return on investment for environmental projects. This is furtheraffected by long plant life (longevity of current equipment) and investment cycle and a generally risk averseapproach in the cement industry – companies are wary of being locked in to the ‘wrong’ investment choices(in part due to high technology costs, long investment cycles and concerns over product quality impact).
Technical manager interviewees stated
“A cement plant will cost a minimum of £250m and will last 30 to 40 years. Therefore there is onlyreally likely to be one more significant investment cycle between now and 2050”
“We are very capital intensive with very long payback periods of, 30 to 40 years and 7 years to planand build new plants.”
“You see the really big step changes at the point of plant construction. Typical payback is 30-40years. At the point of construction you install the best available technology at the time. Plants arehighly integrated so it’s not easy or cheap to replace parts of already built plants. More common iscontinuous improvements such as switching to different fuel types.”
DECC (2013) notes that the “cement sector suffers from risk-averse thinking - wary of risks to productquality or being locked in to ‘wrong’ investment choice.”
Barrier five - Increasing competition of diversion of alternative fuels and biomasses - is the increasingcompetition for of diversion of alternative fuels and biomasses. Specifically, the Renewable Heat Incentivesystem increases biomass costs for cement sector as the sector is not currently eligible for this. According tosector interviewees, the UK cement industry was a first mover in utilising alternative fuels and biomass toreplace fossil fuels such as coal and petroleum coke (petcoke). This was initially financially attractivecompared with fossil fuels, but increasing competition has led to rising costs of alternative fuels which is nowproving problematic for the sector in terms of cost and security of supply. This issue was identified by allinterviewees involved.
The challenge for the future will be to make sure that the biomass fuels remain available to cementmanufacturers and are not simply diverted to other areas of the economy that are currently receivingincentive payments via, for example, the Renewable Heat Incentive (RHI) which are inaccessible to thecement operators. Consequently, there is a measurement issue when it comes to deciding whether policiessuch as the RHI are generating additional biomass heat or just moving the biomass heat consumption fromthose sectors that don’t currently receive RHI to those that do.[32] If the latter, then the policy has no netbenefit, and can actually be a disbenefit if it results in biomass being used in a less efficient manner as aresult of distorting subsidies.
MPA (2009) states: “Government policies currently inhibit the maximized use of Alternative WasteDerived Fuel in cement manufacture which results in a continued reliance upon fossil fuels. Otherpolicies allow Alternative Waste Derived Fuel to be incinerated without a charge being placed on theresulting GHG emissions which means there is uneven treatment of the combustion of the same fuelsin different applications. Current government policies to enhance the use of renewable heat are poorlyfocused and incentivise the use of biomass for some activities but not others, potentially creating ashift in biomass use from one sector to another without an overall environmental benefit. The currentRenewable Heat Incentive creates an incentive to move biomass use from cement kilns to other
INDUSTRIAL DECARBONISATION AND ENERGY EFFICIENCY ROADMAPS TO 2050 – CEMENT
Section 3 - Findings Page 39 of 94
potentially less efficient uses. This is an unwelcome intervention in the market by a poorly designedpolicy.”
Senior level decision-maker interviewees have stated:
“RHI is a problem – 10 years ago we were the only company who bought some alternative fuels andnow we can’t afford them compared to other companies. Alternative fuelswere previously almost zerocost and now they have a similar price to coal. If you look at small scale biomass then RHI takes it allaway from us as we can’t get the incentive.”
“Security of supply is a worry – we need to know we can get a long term supply when investing in newalternative fuel equipment. One key question we now get asked when we do alternative fuel capex is“Do you have a contract in place to get this material for the long term?” Distortions such as RHI needto be removed from the marketRHI is not recognising that alternative fuel can be burned anywhere,why should one person get the advantage?”
“The sector have been pushing the government to allow the cement sector to have energy incentivessuch as RHI. It is offering the incentives to other industries, but not the cement sector. So the cementsector will be priced out of purchasing fuels such as biomass fuels.…”
Barrier six - Shortage of qualified engineers and specialist skills and knowledge - this is a shortage for thecement sector specifically in terms of heat engineers. There are a number of contributory factors that arelinked including competition from other sectors for a limited number of qualified staff; location of the cementplants and aging workforce. This was discussed by the interviewees and at the workshops.
DECC (2013) notes that the “Cement sector suffers from a shortage of qualified staff (especially heatengineers) and aging of workforce.”
Technical managers stated:
“We struggle to attract top graduate talent compared with more glamorous sectors such astechnology. There are concerns about a knowledge gap occurring when more people retire from thesector.”
“We need specialised technical resources/skills. cement plant operators are highly skilled. If a kiln isdown for a day this can cost £100,000. More complex tech needs greater skill. The reduction in themanufacturing in UK makes it difficult to find graduates wanting to come into sector. Smaller pool torecruit from. How can government help? We need an environment where heavy industry can flourishand make youngsters want to study and join the sector. Cement perception is not positive, but realityis it’s very clean and technical work. Visitors are always surprised by the level of skill required to makecement! We need to promote positive side of industry.”
“The sector is rurally-based. We generally attract local youth/students with well-paid apprenticeship.When we look for specialists such as environmental experts it can take a long time to attract the rightperson though.”
INDUSTRIAL DECARBONISATION AND ENERGY EFFICIENCY ROADMAPS TO 2050 – CEMENT
Section 3 - Findings Page 40 of 94
Barriers seven and eight - Uneven EU and global playing field with overseas competition and EU ETS – Riskinduced by future uncertainty - are legislation related barriers that are also described in the enablers section.This is in terms of how a more even regulator playing field at both EU and global levels would enable UKcement producers to be more cost competitive with EU and global producers who are not subject to thesame regulatory costs. This view was expressed by the MPA and all cement companies. In particular, reformof UK-specific climate change and energy regulations, taxes and incentives such as the UK’s unilateralCarbon Price Floor and the CRC Energy Efficiency Scheme would allow UK-based cement producers to bemore cost competitive at both an EU and global level.
At the EU level, all the companies interviewed and the MPA indicated that the EU Emissions TradingScheme added not only greater costs compared with non-EU producers, but also problematic uncertaintyover future carbon allowances and costs which hamper their ability to make long term investment decisionsin the EU. The MPA noted that the current and projected future allowances for the cement sector wereconsidered to be flawed as the impact of the 2008 recession - which temporarily lowered production in theEU and therefore total carbon emitted - was not taken into account and this resulted in lower than expectedallowances being issued for the sector. The MPA and some of the other interviewees also commented thatthe EU ETS has led to some unintended consequences in that plants will lose their allowance altogether iftheir production falls below 50%. This has led to occasional gluts in unneeded supply in some markets suchas Ireland and Spain as plants over-produce cement to ensure they retain their current emissions allowances.A further unintended consequence expressed by interviewees is that new cement plants typically take a fewyears to move their production up to 100% capacity after commencing operations and this means they riskbeing given an allowance that doesn’t recognise their expected production levels in future years. The resultof this being a general disincentive to invest in new, more energy-efficient plants and rather to persevere witholder, less efficient plants as they may be cheaper to operate with their higher emissions allowances.
In addition, barrier nine - UK demand for cement is below 2007 levels - is that UK demand for cement is stillwell below 2007 levels and growth forecasting is difficult which impacts on investment decisions. The UKcement industry is argues that it is at risk from low cost imports, partly due to the UK’s extensive coastlineand high number of ports suitable for importing cement and then easily transporting it around the country.
Boston Consulting Group 2011 found: “the high level of regulatory uncertainty in Europe discouragescompanies from making the investments required in order to improve the efficiency of cement plantsand the lack of an appropriate legal framework deters companies from adopting structuraladjustments”
A senior level decision-maker interviewee stated “EU ETS creates a difficulty. Every 5 years we get alevel of free allocation, but this declines every year. We are vulnerable to carbon leakage as anindustry and at some point leakage will start to take place – only the recession and a relatively lowcarbon price has prevented this so far. The next review is in 2019 and the decisions made are soabsolutely critical that it’s almost a case of go or no go for staying in the UK.”
Boston Consulting Group 2008 states that: “EU ETS could make European cement manufacturersuncompetitive with global competitors / plants leading to possible carbon leakage”
Centre for Low Carbon Futures 2011 states that: “number of representatives identified the high andrising costs of energy and energy taxes in the UK, as well as rising commodity prices, as a barrier toinvestment. Parent companies see relatively poor returns on investment in the UK compared withother countries. The representatives consulted referenced the TUC/EIUG report (2010) on thecumulative impacts of climate change policy on the energy intensive industries, with both electricityand gas costs expected to rise by up to 22% by 2020.”
MPA (2009) states that: “It is very difficult to accurately forecast future demand and production -therefore assumptions used for roadmaps and milestones may not be accurate. Growth in theconstruction sector will provide a platform for investment in new products. Without construction sector
INDUSTRIAL DECARBONISATION AND ENERGY EFFICIENCY ROADMAPS TO 2050 – CEMENT
Section 3 - Findings Page 41 of 94
growth UK assets will continue to decline and will place the UK vulnerable to imports when demandreturns.”
The final barriers, 10 and 11 – a perception that UK government is not backing CCS R&D as strongly as othercountries and Technological feasibility and affordability of CCS - concern CCS/U which could have asignificant impact on decarbonisation in the sector. These are also discussed in the enablers section in termsof how investment and uncertainly around CCS/U means that this is difficult to be implemented. In particular,the projected costs of implementing CCS/U would likely make any such UK plants uncompetitive with non-CCS/U plants. As the technology is currently unproven, interviewees all indicated that no company had adesire to be the first mover on CCS/U without some form of support mechanisms to minimise the financialrisks. Barrier 11 discusses the technical uncertainties and overall viability that remain around CCS/U as apractical solution as well as the affordability aspects.
IEAGHG 2013 states that: “CCS will be required if cement manufacturers are to meet overalldecarbonisation targets as efficiency savings have limitations. With current legal and economicconditions around CCS would impair the competitiveness of cement production and this inhibits thedevelopment of CCS”
Centre for Low Carbon Futures 2011 states that: “Transformative technologies, such as carboncapture and storage, remain perhaps 10-15 years away from commercial deployment.”
Senior level decision-makers stated:
“Our big wish is for proper government funding for CCS!”
“The capital cost of doing CCS would basically double the cost of a plant. A new plant in the UK wouldbe £200-250m, but price and plant size would double with CCS in place. And if we captured thecarbon, then what do we do with it? Many plants are a long way from storage in seas and the plantscan’t be moved away from their quarries easily or cheaply. Biggest issues would mainly be transportand storage of the carbon along with capital costs. If you were first to do it then you’d need it to besupported by government as the risk and cost is just so big. Why would you invest in that if youweren’t sure it would work?”
“Other than a few projects that have been happening elsewhere, there is still a lack of understandingabout whether CCS will ever be commercially and technically viable. I cannot see that the cementindustry would be the first to prove success of this technology.”
3.5 Technologies to Reduce Carbon Emissions
The options distilled from the literature review, interviews, evidence-gathering workshop, discussions with theTrade Associations and input from academia, which have been modelled are presented in appendix C (thedata for these options are also listed). The energy saving and decarbonisation opportunities are classifiedinto twelve categories that represent the principal areas of the cement making process and key cross-cuttingareas of potential performance improvement, in order to group similar technology options:
· Kiln process technology (Best available techniques kiln): the implementation of the mostmodern kiln technologies, considering size and related efficiency.
· Electrical efficiency improvements: motor management plan, maintenance, voltage and poweroptimisation, strategic motor selection (including Variable/Adjustable Speed Drives), properly sizedmotors, high efficiency belts (cog belts more energy-efficient than pneumatic or screw conveyors).Switching off unnecessary lights replacing by daylight, replacing lighting by energy-efficient lighting,optimised utility systems, within others.
INDUSTRIAL DECARBONISATION AND ENERGY EFFICIENCY ROADMAPS TO 2050 – CEMENT
Section 3 - Findings Page 42 of 94
· Electricity from waste heat: the use of waste heat in order to reduce CO2 emissions by rawmaterial drying, power generation (steam cycle, Kalina cycle, Organic Rankine Cycle).
· Cementious substitution: reducing the amount of clinker per unit of cement by substituting theclinker with other cementitious materials, such as pulverised fuel ash (a waste from coal fired powerstations) or ground granulated blast furnace slag (a by-product from iron and steel manufacture),natural pozzolanic materials, fillers such as limestone.
· Alternative raw materials (calcined): improves the energy efficiency of the thermal processes inthe kiln and so their use leads to a reduction in the thermal requirement per unit of clinker produced.
· Fuel switching to natural gas: use of natural gas to reduce CO2 emissions for cement production.· Fuel switching to biomass: use of biomass to reduce CO2 emissions for cement production.· Hydrogen fuel: use of hydrogen to reduce CO2 emissions for cement production.· Alternative cements: there are several diverse, novel or 'new' cements which are generally non-
Portland, based on non-traditional processes or raw materials. They tend to embody less energy andemit less CO2 during manufacture than 'Portland cement CEM I' (formerly called ordinary Portlandcement) although there is no precise definition for what constitutes a low energy, low carbon cement.These include Magnesium oxide (MgO) alternatives, belite-aluminate, sulpho-aluminate, other, lowerCO2 cement alternatives.
· Fluidised bed kiln: In this technology clinker is produced in a fluidized bed system, under additionof grinded coal, and raw material injection. The raw material is granulated in the kiln system to aspecific size. Subsequently the clinker is cooled in two steps (fluidized bed quenching and a packedbed cooler). The result is a finely granulated clinker.
· Carbon capture: the capture of CO2 generated by combustion processes. The CO2 is thentransported, typically by pipeline, and stored underground in suitable geological features.
· Oxygen enrichment technology: the use of oxygen enriched combustion air in the clinker burningprocess. This allows an increase of the fuel efficiency, production capacity or substitution of fossilfuels by low calorific value (or secondary fuels). This option includes oxygen enriched combustionand oxyfuel combustion.
This short list of options was used in the pathway analysis (section 4).
3.5.1 Biomass Carbon Intensity
Pathways including biomass reflect biomass carbon intensity (unless the biomass in the pathway is assumedto be waste biomass). The carbon intensities (below) are applied to two scenarios to help reflect and boundthe uncertainties around biomass carbon availability; these are (i) unlimited availability – as deployed in theMax Tech pathway or (ii) no availability.
In all cases, combustion emissions are assumed to be zero (in line with EU Renewable Energy Directivemethodology), on the basis that all biomass used is from renewable sources and thus additional carbondioxide is removed from the atmosphere equivalent to that emitted on combustion. This means that allbiomass is assumed to be sourced from material that meets published sustainability criteria.
Given the wide variation in pre-combustion emissions, a carbon intensity (based on pre-combustionemissions) was derived from a low scenario from the DECC-commissioned Bioenergy Emissions andCounterfactual Model report (published 2014) for modelling purposes. An emission value of 20kgCO2e/MWh(th) has been used for solid biomass use, and this has been modified to 25 kgCO2e/MWh(th) ifthe pathways includes pyrolysis, and 30 kgCO2e/MWh(th) if the pathways includes production of biogas.
INDUSTRIAL DECARBONISATION AND ENERGY EFFICIENCY ROADMAPS TO 2050 – CEMENT
Section 3 - Findings Page 43 of 94
3.5.2 Cost of Options
Limited information related to the capital cost of technologies was identified in this project as summarised inappendix C. In gathering capital cost-related data, literature and/or engagement with stakeholders – togetherwith expert judgement - were used to establish an initial order of magnitude dataset for use in the costanalysis assessment. The degree of stakeholder engagement in relation to the cost dataset was lower thanfor the carbon reduction pathways. Operating costs such as energy use changes, energy costs and labourare not included in this analysis, although we recognise that operating costs will have a major impact on thedecarbonisation and energy efficiency pathways. For example, some options (e.g. carbon capture andelectrification of firing) will greatly increase energy use and costs of a process plant.
Costs analysis was carried out for the pathways, which is presented in section 4. There is a large degree ofuncertainty attached to the cost analysis, especially for options which are still in the research anddevelopment stage. As well as costs of operation and energy use – other significant costs not included in theanalysis are research, development, demonstration, civil works, modifications to plant and costs to otherstakeholders, which are significant for many options. Great care must be taken in how these costs areinterpreted and it is recommended to check with trade associations.
INDUSTRIAL DECARBONISATION AND ENERGY EFFICIENCY ROADMAPS TO 2050 – CEMENT
Section 4 - Pathways Page 44 of 94
4. PATHWAYS
4.1 Key Points
In this study, four pathways were modelled for each of three scenarios:
· Challenging world scenarioo BAUo 20-40%o Max Tech no CCSo Max Tech with CCS
· Current trends scenarioo BAUo 20-40%o Max Tech no CCSo Max Tech with CCS
· Collaborative growth scenarioo BAUo Max Tech no CCSo Max Tech with CCS
The two principal external factors appraised for each scenario are the sector production and electricity griddecarbonisation. These factors translate to a moving reference trend before any decarbonisation options areapplied, and these baseline emissions are plotted as a black line in Figure 10 below. Figure 10 shows a 9%emissions reduction from 2012 to 2050 solely resulting from electricity grid decarbonisation since there is nochange in production of cement under current trends.It should be noted that the forecast decarbonisation of power generation will require significant policyintervention to maintain the projected trajectory to 2050 and may increase cost to industry through price passthrough in power prices to consumers unless further mechanisms are introduced by government to addressthis.
The pathways analysis shows that the technical decarbonisation potential of the sector, under the currenttrends scenario (not taking into account cost), is a reduction from 7.5 Mt CO2 emissions to emissions in 2050between 2.8 Mt CO2, for the Max Tech with CCS pathway, and 6.7 Mt CO2, for the BAU pathway. Theseabsolute emissions in 2050 correspond to reductions in emissions of 62% and 12%, respectively, comparedwith emissions in 2012. These 2050 CO2 emissions figures may be compared with the figures determined inthe MPA’s cement GHG Reduction Strategy; which projects 2050 emissions of 2.85 Mt CO2 and 5.7 Mt CO2
under two different pathways considered in the MPA strategy. These correspond to emissions reductions in2050 of 28.4% and 65.6%, respectively, compared with 2012.
Emissions reductions in 2050, compared with 2012, range from 24% to 53% under the challenging worldscenario, and -6% to 55% under collaborative growth. Such reductions could be achieved through a range ofoptions, the most significant being:
· Carbon capture· Switching from fossil fuels to biomass· Cementitious substitution· Decarbonisation of the electricity grid
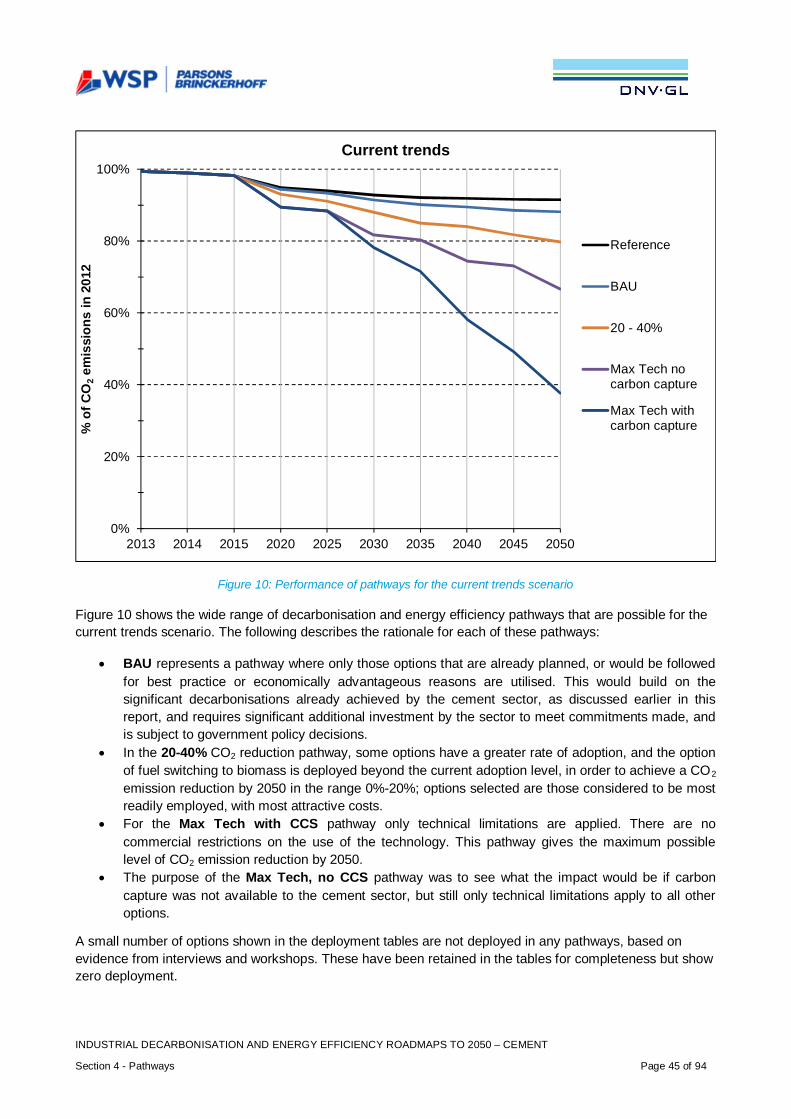
INDUSTRIAL DECARBONISATION AND ENERGY EFFICIENCY ROADMAPS TO 2050 – CEMENT
Section 4 - Pathways Page 45 of 94
Figure 10: Performance of pathways for the current trends scenario
Figure 10 shows the wide range of decarbonisation and energy efficiency pathways that are possible for thecurrent trends scenario. The following describes the rationale for each of these pathways:
· BAU represents a pathway where only those options that are already planned, or would be followedfor best practice or economically advantageous reasons are utilised. This would build on thesignificant decarbonisations already achieved by the cement sector, as discussed earlier in thisreport, and requires significant additional investment by the sector to meet commitments made, andis subject to government policy decisions.
· In the 20-40% CO2 reduction pathway, some options have a greater rate of adoption, and the optionof fuel switching to biomass is deployed beyond the current adoption level, in order to achieve a CO2
emission reduction by 2050 in the range 0%-20%; options selected are those considered to be mostreadily employed, with most attractive costs.
· For the Max Tech with CCS pathway only technical limitations are applied. There are nocommercial restrictions on the use of the technology. This pathway gives the maximum possiblelevel of CO2 emission reduction by 2050.
· The purpose of the Max Tech, no CCS pathway was to see what the impact would be if carboncapture was not available to the cement sector, but still only technical limitations apply to all otheroptions.
A small number of options shown in the deployment tables are not deployed in any pathways, based onevidence from interviews and workshops. These have been retained in the tables for completeness but showzero deployment.
0%
20%
40%
60%
80%
100%
2013 2014 2015 2020 2025 2030 2035 2040 2045 2050
%of
CO
2em
issi
ons
in20
12
Current trends
Reference
BAU
20 - 40%
Max Tech nocarbon capture
Max Tech withcarbon capture
INDUSTRIAL DECARBONISATION AND ENERGY EFFICIENCY ROADMAPS TO 2050 – CEMENT
Section 4 - Pathways Page 46 of 94
Pathway analysis was based on the ‘maximum interaction’ case, as this gave the minimal, worst-case CO2
reductions within the context of the pathway. Maximum interaction means that where multiple options couldapply to the same emissions, emissions are assumed to be saved only once, i.e. by one of the options only,to avoid potential double-counting.
4.2 Pathways and Scenarios – Introduction and Guide
As set out in section 3, the pathways development uses evidence gathered to create a set ofdecarbonisation ‘pathways’. These provide a quantitative component to the roadmap and help inform thestrategic conclusions.
A pathway consists of decarbonisation options deployed over time from 2015 to 2050, as well as a referenceemissions trend. The analysis covers three: ‘scenarios’: with pathways developed under a central trend(‘Current Trends’ scenario) and alternative future outlooks (‘Challenging World’ and ‘Collaborative Growth’scenarios).
A scenario is a specific set of conditions that could directly or indirectly affect the ability of the sector todecarbonise. Examples of these are: future decarbonisation of the grid, future growth of the sector, futureenergy costs, and future cost of carbon. Since we do not know what the future will look like, using scenariosis a way to test the robustness of the different pathways. A detailed description of these scenarios isprovided in appendix A.
The three scenarios were developed, covering a range of parameters. They characterise possible versionsof the future by describing assumptions relating to international consensus; international economic context;resource availability and prices; international agreements on climate change; general technical innovation;attitude of end consumers to sustainability and energy efficiency; collaboration between sectors andorganisations; and demographics (world outlook). These scenarios were used during the workshop to helpdecide on deployment rate for the different options.
Quantitative parameters were also part of the scenarios, including production outlook (agreed sector-specificview) and grid CO2 factors (DECC supplied) which both impact decarbonisation (assuming production andcarbon emissions have a linear directly proportional relationship). Other quantitative parameters within thescenarios governed forward price forecasts and technology deployment.
The purpose of the model that underpins this pathways analysis is to bring together the data captured fromvarious sources and to broadly reflect, using a simple ‘top down’ approach, how emissions might develop to2050. The model is therefore capable of indicating magnitudes of emissions reduction that can be achieved,when various technology options are applied, and also how different deployment timings and high-leveleconomic outlooks for a sector might change the results. A sector model was used to create pathways basedon reference emissions and energy consumption in 2012. The model is not intended to give exact resultsand is not of sufficient detail to account for all mass/ energy/ carbon flows, losses and interactions in a sector(i.e. it is not ‘bottom up’ and does not use automatic optimisation techniques).
The methodology is summarised in Figure 11.
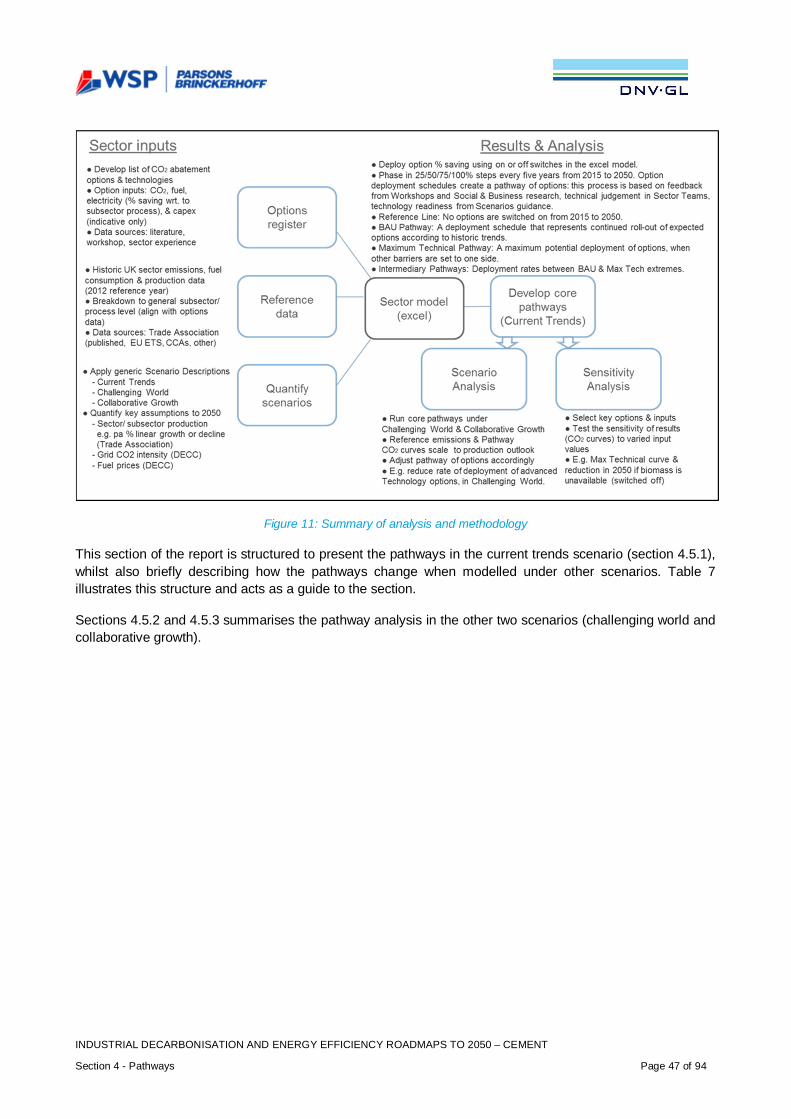
INDUSTRIAL DECARBONISATION AND ENERGY EFFICIENCY ROADMAPS TO 2050 – CEMENT
Section 4 - Pathways Page 47 of 94
Figure 11: Summary of analysis and methodology
This section of the report is structured to present the pathways in the current trends scenario (section 4.5.1),whilst also briefly describing how the pathways change when modelled under other scenarios. Table 7illustrates this structure and acts as a guide to the section.
Sections 4.5.2 and 4.5.3 summarises the pathway analysis in the other two scenarios (challenging world andcollaborative growth).
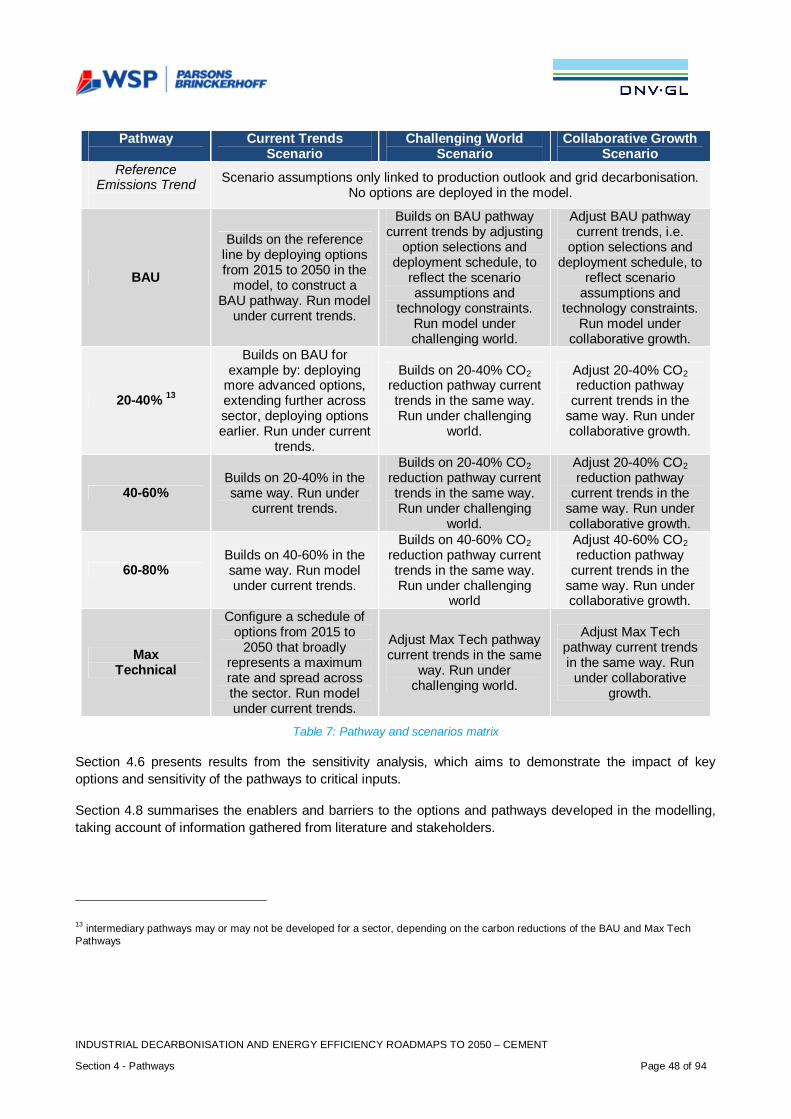
INDUSTRIAL DECARBONISATION AND ENERGY EFFICIENCY ROADMAPS TO 2050 – CEMENT
Section 4 - Pathways Page 48 of 94
Pathway Current TrendsScenario
Challenging WorldScenario
Collaborative GrowthScenario
ReferenceEmissions Trend Scenario assumptions only linked to production outlook and grid decarbonisation.
No options are deployed in the model.
BAU
Builds on the referenceline by deploying optionsfrom 2015 to 2050 in the
model, to construct aBAU pathway. Run model
under current trends.
Builds on BAU pathwaycurrent trends by adjusting
option selections anddeployment schedule, to
reflect the scenarioassumptions and
technology constraints.Run model underchallenging world.
Adjust BAU pathwaycurrent trends, i.e.
option selections anddeployment schedule, to
reflect scenarioassumptions and
technology constraints.Run model under
collaborative growth.
20-40% 13
Builds on BAU forexample by: deploying
more advanced options,extending further acrosssector, deploying optionsearlier. Run under current
trends.
Builds on 20-40% CO2reduction pathway currenttrends in the same way.Run under challenging
world.
Adjust 20-40% CO2reduction pathway
current trends in thesame way. Run undercollaborative growth.
40-60%Builds on 20-40% in thesame way. Run under
current trends.
Builds on 20-40% CO2reduction pathway currenttrends in the same way.Run under challenging
world.
Adjust 20-40% CO2reduction pathway
current trends in thesame way. Run undercollaborative growth.
60-80%Builds on 40-60% in thesame way. Run modelunder current trends.
Builds on 40-60% CO2reduction pathway currenttrends in the same way.Run under challenging
world
Adjust 40-60% CO2reduction pathway
current trends in thesame way. Run undercollaborative growth.
MaxTechnical
Configure a schedule ofoptions from 2015 to
2050 that broadlyrepresents a maximumrate and spread acrossthe sector. Run modelunder current trends.
Adjust Max Tech pathwaycurrent trends in the same
way. Run underchallenging world.
Adjust Max Techpathway current trendsin the same way. Run
under collaborativegrowth.
Table 7: Pathway and scenarios matrix
Section 4.6 presents results from the sensitivity analysis, which aims to demonstrate the impact of keyoptions and sensitivity of the pathways to critical inputs.
Section 4.8 summarises the enablers and barriers to the options and pathways developed in the modelling,taking account of information gathered from literature and stakeholders.
13 intermediary pathways may or may not be developed for a sector, depending on the carbon reductions of the BAU and Max TechPathways
INDUSTRIAL DECARBONISATION AND ENERGY EFFICIENCY ROADMAPS TO 2050 – CEMENT
Section 4 - Pathways Page 49 of 94
4.3 Baseline evolution - Principal Question 3
This section provides assessment of the range of questions under principal question 3: ‘How might thebaseline level of energy and emissions in the sectors change over the period to 2050?’
The market for cement in the UK is highly dependent on overall economic conditions. The recent recessionhas had a major impact on the cement market, with a significant decline in demand that has only partlybounced back during the economic recovery. Under stable economic conditions – growing in line with longterm UK economic forecasts and trends - the market for UK produced cement is anticipated to be broadly flat,with domestic producers able to maintain their position against competition from abroad, but any increaseddemand being supplied by increasing imports (cement imported by non-GB manufacturers currentlyaccounts for around 14% of the GB cement market). However, any future economic contraction, or above-trend growth could be anticipated to impact market demand, while a changing dynamic in internationalcompetition could enhance or degrade UK production and market share. Based on the above assumptionsand together with MPA, we have developed the following growth estimates for the different future scenarios:
· Current trends – 0.0% annual growth· Challenging world – 0.5% annual decline· Collaborative growth – 0.5% annual growth
4.4 Emission-Reduction Potential and Pathway Analysis – PrincipalQuestion 4 and 5
This section provides an assessment of the range of questions under principal questions 4 and 5:
· What is the potential to reduce emissions in these sectors beyond the baseline over the period to2050?
· What emissions pathways might each sector follow over the period to 2050, under differentscenarios?
For a detailed description of the pathways development and analysis, see appendix A.
4.4.1 Baseline - Business as Usual Pathway
Pathway Summary
The guiding principle for the BAU pathway was to outline a set of decarbonisation and energy savingsoptions that would be expected if current rates of efficiency improvement in the UK cement industrycontinued, and no significant intervention or outside support was provided to decarbonise the sector by 2050.options requiring no policy intervention (compared to today) were chosen, however the adoption of some ofthe options would require significant investment commitments.
Deployment for the Current Trends Scenario
Figure 12 shows the option deployment for the BAU pathway under the current trends scenario. This figureshows the different technical options on the left, followed by the estimated adoption rate in 2012 and theapplicability rate. The applicability rate indicates to what level this option is applicable to the sector, as apercentage of cement production capacity. To the right of the applicability rate is the actual deployment ofthe option over time to 2050, as well as the direct emissions and electricity savings from each option, and thecontribution of each option in 2050. The CO2 reductions are estimated based on the adoption rate,applicability rate and deployment.
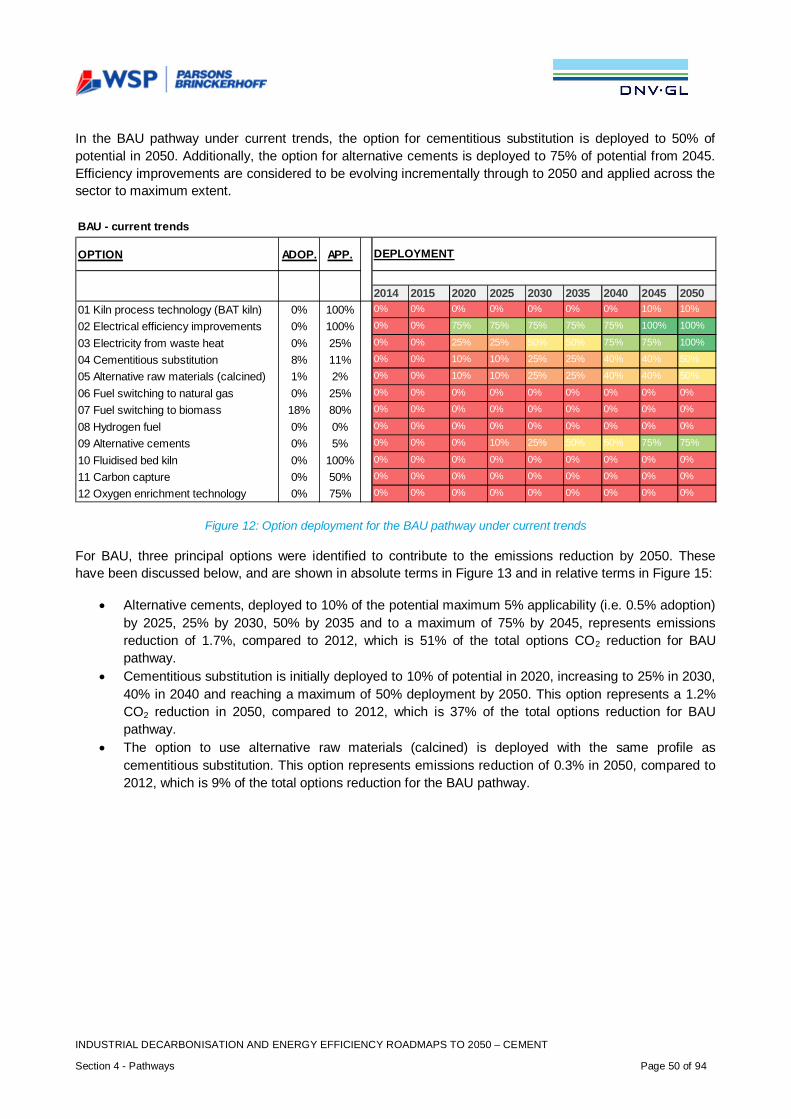
INDUSTRIAL DECARBONISATION AND ENERGY EFFICIENCY ROADMAPS TO 2050 – CEMENT
Section 4 - Pathways Page 50 of 94
In the BAU pathway under current trends, the option for cementitious substitution is deployed to 50% ofpotential in 2050. Additionally, the option for alternative cements is deployed to 75% of potential from 2045.Efficiency improvements are considered to be evolving incrementally through to 2050 and applied across thesector to maximum extent.
Figure 12: Option deployment for the BAU pathway under current trends
For BAU, three principal options were identified to contribute to the emissions reduction by 2050. Thesehave been discussed below, and are shown in absolute terms in Figure 13 and in relative terms in Figure 15:
· Alternative cements, deployed to 10% of the potential maximum 5% applicability (i.e. 0.5% adoption)by 2025, 25% by 2030, 50% by 2035 and to a maximum of 75% by 2045, represents emissionsreduction of 1.7%, compared to 2012, which is 51% of the total options CO2 reduction for BAUpathway.
· Cementitious substitution is initially deployed to 10% of potential in 2020, increasing to 25% in 2030,40% in 2040 and reaching a maximum of 50% deployment by 2050. This option represents a 1.2%CO2 reduction in 2050, compared to 2012, which is 37% of the total options reduction for BAUpathway.
· The option to use alternative raw materials (calcined) is deployed with the same profile ascementitious substitution. This option represents emissions reduction of 0.3% in 2050, compared to2012, which is 9% of the total options reduction for the BAU pathway.
BAU - current trends
OPTION ADOP. APP.
2014 2015 2020 2025 2030 2035 2040 2045 20500% 100% 0% 0% 0% 0% 0% 0% 0% 10% 10%
0% 100% 0% 0% 75% 75% 75% 75% 75% 100% 100%
0% 25% 0% 0% 25% 25% 50% 50% 75% 75% 100%
8% 11% 0% 0% 10% 10% 25% 25% 40% 40% 50%
1% 2% 0% 0% 10% 10% 25% 25% 40% 40% 50%
0% 25% 0% 0% 0% 0% 0% 0% 0% 0% 0%
18% 80% 0% 0% 0% 0% 0% 0% 0% 0% 0%
0% 0% 0% 0% 0% 0% 0% 0% 0% 0% 0%
0% 5% 0% 0% 0% 10% 25% 50% 50% 75% 75%
0% 100% 0% 0% 0% 0% 0% 0% 0% 0% 0%
0% 50% 0% 0% 0% 0% 0% 0% 0% 0% 0%
0% 75% 0% 0% 0% 0% 0% 0% 0% 0% 0%
01 Kiln process technology (BAT kiln)02 Electrical efficiency improvements
DEPLOYMENT
03 Electricity from waste heat04 Cementitious substitution05 Alternative raw materials (calcined)06 Fuel switching to natural gas07 Fuel switching to biomass08 Hydrogen fuel09 Alternative cements10 Fluidised bed kiln11 Carbon capture12 Oxygen enrichment technology
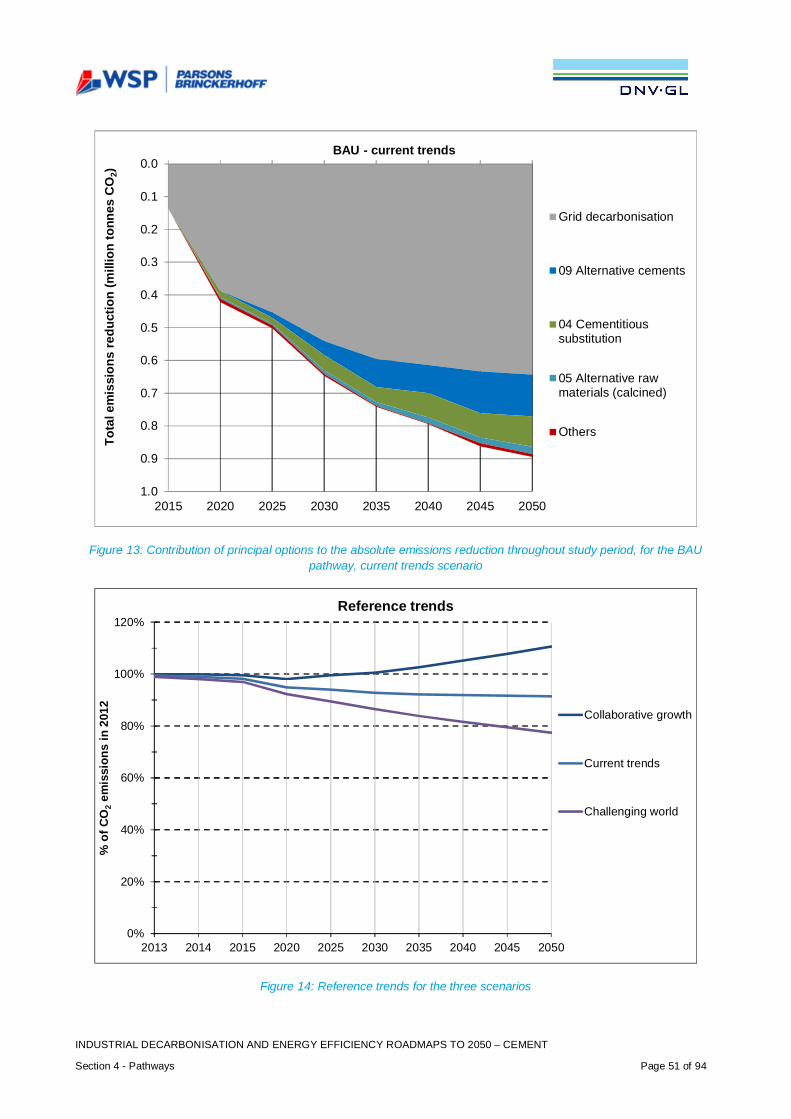
INDUSTRIAL DECARBONISATION AND ENERGY EFFICIENCY ROADMAPS TO 2050 – CEMENT
Section 4 - Pathways Page 51 of 94
Figure 13: Contribution of principal options to the absolute emissions reduction throughout study period, for the BAUpathway, current trends scenario
Figure 14: Reference trends for the three scenarios
0.0
0.1
0.2
0.3
0.4
0.5
0.6
0.7
0.8
0.9
1.02015 2020 2025 2030 2035 2040 2045 2050
Tota
lem
issi
ons
redu
ctio
n(m
illio
nto
nnes
CO
2)
BAU - current trends
Grid decarbonisation
09 Alternative cements
04 Cementitioussubstitution
05 Alternative rawmaterials (calcined)
Others
0%
20%
40%
60%
80%
100%
120%
2013 2014 2015 2020 2025 2030 2035 2040 2045 2050
%of
CO
2em
issi
ons
in20
12
Reference trends
Collaborative growth
Current trends
Challenging world
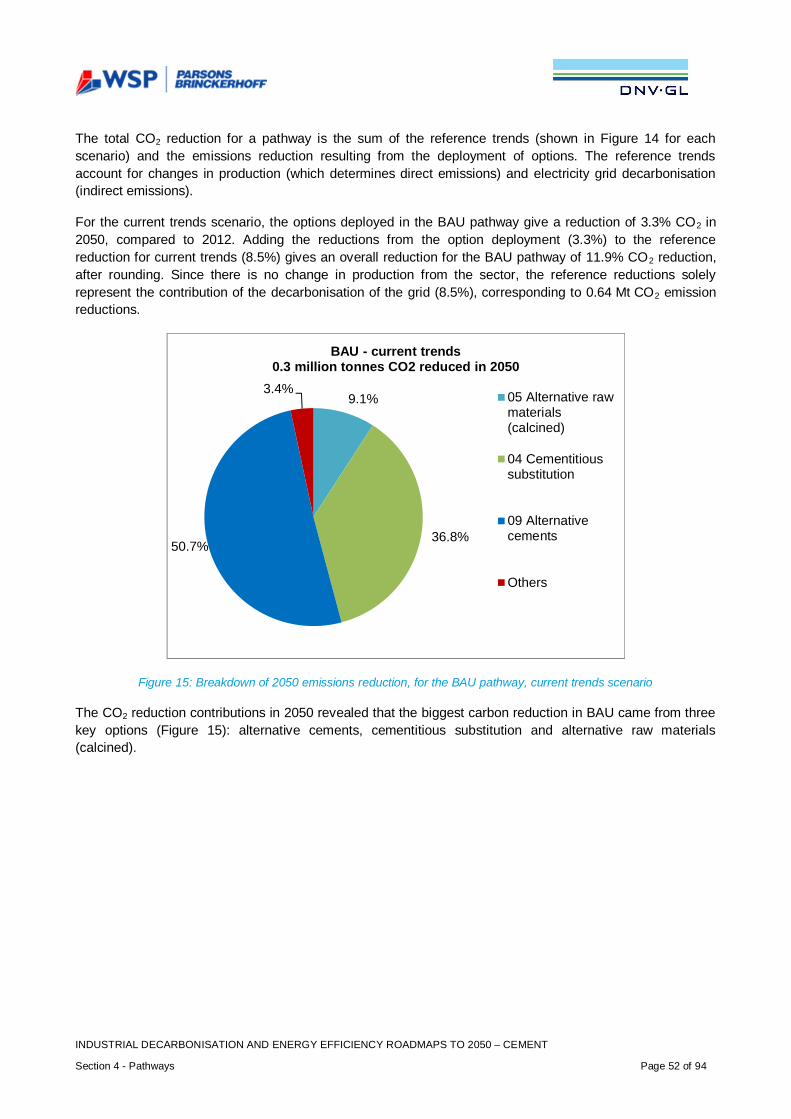
INDUSTRIAL DECARBONISATION AND ENERGY EFFICIENCY ROADMAPS TO 2050 – CEMENT
Section 4 - Pathways Page 52 of 94
The total CO2 reduction for a pathway is the sum of the reference trends (shown in Figure 14 for eachscenario) and the emissions reduction resulting from the deployment of options. The reference trendsaccount for changes in production (which determines direct emissions) and electricity grid decarbonisation(indirect emissions).
For the current trends scenario, the options deployed in the BAU pathway give a reduction of 3.3% CO2 in2050, compared to 2012. Adding the reductions from the option deployment (3.3%) to the referencereduction for current trends (8.5%) gives an overall reduction for the BAU pathway of 11.9% CO2 reduction,after rounding. Since there is no change in production from the sector, the reference reductions solelyrepresent the contribution of the decarbonisation of the grid (8.5%), corresponding to 0.64 Mt CO2 emissionreductions.
Figure 15: Breakdown of 2050 emissions reduction, for the BAU pathway, current trends scenario
The CO2 reduction contributions in 2050 revealed that the biggest carbon reduction in BAU came from threekey options (Figure 15): alternative cements, cementitious substitution and alternative raw materials(calcined).
9.1%
36.8%50.7%
3.4%
BAU - current trends0.3 million tonnes CO2 reduced in 2050
05 Alternative rawmaterials(calcined)
04 Cementitioussubstitution
09 Alternativecements
Others
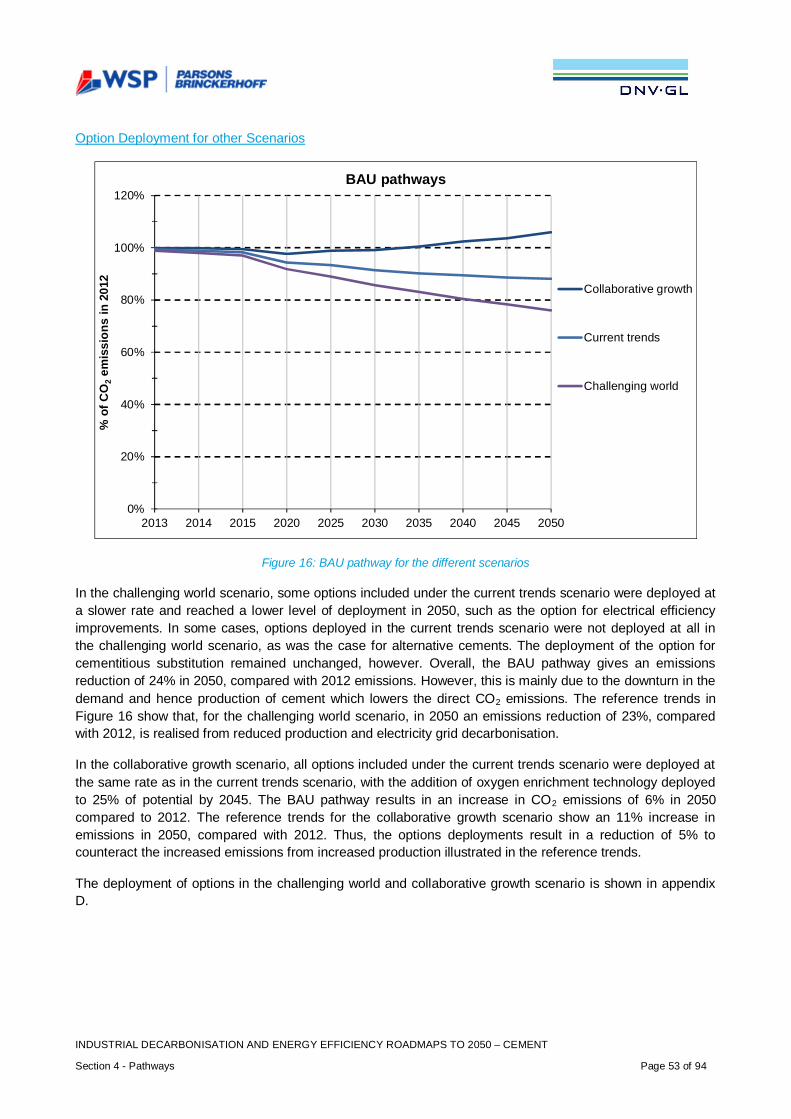
INDUSTRIAL DECARBONISATION AND ENERGY EFFICIENCY ROADMAPS TO 2050 – CEMENT
Section 4 - Pathways Page 53 of 94
Option Deployment for other Scenarios
Figure 16: BAU pathway for the different scenarios
In the challenging world scenario, some options included under the current trends scenario were deployed ata slower rate and reached a lower level of deployment in 2050, such as the option for electrical efficiencyimprovements. In some cases, options deployed in the current trends scenario were not deployed at all inthe challenging world scenario, as was the case for alternative cements. The deployment of the option forcementitious substitution remained unchanged, however. Overall, the BAU pathway gives an emissionsreduction of 24% in 2050, compared with 2012 emissions. However, this is mainly due to the downturn in thedemand and hence production of cement which lowers the direct CO2 emissions. The reference trends inFigure 16 show that, for the challenging world scenario, in 2050 an emissions reduction of 23%, comparedwith 2012, is realised from reduced production and electricity grid decarbonisation.
In the collaborative growth scenario, all options included under the current trends scenario were deployed atthe same rate as in the current trends scenario, with the addition of oxygen enrichment technology deployedto 25% of potential by 2045. The BAU pathway results in an increase in CO2 emissions of 6% in 2050compared to 2012. The reference trends for the collaborative growth scenario show an 11% increase inemissions in 2050, compared with 2012. Thus, the options deployments result in a reduction of 5% tocounteract the increased emissions from increased production illustrated in the reference trends.
The deployment of options in the challenging world and collaborative growth scenario is shown in appendixD.
0%
20%
40%
60%
80%
100%
120%
2013 2014 2015 2020 2025 2030 2035 2040 2045 2050
%of
CO
2em
issi
ons
in20
12
BAU pathways
Collaborative growth
Current trends
Challenging world
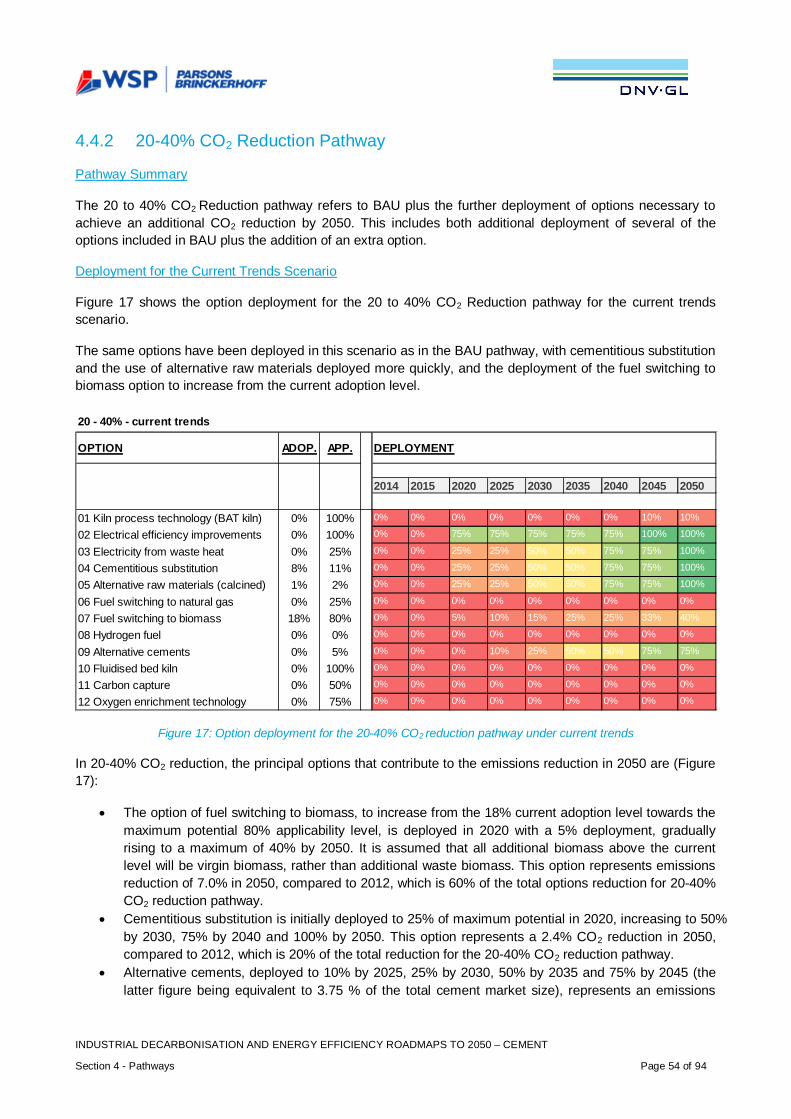
INDUSTRIAL DECARBONISATION AND ENERGY EFFICIENCY ROADMAPS TO 2050 – CEMENT
Section 4 - Pathways Page 54 of 94
4.4.2 20-40% CO2 Reduction Pathway
Pathway Summary
The 20 to 40% CO2 Reduction pathway refers to BAU plus the further deployment of options necessary toachieve an additional CO2 reduction by 2050. This includes both additional deployment of several of theoptions included in BAU plus the addition of an extra option.
Deployment for the Current Trends Scenario
Figure 17 shows the option deployment for the 20 to 40% CO2 Reduction pathway for the current trendsscenario.
The same options have been deployed in this scenario as in the BAU pathway, with cementitious substitutionand the use of alternative raw materials deployed more quickly, and the deployment of the fuel switching tobiomass option to increase from the current adoption level.
Figure 17: Option deployment for the 20-40% CO2 reduction pathway under current trends
In 20-40% CO2 reduction, the principal options that contribute to the emissions reduction in 2050 are (Figure17):
· The option of fuel switching to biomass, to increase from the 18% current adoption level towards themaximum potential 80% applicability level, is deployed in 2020 with a 5% deployment, graduallyrising to a maximum of 40% by 2050. It is assumed that all additional biomass above the currentlevel will be virgin biomass, rather than additional waste biomass. This option represents emissionsreduction of 7.0% in 2050, compared to 2012, which is 60% of the total options reduction for 20-40%CO2 reduction pathway.
· Cementitious substitution is initially deployed to 25% of maximum potential in 2020, increasing to 50%by 2030, 75% by 2040 and 100% by 2050. This option represents a 2.4% CO2 reduction in 2050,compared to 2012, which is 20% of the total reduction for the 20-40% CO2 reduction pathway.
· Alternative cements, deployed to 10% by 2025, 25% by 2030, 50% by 2035 and 75% by 2045 (thelatter figure being equivalent to 3.75 % of the total cement market size), represents an emissions
20 - 40% - current trends
OPTION ADOP. APP.
2014 2015 2020 2025 2030 2035 2040 2045 2050
0% 100% 0% 0% 0% 0% 0% 0% 0% 10% 10%
0% 100% 0% 0% 75% 75% 75% 75% 75% 100% 100%
0% 25% 0% 0% 25% 25% 50% 50% 75% 75% 100%
8% 11% 0% 0% 25% 25% 50% 50% 75% 75% 100%
1% 2% 0% 0% 25% 25% 50% 50% 75% 75% 100%
0% 25% 0% 0% 0% 0% 0% 0% 0% 0% 0%
18% 80% 0% 0% 5% 10% 15% 25% 25% 33% 40%
0% 0% 0% 0% 0% 0% 0% 0% 0% 0% 0%
0% 5% 0% 0% 0% 10% 25% 50% 50% 75% 75%
0% 100% 0% 0% 0% 0% 0% 0% 0% 0% 0%
0% 50% 0% 0% 0% 0% 0% 0% 0% 0% 0%
0% 75% 0% 0% 0% 0% 0% 0% 0% 0% 0%
DEPLOYMENT
01 Kiln process technology (BAT kiln)02 Electrical efficiency improvements03 Electricity from waste heat04 Cementitious substitution05 Alternative raw materials (calcined)06 Fuel switching to natural gas07 Fuel switching to biomass08 Hydrogen fuel09 Alternative cements10 Fluidised bed kiln11 Carbon capture12 Oxygen enrichment technology
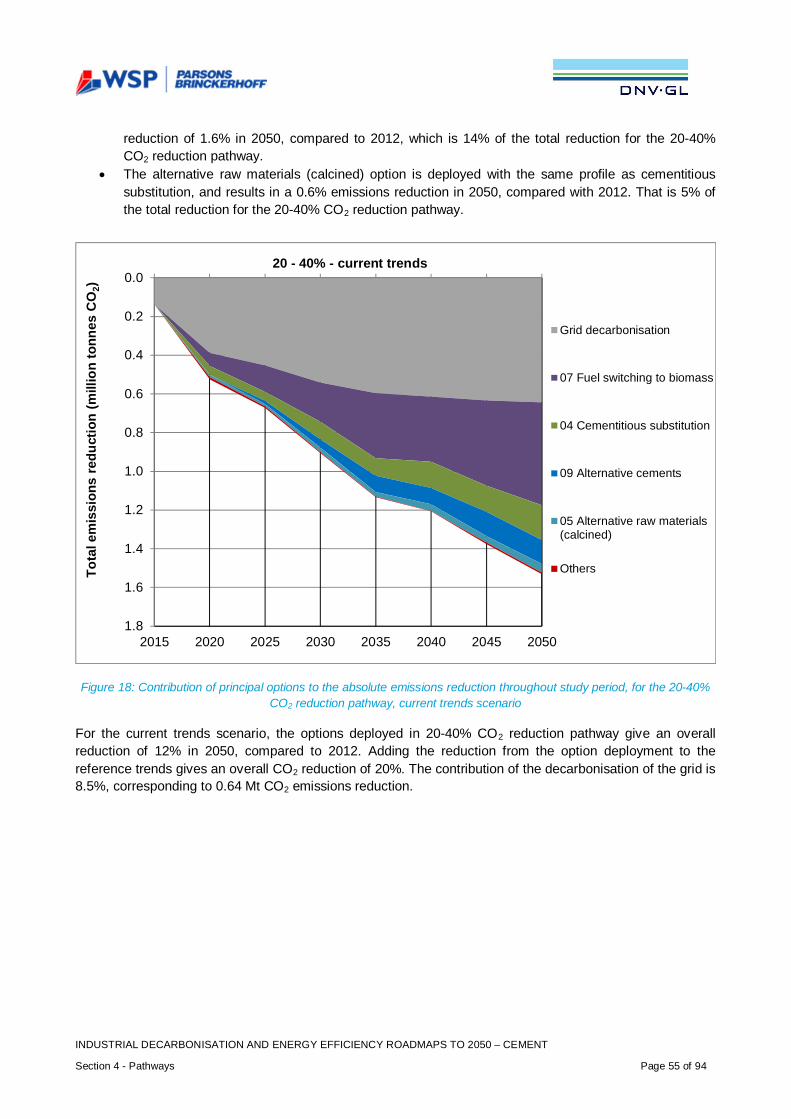
INDUSTRIAL DECARBONISATION AND ENERGY EFFICIENCY ROADMAPS TO 2050 – CEMENT
Section 4 - Pathways Page 55 of 94
reduction of 1.6% in 2050, compared to 2012, which is 14% of the total reduction for the 20-40%CO2 reduction pathway.
· The alternative raw materials (calcined) option is deployed with the same profile as cementitioussubstitution, and results in a 0.6% emissions reduction in 2050, compared with 2012. That is 5% ofthe total reduction for the 20-40% CO2 reduction pathway.
Figure 18: Contribution of principal options to the absolute emissions reduction throughout study period, for the 20-40%CO2 reduction pathway, current trends scenario
For the current trends scenario, the options deployed in 20-40% CO2 reduction pathway give an overallreduction of 12% in 2050, compared to 2012. Adding the reduction from the option deployment to thereference trends gives an overall CO2 reduction of 20%. The contribution of the decarbonisation of the grid is8.5%, corresponding to 0.64 Mt CO2 emissions reduction.
0.0
0.2
0.4
0.6
0.8
1.0
1.2
1.4
1.6
1.82015 2020 2025 2030 2035 2040 2045 2050
Tota
lem
issi
ons
redu
ctio
n(m
illio
nto
nnes
CO
2)
20 - 40% - current trends
Grid decarbonisation
07 Fuel switching to biomass
04 Cementitious substitution
09 Alternative cements
05 Alternative raw materials(calcined)
Others
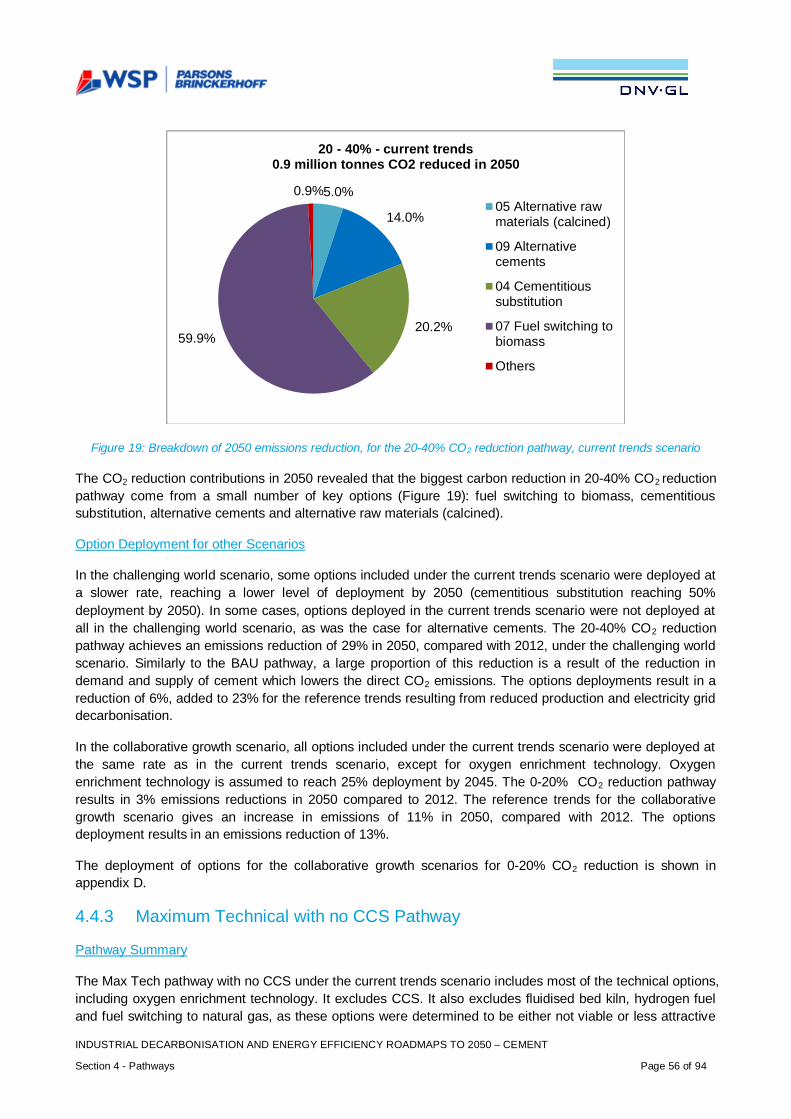
INDUSTRIAL DECARBONISATION AND ENERGY EFFICIENCY ROADMAPS TO 2050 – CEMENT
Section 4 - Pathways Page 56 of 94
Figure 19: Breakdown of 2050 emissions reduction, for the 20-40% CO2 reduction pathway, current trends scenario
The CO2 reduction contributions in 2050 revealed that the biggest carbon reduction in 20-40% CO2 reductionpathway come from a small number of key options (Figure 19): fuel switching to biomass, cementitioussubstitution, alternative cements and alternative raw materials (calcined).
Option Deployment for other Scenarios
In the challenging world scenario, some options included under the current trends scenario were deployed ata slower rate, reaching a lower level of deployment by 2050 (cementitious substitution reaching 50%deployment by 2050). In some cases, options deployed in the current trends scenario were not deployed atall in the challenging world scenario, as was the case for alternative cements. The 20-40% CO2 reductionpathway achieves an emissions reduction of 29% in 2050, compared with 2012, under the challenging worldscenario. Similarly to the BAU pathway, a large proportion of this reduction is a result of the reduction indemand and supply of cement which lowers the direct CO2 emissions. The options deployments result in areduction of 6%, added to 23% for the reference trends resulting from reduced production and electricity griddecarbonisation.
In the collaborative growth scenario, all options included under the current trends scenario were deployed atthe same rate as in the current trends scenario, except for oxygen enrichment technology. Oxygenenrichment technology is assumed to reach 25% deployment by 2045. The 0-20% CO2 reduction pathwayresults in 3% emissions reductions in 2050 compared to 2012. The reference trends for the collaborativegrowth scenario gives an increase in emissions of 11% in 2050, compared with 2012. The optionsdeployment results in an emissions reduction of 13%.
The deployment of options for the collaborative growth scenarios for 0-20% CO2 reduction is shown inappendix D.
4.4.3 Maximum Technical with no CCS Pathway
Pathway Summary
The Max Tech pathway with no CCS under the current trends scenario includes most of the technical options,including oxygen enrichment technology. It excludes CCS. It also excludes fluidised bed kiln, hydrogen fueland fuel switching to natural gas, as these options were determined to be either not viable or less attractive
5.0%
14.0%
20.2%59.9%
0.9%
20 - 40% - current trends0.9 million tonnes CO2 reduced in 2050
05 Alternative rawmaterials (calcined)
09 Alternativecements
04 Cementitioussubstitution
07 Fuel switching tobiomass
Others
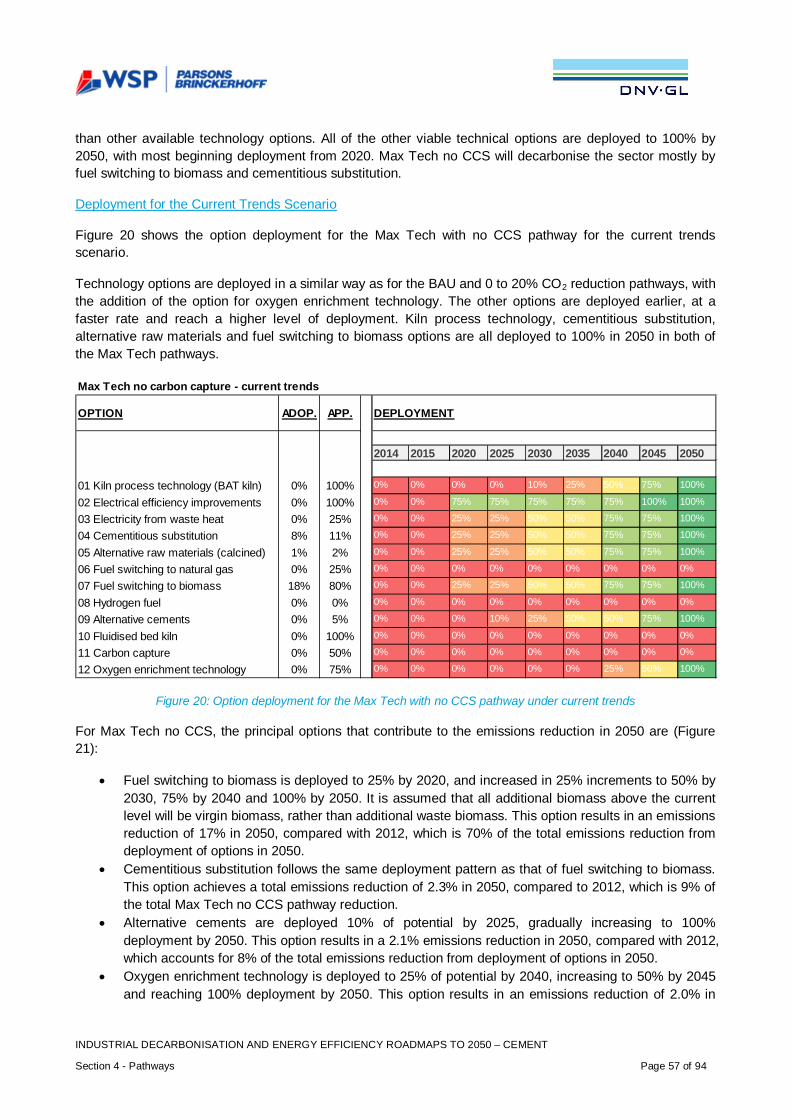
INDUSTRIAL DECARBONISATION AND ENERGY EFFICIENCY ROADMAPS TO 2050 – CEMENT
Section 4 - Pathways Page 57 of 94
than other available technology options. All of the other viable technical options are deployed to 100% by2050, with most beginning deployment from 2020. Max Tech no CCS will decarbonise the sector mostly byfuel switching to biomass and cementitious substitution.
Deployment for the Current Trends Scenario
Figure 20 shows the option deployment for the Max Tech with no CCS pathway for the current trendsscenario.
Technology options are deployed in a similar way as for the BAU and 0 to 20% CO2 reduction pathways, withthe addition of the option for oxygen enrichment technology. The other options are deployed earlier, at afaster rate and reach a higher level of deployment. Kiln process technology, cementitious substitution,alternative raw materials and fuel switching to biomass options are all deployed to 100% in 2050 in both ofthe Max Tech pathways.
Figure 20: Option deployment for the Max Tech with no CCS pathway under current trends
For Max Tech no CCS, the principal options that contribute to the emissions reduction in 2050 are (Figure21):
· Fuel switching to biomass is deployed to 25% by 2020, and increased in 25% increments to 50% by2030, 75% by 2040 and 100% by 2050. It is assumed that all additional biomass above the currentlevel will be virgin biomass, rather than additional waste biomass. This option results in an emissionsreduction of 17% in 2050, compared with 2012, which is 70% of the total emissions reduction fromdeployment of options in 2050.
· Cementitious substitution follows the same deployment pattern as that of fuel switching to biomass.This option achieves a total emissions reduction of 2.3% in 2050, compared to 2012, which is 9% ofthe total Max Tech no CCS pathway reduction.
· Alternative cements are deployed 10% of potential by 2025, gradually increasing to 100%deployment by 2050. This option results in a 2.1% emissions reduction in 2050, compared with 2012,which accounts for 8% of the total emissions reduction from deployment of options in 2050.
· Oxygen enrichment technology is deployed to 25% of potential by 2040, increasing to 50% by 2045and reaching 100% deployment by 2050. This option results in an emissions reduction of 2.0% in
Max Tech no carbon capture - current trends
OPTION ADOP. APP.
2014 2015 2020 2025 2030 2035 2040 2045 2050
0% 100% 0% 0% 0% 0% 10% 25% 50% 75% 100%
0% 100% 0% 0% 75% 75% 75% 75% 75% 100% 100%
0% 25% 0% 0% 25% 25% 50% 50% 75% 75% 100%
8% 11% 0% 0% 25% 25% 50% 50% 75% 75% 100%
1% 2% 0% 0% 25% 25% 50% 50% 75% 75% 100%
0% 25% 0% 0% 0% 0% 0% 0% 0% 0% 0%
18% 80% 0% 0% 25% 25% 50% 50% 75% 75% 100%
0% 0% 0% 0% 0% 0% 0% 0% 0% 0% 0%
0% 5% 0% 0% 0% 10% 25% 50% 50% 75% 100%
0% 100% 0% 0% 0% 0% 0% 0% 0% 0% 0%
0% 50% 0% 0% 0% 0% 0% 0% 0% 0% 0%
0% 75% 0% 0% 0% 0% 0% 0% 25% 50% 100%
DEPLOYMENT
01 Kiln process technology (BAT kiln)02 Electrical efficiency improvements03 Electricity from waste heat04 Cementitious substitution05 Alternative raw materials (calcined)06 Fuel switching to natural gas07 Fuel switching to biomass08 Hydrogen fuel09 Alternative cements10 Fluidised bed kiln11 Carbon capture12 Oxygen enrichment technology
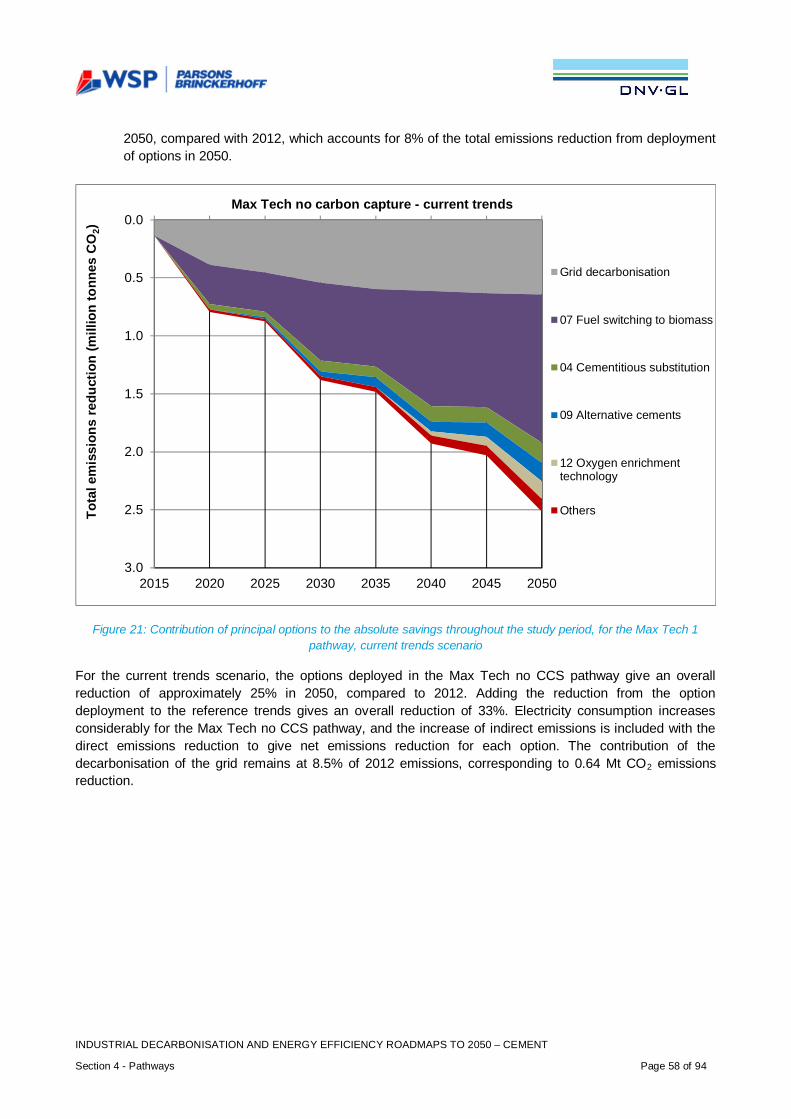
INDUSTRIAL DECARBONISATION AND ENERGY EFFICIENCY ROADMAPS TO 2050 – CEMENT
Section 4 - Pathways Page 58 of 94
2050, compared with 2012, which accounts for 8% of the total emissions reduction from deploymentof options in 2050.
Figure 21: Contribution of principal options to the absolute savings throughout the study period, for the Max Tech 1pathway, current trends scenario
For the current trends scenario, the options deployed in the Max Tech no CCS pathway give an overallreduction of approximately 25% in 2050, compared to 2012. Adding the reduction from the optiondeployment to the reference trends gives an overall reduction of 33%. Electricity consumption increasesconsiderably for the Max Tech no CCS pathway, and the increase of indirect emissions is included with thedirect emissions reduction to give net emissions reduction for each option. The contribution of thedecarbonisation of the grid remains at 8.5% of 2012 emissions, corresponding to 0.64 Mt CO2 emissionsreduction.
0.0
0.5
1.0
1.5
2.0
2.5
3.02015 2020 2025 2030 2035 2040 2045 2050
Tota
lem
issi
ons
redu
ctio
n(m
illio
nto
nnes
CO
2)
Max Tech no carbon capture - current trends
Grid decarbonisation
07 Fuel switching to biomass
04 Cementitious substitution
09 Alternative cements
12 Oxygen enrichmenttechnology
Others
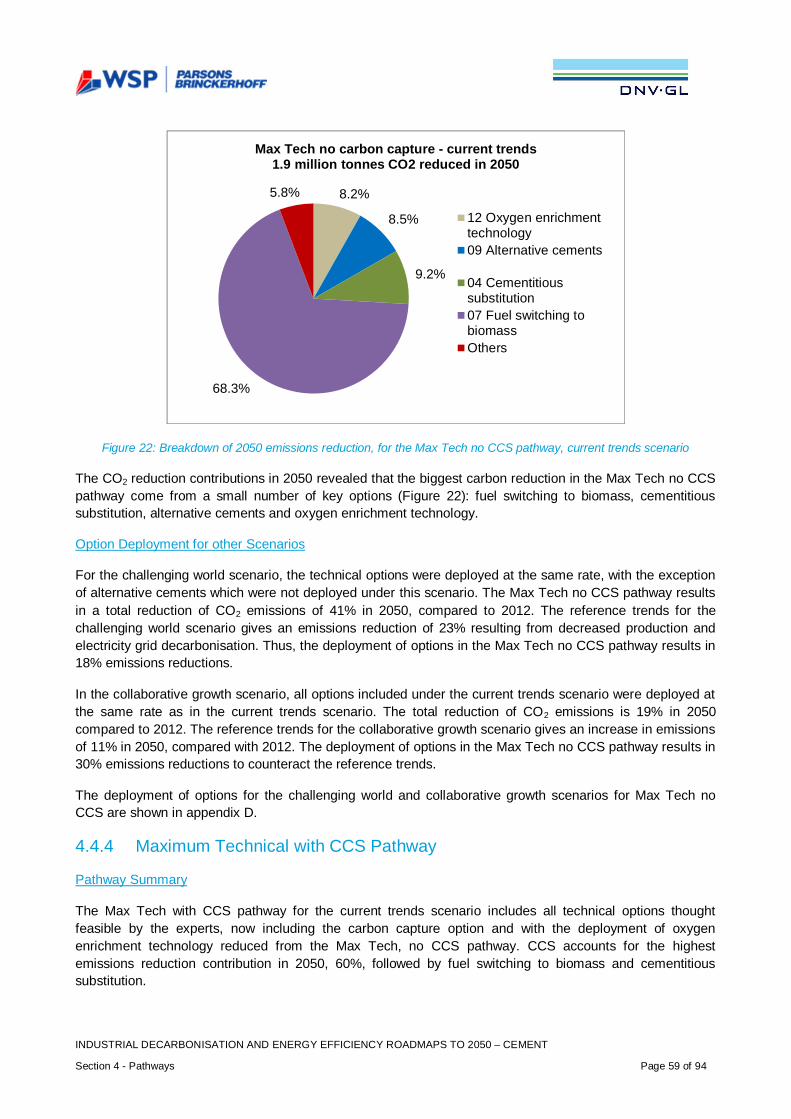
INDUSTRIAL DECARBONISATION AND ENERGY EFFICIENCY ROADMAPS TO 2050 – CEMENT
Section 4 - Pathways Page 59 of 94
Figure 22: Breakdown of 2050 emissions reduction, for the Max Tech no CCS pathway, current trends scenario
The CO2 reduction contributions in 2050 revealed that the biggest carbon reduction in the Max Tech no CCSpathway come from a small number of key options (Figure 22): fuel switching to biomass, cementitioussubstitution, alternative cements and oxygen enrichment technology.
Option Deployment for other Scenarios
For the challenging world scenario, the technical options were deployed at the same rate, with the exceptionof alternative cements which were not deployed under this scenario. The Max Tech no CCS pathway resultsin a total reduction of CO2 emissions of 41% in 2050, compared to 2012. The reference trends for thechallenging world scenario gives an emissions reduction of 23% resulting from decreased production andelectricity grid decarbonisation. Thus, the deployment of options in the Max Tech no CCS pathway results in18% emissions reductions.
In the collaborative growth scenario, all options included under the current trends scenario were deployed atthe same rate as in the current trends scenario. The total reduction of CO2 emissions is 19% in 2050compared to 2012. The reference trends for the collaborative growth scenario gives an increase in emissionsof 11% in 2050, compared with 2012. The deployment of options in the Max Tech no CCS pathway results in30% emissions reductions to counteract the reference trends.
The deployment of options for the challenging world and collaborative growth scenarios for Max Tech noCCS are shown in appendix D.
4.4.4 Maximum Technical with CCS Pathway
Pathway Summary
The Max Tech with CCS pathway for the current trends scenario includes all technical options thoughtfeasible by the experts, now including the carbon capture option and with the deployment of oxygenenrichment technology reduced from the Max Tech, no CCS pathway. CCS accounts for the highestemissions reduction contribution in 2050, 60%, followed by fuel switching to biomass and cementitioussubstitution.
8.2%
8.5%
9.2%
68.3%
5.8%
Max Tech no carbon capture - current trends1.9 million tonnes CO2 reduced in 2050
12 Oxygen enrichmenttechnology09 Alternative cements
04 Cementitioussubstitution07 Fuel switching tobiomassOthers
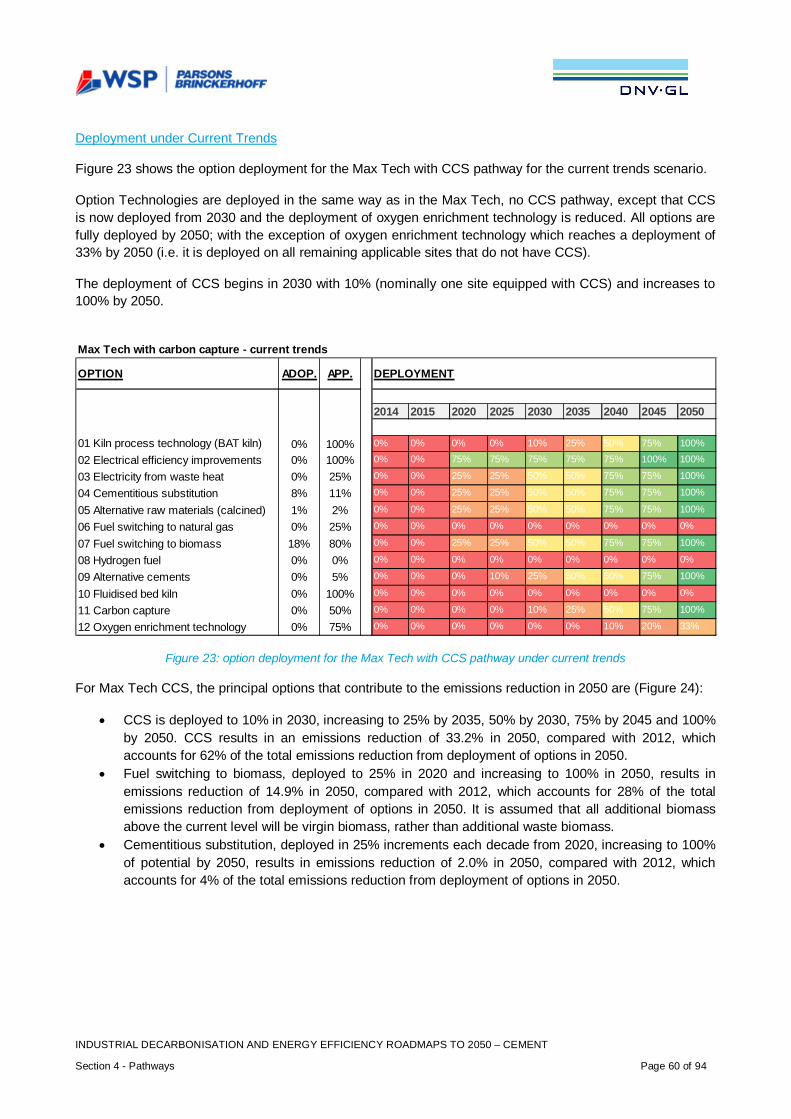
INDUSTRIAL DECARBONISATION AND ENERGY EFFICIENCY ROADMAPS TO 2050 – CEMENT
Section 4 - Pathways Page 60 of 94
Deployment under Current Trends
Figure 23 shows the option deployment for the Max Tech with CCS pathway for the current trends scenario.
Option Technologies are deployed in the same way as in the Max Tech, no CCS pathway, except that CCSis now deployed from 2030 and the deployment of oxygen enrichment technology is reduced. All options arefully deployed by 2050; with the exception of oxygen enrichment technology which reaches a deployment of33% by 2050 (i.e. it is deployed on all remaining applicable sites that do not have CCS).
The deployment of CCS begins in 2030 with 10% (nominally one site equipped with CCS) and increases to100% by 2050.
Figure 23: option deployment for the Max Tech with CCS pathway under current trends
For Max Tech CCS, the principal options that contribute to the emissions reduction in 2050 are (Figure 24):
· CCS is deployed to 10% in 2030, increasing to 25% by 2035, 50% by 2030, 75% by 2045 and 100%by 2050. CCS results in an emissions reduction of 33.2% in 2050, compared with 2012, whichaccounts for 62% of the total emissions reduction from deployment of options in 2050.
· Fuel switching to biomass, deployed to 25% in 2020 and increasing to 100% in 2050, results inemissions reduction of 14.9% in 2050, compared with 2012, which accounts for 28% of the totalemissions reduction from deployment of options in 2050. It is assumed that all additional biomassabove the current level will be virgin biomass, rather than additional waste biomass.
· Cementitious substitution, deployed in 25% increments each decade from 2020, increasing to 100%of potential by 2050, results in emissions reduction of 2.0% in 2050, compared with 2012, whichaccounts for 4% of the total emissions reduction from deployment of options in 2050.
Max Tech with carbon capture - current trends
OPTION ADOP. APP.
2014 2015 2020 2025 2030 2035 2040 2045 2050
0% 100% 0% 0% 0% 0% 10% 25% 50% 75% 100%
0% 100% 0% 0% 75% 75% 75% 75% 75% 100% 100%
0% 25% 0% 0% 25% 25% 50% 50% 75% 75% 100%
8% 11% 0% 0% 25% 25% 50% 50% 75% 75% 100%
1% 2% 0% 0% 25% 25% 50% 50% 75% 75% 100%
0% 25% 0% 0% 0% 0% 0% 0% 0% 0% 0%
18% 80% 0% 0% 25% 25% 50% 50% 75% 75% 100%
0% 0% 0% 0% 0% 0% 0% 0% 0% 0% 0%
0% 5% 0% 0% 0% 10% 25% 50% 50% 75% 100%
0% 100% 0% 0% 0% 0% 0% 0% 0% 0% 0%
0% 50% 0% 0% 0% 0% 10% 25% 50% 75% 100%
0% 75% 0% 0% 0% 0% 0% 0% 10% 20% 33%
DEPLOYMENT
01 Kiln process technology (BAT kiln)02 Electrical efficiency improvements03 Electricity from waste heat04 Cementitious substitution05 Alternative raw materials (calcined)06 Fuel switching to natural gas07 Fuel switching to biomass08 Hydrogen fuel09 Alternative cements10 Fluidised bed kiln11 Carbon capture12 Oxygen enrichment technology
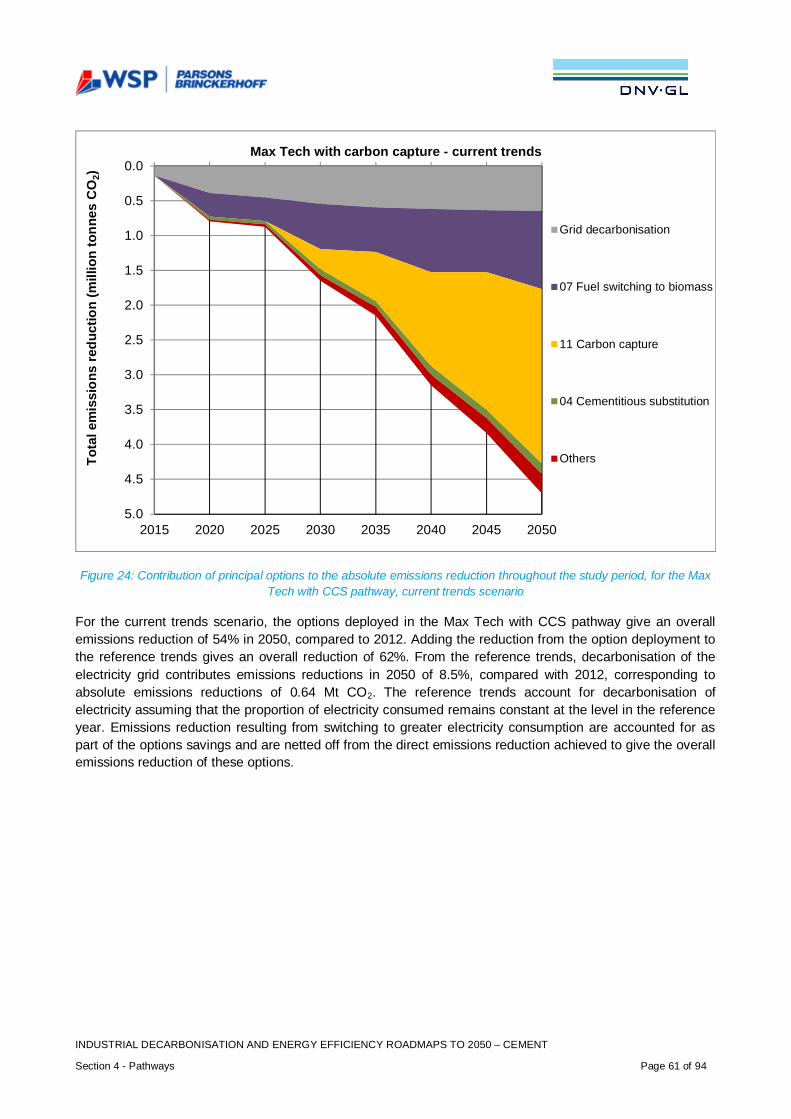
INDUSTRIAL DECARBONISATION AND ENERGY EFFICIENCY ROADMAPS TO 2050 – CEMENT
Section 4 - Pathways Page 61 of 94
Figure 24: Contribution of principal options to the absolute emissions reduction throughout the study period, for the MaxTech with CCS pathway, current trends scenario
For the current trends scenario, the options deployed in the Max Tech with CCS pathway give an overallemissions reduction of 54% in 2050, compared to 2012. Adding the reduction from the option deployment tothe reference trends gives an overall reduction of 62%. From the reference trends, decarbonisation of theelectricity grid contributes emissions reductions in 2050 of 8.5%, compared with 2012, corresponding toabsolute emissions reductions of 0.64 Mt CO2. The reference trends account for decarbonisation ofelectricity assuming that the proportion of electricity consumed remains constant at the level in the referenceyear. Emissions reduction resulting from switching to greater electricity consumption are accounted for aspart of the options savings and are netted off from the direct emissions reduction achieved to give the overallemissions reduction of these options.
0.0
0.5
1.0
1.5
2.0
2.5
3.0
3.5
4.0
4.5
5.02015 2020 2025 2030 2035 2040 2045 2050
Tota
lem
issi
ons
redu
ctio
n(m
illio
nto
nnes
CO
2)
Max Tech with carbon capture - current trends
Grid decarbonisation
07 Fuel switching to biomass
11 Carbon capture
04 Cementitious substitution
Others
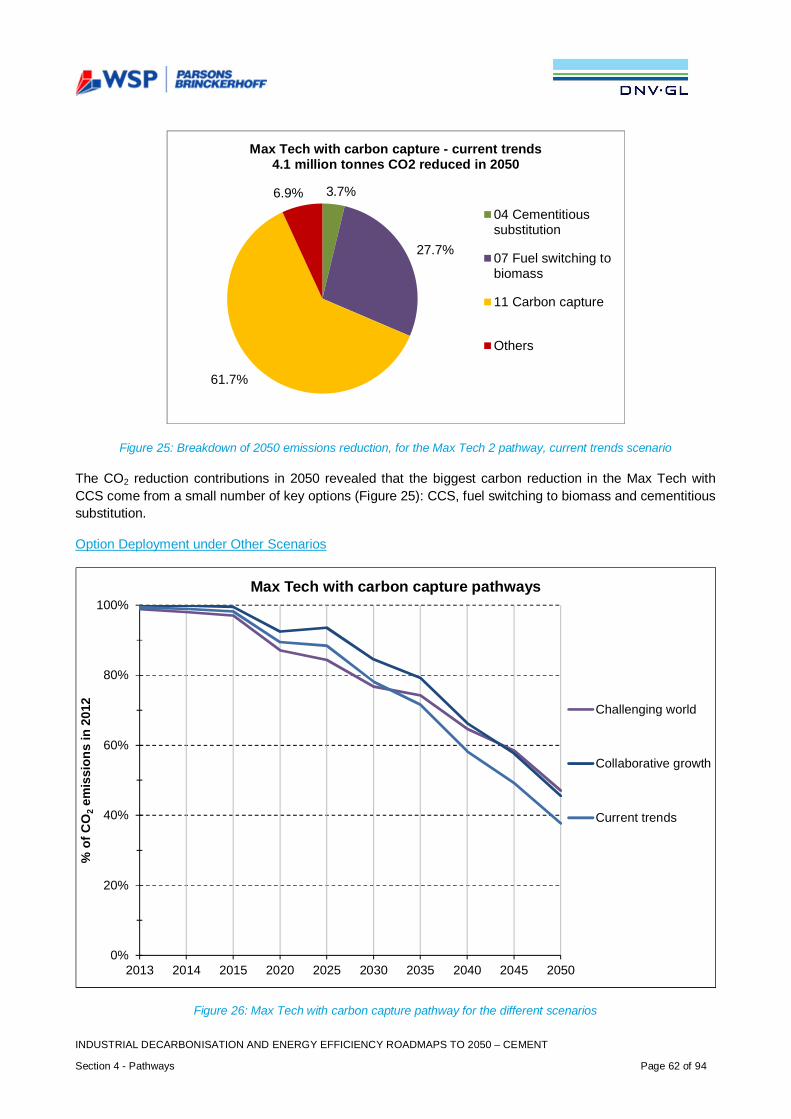
INDUSTRIAL DECARBONISATION AND ENERGY EFFICIENCY ROADMAPS TO 2050 – CEMENT
Section 4 - Pathways Page 62 of 94
Figure 25: Breakdown of 2050 emissions reduction, for the Max Tech 2 pathway, current trends scenario
The CO2 reduction contributions in 2050 revealed that the biggest carbon reduction in the Max Tech withCCS come from a small number of key options (Figure 25): CCS, fuel switching to biomass and cementitioussubstitution.
Option Deployment under Other Scenarios
Figure 26: Max Tech with carbon capture pathway for the different scenarios
3.7%
27.7%
61.7%
6.9%
Max Tech with carbon capture - current trends4.1 million tonnes CO2 reduced in 2050
04 Cementitioussubstitution
07 Fuel switching tobiomass
11 Carbon capture
Others
0%
20%
40%
60%
80%
100%
2013 2014 2015 2020 2025 2030 2035 2040 2045 2050
%of
CO
2em
issi
ons
in20
12
Max Tech with carbon capture pathways
Challenging world
Collaborative growth
Current trends
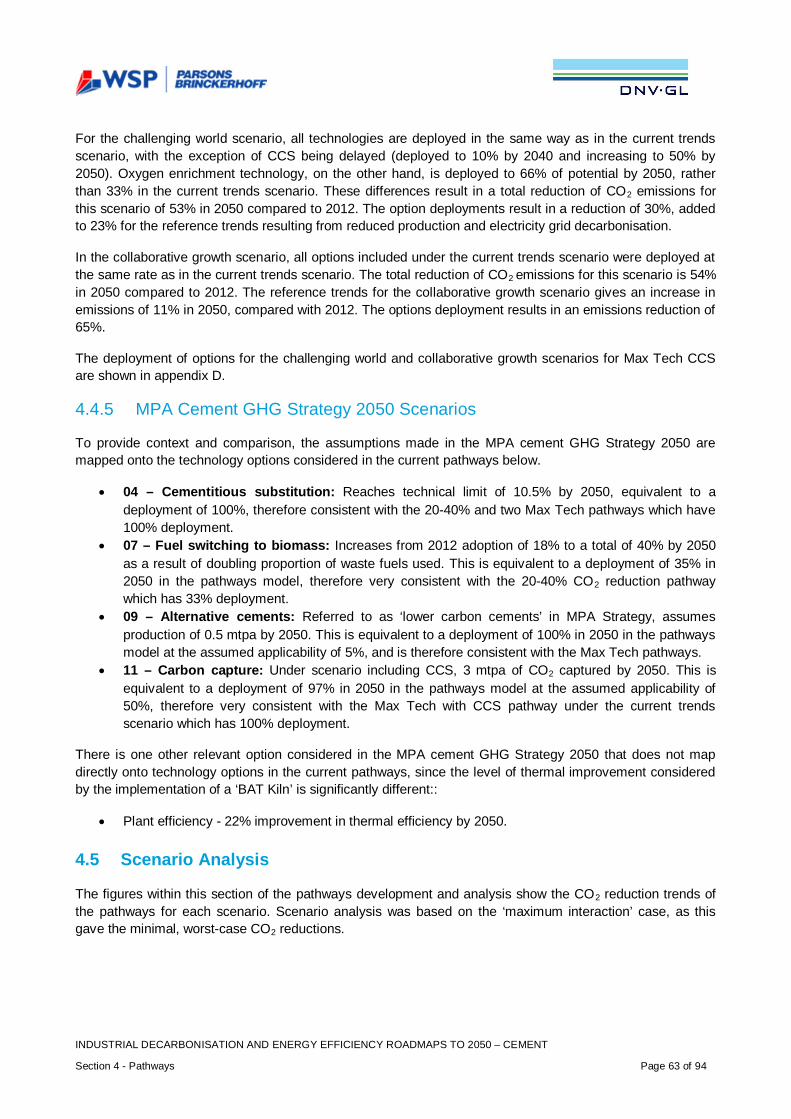
INDUSTRIAL DECARBONISATION AND ENERGY EFFICIENCY ROADMAPS TO 2050 – CEMENT
Section 4 - Pathways Page 63 of 94
For the challenging world scenario, all technologies are deployed in the same way as in the current trendsscenario, with the exception of CCS being delayed (deployed to 10% by 2040 and increasing to 50% by2050). Oxygen enrichment technology, on the other hand, is deployed to 66% of potential by 2050, ratherthan 33% in the current trends scenario. These differences result in a total reduction of CO2 emissions forthis scenario of 53% in 2050 compared to 2012. The option deployments result in a reduction of 30%, addedto 23% for the reference trends resulting from reduced production and electricity grid decarbonisation.
In the collaborative growth scenario, all options included under the current trends scenario were deployed atthe same rate as in the current trends scenario. The total reduction of CO2 emissions for this scenario is 54%in 2050 compared to 2012. The reference trends for the collaborative growth scenario gives an increase inemissions of 11% in 2050, compared with 2012. The options deployment results in an emissions reduction of65%.
The deployment of options for the challenging world and collaborative growth scenarios for Max Tech CCSare shown in appendix D.
4.4.5 MPA Cement GHG Strategy 2050 Scenarios
To provide context and comparison, the assumptions made in the MPA cement GHG Strategy 2050 aremapped onto the technology options considered in the current pathways below.
· 04 – Cementitious substitution: Reaches technical limit of 10.5% by 2050, equivalent to adeployment of 100%, therefore consistent with the 20-40% and two Max Tech pathways which have100% deployment.
· 07 – Fuel switching to biomass: Increases from 2012 adoption of 18% to a total of 40% by 2050as a result of doubling proportion of waste fuels used. This is equivalent to a deployment of 35% in2050 in the pathways model, therefore very consistent with the 20-40% CO2 reduction pathwaywhich has 33% deployment.
· 09 – Alternative cements: Referred to as ‘lower carbon cements’ in MPA Strategy, assumesproduction of 0.5 mtpa by 2050. This is equivalent to a deployment of 100% in 2050 in the pathwaysmodel at the assumed applicability of 5%, and is therefore consistent with the Max Tech pathways.
· 11 – Carbon capture: Under scenario including CCS, 3 mtpa of CO2 captured by 2050. This isequivalent to a deployment of 97% in 2050 in the pathways model at the assumed applicability of50%, therefore very consistent with the Max Tech with CCS pathway under the current trendsscenario which has 100% deployment.
There is one other relevant option considered in the MPA cement GHG Strategy 2050 that does not mapdirectly onto technology options in the current pathways, since the level of thermal improvement consideredby the implementation of a ‘BAT Kiln’ is significantly different::
· Plant efficiency - 22% improvement in thermal efficiency by 2050.
4.5 Scenario Analysis
The figures within this section of the pathways development and analysis show the CO2 reduction trends ofthe pathways for each scenario. Scenario analysis was based on the ‘maximum interaction’ case, as thisgave the minimal, worst-case CO2 reductions.
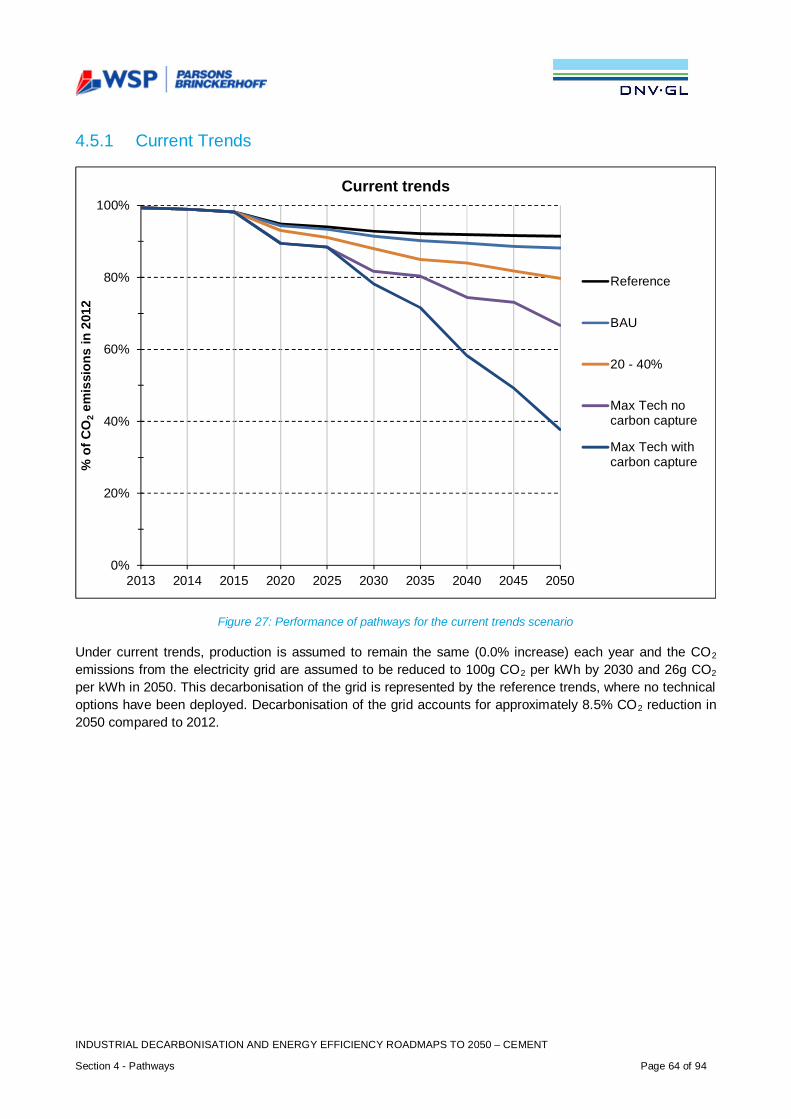
INDUSTRIAL DECARBONISATION AND ENERGY EFFICIENCY ROADMAPS TO 2050 – CEMENT
Section 4 - Pathways Page 64 of 94
4.5.1 Current Trends
Figure 27: Performance of pathways for the current trends scenario
Under current trends, production is assumed to remain the same (0.0% increase) each year and the CO2
emissions from the electricity grid are assumed to be reduced to 100g CO2 per kWh by 2030 and 26g CO2
per kWh in 2050. This decarbonisation of the grid is represented by the reference trends, where no technicaloptions have been deployed. Decarbonisation of the grid accounts for approximately 8.5% CO2 reduction in2050 compared to 2012.
0%
20%
40%
60%
80%
100%
2013 2014 2015 2020 2025 2030 2035 2040 2045 2050
%of
CO
2em
issi
ons
in20
12
Current trends
Reference
BAU
20 - 40%
Max Tech nocarbon capture
Max Tech withcarbon capture
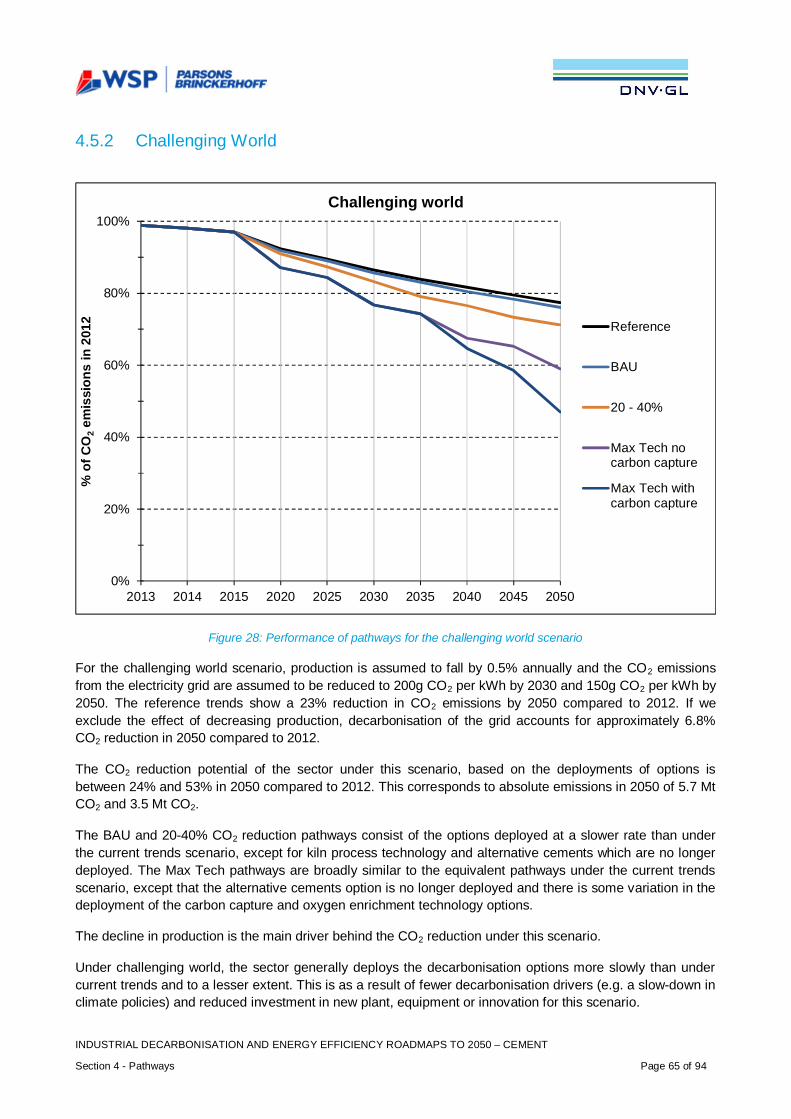
INDUSTRIAL DECARBONISATION AND ENERGY EFFICIENCY ROADMAPS TO 2050 – CEMENT
Section 4 - Pathways Page 65 of 94
4.5.2 Challenging World
Figure 28: Performance of pathways for the challenging world scenario
For the challenging world scenario, production is assumed to fall by 0.5% annually and the CO2 emissionsfrom the electricity grid are assumed to be reduced to 200g CO2 per kWh by 2030 and 150g CO2 per kWh by2050. The reference trends show a 23% reduction in CO2 emissions by 2050 compared to 2012. If weexclude the effect of decreasing production, decarbonisation of the grid accounts for approximately 6.8%CO2 reduction in 2050 compared to 2012.
The CO2 reduction potential of the sector under this scenario, based on the deployments of options isbetween 24% and 53% in 2050 compared to 2012. This corresponds to absolute emissions in 2050 of 5.7 MtCO2 and 3.5 Mt CO2.
The BAU and 20-40% CO2 reduction pathways consist of the options deployed at a slower rate than underthe current trends scenario, except for kiln process technology and alternative cements which are no longerdeployed. The Max Tech pathways are broadly similar to the equivalent pathways under the current trendsscenario, except that the alternative cements option is no longer deployed and there is some variation in thedeployment of the carbon capture and oxygen enrichment technology options.
The decline in production is the main driver behind the CO2 reduction under this scenario.
Under challenging world, the sector generally deploys the decarbonisation options more slowly than undercurrent trends and to a lesser extent. This is as a result of fewer decarbonisation drivers (e.g. a slow-down inclimate policies) and reduced investment in new plant, equipment or innovation for this scenario.
0%
20%
40%
60%
80%
100%
2013 2014 2015 2020 2025 2030 2035 2040 2045 2050
%of
CO
2em
issi
ons
in20
12
Challenging world
Reference
BAU
20 - 40%
Max Tech nocarbon capture
Max Tech withcarbon capture
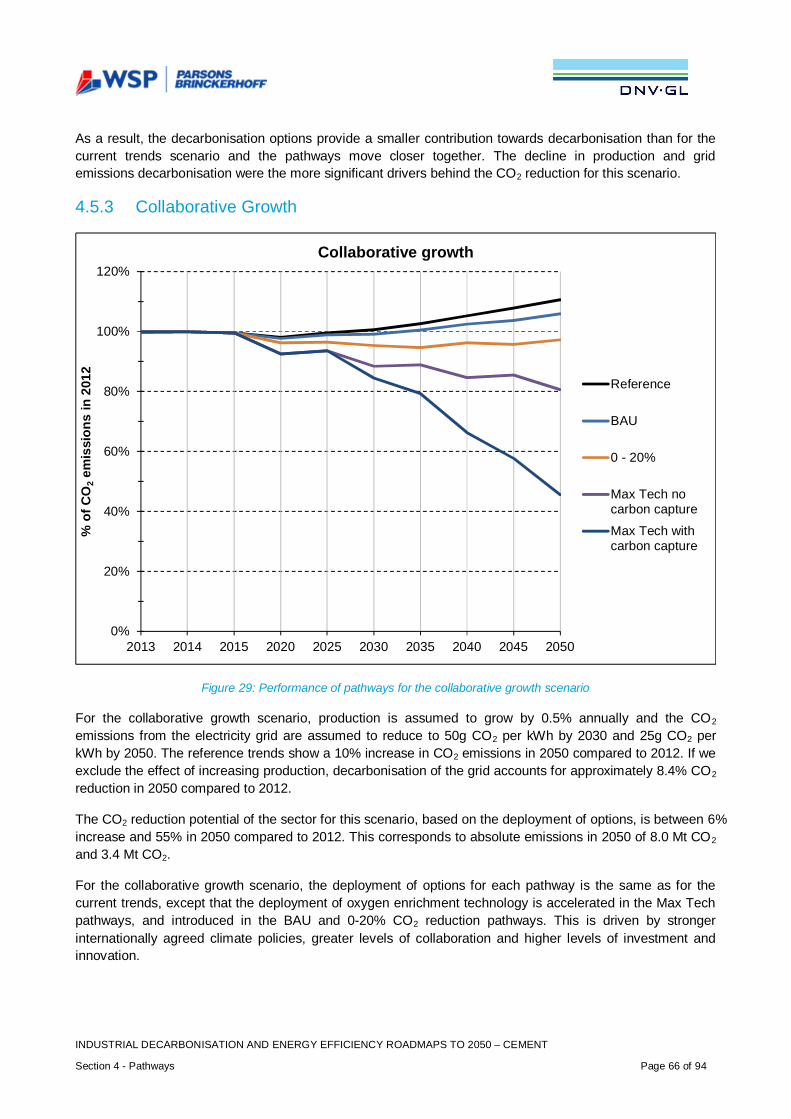
INDUSTRIAL DECARBONISATION AND ENERGY EFFICIENCY ROADMAPS TO 2050 – CEMENT
Section 4 - Pathways Page 66 of 94
As a result, the decarbonisation options provide a smaller contribution towards decarbonisation than for thecurrent trends scenario and the pathways move closer together. The decline in production and gridemissions decarbonisation were the more significant drivers behind the CO2 reduction for this scenario.
4.5.3 Collaborative Growth
Figure 29: Performance of pathways for the collaborative growth scenario
For the collaborative growth scenario, production is assumed to grow by 0.5% annually and the CO2
emissions from the electricity grid are assumed to reduce to 50g CO2 per kWh by 2030 and 25g CO2 perkWh by 2050. The reference trends show a 10% increase in CO2 emissions in 2050 compared to 2012. If weexclude the effect of increasing production, decarbonisation of the grid accounts for approximately 8.4% CO2
reduction in 2050 compared to 2012.
The CO2 reduction potential of the sector for this scenario, based on the deployment of options, is between 6%increase and 55% in 2050 compared to 2012. This corresponds to absolute emissions in 2050 of 8.0 Mt CO2
and 3.4 Mt CO2.
For the collaborative growth scenario, the deployment of options for each pathway is the same as for thecurrent trends, except that the deployment of oxygen enrichment technology is accelerated in the Max Techpathways, and introduced in the BAU and 0-20% CO2 reduction pathways. This is driven by strongerinternationally agreed climate policies, greater levels of collaboration and higher levels of investment andinnovation.
0%
20%
40%
60%
80%
100%
120%
2013 2014 2015 2020 2025 2030 2035 2040 2045 2050
%of
CO
2em
issi
ons
in20
12
Collaborative growth
Reference
BAU
0 - 20%
Max Tech nocarbon capture
Max Tech withcarbon capture
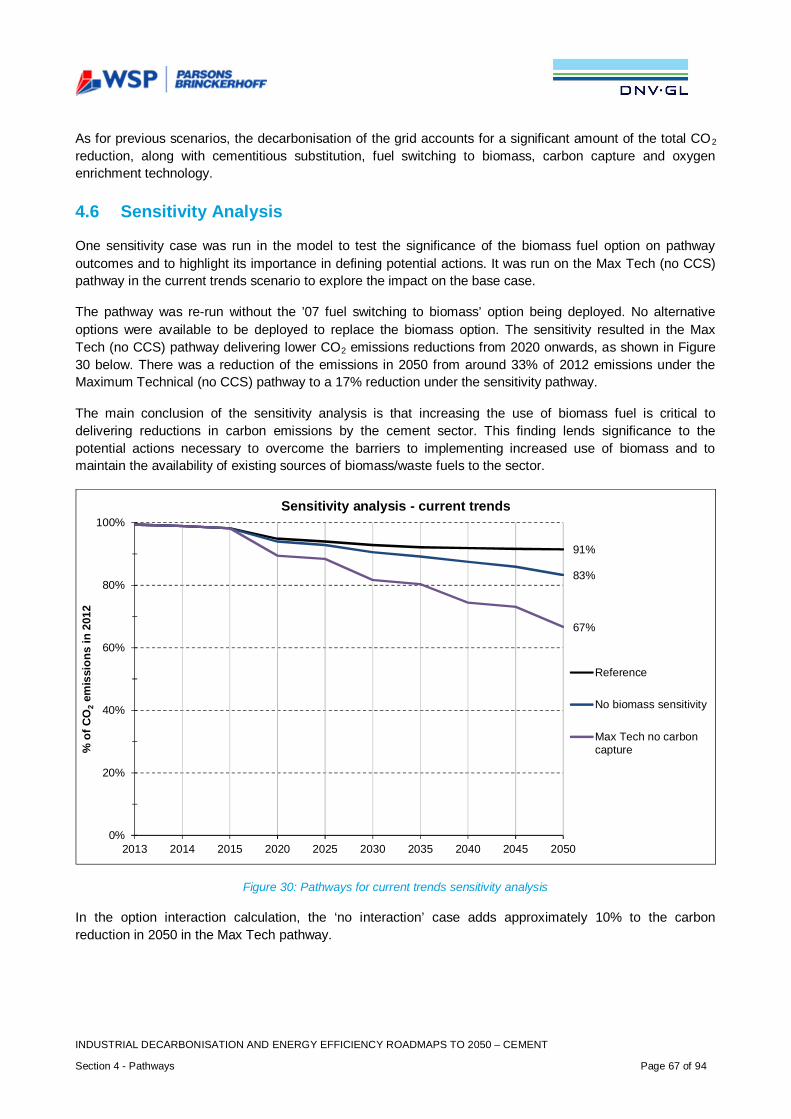
INDUSTRIAL DECARBONISATION AND ENERGY EFFICIENCY ROADMAPS TO 2050 – CEMENT
Section 4 - Pathways Page 67 of 94
As for previous scenarios, the decarbonisation of the grid accounts for a significant amount of the total CO2
reduction, along with cementitious substitution, fuel switching to biomass, carbon capture and oxygenenrichment technology.
4.6 Sensitivity Analysis
One sensitivity case was run in the model to test the significance of the biomass fuel option on pathwayoutcomes and to highlight its importance in defining potential actions. It was run on the Max Tech (no CCS)pathway in the current trends scenario to explore the impact on the base case.
The pathway was re-run without the ’07 fuel switching to biomass’ option being deployed. No alternativeoptions were available to be deployed to replace the biomass option. The sensitivity resulted in the MaxTech (no CCS) pathway delivering lower CO2 emissions reductions from 2020 onwards, as shown in Figure30 below. There was a reduction of the emissions in 2050 from around 33% of 2012 emissions under theMaximum Technical (no CCS) pathway to a 17% reduction under the sensitivity pathway.
The main conclusion of the sensitivity analysis is that increasing the use of biomass fuel is critical todelivering reductions in carbon emissions by the cement sector. This finding lends significance to thepotential actions necessary to overcome the barriers to implementing increased use of biomass and tomaintain the availability of existing sources of biomass/waste fuels to the sector.
Figure 30: Pathways for current trends sensitivity analysis
In the option interaction calculation, the ‘no interaction’ case adds approximately 10% to the carbonreduction in 2050 in the Max Tech pathway.
91%
83%
67%
0%
20%
40%
60%
80%
100%
2013 2014 2015 2020 2025 2030 2035 2040 2045 2050
%of
CO
2em
issi
ons
in20
12
Sensitivity analysis - current trends
Reference
No biomass sensitivity
Max Tech no carboncapture
INDUSTRIAL DECARBONISATION AND ENERGY EFFICIENCY ROADMAPS TO 2050 – CEMENT
Section 4 - Pathways Page 68 of 94
4.7 Pathway Costs
4.7.1 Introduction
Estimates of the costs of new technologies and/or capital improvements with a time horizon to 2050 isfraught with difficulties; any long term forecasts should be treated with caution. The cost analysis presentedin this report is intended to provide a high level estimate of the total capital cost of each pathway to the UKas a whole, in a form which is consistent with the government’s approach to assessing the relative capitalcosts of alternative decarbonisation options from a social perspective14. It is based on an analysis of ‘order ofmagnitude’ option capital costs. The purpose of developing and presenting this cost analysis is to provide anindication of the capital costs for the pathways, which could form a basis for further work.
In gathering capital cost-related data, literature and/or engagement with stakeholders were used to establishan initial dataset for use in the cost analysis assessment. Operating costs such as energy use changes,energy costs and labour are not included in this analysis, although we recognise that operating costsresulting from the decarbonisation pathways will have a major impact on any economic assessment. Forexample some options (e.g. carbon capture and electrification of firing) greatly increase energy use and/oroperating costs of a process plant.
4.7.2 Calculation of Pathway Costs
The pathway costs and carbon dioxide savings are measured with respect to the reference trend, i.e. theyare calculated as the difference between costs and emissions under the decarbonisation pathway and thoseunder the reference trend. This means the costs represent the additional capital costs for the pathwaycompared to a future in which there was no deployment of options. The pathway costs have been assembledfrom the estimated costs of the combination of decarbonisation and energy efficiency options, in accordancewith each carbon reduction pathway including the selected deployment rates of each option. Themethodology for calculating the total discounted capital costs which produce the CO2 reductions for eachpathway can be summarised as follows:
1. Capital costs of deployment for each decarbonisation and energy efficiency option are calculatedbased on the order of magnitude capital costs to deploy that option at one site (or installation or unitof equipment). This is then deployed to the applicable number of sites (or installations or units ofequipment) for the (sub) sector in the pathway as defined by the model.
2. Capital costs reflect the additional cost of delivering the carbon dioxide and/or energy reductionoptions compared to continuing production without deploying the options. For a number of majorinvestment options, including replacement of life-expired assets with BAT (for a list of options in thiscategory see Appendix C), only a proportion of the cost is assumed to be attributed to carbon dioxideemission or energy reduction, as a significant factor for the investment in this case would be toreplace retiring production capacity and to recognise that options may be implemented for reasonsother than decarbonisation / energy efficiency. In the absence of detailed information this proportion(attributed to the capital cost calculation in this analysis) is assumed to be 50%. For all othertechnology options the entire capital cost (i.e. 100%) is attributed to energy / carbon reduction.
14
https://www.gov.uk/government/uploads/system/uploads/attachment_data/file/360316/20141001_2014_DECC_HMT_Supplementary_Appraisal_Guidance.pdf
INDUSTRIAL DECARBONISATION AND ENERGY EFFICIENCY ROADMAPS TO 2050 – CEMENT
Section 4 - Pathways Page 69 of 94
Capital costs are applied at the year of each deployment step (as modelled in the carbon reductionpathways), and adjusted in cases where the asset life defined in the option register would extendbeyond 2050 to reflect their residual value on a linear depreciation basis.
3. The annual capital expenditure of each pathway is calculated from the capital cost and deploymentof each of the options selected. Capital costs are presented in present day value (i.e. 2015) andassumed to remain constant throughout the period. The discount rate for costs has been chosen tobe 3.5% to value the costs from a social perspective and in accordance with standard HM Treasurymethodology for this type of assessment. In other words, all proposed capital expenditure on thevarious pathways are adjusted for the time value of money, so costs (which occur at different pointsin time) are expressed on a common basis in terms of their ‘net present value’ using the discountrate of 3.5%. The effect of this standard methodology is to reduce the apparent cost of largeinvestments that are deployed in the pathways later in the study period.
The following specific assumptions apply:
i. Asset replacement is assumed to take place at the end of life of an existing asset. No allowancehas been made for loss of production during the shutdown period associated with theimplementation of major and/or disruptive technology options. Similarly no allowance has beenmade for loss of EU ETS allowances or civil works associated with a major shutdowns and plantrebuilds. Although costs may be incurred in a case where a plant is written off before the end ofits life, this has not been taken into account in this analysis.
ii. It has been assumed that minor incremental improvements would be implemented in the shadowof other rebuild or maintenance work so that no additional costs for shutdown would be incurred.
iii. No allowance has been made for the costs of innovation and it is assumed that the costs ofdevelopment of breakthrough technologies would be funded separately and not be charged tosubsequent capital investments. Technology licensing costs are assumed to be included in thecapital costs.
iv. No carbon price or other policy costs are included in the calculations.v. Changes in other operating costs including labour, maintenance or consumables associated with
the deployment of options have not been included (although it is noted these will be significantfor many options).
vi. This analysis covers capital costs for carbon reduction; changes to energy use and energy costs(as a result of deployment of the options) has not been quantitatively included although it will besignificant for many options.
4.7.3 Limitations
The project methodology for cost data collection and validation did not deliver a complete dataset for thecapital cost of options, and where data was available, it was qualified at low confidence levels. Further,estimates based on expert judgement have been made where data gaps remained. Also, the degree ofstakeholder engagement in relation to this cost analysis was lower than for the carbon reduction pathways.
All costs in the data input tables are subject to wide variation, for example between sites and sub-sectorsand for technology options that have not been demonstrated at commercial scale. Hence, the cost datarepresent ‘order of magnitude’ estimates that require extensive further development and validation prior toany further use including with sector stakeholders.
Moreover, the assumptions and constraints on confidence levels limit the valid uses for the results of thiscost analysis, therefore the following applies to use of this analysis:
· The values are a starting point to help assess relative benefits of different technologies over the longterm.
INDUSTRIAL DECARBONISATION AND ENERGY EFFICIENCY ROADMAPS TO 2050 – CEMENT
Section 4 - Pathways Page 70 of 94
· The cost analysis results should not be used in isolation to compare decarbonisation technologies ordecide on priorities for their development – additional techno-economic analysis should be carriedout on individual options or groups of options.
· The cost analysis is part of a process of research and exploration and is being shared in atransparent way to support the development of broader strategy. The results are effectivelyprovisional order of magnitude estimates which need to be developed further on the basis ofthorough research before they can be used to inform decisions.
4.7.4 Cost Analysis Results
The results of the cost analysis of decarbonisation for the various pathways within the current trendsscenario are summarised in Table 8below.
Results can be used for relative comparison between pathways in a sector. No cost moderation processbetween the eight sectors has been carried out and therefore in the absence of further data validation andanalysis comparison between sectors is not recommended.
The carbon dioxide emission abatement offered by each pathway has been totalled for each year to presenta cumulative carbon abatement figure for the period from 2013-2050 compared to the reference pathway.
Although this analysis of discounted capital cost does not include energy costs, it should be noted thatenergy cost changes will be subject to the uncertainties of future energy cost projections and the significantdivergence between energy costs applicable to the different levels of energy consumption. A high levelqualitative assessment of the impact of energy use and cost is presented in the table below.
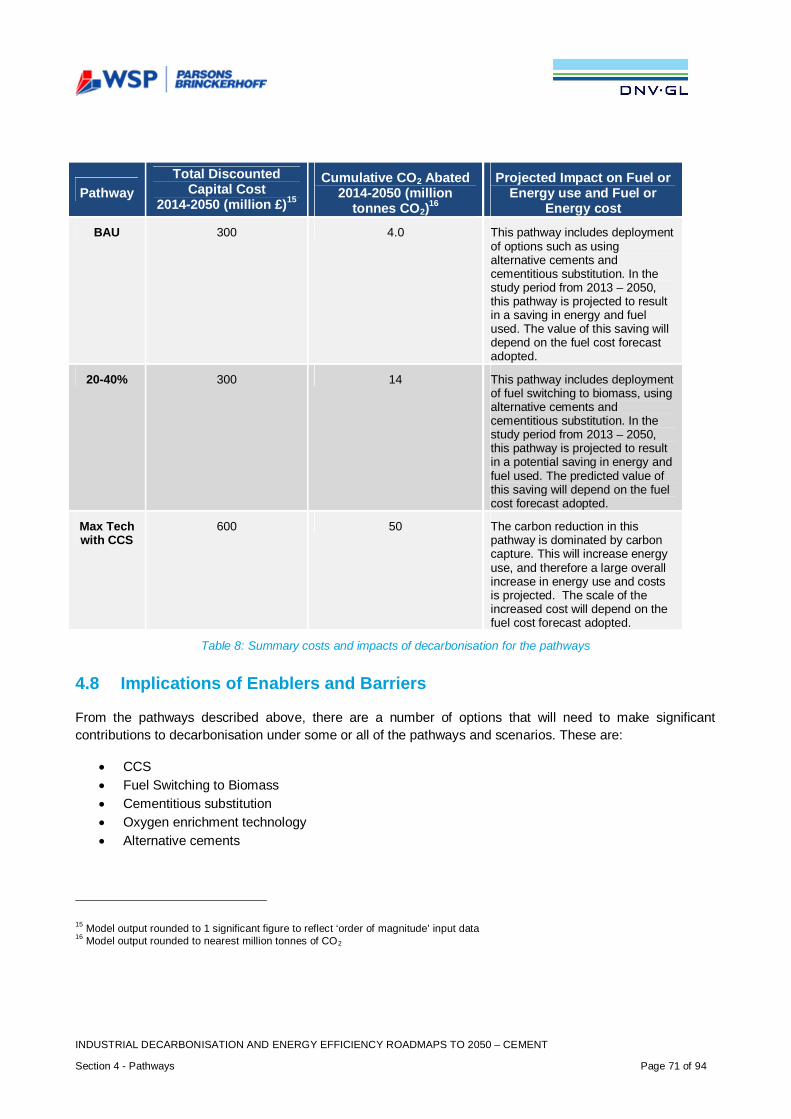
INDUSTRIAL DECARBONISATION AND ENERGY EFFICIENCY ROADMAPS TO 2050 – CEMENT
Section 4 - Pathways Page 71 of 94
PathwayTotal Discounted
Capital Cost2014-2050 (million £)15
Cumulative CO2 Abated2014-2050 (million
tonnes CO2)16
Projected Impact on Fuel orEnergy use and Fuel or
Energy cost
BAU 300 4.0 This pathway includes deploymentof options such as usingalternative cements andcementitious substitution. In thestudy period from 2013 – 2050,this pathway is projected to resultin a saving in energy and fuelused. The value of this saving willdepend on the fuel cost forecastadopted.
20-40% 300 14 This pathway includes deploymentof fuel switching to biomass, usingalternative cements andcementitious substitution. In thestudy period from 2013 – 2050,this pathway is projected to resultin a potential saving in energy andfuel used. The predicted value ofthis saving will depend on the fuelcost forecast adopted.
Max Techwith CCS
600 50 The carbon reduction in thispathway is dominated by carboncapture. This will increase energyuse, and therefore a large overallincrease in energy use and costsis projected. The scale of theincreased cost will depend on thefuel cost forecast adopted.
Table 8: Summary costs and impacts of decarbonisation for the pathways
4.8 Implications of Enablers and Barriers
From the pathways described above, there are a number of options that will need to make significantcontributions to decarbonisation under some or all of the pathways and scenarios. These are:
· CCS· Fuel Switching to Biomass· Cementitious substitution· Oxygen enrichment technology· Alternative cements
15 Model output rounded to 1 significant figure to reflect ‘order of magnitude’ input data16 Model output rounded to nearest million tonnes of CO2
INDUSTRIAL DECARBONISATION AND ENERGY EFFICIENCY ROADMAPS TO 2050 – CEMENT
Section 4 - Pathways Page 72 of 94
From the evidence gathered during the project (from literature, interviews and workshops) there are anumber of enablers and barriers associated with these options. These are discussed below.
4.8.1 Alternative cements
There are several diverse novel or 'new' cements which are generally non-Portland, based on non-traditionalprocesses or raw materials. They tend to embody less energy and emit less CO2 during manufacture than'Portland cement CEM I' (formerly called ordinary Portland cement) although there is no precise definition forwhat constitutes a low energy, low carbon cement.
Typically they would have some or all of the following characteristics. They would:
· Embody less energy than traditional Portland cements, including those that contain additionalinorganic or mineral constituents.
· Be manufactured using a novel process that ideally utilises waste-derived fuels and raw materials.· Be expected to reduce both waste and emissions, in particular the greenhouse gas CO2.· Be expected to be utilised in the same construction applications as currently marketed cements
Five of the more interesting novel cement types are listed below. They are either already in production insome parts of the world but at small scale and nowhere near the scale of production of Portland cementsor under development and can fulfil the above characteristics to varying degrees. They are:
· Alkali-activated cements including geopolymeric cements (e.g. Zeobond/e-crete, Blue WorldCrete/Geo-Blue Crete, banah/banahCEM).
· Low energy CSA-belite cements (e.g. Aether).· Cements based on magnesium oxide derived from carbonates or from silicates (e.g. Eco-cement,
Calix/Novacem).· 'Ecocement' based on municipal solid waste incinerator ash (MSWIA).· Thermoplastic carbon-based cements (e.g. C-Fix cement).
Magnesium oxide (MgO) based cements are attracting particular interest because they require a much lowertemperature of about 700°C to form the required phases, thus reducing fuel-related emissions by about 50%,as well as avoiding the process emissions associated with CEM I production.
Other lower CO2 cement options, which emit calcination-process CO2 emissions and fuel-related CO2
emissions but to a lower extent than in Portland cement production, include the belite-aluminate cements,which uses 12% less fuel and 8% less limestone than CEM I, and the sulpho-aluminate cements which uses40% less fuel and generates ~50-60% less calcination related CO2 per tonne of clinker produced than CEM Iclinker.
Long testing periods are required to ensure confidence in durability, possibly decades rather than yearsbefore some alternative cements are considered safe for structural use. As such not all alternative cementswould be able to replace Portland cement in all applications. In addition, specifiers and architects are veryrisk averse so gaining their confidence in new cements will be challenging (MPA have further information onalternative cements via fact sheets available on the MPA website).
For some alternative cement formulations, the required raw materials may not be widely accessible oravailable in the UK, particularly at the scale needed to replace Portland cement.
For the current trends scenario, the alternative cements option gives the largest percentage reduction on theBAU pathway of 18%.
INDUSTRIAL DECARBONISATION AND ENERGY EFFICIENCY ROADMAPS TO 2050 – CEMENT
Section 4 - Pathways Page 73 of 94
Enablers Some alternative cements already in use on a very small scaleGrowing industry
Barriers Durability unknowns or concerns about performance standardsAvailability of raw materials for their productionFurther R&D neededIndustry is considered small
4.8.2 Cementitious Substitution
This option involves reducing the amount of clinker per unit of cement by substituting the clinker with othercementitious materials, such as pulverised fuel ash (a waste from coal fired power stations) or groundgranulated blast furnace slag (a by-product from iron and steel manufacture). Several main constituentsbeside clinker are available for the production of blended cements. The production of cements containingconstituents such as pozzolanic materials, GGBS and materials such as limestone reduce the amount ofclinker needed for cement production. Thus CO2 emissions from clinker production can be saved.
For the current trends scenario, the cementitious substitution option has the biggest impact on BAU(78.28%), and 20-40% (62.91%), pathways.
Cementitious substitution already takes place at concrete mixer sites and to some extent at the cementmanufacturing plant. Packed cement products all contain cementitious substitutes in the UK. In the EU mostcementitious substitution takes place at the cement manufacturing plant but in the UK most takes place atthe concrete mixer. This results from different market structures in the UK and mainland Europe; the overallrate of substitution in the UK is comparable with the rest of the EU. The advantage of mixing at the concreteplant is that transportation volumes and distances are reduced (i.e. substitute material is moved directly fromsource to concrete plant, not via cement plant), therefore from a full life-cycle perspective there is adisadvantage in moving substitution to the cement plant. In addition, and perhaps more importantly, byblending at the concrete plant the construction company can blend a concrete to have the best compositionfor the application rather than having to accept pre-determined clinker levels which might result in theconsumption of more clinker than necessary. This option presents the highest emissions reductioncontribution by 2050 in the 20-40% scenario under current trends (62.91%) and the BAU scenario, alsounder current trends (78.28%).
Enablers Technically feasible, currently being implemented in the sector
Barriers There is concern associated with uncertainty regarding availability of suitable cementitioussubstitute materials (e.g. fly ash) in the UKcements with high levels of substitute materials are not applicable for all usesCost of substitutes may increase with increased demandProduction largely relies on local coal fired power generation and local steel productionproviding long-term supply of substitution materials
4.8.3 Carbon Capture and Storage (CCS)
This option relates to the capture of CO2 generated by combustion processes. The CO2 is then transported,typically by pipeline, and stored underground in suitable geological features. Carbon capture and use (CCU)is an area of huge potential for many industrial sectors including cement although a detailed assessment ofits potential is beyond the scope this project.
CCS can be combined with oxy-fuel combustion. Indeed, oxy-combustion CO2 capture technology has beenidentified by MPA and the cement companies as the preferred technology option for the cement sector,offering cost and performance advantages over the alternative post-combustion capture technology. Makinga CO2 transportation network available to tie in to would enable the uptake of CCS, although the option still
INDUSTRIAL DECARBONISATION AND ENERGY EFFICIENCY ROADMAPS TO 2050 – CEMENT
Section 4 - Pathways Page 74 of 94
faces many barriers (additional energy requirements for carbon capture, plants that are not located within theCCS clusters will have difficulties to get access to transport pipelines and hence storage facilities,contaminants in flue gas stream, high capex, need for collaboration, etc.).
Geological storage of CO2 emitted from cement plants requires the CO2 to be transported to andpermanently stored deep underground in suitable storage facilities. The existing level of adoption within theUK cement sector is 0% as there is currently no carbon capture being employed, no transport network orsuitable viable storage facilities available.
This option presents the highest emissions reduction contribution by 2050 in the Max Tech with CCSpathway under current trends scenario (49.96%), and therefore represents the primary potential option toreduce CO2 emissions in the cement sector.
Enablers Technically feasible and demonstrated in power generation sectorGovernment policies are being developed to support growth of technologyMake CO2 transportation network available to tie in toR&D and technology already available: leverage developments in power sectorGrant funding, and alternative financing with low interest rates
Barriers Plants within UK are currently not located within likely CCS clusters, only potentiallyapplicable to a few plantsLarge capital investment requiredUnstable cement market conditions disincentivise major investmentsSignificant increases in energy consumption required and availability of electricityinfrastructureExternal support need to develop suitable technologies for cementAvailability of transport and storage infrastructureLocation of cement plants: distance from storage site Issues of storage, including long-term liabilityAvailability of funding for capital investment in CCSDemonstration of commercial scale within cement sectorContaminants in flue gas streamInternal capability and knowledgeBusiness value of implementing CCS when currently this merely adds cost and reducesefficiencyOn an EU level there has been opposition to implementation in certain countriesRisk of carbon leakage due to increased capital and operating cost
4.8.4 Fuel switching to biomass
This option refers to the use of biomass or biomass mixed streams with a biomass content as a fuel forcement production, reducing the emissions produced by fossil fuels burned during this process.
As the fuel-related CO2 emissions are currently 40% of the total emissions, the CO2 reduction potential issignificant if fuels consisting of 100% biomass are used. Such 100% biomass fuels used in the cementindustry today are mainly biomass wastes like animal meal, waste wood, sawdust; and sewage sludge.Biomass is also present in mixed waste streams which are utilised to a much greater degree than 100%biomass fuels, these mixed waste streams include RDF and tyres. Economic barriers for the use of this fuelare considered to be strong. Existing total level of adoption of biomass fuel within the UK cement sector:18%.
While existing biomass fuels consist principally of waste biomass, following consultation with DECC it hasbeen assumed for the purposes of this roadmap study that any additional biomass fuel would comprise virginbiomass material.
INDUSTRIAL DECARBONISATION AND ENERGY EFFICIENCY ROADMAPS TO 2050 – CEMENT
Section 4 - Pathways Page 75 of 94
This option presents the highest emissions reduction contribution by 2050 in the Max Tech with no CCSpathway under current trends scenario (43.42%). This option also impacts all other pathways.
Enablers Technically feasible, currently being used by the sectorIncrease already happening at EU levelThere is the potential for the product (unit price) to be cheaper than coalThere is an advantage to using waste biomass sources in cement in that the ash contentfollowing combustion of the fuel is safely captured in the product so from a wastereduction point of view it has advantages over incineration which generates an ash fordisposal
Barriers Competition with sectors that are being funded and supported to use biomassBiomass availabilityRegulatory uncertaintyUncertainty about return on capital
4.8.5 Oxygen Enrichment Technology
This option involves the use of oxygen enriched combustion air in the clinker burning process. This allows anincrease of the fuel efficiency, production capacity or substitution of fossil fuels by low calorific value (orsecondary fuels).
Since this option results in an increase in electrical power consumption (for air separation), griddecarbonisation is essential for it to contribute to CO2 reduction. A reliable source of affordable, low carbonelectricity is required to be able to support investment in oxygen enrichment.
Existing level of adoption within the UK cement sector: 0%. This is because of the high capital cost andlimited economic benefits currently associated with the use of oxygen enrichment.
This option presents the highest emissions reduction contribution by 2050 in the Max Tech with no CCSpathway under current trends scenario (14.97%). This option presents a lower deployment in Max Tech withCCS under current trends scenario (2.75%).
Enablers Increase in fuel efficiencyGreater production capacityEnables additional substitution of fossil fuelsEstablished in some cement plants worldwideDevelopment of new, low cost, high efficiency oxygen air separation technologies
Barriers Substantial operating costsDecrease in electrical energy efficiencyFurther R&D is requiredTechnical feasibilityDurability and wear concernsLarge investment required
4.8.6 Others
Sections 4.4.1 to 4.4.5 above focus on the options that provide the most significant decarbonisation potential.From the evidence gathered as part of this Roadmap, other options share many of the same enablers andbarriers such as:
· Major innovative technology changes require significant further development before they could beconsidered for deployment.
· Long-term stability in carbon pricing is needed in order to make major investments.

INDUSTRIAL DECARBONISATION AND ENERGY EFFICIENCY ROADMAPS TO 2050 – CEMENT
Section 4 - Pathways Page 76 of 94
Finally, even though decarbonised grid electricity is included in all pathways and is not under the directcontrol of the sector, it is a major contributor to decarbonisation, providing 8.5% decarbonisation in thecurrent trends pathway, and so would rank as the 3rd most significant option, if included within the pathways.
INDUSTRIAL DECARBONISATION AND ENERGY EFFICIENCY ROADMAPS TO 2050 – CEMENT
Section 5 - Conclusions Page 77 of 94
5. CONCLUSIONS - PRINCIPAL QUESTION 6
This section provides assessment of the questions under principal question 6: ‘What future actions might berequired to be taken by industry, government and others to overcome the barriers in order to achieve thepathways in each sector?’
The section is structured as follows:
· Eight ‘strategic conclusions’ or themes have been developed by analysing the main enablers andbarriers. Example next steps/potential actions are also included for each strategic conclusion.
· Key technology groups are discussed, many of which link to the themes above. As described insection 4, a small group of technologies make a significant contribution to decarbonisation in 2050,especially for Max Tech reductions17. Example next steps are included to assist with developing,funding and implementing the technologies.
It is intended that government and industry use the roadmap to develop and implement an action programmein support of the overall aim of decarbonisation while maintaining competitiveness in the sector.
5.1 Key Points
The following conclusions have been drawn from the evidence and analysis:
Leadership, Organisation and Strategy
Leadership is important at company, sector, regional and UK government level. It links to all of the themesbelow. Leadership is required to drive programmes forward and involves developing solutions in response toevidence and analysis. The cement sector continues to illustrate good practice in relation to strategy, forexample with publication of the 2050 greenhouse gas reduction strategy published by the MPA.
Business Case Barriers
The R&D, demonstration and commercial deployment of energy efficiency projects and major technologiesrequires significant upfront capital. Decisions to invest are impacted by a number of technical and economicfactors such as policy costs and certainty, availability and access to internal finance and an evaluation oftechnical and commercial risks and returns. A range of options could be developed to overcome businesscase barriers including incentive-based policy and external project finance.
Future Energy Costs, Energy Supply Security, Market Structure and Competition
Some of the key technological options considered by the pathways, such as carbon capture (plus storage oruse), will require significant capital costs and higher energy consumption and thus increase operating costs.This will reduce the overall cost-competitiveness of the sector compared to businesses overseas withoutmeasures to level the international playing field. For example, future action needs to address concerns on allcomponents of the future electricity price relative to other regions.
17 These technology groups broadly apply to the cement sector and also the other seven sector roadmaps.
INDUSTRIAL DECARBONISATION AND ENERGY EFFICIENCY ROADMAPS TO 2050 – CEMENT
Section 5 - Conclusions Page 78 of 94
Industrial Energy Policy Context
The long-term direction of energy and climate change policies and regulations in the UK may put at riskinternational competitiveness of the cement industry. Uncertainty (perceived or real) reduces investors’confidence and reduces the ability of the sector to justify the business case for major investments in energyefficiency and decarbonisation technologies. It is reported by the sector that the business case forinvestment needs to be very strong and to include risk identification and effective risk mitigation and controlmeasures. Industry would encourage that policy should consider the right balance of bankable incentives toencourage such investments.
Life-Cycle Accounting
The sector uses raw materials from, and provides its products to, other parts of the economy. There needs tobe further development of the understanding the overall carbon impact of the entire product life-cycle. Forexample, by constructing buildings from concrete, which increases their thermal inertia, there can besignificant long-term carbon benefit through reduced energy use and long-term durability. Recarbonisation ofconcrete (reabsorbing CO2) could form part of this assessment. The sector is trying to communicate thesemessages but the recognition of whole life benefits in construction is very limited. Government and industrycould do more to achieve this market acceptance.
Value Chain Collaboration
The value chain for the cement sector extends from feedstock supply (quarries and alternative feedstocksources), through cement manufacture, concrete production, procurement and specification ofcement/concrete products by customers and their architects / engineers. Transportation of materials throughthe supply chain is an integral element. The carbon emissions of the cement sector are affected by theexpectations of consumers, the business needs of builders and other industrial users of concrete productstogether with product standards and the requirements of building regulations. Collaboration across the valuechain could enable products with lower lifecycle carbon emissions to be developed and adopted. The cementsector utilises waste materials from the power generation and iron and steel sectors as alternativefeedstocks. Maintaining strong dialogue to understand the future strategies in these sectors, the futureavailability of these materials and maximising synergies benefits all sectors.
Research, Development and Demonstration (RD&D)
The development and demonstration of new technologies required to deliver decarbonisation is challengingfor companies and government alone for example, due to lack of confidence from industry on a stable policyframework and technical challenges. This includes early R&D activity but also, crucially, progressingtechnology to successful commercial demonstration so that it is de-risked for future deployment.Technologies should be selected through a collaborative process. It should be noted that RD&D largelyhappens at a group global level rather than in the UK businesses, so groups will tend to put the effort intowhere the benefits are maximised on a group-wide level – hence government support for RD&D in the UKcould potentially bring such projects to the UK rather than elsewhere.
People and Skills
New manpower resources with specialised skills and knowledge in energy and heat engineering areincreasingly needed by the UK cement sector. Currently, key responsibilities of energy teams includeensuring compliance with existing regulation which diverts attention and effort from identification andimplementation of energy efficiency activities.
The key technology groups that, in this investigation, make the largest contributions to sectordecarbonisation or energy efficiency are as follows:
INDUSTRIAL DECARBONISATION AND ENERGY EFFICIENCY ROADMAPS TO 2050 – CEMENT
Section 5 - Conclusions Page 79 of 94
Electricity Grid Decarbonisation
Decarbonisation of this electricity imported to cement sites supply could provide a significant contribution tothe overall decarbonisation of the sector. Actions (mainly by government and utilities) will be required toensure that this takes place while maintaining cost-competitiveness. The Government’s reforms of theelectricity market are already driving electricity grid decarbonisation and this report uses assumptions of afuture electricity decarbonisation trajectory that is consistent with Government methodology and modelling.
Fuel and Feedstock Availability (Including Biomass)
The availability of low carbon fuels and feedstocks is a potential issue for cement sector decarbonisation,given the important role biomass could play. This availability is affected by demand in the cement sector andother sectors and/or with other demand (for example, the use of biomass for electricity generation or in thenon-manufacturing sector such as domestic heating). The challenges are to understand where the greatestdecarbonisation potential can be achieved with a limited resource, as well as to maximise the availability ofthe resource (links to Life-cycle carbon accounting).
Energy Efficiency and Heat Recovery Technology
There are opportunities to increase heat recovery in the cement sector, both to improve energy efficiencyand to produce electric power. However, the payback periods of such projects are typically above the 2-3year threshold that must be achieved to justify company investment. Alternative financing mechanisms tofacilitate investment in energy efficiency projects could increase their implementation across the sector.
The development and demonstration of new technologies required to deliver decarbonisation is difficult toachieve. It is clear that the sector shows good leadership and is committed to decarbonisation however theissues for the sector are largely lack of certainty and predictability in the regulatory regime and market alongwith the big step of overcoming technical difficulties. This includes early R&D activity but also, crucially,progressing technology to successful commercial demonstration so that it is de-risked for future deployment.
Carbon Capture
Individual cement plants are not considered to be of a sufficient scale to justify their own CO2 pipeline andstorage infrastructure. Collaboration both within the sector and externally is necessary to establish thenetworks, along with the availability of sources of funding appropriate to this type of shared infrastructure.The scale of CO2 emissions from each site in the cement sector means that carbon capture and utilisationapplications would need extensive technical breakthrough to be developed into large scale options for use ofCO2 in products with associated value (this is a key area of current and future research where significantdevelopment is needed). A future strategy for the development of a CO2 transportation network should beconsidered with government taking a lead. This would enable industry to understand if and when there islikely to be access to a CO2 pipeline from their site for storage or use and can then plan accordingly.
This roadmap report is intended to provide an evidence-based foundation upon which future policy can beimplemented and actions delivered. The report has been compiled with the aim that is has credibility withindustrial, academic and other stakeholders and is recognised by government as a useful contribution whenconsidering future policy.
INDUSTRIAL DECARBONISATION AND ENERGY EFFICIENCY ROADMAPS TO 2050 – CEMENT
Section 5 - Conclusions Page 80 of 94
5.2 Strategic Conclusions
5.2.1 Strategy, Leadership and Organisation
Strategy is important in any industrial sector or company in that it provides long-term aims and a plan ofaction of how to achieve the aims. Leadership is required to drive programmes forward and involvesdeveloping solutions in response to evidence and analysis.
In order to achieve the identified pathways going forward, it is considered critical that the cement sector,government and other stakeholders continue to recognise the importance of strategy and leadership in thecontext of decarbonisation, energy efficiency and competitiveness for the sector. The evidence for thisconclusion comes from interviews, where several senior industry managers explained that both companiesand government need to work collaboratively on those issues that need multi-disciplinary action. If throughcollaboration decarbonisation is given greater impetus within the sector and in government, then the specificexample actions described in this document will have a higher chance of success.
This links to all other conclusions below, including policy context, research and development, the benefits ofcement in the value chain, technology deployment, and optimising fuel and feedstock usage.
A possible action to address this issue is to set up a government-industry working group with responsibilityfor the cement sector strategic priorities. This group could bring:
· Government support for potential cross sector benefits within an energy intensive industriesindustrial strategy.
· Leadership and vision to the UK sector, emphasising how cement production adds strategic value forthe UK and why it is important to face the challenges and develop the opportunities for the sector.
· A high level link between industry, government and the EU and a clear framework within whichproduction, technology, energy efficiency and decarbonisation agendas can be taken forward.Members of the working group could engage with executives in corporate headquarters to betterinform the UK cement sector strategy.
· Government may wish to consider expanding the current sectoral scope of to put an industrialstrategies in place to give confidence that the industry will be still have a significant level ofproduction in the UK in 20+ years. This confidence would in turn facilitate future investment in bothcurrent and new plants.
· A means to take forward the Roadmap agenda with shorter term action plans, for example, in fiveyear intervals.
This conclusion is also applicable to individual company strategy, where companies have a key role inovercoming barriers and strengthening enablers. This links to a number of enablers and barriers, forexample, management commitment to decarbonisation and energy efficiency, value chain opportunities andthe need for skilled people.
5.2.2 Business Case Barriers
Given the progress already made by the cement sector companies on energy efficiency (energy being asubstantial part of operating costs), remaining options carry technical and economic challenges and risks –making cases for energy efficiency projects challenging against other priority investments. Energy efficiencyprojects are judged on their return on capital and payback in relation to other projects requiring capital forcontinued operation of the business both in the UK and for company international assets. This competition isgenerally for resources of all kinds e.g. capital, technical staff and management time. For these reasons,projects that appear to be economically worthwhile may not be implemented, even if a solid and well-justifiedbusiness case is made.
INDUSTRIAL DECARBONISATION AND ENERGY EFFICIENCY ROADMAPS TO 2050 – CEMENT
Section 5 - Conclusions Page 81 of 94
Examples of actions to overcome these issues include:
· Government could consider how to assist in developing external project financing mechanisms.These need to take account of the likely long-term nature of energy-saving projects.
· As part of the standard policy evaluation process, Government to assess the balance betweenpositive and negative incentives.
· Industry to consider using third parties to implement projects in order to avoid capital and otherresource limitations. For example, an external company could be employed to install a specificenergy efficiency measure (which they would fund) in return for a share of the benefits.
· Industry and suppliers to continue to use a full range of outputs from other actions in this section tomake the strongest possible internal business cases for decarbonisation investments. This will needto be an on-going activity.
· Investigate and identify financing for the cement projects described below, including demonstrationprojects.
Significant improvement in the investment environment is required to permit the necessary increase ofinvestment likely to be required in the sector to deliver changes contributing to decarbonisation from 2025,as evidenced by the pathways analysis.
5.2.3 Future Energy Costs, Energy Supply Security, Market Structure andCompetition
Many decarbonisation measures are expensive and potentially time consuming to implement. Wheremeasures do not have the shared benefit of reducing energy consumption, companies are not able torecover the cost of investment because consumers are currently not willing to pay higher prices for low-carbon cement products. Additionally, if operating costs for UK companies rise too high, they will be unableto compete against foreign made products that may be manufactured to lower environmental standards(hence increasing global CO2 emissions and reducing jobs in the UK). Imports from inside and outside theEU already have 14% market share in the UK even at low CO2 prices.
Some of the key technological options considered and discussed by the pathways in section 4, such ascarbon capture, require higher energy consumption and thus increased overall operational as well as capitalcost. This could reduce the overall cost-competitiveness of the sector compared to competing businessesoperating overseas, e.g. North Africa or Middle East. This could in turn reduce the attractiveness of thesector in the UK for future investment. Example actions that would partially mitigate this include:
· Industry and government to collaborate on technology demonstration to drive down cost and ensureperformance is demonstrated before mass adoption. This would be an on-going activity astechnologies become ready but with the overall approach put in place before 2020 (links to theCollaboration themes below).
· Establish a global carbon price as part of global agreements – ideally applying to other sectorsbeyond the cement sector (see Policy and Incentives above).
· Explore how other decarbonisation options included in this report could happen in a commerciallyviable manner.
5.2.4 Industrial energy policy context
The need for long-term energy and climate change policy is key to investor confidence, according toliterature and other evidence-gathering sources (see section 3.4.5 ‘enablers and barriers’). Many in thesector have emphasised a desire for long term certainty around policy support for decarbonisation andenergy efficiency, as changes in policy (around incentive schemes) can be damaging, particularly when the
INDUSTRIAL DECARBONISATION AND ENERGY EFFICIENCY ROADMAPS TO 2050 – CEMENT
Section 5 - Conclusions Page 82 of 94
business case for investment is marginal and is highly dependent upon factors such as (fluctuating) energyprices. Possible actions as next steps to address this conclusion are as follows:
· Government to explore creating incentives which will encourage companies to invest indecarbonisation measures and energy efficiency technologies
· Government to review unilateral UK carbon price and establish an effective price for CO2 thatincentives the reduction of carbon while also evaluating measures to minimise the risk of carbonleakage. Work on this should start now on the assumption that it will take a number of years toimplement and many of the decarbonisation options in the pathways depend on investment thatneeds this to underpin them.
· Government to explore funding arrangements to recognise mid- to long-term decarbonisationbenefits. This would allow the value of these benefits to be taken into account in investmentdecisions. The effective CO2 price noted above would be one means of doing this. This action linksto the Finance theme below.
· Governments to establish a ‘level playing field’ through a global carbon agreement (with regionalbreakdowns) before 2020. This could provide an alternative means to avoid possible carbon leakage.
· In addition to a global agreement, reform of the EU ETS is considered a priority for the cementsector. The system is perceived to be unfair towards this sector in terms of allocation of carbonallowances and the industry asserts that the uncertainty over future rounds of allowancesdiscourages investment and the technical rules of the current system perversely encourages the useof older, less efficient plants rather than building newer plants.
· Government to establish a ‘level playing field’ through modification to the Renewable Heat Incentivescheme to make it (or an equivalent scheme) available to the cement sector, and applicable to thesector’s use of biomass fuels. In The Future of Heating (2013), DECC committed to exploringoptions to support direct applications of renewable heat in industrial processes.
· Review planning requirements for industrial renewable energy and low-carbon projects where clearbenefits to decarbonisation and energy efficiency, competitiveness and local economy are proposed.
5.2.5 Life-cycle Accounting
The interaction between sectors is significant, with the carbon emissions of the cement sector beingnecessary for the manufacture of products utilised in a low carbon economy. A thorough lifecycle analysis(LCA) of such activities is necessary to ensure that policies and investments are focussed on the mosteffective decarbonisation measures overall. LCAs must be comparable to LCAs for other European cementproducts, as well as other materials. Building on existing standards, the analysis methodology needs to bedeveloped in the short term and its application across the industrial sectors needs to be completed duringthe next parliament to inform investment and policy decisions in a timely manner.
A wider dissemination of knowledge on the whole life carbon benefits of products would help remove thebarriers with respect to understanding the potential of these products and how to deploy them mosteffectively. This research has identified that industry is trying to communicate these messages but therecognition of whole life benefits in construction is very limited. Government and industry could do more toachieve this market acceptance.
Develop standard tools for evaluating life-cycle ‘cradle-to-grave’ carbon impacts, from original raw materialand feedstock through to final product disposal. These should include defined, consistent boundaryconditions to ensure results can be compared across sectors.
Implement policies and incentives that allow the value of carbon benefits to be realised at the appropriatepoint in the supply chain. For example, when concrete structures are demolished there will have been anuptake of CO2 into the concrete, and the carbon benefit could have a financial value that can be used tosupport the supply chain. This will allow these benefits to be used to help justify investment and policy
INDUSTRIAL DECARBONISATION AND ENERGY EFFICIENCY ROADMAPS TO 2050 – CEMENT
Section 5 - Conclusions Page 83 of 94
decisions. Global equalization of carbon prices would be one way to allow the market to price in thesecarbon benefits.
Government to preferentially purchase cement sector products taking into account whole life cycle emissionsand performance as a possible way to encourage development of the market taking into accountdecarbonisation.
5.2.6 Value Chain Collaboration
Increased use of alternative raw materials is vital for the decarbonisation of the cement sector. Identifyingfuture availability of materials such as power station fly ash and blast furnace slag is essential to allow thesector to plan, and identify alternative feedstocks, if necessary. Close cross-sectoral collaboration wouldbuild on current good practice, maximise mutual benefits and facilitate further synergies between the cementand iron and steel and power generation sectors.
The cement sector utilises waste materials from the power generation and iron and steel sectors asalternative feedstocks. Maintaining strong dialogue to understand the future strategies in these sectors, thefuture availability of these materials and maximizing synergies could benefit all sectors.
The role of customers (and their advisors) in understanding life cycle emissions, for example, specifyingwhole life low carbon building solutions links to 5.2.5 (life-cycle accounting).
5.2.7 Research, Development and Demonstration (RD&D)
Within the cement sector, collaboration between industry and academia in identifying key RD&Drequirements and providing support and guidance to the academic community is essential to develop thefuture technologies demanded by the sector. Research priorities include:
· Development of CO2 capture technologies specific to the cement sector (oxy-combustion CO2
capture technology) and the development of processes to use captured CO2 as a feedstock (CCU),creating value rather than cost from carbon capture.
· Successful carbon capture technology demonstration would reduce risks and encourage widerdeployment, however, an opex support mechanism (e.g. equivalent to the CfD FiT in the powersector) may need to be implemented to encourage carbon capture deployment due to its highoperating costs.
· Studies into the potential for increased industrial symbiosis between cement and other sectors.· Development of new substitutes to portland cement.· Life-cycle carbon footprinting of the cement sector, including feedstocks, fuels, savings in the built
environment and post-demolition CO2 reabsorption.· Increased collaboration in order to join up industry needs and academic research areas. This could
start with an inventory of current activities which are already in the public domain.· Industry and government to further develop and support centres of excellence and technology
‘catapults’.
5.2.8 People and Skills
As identified in the workshops, there is a limited number of staff with specialised skills in energy and kilnengineering in the sector. The priorities of those staff tend to be on ensuring compliance with regulationswhich diverts attention and effort away from identification and implementation of energy efficiencyopportunities. The need for training is reflective of the fact the workforce is ageing and with the developmentof new technologies, new skills will be required.
INDUSTRIAL DECARBONISATION AND ENERGY EFFICIENCY ROADMAPS TO 2050 – CEMENT
Section 5 - Conclusions Page 84 of 94
Some examples of actions include:
· Manufacturing has to be an attractive career, so more should be done to publicise the benefits ofworking in industry.
· Industry to invest in training and recruitment to make the necessary skills available· A review of training and skills to help businesses decarbonise, e.g. writing effective business plans in
support of progressive strategies such as utilising advanced financial instruments such as greenbonds to decarbonise faster.
The other themes discussed above aimed at making decarbonisation investment more attractive would alsotend to encourage the recruitment of staff with the necessary skills and their use on relevant projects.
5.3 Key Technology Groups
5.3.1 Electricity Grid Decarbonisation
Decarbonisation of this key source of energy supply could provide a significant contribution to the overalldecarbonisation of the sector (see pathways analysis in section 4). Actions (mainly by government andutilities) will be required to ensure that this takes place while maintaining cost-competitiveness.
5.3.2 Fuel and Feedstock Availability (including biomass)
The supply of biomass is critical to its current and possible future use as a low-carbon energy supply in thecement sector. Actions to assess the likely future availability of biomass, in particular waste biomass streams,would enable the sector to understand how this could add to the future competitive position for the UK.Example actions are provided below:
· Establish a basis for biomass that is cost-competitive with fossil fuel as a heat source, e.g. byextension of the Renewable Heat Incentive, or introduction of an equivalent scheme applicable todirect firing with biomass, urgently for the existing operations of the sector and to support large-scalereplacement of fossil fuels with biomass (both waste and virgin) no later than 2035.
· Acknowledge, and provide support for, the unique advantage that the cement sector has in the useof waste or contaminated biomass streams in being able to incorporate the inorganic components ofthe fuel stream into the cement product. Create a recognition of material efficiency in the wastehierarchy; modify the Waste Framework Directive to include co-processing so that biomass is usedefficiently.
· Establish a ‘level playing field’ between the cement sector and other industries that currently receiveincentives for the use of biomass and can therefore currently offer higher prices for constrainedsupplies of biomass, potentially diverting biomass away from the cement sector. This will removeperverse incentives that currently favour the use of biomass in applications that are less energyefficient and where, in particular, waste biomass streams are a less suitable fuel source than in thecement sector.
· Building on the above to create a mechanism to ensure biomass is being utilised where it adds themost value to the economy.
· The EU ETS could regulate the CO2 emissions from incinerators that burn biomass over time thatcould otherwise have been used in cement kilns so that the two sectors can compete on a levelplaying field for biomass resource in mixed wastes. Research potential new sources of biomass fuelto increase potential supply to the sector; both waste materials and virgin biomass. Suchassessment must include consideration of quantities, costs and carbon footprints of each potentialsource.
INDUSTRIAL DECARBONISATION AND ENERGY EFFICIENCY ROADMAPS TO 2050 – CEMENT
Section 5 - Conclusions Page 85 of 94
With regard to cementitious substitution, significant progress and emissions have been made by use of thisapproach, but long term availability of materials is a concern and an area for ongoing strategic review for thesector to continue to identify secure and competitive supplies of these materials.
5.3.3 Energy Efficiency and Heat Recovery
There are opportunities to increase heat recovery in the cement sector, both to improve energy efficiencyand to produce electric power. However, the payback periods of such projects are typically above the 2-3year threshold that generally must be achieved to justify investment. Alternative financing mechanisms tofacilitate investment in energy efficiency projects would increase their implementation across the sector.
The development and demonstration of new technologies required to deliver decarbonisation is challenging.It is clear that the sector shows good leadership and is committed to decarbonisation however the issues forthe sector are largely lack of certainty and predictability in the regulatory regime and market along with thebig step of overcoming technical difficulties. This includes early R&D activity but also, crucially, progressingtechnology to successful commercial demonstration so that it is de-risked for future deployment.Technologies should be selected through a collaborative process. Companies may not have the time andexpertise to identify if and how different options may be of benefit to them and so may not progress the R&Dactivity needed (links to Employees and skills below).
5.3.4 Clustering
While not an option assessed in the pathway analysis, studies into the potential for increased industrialsymbiosis between cement and other sectors could further develop potential opportunities for carbon andenergy savings/benefits, possibly as part of a wider assessment of opportunities in multiple sectors.
5.3.5 Carbon Capture
Individual cement plants are not considered to be of a sufficient scale to justify their own CO2 pipeline andstorage infrastructure. Collaboration both within the sector and externally is necessary to establish thenetworks, along with the availability of sources of funding appropriate to this type of shared infrastructure.The scale of CO2 emissions from each site in the cement sector means that carbon capture and utilisationapplications would need to be further developed into large scale options for use of CO2 in products withassociated value (this is a key area of current and future research where significant development is needed).A future strategy for the development of a CO2 transportation network should be considered with governmenttaking a lead. This would enable industry to understand if and when there is likely to be access to a CO2
pipeline from their site for storage or use and can then plan accordingly.
Issues and potential actions include:
· The most mature CO2 capture technologies being developed for application within the powergeneration sector are not directly applicable for efficient capture within the cement sector. Enforcingshort-term targets for the application of CCS within the sector would result in technology lock-in withlow-efficiency, high-cost technologies that are not optimised and would create a negative reaction toCCS within the sector. Government must recognise that the development of sector specific CO2
capture technologies will take time, and allow for this when developing future policy· The cement sector has identified oxy-combustion CO2 capture technology as the most likely
optimum technology for application in the sector. The Air Separation Unit providing the oxygen to theprocess is a major user of electrical power, therefore ensuring a supply of low carbon, affordableelectricity is essential for the application of this technology – and for the application of oxy-combustion more widely, including at plants that do not have CO2 capture. Additionally, the
INDUSTRIAL DECARBONISATION AND ENERGY EFFICIENCY ROADMAPS TO 2050 – CEMENT
Section 5 - Conclusions Page 86 of 94
development of new, advanced air separation technologies that reduce the electrical powerconsumption would provide a further cost and environmental benefit.
· Specific Research, Development and Demonstration funding for industrial carbon capture for hightemperature industries, including specific focus on capture in the cement sector, will accelerateimplementation. Industry stakeholders would value an equivalent emphasis and support on industrialCCS as currently is being put on CCS in the power sector.
· Investigate flue gas composition, in particular the presence of contaminants and trace components,so that potential application of CO2 capture and CO2 utilisation in the cement sector can be betterunderstood. It may be possible to learn from experience in the power generation sector regardingtechnology selection and performance for flue gas clean-up and CO2 purification, but the differenceswith cement kiln flue gas need to be characterised.
· Future funding sources for CCS demonstration in the cement sector might include the EU’s NER400mechanism. However the UK cement sector would require UK Government commitment to supportprojects bidding for funds from this source.
· CCS within the cement sector can only be applied at those plants that will have ready access to CO2
transportation infrastructure; a CO2 pipeline, provided by a third party, needs to be available at thesite boundary. At present, the future extent of CO2 pipeline networks is unknown. Clarity could beprovided through the development of a UK national strategy for CCS infrastructure – a ‘CO2 PipelineRoadmap’.
· The application of CCS increases both capital costs and operating costs for a cement plant.Mechanisms to incentivise and or compensate industry for decarbonisation through the application ofCCS are essential to facilitate implementation and avoid the UK cement sector being at commercialdisadvantage to overseas competitors. Otherwise, the effect could be carbon leakage, rather thanthe implementation of CCS.
These actions need to be initiated in the near term and sustained throughout the following decades to permitand maintain momentum for development and decarbonisation.
5.3.6 Technologies Specific to the Cement Sector
Based on the pathways analysis, there are a number of options specific to the sector that can contributefurther to decarbonisation and energy efficiency in the sector. These use alternative cements and oxygenenrichment technology.
5.4 Closing Statement
This roadmap report is intended to provide an evidence-based foundation upon which future policy can beimplemented and actions delivered. The way in which the report has been compiled is designed to ensure ithas credibility with industrial, academic and other stakeholders and is recognised by government as a usefulcontribution when considering future policy. It will be successful if, as a result, the government and thecement sector are able to build on the report’s evidence and analysis to deliver significant reductions incarbon emissions, increased energy efficiency and a strong competitive position for the UK cement industryin the decades to come.
INDUSTRIAL DECARBONISATION AND ENERGY EFFICIENCY ROADMAPS TO 2050 – CEMENT
Section 6 - References Page 87 of 94
6. REFERENCES
British Government, 2011. Enabling the Transition to a Green Economy: Government and business workingtogether.https://www.gov.uk/government/uploads/system/uploads/attachment_data/file/183417/Enabling_the_transition_to_a_Green_Economy__Main_D.pdf. Last updated 2011, last seen 12/03/2015.
British Broadcasting Company (BBC), 2014. Anglo American to sell Lafarge Tarmac stake for £885m.http://www.bbc.co.uk/news/business-28190116. Last updated 7/07/2014, last seen 11/03/2015.
Cement Sustainability Initiative (CSI), 2012. GNR Project Reporting CO2 – Average gross CO2 emissions pertonne cementitious (All GNR Participants – World). http://www.wbcsdcement.org/GNR-2012/world/GNR-Indicator_323-world.html. Last updated 2012, last seen 11/03/2015.
Centre for Low Carbon Futures, 2011. Technology Innovation for Energy Intensive Industry in the UnitedKingdom. http://www.lowcarbonfutures.org/sites/default/files/EIITechnologyInnovation_1313051712.pdf. Lastupdated 07/2011, last seen 12/03/2015.
Competition Commission, 2014. Aggregates, cement and ready-mix concrete market investigation finalreport.
British Government, 2013. Government Response to the Environmental Audit Committee’s Report on theEnergy Intensive Industries Compensation Scheme.https://www.gov.uk/government/uploads/system/uploads/attachment_data/file/228999/8618.pdf. Lastupdated 05/2013, last seen 11/03/2015.
Cement Sustainability Initiative (CSI), 2012. GNR Project Reporting CO2 – Average power consumption forcement manufacturing per tonne of cement (All GNR Participants – United Kingdom).http://www.wbcsdcement.org/GNR-2012/United%20Kingdom/GNR-Indicator_3212b-United%20Kingdom.html. Last updated 2012, last seen 11/03/2015.
Capital Economics, 2012. The Foundation for a strong economy.http://www.mineralproducts.org/documents/The_foundation_for_a_strong_economy.pdf. Last updated01/10/2012, last seen 11/03/2015.
CIVITAS, 2012. CIVITAS ideas for economic growth. http://www.civitas.org.uk/economy/IdeasFEG2.pdf. Lastupdated 12/2012, last seen 11/03/2015.
Cement Sustainability Initiative (CSI) & European Cement Research Academy (ECRA), 2009. Developmentof state of the Art-Techniques Cement Manufacturing: Trying to Look Ahead (CSI/ECRA-Technology Papers).http://www.wbcsdcement.org/pdf/technology/Technology%20papers.pdf. Last updated 2009, last seen11/03/2015.
Concrete, 2013. Carbonisation from an environmental perspective.https://www.concretecentre.com/pdf/AR_Concrete_carbonation_April%202013.pdf. Last updated 04/2013,last seen 11/03/2015.
Department of Energy & Climate Change (DECC), 2013. The Future of Heating: Meeting the Challenge.https://www.gov.uk/government/uploads/system/uploads/attachment_data/file/190149/16_04-DECC-The_Future_of_Heating_Accessible-10.pdf. Last updated 03/2013, last seen 11/03/2015.
INDUSTRIAL DECARBONISATION AND ENERGY EFFICIENCY ROADMAPS TO 2050 – CEMENT
Section 6 - References Page 88 of 94
Department of Energy & Climate Change (DECC), 2014. RHI Evidence Report: Direct Application ofRenewable Heat.https://www.gov.uk/government/uploads/system/uploads/attachment_data/file/372992/RHI_Evidence_Report_-_Direct_Applications_of_Renewable_Heat.pdf. Last updated 29/10/2014, last seen 11/03/2015.
De Saulles, Tom, 2013. Concrete’s green credentials boosted by carbonation study. Civil Engineering, 166(4), 148-148.
Environment Agency (EA), 2005. Measuring environmental performance – Sector report for the cementindustry – Version 1. http://www.engineering.leeds.ac.uk/resilience/partners/documents/GEHO1105BJVK-E-E.pdf. Last updated 2005, last seen 11/03/2015.
Environment Agency (EA), 2008. Using Science to create a better place – The use of substitute fuels in theUK cement and lime industries.https://www.gov.uk/government/uploads/system/uploads/attachment_data/file/291698/scho1207bnna-e-e.pdf.Last updated 04/2008, last seen 11/03/2015.
Global CCS Institute, 2013. Deployment of CCS in the Cement Industry.http://ieaghg.org/docs/General_Docs/Reports/2013-19.pdf. Last updated 12/2013, last seen 11/03/2015.
Global cement, 2012. The British cement industry in 2011 and 2012.http://www.globalcement.com/magazine/articles/706-the-british-cement-industry-in-2011-and-2012%20%0D5.Last updated 11/06/2012, last seen 11/03/2015.
Global Cement, 2013. Hope – The UK’s newest cement producer.http://www.globalcement.com/magazine/articles/792-hope-the-uks-newest-cement-producer. Last updated20/06/2013, last seen 11/03/2015.
Global Magazine of the Concrete Society, 2014. Concrete – Incorporating Concrete EngineeringInternational, 48 (6).
House of Commons, 2012. Consumption-Based Emissions: Reporting Government Response to theCommittee’s Twelfth Report of Session 2010-2012.http://www.parliament.uk/business/committees/committees-a-z/commons-select/energy-and-climate-change-committee/inquiries/parliament-2010/consumption-based-emissions-reporting/. Last updated 25/07/2012,last seen 11/03/2015.
House of Commons, 2013. Progress on Carbon Budgets: Government response to the Committee’s FirthReport of Session 2013-2014. http://www.parliament.uk/business/committees/committees-a-z/commons-select/environmental-audit-committee/inquiries/parliament-2010/progress-on-carbon-budgets/. Last updated12/12/2013, last seen 11/03/2015.
House of Commons, 2014. Innovate to accumulate: the Government’s approach to low carbon innovation.http://www.publications.parliament.uk/pa/cm201415/cmselect/cmenergy/344/344.pdf. Last updated,22/07/2014, last seen 11/03/2015.
House of Commons, 2013. Written evidence submitted by the Mineral Products Association (HOT07).http://data.parliament.uk/writtenevidence/WrittenEvidence.svc/EvidencePdf/1525. Last updated 09/2013, lastseen 11/03/2015.
International Energy Agency (IEA) & World Business Council for Sustainable Development (WBCSD), 2009.Cement Technology Roadmap. http://www.iea.org/publications/freepublications/publication/Cement.pdf. Lastupdated 2009, last seen 11/03/2015.
INDUSTRIAL DECARBONISATION AND ENERGY EFFICIENCY ROADMAPS TO 2050 – CEMENT
Section 6 - References Page 89 of 94
Mineral Products Association (MPA), 2013. MPA Cement GHG Reduction Strategy: Roadmap to 2050.http://www.mineralproducts.org/documents/MPA_Cement_2050_Strategy.pdf. Last updated -02/2013, lastseen 11/03/2015.
Mineral Products Association (MPA), 2013. Embodied CO2e of UK cement, additions and cementitiousmaterial. http://www.sustainableconcrete.org.uk/pdf/Factsheet_18_FINAL.pdf. Last updated, 2013. Last seen11/03/2013.
Mineral Products Association (MPA), 2013. Novel Cements: low energy, low carbon cements.http://cement.mineralproducts.org/documents/FS_12_Novel_cements_low_energy_low_carbon_cements.pdf.Last updated 25/03/2013, last seen 11/03/2015.
Mineral Products Association (MPA), 2013. Carbonation from an Environmental Perspective.http://www.worldcement.com/europe-cis/19092013/MPA_Concrete_Centre_UK_carbonation_concrete_enviornmental_performance_193/. Lastupdated 19/09/2013, last seen 12/03/2015.
Mineral Products Association (MPA), 2014. UK Average Portland Cement Product Declaration.http://cement.mineralproducts.org/documents/UK_Average_Portland_Cement_EPD.pdf. Last updated05/02/2014, last seen 12/03/2015.
Mineral Products Association (MPA), 2014. Member’s Economic & Market Briefings, July/Aug/Sept 2014.
Mineral Products Association (MPA), 2013. Response from the Mineral Products Association to the Energyand Climate Change Committee Inquiry into Heat. http://cement.mineralproducts.org/documents/2013-09-02%20MPA%20response%20to%20ECC%20heat%20inquiry%20-%20F.pdf. Last updated 09/2013, lastseen 11/03/2015.
Mineral Products Association (MPA), 2014. Quarterly Cementitious 2001 – 2012, Annual Cementitious 2013.http://cement.mineralproducts.org/documents/annual-cementitious.pdf. Last updated 09/04/2014, last seen11/03/2015.
Norden, 2005. The CO2 balance of Concrete in a Life Cycle Perspective.http://nordicinnovation.org/Global/_Publications/Reports/2005/03018_the_co2_balance_of_concrete_in_a_life_cycle_perspective_final_report1.pdf/. Last updated 12/2005, last seen 11/03/2015.
Norden & BYGGFORSK, 2005. Carbon Dioxide uptake in demolished and crushed concrete.http://www.nordicinnovation.org/Global/_Publications/Reports/2005/03018%20C02%20uptake%20in%20concrete_Executive%20summary.pdf/. Last updated 01/2006, last seen 11/03/2015.
Office for National Statistics, 2014. Release: Annual Business Survey, 2013 Provisional Results.http://www.ons.gov.uk/ons/publications/re-reference-tables.html?edition=tcm%3A77-341896. Last updated13/11/2014, last seen 19/03/2015.
Peters, G., Minx, Jan., Weber, C., Edenhofer, O., 2011. Growth in emission transfers via international tradefrom 1990 to 2008, 2010. http://www.pnas.org/content/108/21/8903.full.pdf+html3. Last updated 29/03/2011,last seen 11/03/2015.
PriceWaterhouseCooper (PWC), 2013. Decarbonisation and the Economy.http://www.pwc.nl/nl/assets/documents/pwc-decarbonisation-and-the-economy.pdf. Last updated 10/2013,last seen 12/03/2015.
Ricardo AEA, 2013. Decarbonisation of heat in industry: A review of the research evidence Report for DECC.https://www.gov.uk/government/uploads/system/uploads/attachment_data/file/230949/D13_951813__Ricard
INDUSTRIAL DECARBONISATION AND ENERGY EFFICIENCY ROADMAPS TO 2050 – CEMENT
Section 6 - References Page 90 of 94
o_AEA_Industrial_Decarbonisation_Literature_Review_201___.pdf. Last updated 31/07/2013, last seen11/03/2015.
Sustainable Concrete Forum, 2012. Concrete Industry Sustainability Performance Report – 6th report: 2012performance data. http://www.sustainableconcrete.org.uk/pdf/Sustainable%20Report%202013_FINAL.pdf.Last updated 2012, last seen 11/03/2015.
The Boston Consulting Group, 2008. Assessment of the Impact of the 2013-2020 ETS Proposal on theEuropean Cement Industry – Final project report.
The Boston Consulting Group, 2008. Assessment of the Impact of the 2013-2020 ETS Proposal on theEuropean Cement Industry – Focus on the UK.
The Boston Consulting Group (post-2011 date unknown), The Cement Sector: A Strategic Contributor toEurope's Future.
The European Cement Association (CEMBUREAU), 2013. Activity Report 2013.http://www.cembureau.eu/sites/default/files/category_pictures/AR2013.pdf. Last updated 2013, last seen11/03/2015.
The European Cement Association (CEMBUREAU), 2013. Cements for a low-carbon Europe.http://www.cembureau.be/sites/default/files/documents/Cement%20for%20low-carbon%20Europe%20through%20clinker%20substitution.pdf. Last updated 2013, last seen 11/03/2015.
The European Cement Association (CEMBUREAU), 2013. The role of CEMENT in the 2050 LOW CARBONECONOMY.http://lowcarboneconomy.cembureau.eu/uploads/Modules/MCMedias/1380546575335/cembureau---full-report.pdf. Last updated 2013, last seen 11/03/2015.
The European Cement Association (CEMBUREAU), 2014. POST 2020 CLIMATE AND ENERGYLEGISLATION – The cement industry’s reflections on a post-2-2- climate policy.http://www.cembureau.eu/sites/default/files/CEMBUREAU%20-%20Concrete%20Policy%20Options%20Climate%20and%20Energy%20Future%20-%202014-07-07.pdf.Last updated 2014, last seen 11/03/2015.
World Business Council for Sustainable Development (WBCSD), 2002. The Cement sustainability initiativeour agenda for action. http://www.wbcsdcement.org/pdf/agenda.pdf. Last updated 07/2002, last seen11/03/2015.
World Business Council for Sustainable Development (WBCSD), 2008. The Cement Sustainability Initiative –Climate Actions. http://www.wbcsdcement.org/pdf/climateactions.pdf. Last updated 2013, last seen11/03/2015.
ZKG International, 2014. Why CO2 matters – advances in a new class of cement.http://www.zkg.de/en/artikel/zkg_2014-03_Why_CO2_matters_advances_in_a_new_class_of_cement_1952178.html. Last updated 03/2014, lastseen 12/03/2015.
INDUSTRIAL DECARBONISATION AND ENERGY EFFICIENCY ROADMAPS TO 2050 – CEMENT
Section 7 - Glossary Page 91 of 94
7. GLOSSARY
Glossary
Adoption
The percentage of sector production capacity to which a decarbonisation option has already been applied.Therefore, of the list of options being assessed, this is a measure of the degree to which they have alreadybeen deployed in the sector.
Applicability
The percentage of the sector production capacity to which a particular option can be applied. This is ameasure of the degree to which a decarbonisation option can be applied to a particular part of the sectorproduction process.
Barrier to Decarbonisation or Energy Efficiency
Barriers are factors that hinder companies from investing in and implementing technologies and initiativesthat contribute to decarbonisation
Business as Usual
A combination of carbon abatement options and energy savings that would be expected with thecontinuation of current rates of deployment of incremental improvement options in the sector up to 2050without significant intervention or outside support.
Decarbonisation
Reduction of CO2 emissions (in MtCO2) – relative to the reference trend for that scenario. When we reportcarbon dioxide – this represents CO2 equivalent. However, other GHGs were not the focus of the studywhich centred on both decarbonisation and improving energy efficiency in processes, combustion andindirect emissions from electricity used on site but generated off site. Also, technical options assessed in thiswork result primarily in CO2 emissions reduction and improved energy efficiency. In general, emissions ofother GHGs, relative to those of CO2, are very low.
Carbon reduction band or bins
The percentage ranges of CO2 reduction achieved for a given pathway in 2050 relative to the base year e.g.20-40% of the base year emission.
Carbon reduction curve or profile
A quantitative graph which charts the evolution of sector carbon emissions from 2014 to 2050
Competition Law
The UK has three main tasks:
· Prohibiting agreements or practices that restrict free trading and competition between businessentities. This includes in particular the repression of cartels.
INDUSTRIAL DECARBONISATION AND ENERGY EFFICIENCY ROADMAPS TO 2050 – CEMENT
Section 7 - Glossary Page 92 of 94
· Banning abusive behaviour by a firm dominating a market, or anti-competitive practices that tend tolead to such a dominant position. Practices controlled in this way may include predatory pricing, tying,price gouging, refusal to deal and many others.
· Supervising the mergers and acquisitions of large corporations, including some joint ventures.Transactions that are considered to threaten the competitive process can be prohibited altogether, orapproved subject to ‘remedies’ such as an obligation to divest part of the merged business or to offerlicences or access to facilities to enable other businesses to continue competing.
Deployment
Once the adoption and applicability of an option has been taken into account, each option can be deployedto reduce part of the sector’s CO2 emissions. Hence, the deployment of the option from 2015 through to 2050is illustrated in our analysis by the coloured matrix on the pathway presentations.
Enabler for decarbonisation or energy efficiency
Enablers are factors that that make an investment feasible or would either help overcome a barrier.
Grid CO2 emission factor
A specific scenario assumption relating to the average carbon intensity of grid electricity and projection(s) ofhow this may evolve to 2050
Maximum Technical Pathway (‘Max Tech’)
A combination of carbon abatement options and energy savings that is both highly ambitious but alsoreasonably foreseeable. It is designed to investigate what might be technically possible when other barriersare set to one side. Options selected in Max Tech take into account barriers to deployment but are notexcluded based on these grounds. Where there is a choice between one option or another, theeasier/cheaper option is chosen or two alternative max tech pathways are developed.
Option
A carbon reduction measure, often a technical measure, such as a more efficient process or technology
Option Register
The options register was developed jointly by the technical and social and business research teams. Thiswas achieved by obtaining the list of potential options from interviews, literature, asking participants at theevidence gathering workshop which options they would consider viable, and through engagement withmembers of the relevant trade associations.
Pathway
A particular selection and deployment of options from 2014 to 2050 chosen to achieve reductions falling intoa specific carbon reduction band
Projection of Production Changes
A sector specific scenario assumption which defines the changes in production as an annual percentagechange to 2050
INDUSTRIAL DECARBONISATION AND ENERGY EFFICIENCY ROADMAPS TO 2050 – CEMENT
Section 7 - Glossary Page 93 of 94
Reference trend
the carbon dioxide emission trend that would be followed if the 2012 base year emissions were affected byproduction change and grid decarbonisation in accordance with the sector specific scenarios
Scenario
A specific set of conditions external to the sector which will affect the growth and costs of production in thesector and affect the timing and impact of options on carbon emissions and energy consumption
Scenario assumptions
A set of specific cost and technical assumptions which characterise each scenario. These include forwardfuel and carbon price projections, grid CO2 factor projection and background economic growth rate. Theassumptions may include sector forward production projections.
Sensitivity case
The evaluation of the impact of changes in a single assumption on a pathway e.g. the availability of biomass

INDUSTRIAL DECARBONISATION AND ENERGY EFFICIENCY ROADMAPS TO 2050 – CEMENT
Section 8 - Acknowledgements Page 94 of 94
8. ACKNOWLEDGEMENTS
The authors would like to thank all those who contributed to this project. This included trade associations andtheir members, academic institutions and government officials within the sector team and also all those whocontributed to the project through attending workshops, engaging in interviews and provided data, reviewand comment to early drafts of the outputs.
WSP and Parsons Brinckerhoff have combined and are now one of the world's leading engineering professional services consulting firms.
Together we provide services to transform the built environment and restore the natural environment, and our expertise ranges from environmental remediation to urban planning, from engineering iconic buildings to designing sustainable transport networks, and from developing the energy sources of the future to enabling new ways of extracting essential resources.
We have approximately 32,000 employees, including engineers, technicians, scientists, architects, planners, surveyors, program and construction management professionals, and various environmental experts.
We are based in more than 500 offices across 39 countries worldwide.
www.wspgroup.com; www.pbworld.com.
DNV GL
Driven by its purpose of safeguarding life, property and
the environment, DNV GL enables organisations to
advance the safety and sustainability of their business. We
provide classification and technical assurance along with
software and independent expert advisory services to the
maritime, oil & gas, and energy industries. We also provide
certification services to customers across a wide range of
industries.
Combining leading technical and operational expertise, risk methodology and in-depth industry knowledge, we empower our customers’ decisions and actions with trust
and confidence. We continuously invest in research and
collaborative innovation to provide customers and society with operational and technological foresight.
With our origins stretching back to 1864, our reach today is
global. Operating in more than 100 countries, our 16,000 professionals are dedicated to helping customers make the
world safer, smarter and greener.
www.dnvgl.com