this report contains assessments of ... gain publications/retail...u.s. fresh fruit, fruit juices,...
TRANSCRIPT

THIS REPORT CONTAINS ASSESSMENTS OF COMMODITY AND TRADE ISSUES MADE BY
USDA STAFF AND NOT NECESSARILY STATEMENTS OF OFFICIAL U.S. GOVERNMENT
POLICY
Date:
GAIN Report Number:
Approved By:
Prepared By:
Report Highlights:
The growing hypermarket, supermarket and minimarket sectors offer significant opportunities for U.S.
food products. U.S. fresh fruit, fruit juices, frozen potato products, cheese, dried fruits and nuts, and pet
food are prominently available in local retail outlets. Further growth and changes in consumer
preferences, along with improved refrigeration and storage facilities, will create additional opportunities
for U.S. exporters.
Fahwani Y. Rangkuti
Chris Rittgers
Retail Foods Update
Retail Foods
Indonesia
ID1738
26/12/2017
Required Report - public distribution

Post:
Trends and Outlook
Indonesia is the 4th most populous nation in the world, with a population of approximately 265 million
in 2018. Around 50 percent of the population is between the ages of 5 and 34 years. Emerging middle
class consumers have a growing interest in imported goods, particularly for processed foods. In 2017,
about 28 percent of household consumption expenditures were spent on food items. The middle class
now accounts for 57 percent, up from 37 percent just 10 years ago.
Hypermarkets, supermarkets, and minimarkets continue to develop as purchasing power increases and
lifestyles change. However, the pace of development in retail outlets is not as rapid as in previous
years. Development is primarily occurring in urban areas. While potential for further growth exists,
land availability, local government permitting processes, and other regulatory requirements are still key
constraints.
The following regulations affect modern retail development:
Presidential Regulation No. 112/2007 (in addition to Ministry of Trade 145/1997 and Ministry of
Domestic Affairs and No. 57/1997), covers urban planning rules for traditional markets,
shopping centers and modern outlets. These regulations include regional planning, types of retail
outlets and permitted goods, operating hours, distribution and supply, fees, private labelling and
others.
Ministry of Trade Regulation (MOT) No. 53/2008 (replaced by MOT No 70/2013) regulates the
number, and distance of new modern outlets from traditional markets. The regulation also
provides guidelines defining modern retail outlets based on floor area, sales system, goods
traded, listing fees, discounts, and promotional costs.
MOT Regulation No. 70/2013 and its amendment, Regulation No. 56/2014, “Guidelines for
Structuring and Development of Traditional Markets, Shopping Malls, and Modern
Stores/Outlets” limits private label items sold in modern outlets to only 15 percent of stock
keeping units (SKU). Stores must sell a minimum of 80 percent domestic products, except for
specialty stores where product uniformity is required and cannot be sourced locally.
Minimarkets are not allowed to sell fresh products in bulk. Alcoholic beverages cannot be sold
at minimarkets located near housing complexes, places of worship, bus and train stations,
hospitals, youth centers, and schools). Ownership of retail outlets is limited to 150 stores.
Companies exceeding this cap must franchise outlets. Retailers operating more than 150 stores
prior to regulation’s implementation (MOT 56/2014 implemented September 17, 2014) are
permitted to continue operating with that number of stores.
MOT circular letter 1310/2014 dated December 22, 2014 instructs local authorities (governors,
regents, and provincial/regional/district mayors) in areas that have not created a land use plans to
suspend the establishment of new retail outlets. However, Economic Reform Package I, issued
in September 2015, allows local authorities to issue temporary permits. Only 9 of 514 cities have
land use plans.
Presidential Regulation No 44/2016 states that supermarkets smaller than 1,200 square meters
Jakarta

and minimarkets (including convenience and community stores) smaller than 400 square meters
require 100 percent Indonesian ownership.
MOT Regulation No 22/2016 prohibits importers from distributing goods directly to retailers.
However, an importer who also acts as a distributor may sell goods directly to a retailer.
MOF Regulation No. 116/2017 exempts rice, corn, sago, soybeans, salt, meat, eggs, milk, fruits,
vegetables, tubers, spices, and sugar from the value added tax.
Local government bodies have also limited permits for new convenience stores due to protests from
traditional market retailers. They enforce zoning and operating hour rules on convenience stores and
minimarket franchises (Presidential Decree No 112/2007 regulates the operating hours from 10 am – 10
pm Monday to Friday and 10 am to 11 pm on Saturday and Sunday).
The requirement to obtain product registration numbers (ML) for imported products also affects retail
sales. All imported retail-packaged foods must obtain an ML number (domestically produced retail-
packaged foods must obtain an MD number). A number of other persistent market access issues, such as
import recommendations, import permits, quotas, entry permits (SKI), and frequently changing trade
regulations continue to threaten U.S. food exports to the retail sector.
Enforcement of food product regulations often lacks transparency and consistency. The lack of
infrastructure, including, but not limited to poor port facilities, supply chain management, and cold
chain facilities also creates a drag on the wider distribution of food products throughout Indonesia.
Grocery prices are rising as a result of increasing regional wages and restrictive import laws. Farmer
access to training, technology and credit remains limited, thus limiting agricultural productivity growth
(relative to demand growth) and driving up prices. Supply chain challenges and logistical barriers
further inhibit production growth and add to production costs.
I. MARKET SUMMARY
The retail sector began rapid expansion in 1999, when Presidential Decrees No.96/2000 and 118/2000
(on negative and positive lists of businesses for capital investment) allowed Carrefour, a French retailer,
to expand retail operations to Jakarta. As other retailers followed, the sector became more competitive,
benefitting consumers and taking market share from traditional retail outlets. Foreign retailers now
include Carrefour (now locally owned and operated by CT Corp/PT Trans Retail, under the name Trans
Mart), Giant, Lotte Mart (formerly Makro), Lion Superindo, Spar, Aeon, Lulu, Circle K, Lawsons,
Family Mart, and GS Supermarket (Korean). Some modern retail chains have multi-format outlets.
Hypermarkets, supermarkets, convenience shops and minimarkets are all present in Jakarta.
The first Aeon supermarket opened at the end of March 2015 in BSD City, Tangerang Selatan and
owned by PT. Aeon Mall Sinar Mas Land Indonesia (PT. AMSL Indonesia). Aeon’s second location
opened in Cakung, North Jakarta, in September 2017, and will be followed by another supermarket in
Sentul-Bogor and other suburbs of Jakarta. SaveMax Super Grosir, owned by PT. Emporium Indonesia
(Gunung Sewu Group), has opened supermarkets outside the Jakarta region. PT. Ramayana Lestari
Sentosa Tbk (Ramayana) and SPAR International B.V. (entered Indonesia in September 2014) have
opened 23 SPAR Supermarkets in Jakarta and its surrounding areas. Jason Supermarkets (owned by

Hero Group), launched supermarkets in Jakarta, while Loka Supermarkets (owned by Mega Mahadana
Hadiya, Trakindo Group) has opened supermarkets in Malang,East Java, Cibubur and Balikpapan, East
Kalimantan. Matahari Group opened its first “smart club” in Tangerang on December 17, 2015 and
currently has 4 outlets. Lulu Group International of Abu Dhabi, managed by PT EK Prima Ekspor
Indonesia, launched a hypermarket and department store in East Jakarta (Cakung) in May 2016 and in
BSD City, Tangerang Selatan in September 2017. Lulu hypermarkets are also scheduled to open Sentul-
Bogor in the near future. GS-Supermarket from Korea opened two supermarkets in Cibubur in October
2016 and Jatiasih in March 2017. Additional GS Supermarket outlets will open in Tangerang at the end
2017.
Convenience stores are expanding rapidly in Indonesia. Following the introduction of 7-Eleven in 2009,
the stores have grown in popularity amongst young consumers and students. However, in June 30,
2017, Seven Eleven ceased operations due to several business and economic factors. Convenience
stores differ from minimarkets in that they offer fewer SKUs, while offering ready to eat foods and a
dining area. Locally owned minimarkets are progressively expanding to residential and office areas
throughout Java, Bali and other provinces. Minimarkets compete with traditional independent small
grocers (warungs), on the basis of price, cleanliness, food safety, and comfort. Independent small
grocers face this challenge by offering personalized, flexible services to their community.
In 2012, PT. Sumisho E-Commerce Indonesia (a joint venture company between Sumitomo Corporation
–Tokyo and PT. Sumitomo Indonesia) launched Sukamart as an on-line grocery store in Jakarta.
Currently, several retailers offer on-line shopping. These include Klikindomart.com by Indomaret;
Alfacart.com by Alfamart; shop.hypermart.co.id by Hypermart; and PT Supra Boga Lestari (Ranch
Market group) by Kesupermarket.com and tokopedia.com. Ranch Market, Farmers Market, Transmart,
Grand Lucky, Superindo, Papaya Supermarket, Total Buah Segar, Loka Supermarket, Prima Freshmart,
Hokky and Groovy Petshop use happyfresh.com online shopping and delivery order facility.
Table 1. Indonesia: Growth of Grocery Retail Outlets and Sales
Type of Outlets Value Growth (%) Number of
Outlets
(,000)
in 2016
No. Outlets Growth (%)
2015/2016 2011-2016
(CAGR)
2015/2016 2011-2016
(CAGR)
Convenience Stores 17.7 22.5 29.6 12.5 15.6
Hypermarkets 6.0 8.2 0.3 11.6 11.3
Supermarkets 6.0 9.9 1.4 1.9 5.1
Traditional Grocery
Retailers
6.8 7.6 4,589.8 -0.1 0.0
Source: Euromonitor;
Note: CAGR: Compound Annual Growth Rate
There are a variety of specialty food stores serving high-end consumers in major urban areas. Ranch
Market, The FoodHall, Grand Lucky, etc. provide premium grocery shopping and imported goods. Fruit
boutiques, such as Total Buah and All Fresh, are common and western & Japanese style bakeries are
also growing. The Kalbe E-store offers online retail and home delivery services for grocery and health
products.
Figure 1. Indonesia: Retail Sales Value Share (%)
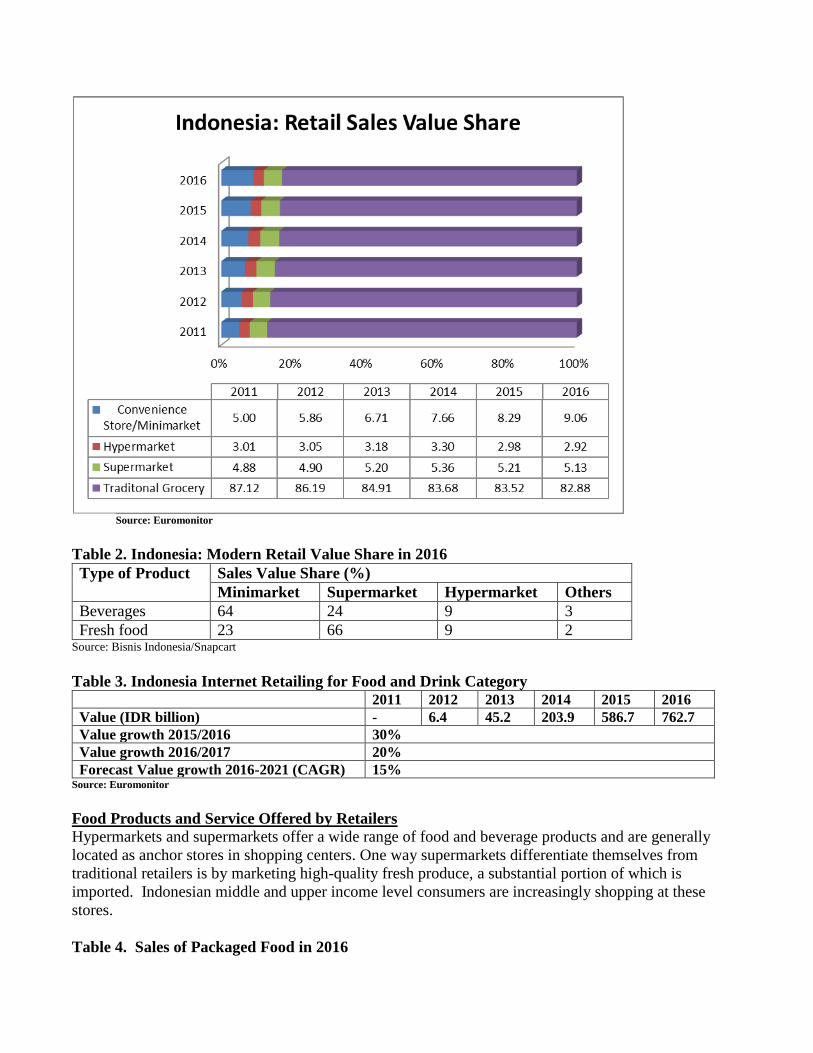
Source: Euromonitor
Table 2. Indonesia: Modern Retail Value Share in 2016
Type of Product Sales Value Share (%)
Minimarket Supermarket Hypermarket Others
Beverages 64 24 9 3
Fresh food 23 66 9 2 Source: Bisnis Indonesia/Snapcart
Table 3. Indonesia Internet Retailing for Food and Drink Category
2011 2012 2013 2014 2015 2016
Value (IDR billion) - 6.4 45.2 203.9 586.7 762.7
Value growth 2015/2016 30%
Value growth 2016/2017 20%
Forecast Value growth 2016-2021 (CAGR) 15% Source: Euromonitor
Food Products and Service Offered by Retailers
Hypermarkets and supermarkets offer a wide range of food and beverage products and are generally
located as anchor stores in shopping centers. One way supermarkets differentiate themselves from
traditional retailers is by marketing high-quality fresh produce, a substantial portion of which is
imported. Indonesian middle and upper income level consumers are increasingly shopping at these
stores.
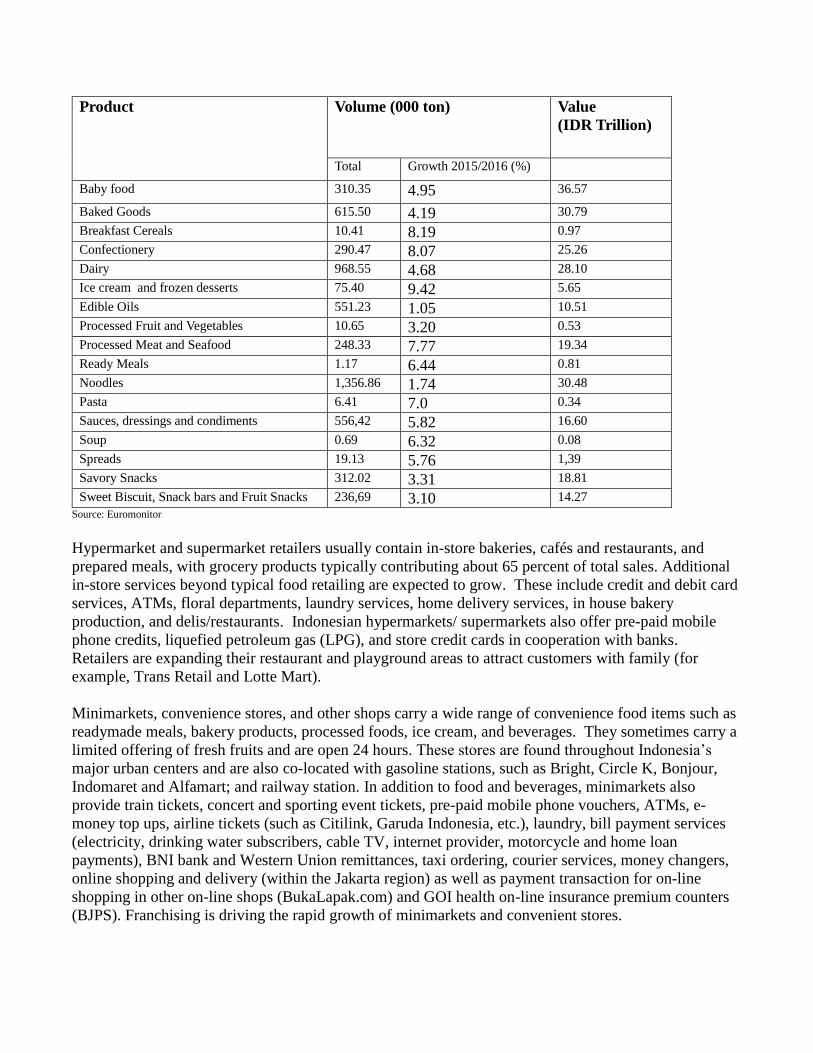
Table 4. Sales of Packaged Food in 2016
Product Volume (000 ton)
Value
(IDR Trillion)
Total Growth 2015/2016 (%)
Baby food 310.35 4.95 36.57
Baked Goods 615.50 4.19 30.79
Breakfast Cereals 10.41 8.19 0.97
Confectionery 290.47 8.07 25.26
Dairy 968.55 4.68 28.10
Ice cream and frozen desserts 75.40 9.42 5.65
Edible Oils 551.23 1.05 10.51
Processed Fruit and Vegetables 10.65 3.20 0.53
Processed Meat and Seafood 248.33 7.77 19.34
Ready Meals 1.17 6.44 0.81
Noodles 1,356.86 1.74 30.48
Pasta 6.41 7.0 0.34
Sauces, dressings and condiments 556,42 5.82 16.60
Soup 0.69 6.32 0.08
Spreads 19.13 5.76 1,39
Savory Snacks 312.02 3.31 18.81
Sweet Biscuit, Snack bars and Fruit Snacks 236,69 3.10 14.27
Source: Euromonitor
Hypermarket and supermarket retailers usually contain in-store bakeries, cafés and restaurants, and
prepared meals, with grocery products typically contributing about 65 percent of total sales. Additional
in-store services beyond typical food retailing are expected to grow. These include credit and debit card
services, ATMs, floral departments, laundry services, home delivery services, in house bakery
production, and delis/restaurants. Indonesian hypermarkets/ supermarkets also offer pre-paid mobile
phone credits, liquefied petroleum gas (LPG), and store credit cards in cooperation with banks.
Retailers are expanding their restaurant and playground areas to attract customers with family (for
example, Trans Retail and Lotte Mart).
Minimarkets, convenience stores, and other shops carry a wide range of convenience food items such as
readymade meals, bakery products, processed foods, ice cream, and beverages. They sometimes carry a
limited offering of fresh fruits and are open 24 hours. These stores are found throughout Indonesia’s
major urban centers and are also co-located with gasoline stations, such as Bright, Circle K, Bonjour,
Indomaret and Alfamart; and railway station. In addition to food and beverages, minimarkets also
provide train tickets, concert and sporting event tickets, pre-paid mobile phone vouchers, ATMs, e-
money top ups, airline tickets (such as Citilink, Garuda Indonesia, etc.), laundry, bill payment services
(electricity, drinking water subscribers, cable TV, internet provider, motorcycle and home loan
payments), BNI bank and Western Union remittances, taxi ordering, courier services, money changers,
online shopping and delivery (within the Jakarta region) as well as payment transaction for on-line
shopping in other on-line shops (BukaLapak.com) and GOI health on-line insurance premium counters
(BJPS). Franchising is driving the rapid growth of minimarkets and convenient stores.

While traditional small grocers (warungs) may not be able to offer varieties of products and services
offered by minimarkets, they do sell local food and beverage products familiar to the majority of
consumers. This differentiation, along with location, helps them remain competitive against organized
retail. Traditional markets also remain an important retailer in Indonesia. Like small grocers, they rely
on personalized services, local product offerings, and location to remain competitive.
Table 5. Indonesia: Retail (Off trade and On-trade) Beverage Sales in 2016
Product Volume
(million liters)
Value
(IDR Trillion)
Volume Growth (%)
2015/2016 Off-trade)
Bottle Water 20,440.8 45.80 11.6
Carbonates 1,065 16.01 3.4
Concentrates 108.6 8.92 - 1.5
Juice 661.3 9.53 7.8
RTD Coffee 94.2 2.49 20.5
RTD Tea 2,752.8 30.74 9.6
Sport and Energy
Drinks
661.1 10.10 4.5
Source: Euromonitor
Note: Most of the products by volume (93%) are sold off-trade
Local consumers tend to favor traditional retailers for the following reasons:
Price: Consumers tend to believe that traditional retail has lower costs across all categories
except dairy and processed food.
Quality & Safety: Consumers tend to believe that quality &food safety is better assured by
traditional retailers for meat and seafood, while modern retail is perceived to provide safer fruits,
dairy and processed foods.
Product information: Consumers regard modern retail as more transparent and forthcoming with
product information across all categories except vegetables
Figure 2. Indonesia: Modern Retail Outlet Sales (IDR Trillion)

Source: Euromonitor
Modern Retail Market Growth
Indonesian supermarkets/hypermarkets experience their peak hours during weekends, with 34 to 45
percent of shopping occurring at these times. Minimarket peak hours are usually at night. Traditional
outlets such as neighborhood stores and wet markets experience heaviest traffic on weekday mornings.
Consumers prefer to purchase certain specialty items from the organized sector (dairy, vitamin and
personal care products), while commodity goods (instant noodles, cooking oil, soy sauce) continue to be
procured from traditional sources.
The ‘recreation’ function of modern outlets is important, with 79 percent of consumers visiting
supermarkets/hypermarkets with their families. This trend is encouraged by Jakarta’s numerous
shopping malls and growing mall culture. Conversely, more than 65 percent of consumers prefer to visit
traditional markets alone.
Monthly average per capita expenditure for food is about IDR 460,639 ($34.55). This is approximately
50 percent of total monthly expenditures. A breakdown of average expenditures is as follows:
Figure 3. Food Expenditure (%)

Source: Statistic Indonesia
Distribution Channels
Wholesale and hypermarket outlets procure from domestic suppliers, distributors, and importers.
Ministry of Agriculture (MOA) Regulation No. 34/2016 revised beef imports regulations to include the
import of most muscle cuts, manufacturing meat, and variety meats (heart, liver and lungs). Regulation
No.34/2016 also allows the sale of imported beef through both traditional and modern retail outlets.
Indonesian regulations still prohibit retailers from purchasing imported horticultural products directly
from importers, limiting product availability and increasing prices.
Table 6: ADVANTAGES AND CHALLENGES FACING U.S. PRODUCTS MARKET
ADVANTAGES CHALLANGES
Large Consumer Base: Indonesia has a
population of 265 million people in
2018
Weak purchasing power of the majority of the
population.
The distribution system on the island of
Java is improving, providing increased
access to 57 % population.
Infrastructure, including ports and cold storage
facilities outside of the main island of Java, are poorly
developed.
The availability of imported products
will be accommodated by the rapid
growth of the modern retail sector;
Japanese, Korean, and Western
Import regulations are often complex and non-
transparent, thus requiring close business
relationships with a local agent. Obtaining a
registration number (ML) for imported food products

restaurant chains; bakeries and a well-
developed tourism industry
in retail packaged is complicated but required. Labels
must be written in Indonesian and attached before
entering Indonesia.
Many Indonesian consumers are aware
of the quality and safety of the U.S.
products.
Prices of imported products are relatively high
compared to locally produced products.
Low Duties: Duties on most food are
5% except for 153 value added food
product items (GAIN report ID1530)
Consolidated shipments with products from several
suppliers are often more cost effective for Indonesian
retailers. However, this increases import
documentation problems.
More urban women entering the
workforce with less time available for
shopping and cooking increasingly
focusing on convenience.
Product shelf life should be considered for shipments
to Indonesia due to the extended transportation and
inconsistent (non-transparent & unpredictable)
custom clearance procedures & time.
Some multinational companies have
commissary and catering services that
need imported products.
Third-country competition and promotion remains strong,
especially from Australia, New Zealand and China. Food
product imports from Malaysia, Philippines, Thailand and
Vietnam are growing. Bilateral free trade agreements
provide opportunities to competitors.
U.S. Fresh Food of Plant Origin
(FFPO) safety control system has been
recognized. FFPO recognition provides
expedited access to Indonesian ports
and Quarantine for U.S. foods of plant
origin.
The GOI intends to review FFPO recognition every
three years. Current regulations stipulate that only
three sea ports and one airport are allowed as a
horticultural entry points (MOA No. 15/2012).
Approximately 28 horticultural products must have an
import recommendation from Indonesian Ministry of
Agriculture, and import permit from Ministry of
Trade before imported to Indonesia ( MOA regulation
No 38/2017).
GOI approved several U.S. meat and
many U.S. dairy establishments to
export products to Indonesia.
Animal-based food must be certified “halal”. Import
recommendations from MOA and MOT are required
to obtain a ML.
Indonesia also does not produce
sufficient quantities of beef, dairy
products, tree nuts, temperate zone
fresh fruit and vegetables, and pet food.
U.S. freight costs are high relative to competing
origins.
II. ROAD MAP FOR MARKET ENTRY
Entry Strategy
An effective way to enter the Indonesian market is to appoint an agent. An agent can help assure the
widest product distribution as well as undertake the marketing efforts necessary to build product
awareness. In some situations, it may make sense to sell directly to supermarkets and/or to appoint them
as an exclusive distributor. This is particularly recommended for specialty products which are unlikely
to generate volumes sufficient to merit the interest of an agent. Initial sales efforts in Indonesia should

nevertheless include visits with potential agents as well as with key retailers to gain an understanding of
the market.
Market Access for Imported Food Products
Labeling Requirements for food product labeling (primarily for packaged food for retail sale) are broad in scope.
The National Agency for Drug and Food Control (BPOM) regulations require labels to be written in
Indonesian and to note GMO-derived ingredients. As of January 2013, supplementary labels should be
affixed prior to customs clearance (before arriving in Indonesia). Statements or claims on the benefit of
the food product shall only be included if they are supported by scientific facts which can be accounted
for. In addition to BOPM labeling regulations, exporters are expected to comply with the new Food Law
18/2012, and the Consumer Protection Act of 1999.
Imported Product Registration Number (ML)
All processed food products imported in retail packaging must be registered with BPOM before they are
allowed to be imported. The registration process should be conducted by a local agent or importer. The
process for registration of food is complex, often non-transparent, costly, and time consuming due to the
detailed requirements regarding supporting documentation that should be carried out before shipping.
However, the ML registration processed has improved slightly by the implementation of the E-
registration for low risk processed food since early 2013.
BPOM regulations require importers to apply for an import recommendation for animal based food
products, including processed products, from the Director General of Livestock Services, Ministry of
Agriculture. This recommendation must be obtained before an exporter applies for an ML number.
Entry Permit (SKI) In March 2008, BPOM released a regulation (the latest is regulation No. 4/2017) which stated that all
imported food material/ingredients, including processed foods, must obtain an entry permit (SKI) from
the head of BPOM for every shipment. The SKI is needed to release the products from customs. To
obtain the permit, an importer must provide supporting data and documents.
Horticultural and Animal-Based Food Products
The Ministry of Agriculture issued a new regulation on animal and animal product imports on July 15,
2016. MOA Regulation No. 34/2016 (which replaces MOA Regulation 58/2015, No 139/2014 and No
2/2015), allows secondary cuts and offal imports for general importers and producer importers. Import
recommendation applications for animal products can be submitted to MOA at any time. Import permits
issued by MOT (regulation No. 59/2016) remain valid for six months from the date of the import
recommendation issuance. Similar to the previous regulation, MOA Regulation No.34/2016 and MOT
Regulation No.59/2016 do not establish an official quota, but import quantities are constrained via other
means. This regulation opens the market for imported beef to traditional market and modern retail
outlets (the GOI had prohibited selling imported meat to retailers since 2011).
MOA issued a new regulation, No. 38/2017, on horticulture imports (replaces MOA Regulation No.
16/2017 which issued on May 2017). The regulation covers 28 fresh horticulture commodities
(previously covered 54 products included processed horticulture products). Importers can apply for

import licenses twice per year. MOT issues import permits and specifies quantities permitted to import
based on an MOT’s estimate of an importer’s cold storage capacity.
Halal In September 2014, Indonesia passed a law governing halal products (33/2014). The law makes halal
certification mandatory for all food, beverage, drugs, cosmetics, chemicals, organic and genetically
modified products sold in Indonesia, as well as machinery and equipment used in processing these
products. By 2019 all companies have to comply with the new law. The government established a new
institution called the Halal Product Guarantee Agency (BPJPH) under the Ministry of Religious Affairs.
This new agency launched on October 11, 2017. BPJPH will oversee the collection of fees and
issuance of halal certificates for specific products. However, as of December 2017, BPJPH had not
issued any implementing regulations. Therefore, businesses are expected to follow existing MUI rules
and procedures.
Duties and Taxes
Although most food and agricultural product import duties are 5 percent, most imported products are
also assessed a value added tax of 10 percent and a sales tax of 2.5 percent. In July 2015, The Ministry
of Finance (MOF) issued a regulation on tariff changes to value-added goods. The regulation covered
153 products including coffee, tea, sausages/processed meat/fish/other fish products, sugar and
confectionery items, chocolate, pasta, bread, pastry, biscuits ,preserved vegetables/fruit/nuts, sauces, ice
cream, tempeh, wine, fermented beverages, and liqueurs. New tariffs vary from 10 to 30 percent
although fermented beverage and liquor (alcoholic beverages) tariffs are 90 percent (HS Code 2204,
2205, 2206) and 150% (HS Code 2208). Alcoholic beverages are imported based on a quota set by MOT
every April.
In January 2014, MOF implemented a new excise tax for ethyl alcohol, beverages, and concentrates
containing ethyl alcohol.
Table 7. Indonesia: Excise Tax for Ethyl Alcohol and Products Containing Ethyl Alcohol
Type Ethyl Alcohol content Excise Tax (IDR per
liter)
Domestic
Product
Import
I. Ethyl alcohol or ethanol
All kinds of ethyl alcohol, level content, and type 20,000 20,000
II. Beverages containing ethyl alcohol
A 5% or less 13, 000 13,000
B More than 5% up to 20% 33,000 44,000
C More than 20% 80,000 139,000
III. Concentrate containing ethyl alcohol
All concentrates, content level and type, as a raw material or
processing aid in beverages contain ethyl alcohol production
100,000 100,000
Starting mid-April 2015, MOT 6/2015 prevents “A-category alcoholic beverages” (alcohol content <5

percent) from sale in minimarkets. A-category beverages are still allowed to be sold in Supermarkets
and Hypermarkets.
The following are the SNI mandatory products:
- Biscuits (HS Codes 1905.31.10.00; 1905.31.20.00; 1905.32.00.00; 1905.90.20.00;
1905.90.90.00). The provision has not yet been implemented. The Ministry of Industry (MOI)
issued a circular letter dated July 25, 2016, postponing the implementation date of mandatory
biscuit SNI. However, no implementation date has been set.
- Bottle water (HS Code 2201.10.10, 2853.90.10 and 2201.10.10, 2201.90.90).
The provision was implemented on March 14, 2012
- Instant coffee (HS Code 2101.11.10) for retail packages and bulk.
The provision will be implemented on January 17, 2016
- Palm cooking oil (HS Code 1511.90.92.00, 1511.90.99.00, 1516.20.98.00).
The provision was implemented on March 27, 2015
- Wheat flour (HS Code 1101.00.11).
The provision was implemented on October 27, 2015
- Cacao powder (HS Code 1805.00.00.)
The products should comply with cacao powder SNI (3747:1995).
Competition
U.S. food products are sometimes less competitive in Indonesia due to high freight costs relative to
competing origins and locally produced products. Consolidated shipments with products from several
suppliers are highly favored and are often more cost effective for Indonesian importers. Competition
remains strong from countries in the region, especially Australia, New Zealand and China. Food
product imports from ASEAN countries such as Malaysia, Philippines, Thailand and Vietnam are also
growing.
Local food producers are largely specialized on conventional Asian staples. As a result, many premium
categories and western-style foods are underserved in Indonesia. Indonesian consumers also associate
quality and safety with U.S. food products. These two points are possible advantages for U.S.
businesses seeking to export to Indonesia.
Market Structure
Distribution System
Indonesia’s distribution system is complex due to the geographic isolation of the Indonesian
archipelago. Infrastructure is often inadequate, especially outside of Java and major cities. The ability
to move frozen and refrigerated products is limited. There are several national distributors, generally
subsidiaries of consumer goods and food manufacturers, who serve the whole country. There are also
numerous agents and distributors with a more local reach. There are hundreds of wholesalers
(traditional wholesalers) and millions of retailers.
Inadequate port facilities are often cited as the single largest distribution constraint. Shallow drafts limit
ports to small ships, and inadequate loading/unloading facilities and frequent congestion are frequently
cited problems. Poor roads and bad traffic in and out of ports are also a constraint. Distribution firms

also cite unreliable shipping schedules and an inadequate number of small ships serving Eastern
Indonesia, particularly during bad weather periods. This can result in shortages and obligate firms to
maintain large and costly inventories.
Most imported products are sold through the modern retail stores (hypermarkets, supermarkets,
wholesalers, convenience stores, and minimarkets). Imported products often move to a distributor or
agent, who in turn, sells directly to modern retail outlets. Delivery of the products may be direct to stores
or to the warehousing facilities of the retailer. Only a few retailers buy directly from foreign suppliers
and assume responsibility for logistics. There are about 16 major cities that serve as distribution hubs in
Indonesia. They are Bandung, Cirebon, Yogyakarta, Semarang, Surabaya, Makassar, Manado,
Denpasar, Mataram, Balikpapan, Banjarmasin, Medan, Padang, Pakanbaru, Palembang, and Batam.
Products moving through the traditional sector face a more extensive distribution process. Generally,
products move to a distributor’s warehousing facilities in a hub city, then to sub-distributors and
wholesalers for delivery to retailers.
Figure 4: Indonesia: Distribution Channels
Trends in Distribution
Although the modern retail sector is expanding rapidly, the traditional distribution systems are expected
to remain prevalent in the short term. Over the long term, modern retail distribution channels are
expected to become more efficient as direct procurement from suppliers increases. Under current
regulations, retailers have to procure most imported supplies through importers who also act as
distributors. Efficiencies will also be gained as central warehousing and distribution centers expand
throughout the country. Inadequate infrastructure on several of the Islands hinders this expansion.
The success of big retailer chains, wholesalers, and hypermarkets in offering consumers a wide variety
of products at lower prices is expected to stimulate the growth of imported food sales. More middle and
low-income consumers are using organized retail outlets. Increasing competition will force existing
supermarkets and other modern retailers to focus on targeted consumer groups, to become more
sophisticated in their marketing efforts, and to improve store operation efficiencies. The number of
minimarkets and other small stores will continue to grow. The greatest expansion is on the islands of
Java and Bali, in residential areas and cities outside of Jakarta.
A. SUPERSTORES, SUPERMARKETS, HYPERMARKETS OR SUPERCENTERS, CLUB AND
WAREHOUSE OUTLETS.
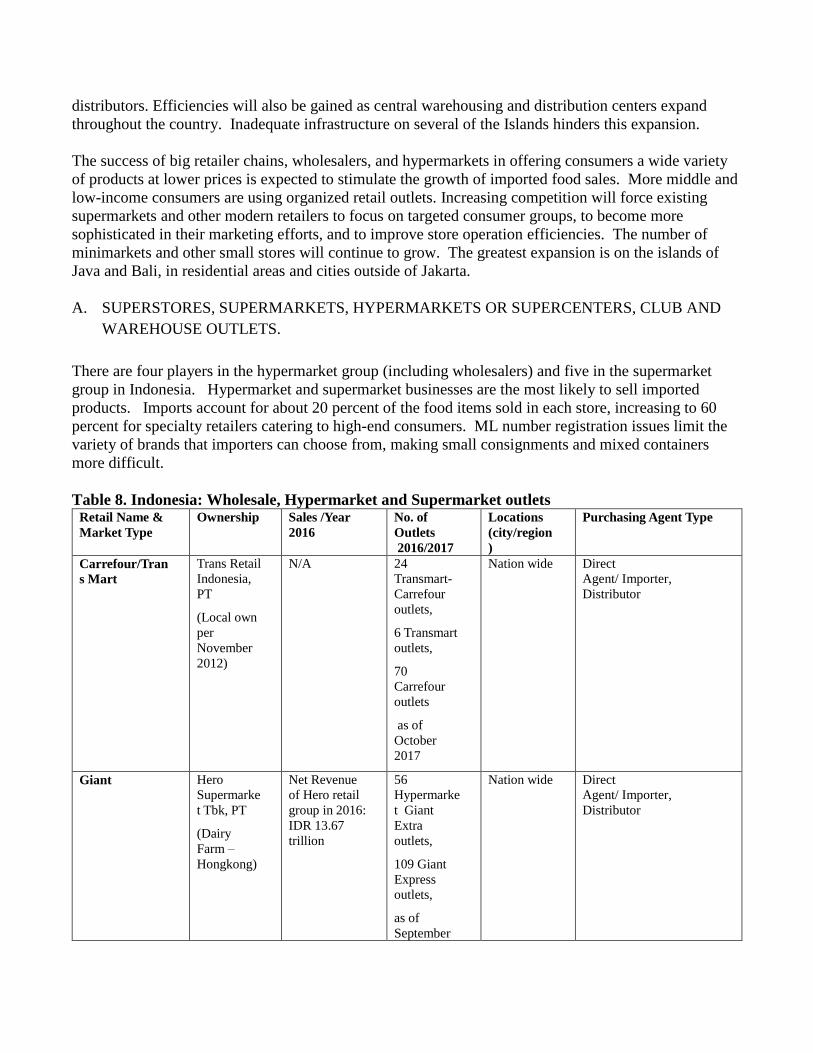
There are four players in the hypermarket group (including wholesalers) and five in the supermarket
group in Indonesia. Hypermarket and supermarket businesses are the most likely to sell imported
products. Imports account for about 20 percent of the food items sold in each store, increasing to 60
percent for specialty retailers catering to high-end consumers. ML number registration issues limit the
variety of brands that importers can choose from, making small consignments and mixed containers
more difficult.
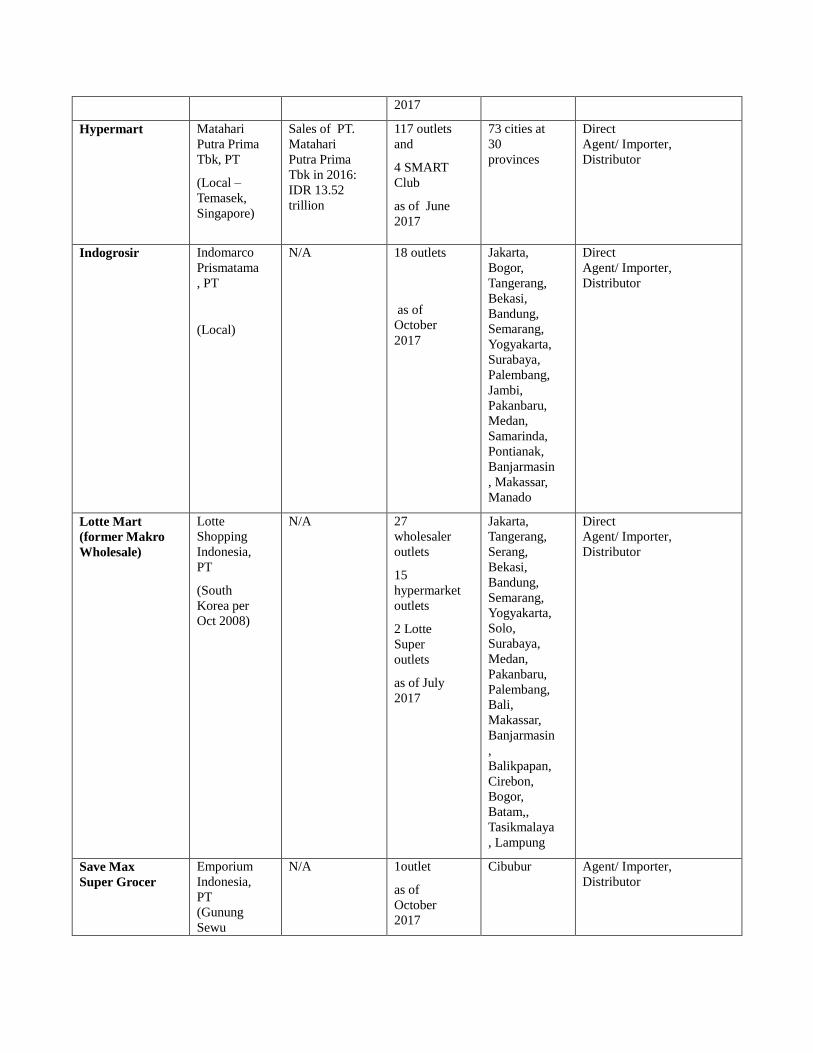
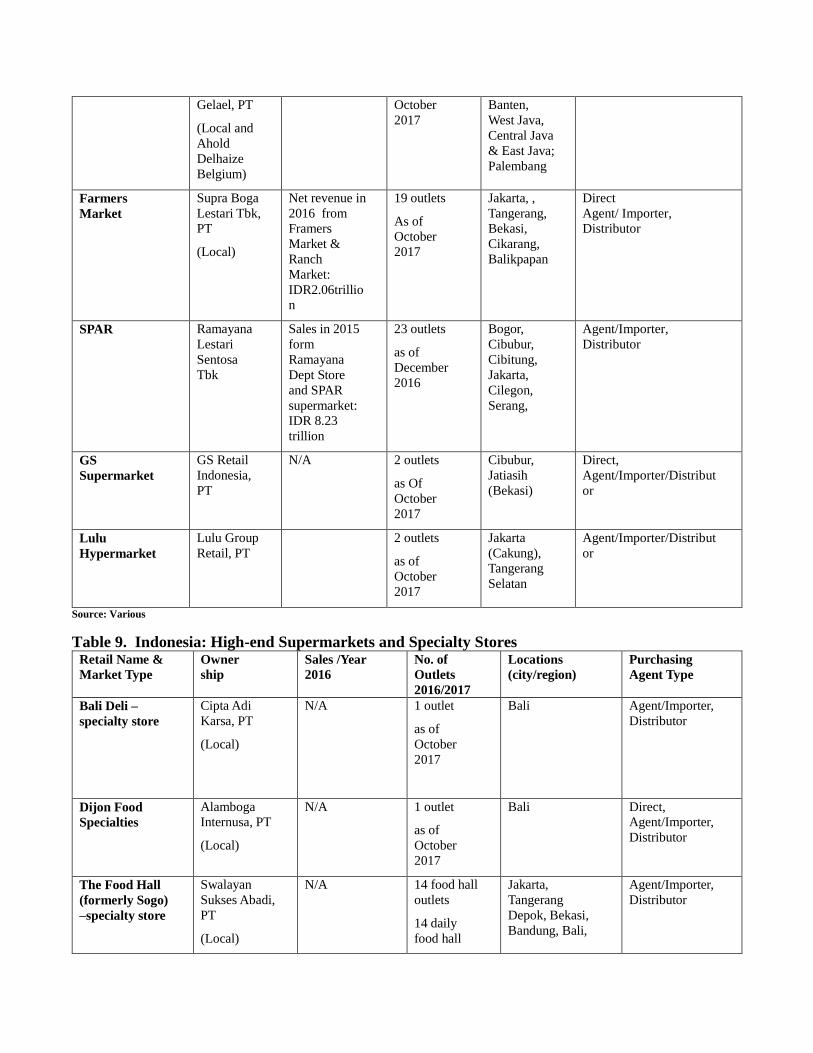
Table 8. Indonesia: Wholesale, Hypermarket and Supermarket outlets Retail Name &
Market Type
Ownership Sales /Year
2016
No. of
Outlets
2016/2017
Locations
(city/region
)
Purchasing Agent Type
Carrefour/Tran
s Mart
Trans Retail
Indonesia,
PT
(Local own
per
November
2012)
N/A 24
Transmart-
Carrefour
outlets,
6 Transmart
outlets,
70
Carrefour
outlets
as of
October
2017
Nation wide Direct
Agent/ Importer,
Distributor
Giant Hero
Supermarke
t Tbk, PT
(Dairy
Farm –
Hongkong)
Net Revenue
of Hero retail
group in 2016:
IDR 13.67
trillion
56
Hypermarke
t Giant
Extra
outlets,
109 Giant
Express
outlets,
as of
September
Nation wide Direct
Agent/ Importer,
Distributor
2017
Hypermart Matahari
Putra Prima
Tbk, PT
(Local –
Temasek,
Singapore)
Sales of PT.
Matahari
Putra Prima
Tbk in 2016:
IDR 13.52
trillion
117 outlets
and
4 SMART
Club
as of June
2017
73 cities at
30
provinces
Direct
Agent/ Importer,
Distributor
Indogrosir Indomarco
Prismatama
, PT
(Local)
N/A 18 outlets
as of
October
2017
Jakarta,
Bogor,
Tangerang,
Bekasi,
Bandung,
Semarang,
Yogyakarta,
Surabaya,
Palembang,
Jambi,
Pakanbaru,
Medan,
Samarinda,
Pontianak,
Banjarmasin
, Makassar,
Manado
Direct
Agent/ Importer,
Distributor
Lotte Mart
(former Makro
Wholesale)
Lotte
Shopping
Indonesia,
PT
(South
Korea per
Oct 2008)
N/A 27
wholesaler
outlets
15
hypermarket
outlets
2 Lotte
Super
outlets
as of July
2017
Jakarta,
Tangerang,
Serang,
Bekasi,
Bandung,
Semarang,
Yogyakarta,
Solo,
Surabaya,
Medan,
Pakanbaru,
Palembang,
Bali,
Makassar,
Banjarmasin
,
Balikpapan,
Cirebon,
Bogor,
Batam,,
Tasikmalaya
, Lampung
Direct
Agent/ Importer,
Distributor
Save Max
Super Grocer
Emporium
Indonesia,
PT
(Gunung
Sewu
N/A 1outlet
as of
October
2017
Cibubur Agent/ Importer,
Distributor

Group)
(Local)
AEON AMSL
Indonesia,
PT
(Japan)
N/A 2 outlet
as of
October
2017
Jakarta,
Tangerang
Selatan
Agent/ Importer,
Distributor
Alfa Midi
(bigger than
minimarket but
smaller than
supermarket)
Midi Utama
Indonesia
Tbk, PT
(Local)
Net revenue in
2016: IDR
8.49 trillion
from
Alfamidi,
Alfa
Supermarket
& Lawson
1,300
outlets
as of March
2017
Sumatera,
Java,
Kalimantan
and
Sulawesi
Direct
Agent/ Importer,
Distributor
Food Mart
group/Food
Mart Gourmet
Matahari
Putra Prima
Tbk, PT
(Local-
Temasek,
Singapore)
Sales of PT.
Matahari
Putra Prima
Tbk in 2016:
IDR 13.52
trillion
26 Food
mart Primo
and
Foodmart
Fresh)
as of June
2017
Jakarta,
Tangerang,
Bogor,
Krawang,
Cirebon,
Klaten,
Purwokerto,
Yogjakarta,
Surabaya,
Jember,
Bali,
Balikpapan,
Samarinda,
Ambon,
Padang,
Medan,
Palembang
Direct
Agent/ Importer,
Distributor.
Hero Hero
Supemarket
Tbk, PT
(Dairy
Farm –
Hongkong)
Net revenue
from Hero
retail group in
2016: IDR
13.67 trillion
32 Hero
Supermarke
t outlets
2 Jason
supermarket
outlets
As of
September
2017
Jakarta,
Bekasi,
Bogor
District,
Tangerang,
Tangerang
Selatan,
Bandung,
Yogyakarta,
Surabaya,
Sidoarjo,
Mataram,
Tembaga
Pura,
Timika,
Makassar,
Balikpapan,
Direct
Agent/ Importer,
Distributor.
Superindo Lion
Superindo –
N/A 145 outlets
as of
Jakarta,
several
cities in
Direct
Agent/ Importer,
Distributor
Gelael, PT
(Local and
Ahold
Delhaize
Belgium)
October
2017
Banten,
West Java,
Central Java
& East Java;
Palembang
Farmers
Market
Supra Boga
Lestari Tbk,
PT
(Local)
Net revenue in
2016 from
Framers
Market &
Ranch
Market:
IDR2.06trillio
n
19 outlets
As of
October
2017
Jakarta, ,
Tangerang,
Bekasi,
Cikarang,
Balikpapan
Direct
Agent/ Importer,
Distributor
SPAR Ramayana
Lestari
Sentosa
Tbk
Sales in 2015
form
Ramayana
Dept Store
and SPAR
supermarket:
IDR 8.23
trillion
23 outlets
as of
December
2016
Bogor,
Cibubur,
Cibitung,
Jakarta,
Cilegon,
Serang,
Agent/Importer,
Distributor
GS
Supermarket
GS Retail
Indonesia,
PT
N/A 2 outlets
as Of
October
2017
Cibubur,
Jatiasih
(Bekasi)
Direct,
Agent/Importer/Distribut
or
Lulu
Hypermarket
Lulu Group
Retail, PT
2 outlets
as of
October
2017
Jakarta
(Cakung),
Tangerang
Selatan
Agent/Importer/Distribut
or
Source: Various
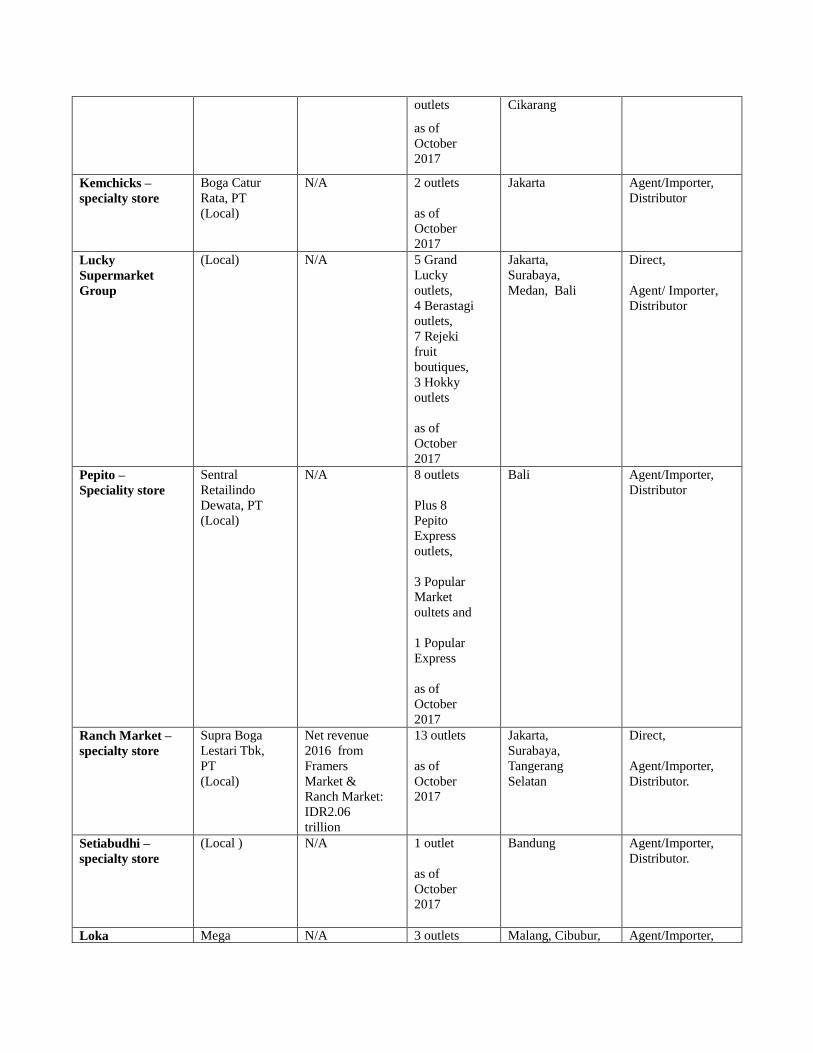
Table 9. Indonesia: High-end Supermarkets and Specialty Stores Retail Name &
Market Type
Owner
ship
Sales /Year
2016
No. of
Outlets
2016/2017
Locations
(city/region)
Purchasing
Agent Type
Bali Deli –
specialty store
Cipta Adi
Karsa, PT
(Local)
N/A 1 outlet
as of
October
2017
Bali Agent/Importer,
Distributor
Dijon Food
Specialties
Alamboga
Internusa, PT
(Local)
N/A 1 outlet
as of
October
2017
Bali Direct,
Agent/Importer,
Distributor
The Food Hall
(formerly Sogo)
–specialty store
Swalayan
Sukses Abadi,
PT
(Local)
N/A 14 food hall
outlets
14 daily
food hall
Jakarta,
Tangerang
Depok, Bekasi,
Bandung, Bali,
Agent/Importer,
Distributor
outlets
as of
October
2017
Cikarang
Kemchicks –
specialty store
Boga Catur
Rata, PT
(Local)
N/A 2 outlets
as of
October
2017
Jakarta Agent/Importer,
Distributor
Lucky
Supermarket
Group
(Local) N/A 5 Grand
Lucky
outlets,
4 Berastagi
outlets,
7 Rejeki
fruit
boutiques,
3 Hokky
outlets
as of
October
2017
Jakarta,
Surabaya,
Medan, Bali
Direct,
Agent/ Importer,
Distributor
Pepito –
Speciality store
Sentral
Retailindo
Dewata, PT
(Local)
N/A 8 outlets
Plus 8
Pepito
Express
outlets,
3 Popular
Market
oultets and
1 Popular
Express
as of
October
2017
Bali Agent/Importer,
Distributor
Ranch Market –
specialty store
Supra Boga
Lestari Tbk,
PT
(Local)
Net revenue
2016 from
Framers
Market &
Ranch Market:
IDR2.06
trillion
13 outlets
as of
October
2017
Jakarta,
Surabaya,
Tangerang
Selatan
Direct,
Agent/Importer,
Distributor.
Setiabudhi –
specialty store
(Local ) N/A 1 outlet
as of
October
2017
Bandung Agent/Importer,
Distributor.
Loka Mega N/A 3 outlets Malang, Cibubur, Agent/Importer,

Mahadana
Hadiya,
(Mahadya),
PT
(Local)
as of
October
2017
Balikpapan Distributor
Major Fruit Boutique
All Fresh (Local) N/A 10 outlets
as of
October
2017
Jakarta, Bogor,
Bekasi,
Tangerang
Agent/Importer,
Distributor.
Jakarta Fruit
Market
(Local) N/A 3 outlets
as of
October
2017
Jakarta Agent/Importer,
Distributor.
Total Buah (Local) N/A 18 outlets
as of
October
2017
Jakarta, Bogor,
Tangerang,
Bekasi, Bandung,
Surabaya
Agent/Importer,
Distributor.
Rumah Buah (Local) N/A 7 outlets
as of
October
2017
Jakarta, Cibubur,,
Tangerang,
Bandung
Agent/Importer,
Distributor.
Japanese
Papaya Fresh
Gallery – Japan
specialty store
Masuya
Graha
Trikenca, PT
Group
(Local)
N/A 10 outlets
as of
October
2017
Jakarta,
Bandung,
Surabaya, Bali,
Cikarang
Agent/Importer,
Distributor.
Korean
Hanil Mart –
Korean
specialty store
(Local) N/A 2 outlets
as of
October
2017
Jakarta,
Tangerang
Agent/Importer,
Distributor.
Mu Gung Hwa
– Korean
specialty store
(Local) N/A 5 outlets
as of
October
2017
Jakarta,
Tangerang,
Cikarang,
Surabaya
Agent/Importer,
Distributor.
New Seoul
Super- Korean
specialty store
(Local) N/A 1 outlet
as of
October
2017
Jakarta Agent/Importer,
Distributor.
K- Mart (Local) N/A 1 outlet
as of
October
2017
Jakarta Agent/Importer,
Distributor.
Source: Various
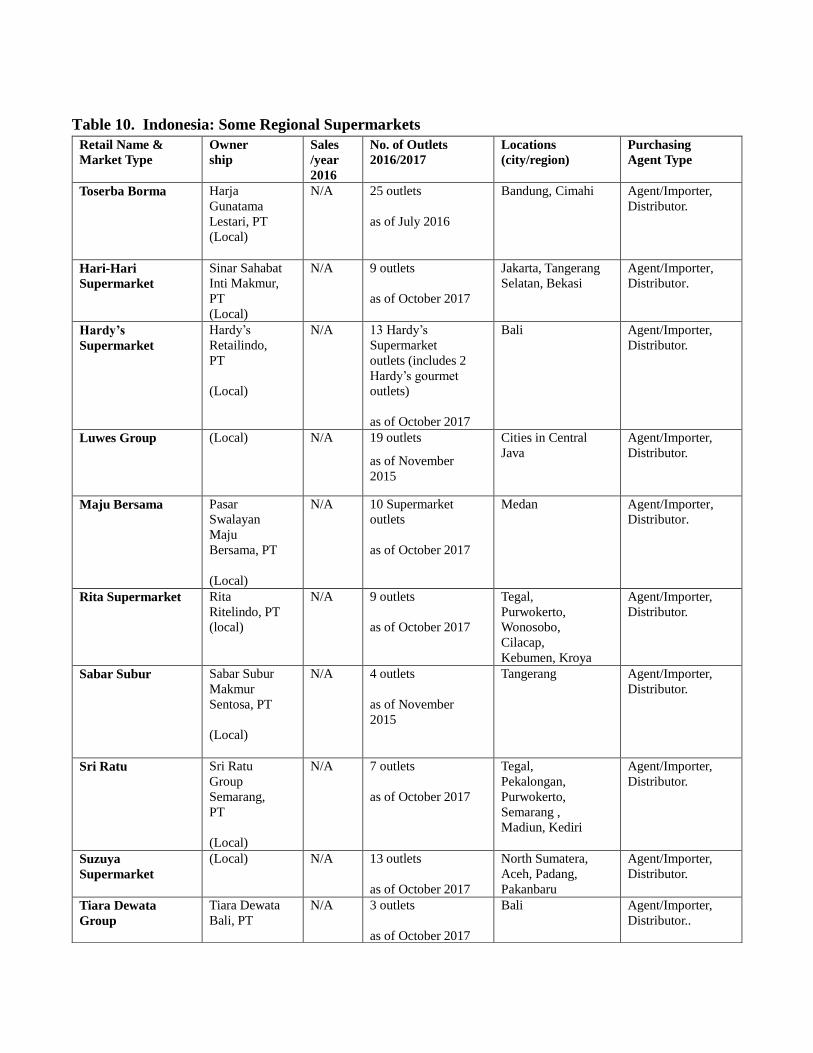
Table 10. Indonesia: Some Regional Supermarkets
Retail Name &
Market Type
Owner
ship
Sales
/year
2016
No. of Outlets
2016/2017
Locations
(city/region)
Purchasing
Agent Type
Toserba Borma Harja
Gunatama
Lestari, PT
(Local)
N/A 25 outlets
as of July 2016
Bandung, Cimahi Agent/Importer,
Distributor.
Hari-Hari
Supermarket
Sinar Sahabat
Inti Makmur,
PT
(Local)
N/A 9 outlets
as of October 2017
Jakarta, Tangerang
Selatan, Bekasi
Agent/Importer,
Distributor.
Hardy’s
Supermarket
Hardy’s
Retailindo,
PT
(Local)
N/A 13 Hardy’s
Supermarket
outlets (includes 2
Hardy’s gourmet
outlets)
as of October 2017
Bali Agent/Importer,
Distributor.
Luwes Group (Local) N/A 19 outlets
as of November
2015
Cities in Central
Java
Agent/Importer,
Distributor.
Maju Bersama Pasar
Swalayan
Maju
Bersama, PT
(Local)
N/A 10 Supermarket
outlets
as of October 2017
Medan Agent/Importer,
Distributor.
Rita Supermarket Rita
Ritelindo, PT
(local)
N/A 9 outlets
as of October 2017
Tegal,
Purwokerto,
Wonosobo,
Cilacap,
Kebumen, Kroya
Agent/Importer,
Distributor.
Sabar Subur Sabar Subur
Makmur
Sentosa, PT
(Local)
N/A 4 outlets
as of November
2015
Tangerang Agent/Importer,
Distributor.
Sri Ratu Sri Ratu
Group
Semarang,
PT
(Local)
N/A 7 outlets
as of October 2017
Tegal,
Pekalongan,
Purwokerto,
Semarang ,
Madiun, Kediri
Agent/Importer,
Distributor.
Suzuya
Supermarket
(Local) N/A 13 outlets
as of October 2017
North Sumatera,
Aceh, Padang,
Pakanbaru
Agent/Importer,
Distributor.
Tiara Dewata
Group
Tiara Dewata
Bali, PT
N/A 3 outlets
as of October 2017
Bali Agent/Importer,
Distributor..
(Local)
Bintang
Supermarket
N/A 2 outlets
as of October 2017
Bali Agent/Importer,
Distributor.
Tip Top Tip Top, PT
(Local)
N/A 7 outlets
as of October 2017
Jakarta,
Tangerang,
Bekasi, Depok,
Tambun
Agent/Importer,
Distributor.
Yogya + Toserba
Griya
Supermarket
(Yogya Group)
Akur
Pratama, PT
(Local)
N/A 82 outlets
as of July 2016
Jakarta, West Java,
Majenang, Tegal,
Pemalang, Brebes
Agent/Importer,
Distributor.
Source: Various
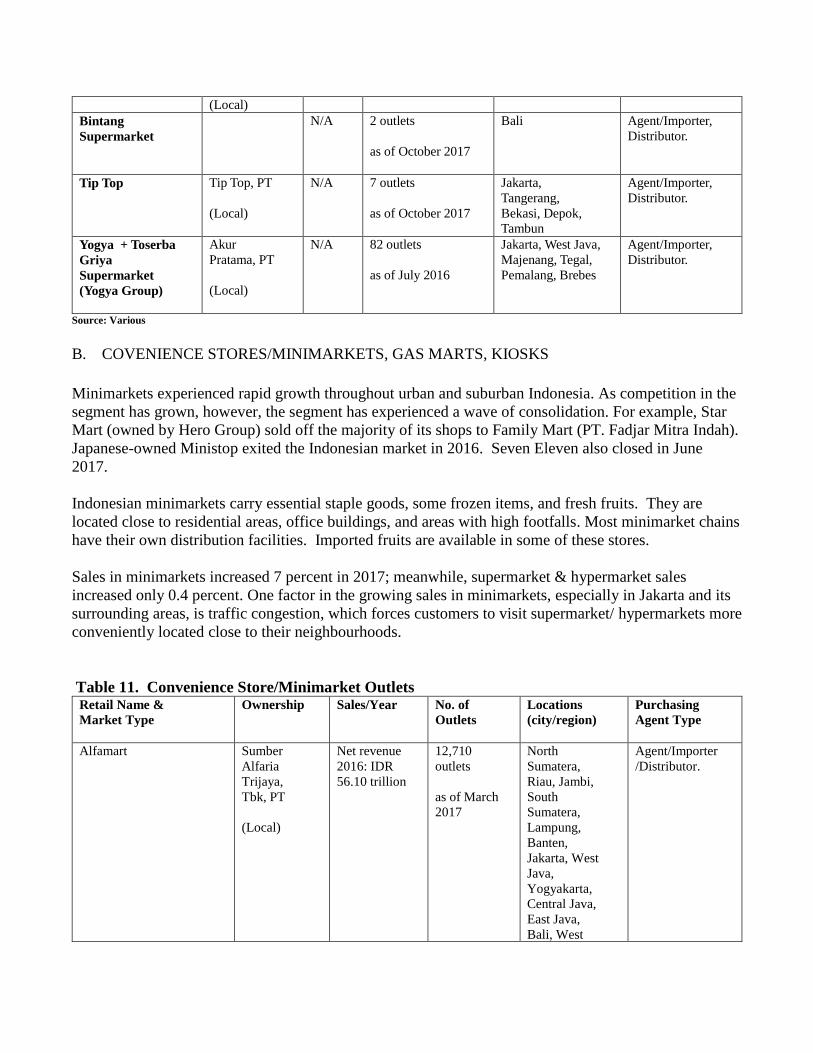
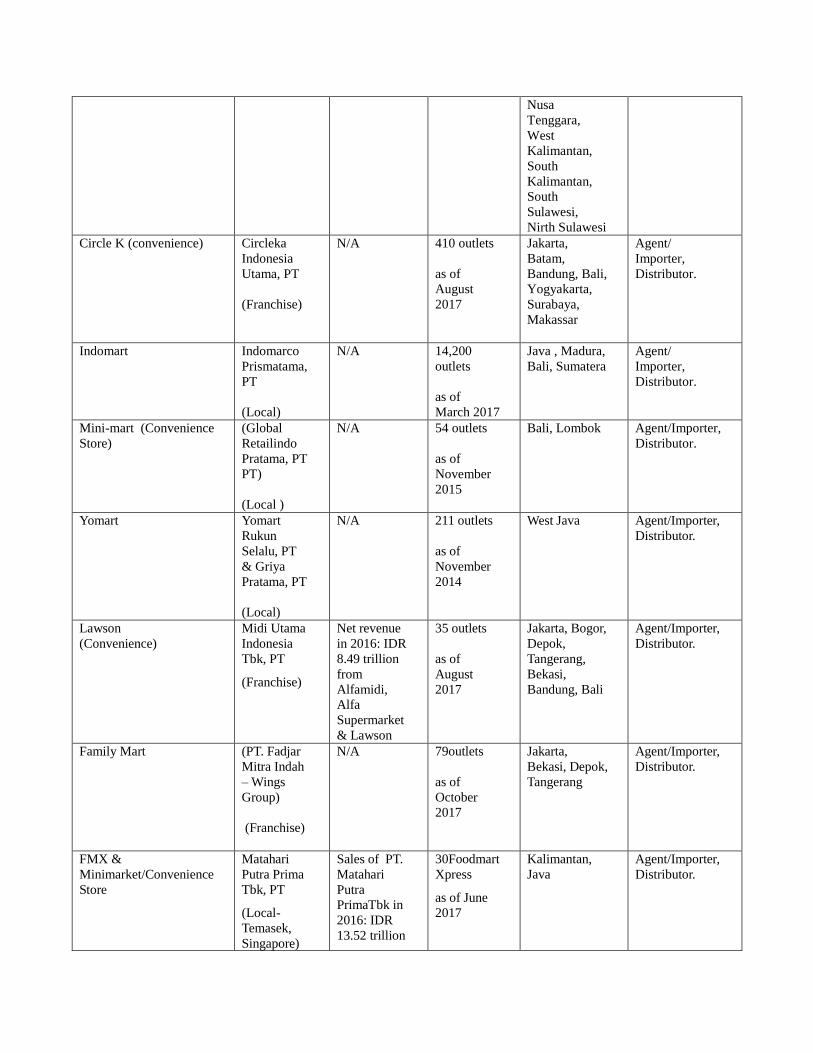
B. COVENIENCE STORES/MINIMARKETS, GAS MARTS, KIOSKS
Minimarkets experienced rapid growth throughout urban and suburban Indonesia. As competition in the
segment has grown, however, the segment has experienced a wave of consolidation. For example, Star
Mart (owned by Hero Group) sold off the majority of its shops to Family Mart (PT. Fadjar Mitra Indah).
Japanese-owned Ministop exited the Indonesian market in 2016. Seven Eleven also closed in June
2017.
Indonesian minimarkets carry essential staple goods, some frozen items, and fresh fruits. They are
located close to residential areas, office buildings, and areas with high footfalls. Most minimarket chains
have their own distribution facilities. Imported fruits are available in some of these stores.
Sales in minimarkets increased 7 percent in 2017; meanwhile, supermarket & hypermarket sales
increased only 0.4 percent. One factor in the growing sales in minimarkets, especially in Jakarta and its
surrounding areas, is traffic congestion, which forces customers to visit supermarket/ hypermarkets more
conveniently located close to their neighbourhoods.
Table 11. Convenience Store/Minimarket Outlets Retail Name &
Market Type
Ownership Sales/Year
No. of
Outlets
Locations
(city/region)
Purchasing
Agent Type
Alfamart Sumber
Alfaria
Trijaya,
Tbk, PT
(Local)
Net revenue
2016: IDR
56.10 trillion
12,710
outlets
as of March
2017
North
Sumatera,
Riau, Jambi,
South
Sumatera,
Lampung,
Banten,
Jakarta, West
Java,
Yogyakarta,
Central Java,
East Java,
Bali, West
Agent/Importer
/Distributor.
Nusa
Tenggara,
West
Kalimantan,
South
Kalimantan,
South
Sulawesi,
Nirth Sulawesi
Circle K (convenience) Circleka
Indonesia
Utama, PT
(Franchise)
N/A 410 outlets
as of
August
2017
Jakarta,
Batam,
Bandung, Bali,
Yogyakarta,
Surabaya,
Makassar
Agent/
Importer,
Distributor.
Indomart Indomarco
Prismatama,
PT
(Local)
N/A 14,200
outlets
as of
March 2017
Java , Madura,
Bali, Sumatera
Agent/
Importer,
Distributor.
Mini-mart (Convenience
Store)
(Global
Retailindo
Pratama, PT
PT)
(Local )
N/A 54 outlets
as of
November
2015
Bali, Lombok Agent/Importer,
Distributor.
Yomart Yomart
Rukun
Selalu, PT
& Griya
Pratama, PT
(Local)
N/A 211 outlets
as of
November
2014
West Java Agent/Importer,
Distributor.
Lawson
(Convenience)
Midi Utama
Indonesia
Tbk, PT
(Franchise)
Net revenue
in 2016: IDR
8.49 trillion
from
Alfamidi,
Alfa
Supermarket
& Lawson
35 outlets
as of
August
2017
Jakarta, Bogor,
Depok,
Tangerang,
Bekasi,
Bandung, Bali
Agent/Importer,
Distributor.
Family Mart (PT. Fadjar
Mitra Indah
– Wings
Group)
(Franchise)
N/A 79outlets
as of
October
2017
Jakarta,
Bekasi, Depok,
Tangerang
Agent/Importer,
Distributor.
FMX &
Minimarket/Convenience
Store
Matahari
Putra Prima
Tbk, PT
(Local-
Temasek,
Singapore)
Sales of PT.
Matahari
Putra
PrimaTbk in
2016: IDR
13.52 trillion
30Foodmart
Xpress
as of June
2017
Kalimantan,
Java
Agent/Importer,
Distributor.

Source: Various
C. TRADITIONAL MARKETS – SMALL INDEPENDENT GROCERY STORES AND WET
MARKETS
The traditional sector maintains a majority market share in Indonesian food retailing. This sector
includes warungs and small stalls, often found in traditional markets. Distribution channels are long and
complex. Few imported products are carried by these outlets, with the exception of fresh fruit.
Imported apples, table grapes, oranges, lemons and pears are commonly found in wet markets.
III. COMPETITION
Local companies have strong position in the food and beverage market
Local industry dominates the markets for baked goods, noodles and wheat-based products, snacks,
frozen poultry & meat products, processed dairy products such as UHT milk, cheese and yogurt, canned
fish, soft drinks, teas, coffee, tropical fruits and vegetables, and fresh sea food. Businesses featuring
fresh produce compete on their ability to supply competitively priced locally grown products, while
businesses featuring processed food and beverages compete on brand name. There are several
multinational companies in this sector, including Unilever, Nestle, Kraft/Mondelez, Danone, Heinz,
Frito Lay, and Mars.
Competition in the import market
Temperate fresh fruit, french fries, beef, tree nuts, and pet foods are mostly imported. Primary
competing suppliers include China, Thailand, Australia, New Zealand, Canada, Malaysia, Philippines,
Vietnam, India and France.
Table 12 Competition between Domestic Goods and Imports, 2016
Product
Category
Major Supply
Sources (%
Volume)
Strengths of Key Supply
Countries
Advantages and
Disadvantages of
Local Suppliers
Fresh Fruit
Net volume
import: 471.99
thousand ton
Value: $816.18
million
China 45.48 %
Thailand 12.64
%
The U.S. 11.84
%
Australia 7.12 %
Pakistan 3.67 %
South Africa
2.99 %
New Zealand
2.71%
China offers very
competitive prices
Only tropical fresh
fruits are produced
locally and supplies are
inconsistent

Egypt 2.52%
Fresh Vegetables
Net volume
import: 642.28
thousand ton
Value: $570.95
million
China 76.34%
India 7.22%
New Zealand
5.12%
Netherlands
3.60.6%
Germany 3.15%
The U.S minor
supplier (0.22%)
China supplies: garlic,
onions, shallots, carrots,
chilies. China offers very
competitive prices
India supplies: onions,
shallots, chili
New Zealand supplies:
onion
No garlic and onions
are produced locally.
Local shallot and chili
production cannot meet
domestic demand
during the rainy season
Only tropical fresh
vegetables are
produced locally.
Supplies are
inconsistent
Red meats fresh,
chilled, frozen
Net volume
import: 150.26
thousand ton
Value: : $574.75
million
Australia 54.49%
India 26.30%
New Zealand
10.37%
The U.S. 8.48 %
New Zealand and Australia
have a geographic
proximity and competitive
pricing and no reported
cases of FMD and BSE.
GOI just open market for
Indian meat buffalo at
second semester 2016. The
price is cheaper than beef.
Shortage of domestic
supply. Most domestic
production is sold
fresh to traditional
markets and modern
retail outlets
Meat processing
industry and food
service sector rely on
imports.
Processed fruit &
vegetables
Net volume
import: 152.06
thousand ton
Value: $203.63
million
China 31.06 %
The U.S. 19.44
%
Vietnam 8.68%
Netherlands
8.243 %
India 4.33%
Thailand 4.01%
Belgium 3.46%
Canada 3.44%
Brazil 3.40 %
China and Thailand supply
processed fruit and
vegetable products. Brands
are well known and prices
are competitive.
U.S. and Canada supply
French fries and frozen
vegetables
Limited processed fruit
and vegetable products
are produced locally.
Snack food
excluding nuts
Net Volume
import: 57.68
thousand ton
Value: $188.27
million
China 34.28 %
Malaysia 27.51%
Thailand 8.40%
Singapore 7.99%
Belgium 3.93%
Italy 3.79%
The U.S.-minor
supplier (0.47%
share)
China, Malaysia, Thailand,
and Singaporeorigin food
snacks have a large market
share due to price
competitiveness, taste, and
geographic proximity.
Belgium supplies mostly
chocolate based snack
products
Local products are also
abundant but
consumers are willing
to try new products.
Domestic snack
producers use imported
food ingredients such
as potato flakes, dairy,
and corn grits.

Pet foods
Net Volume
import: 64.76
thousand ton
Value: $1.12
million
Thailand 55.60%
France 30.43%
The US 5.37%
Australia 2.43%
Brazil 1.76%
Thailand produces pet food
under the U.S. pet food
company licenses.
Local pet food is led by
bird and aquaculture
feed products. Lately
domestic pet food
products for dog and
cat are also available.
Fruit & vegetable
juices
Net Volume:
16.66 thousand
ton
Value: $28.52
million
Brazil 43.88 %
China 10.69%
Switzerland
9;69%
The U.S. 8.48%
Austria 5.89%
Thailand 4.12%
Australia 3.63%
United Arab
Emirates 3.42%
Indonesia looks for variant
of products with
competitive prices.
Geographic proximity
gives Australia, China and
Thailand advantage for
products with short product
shelf life.
Brazil supplies orange juice
concentrate to Indonesia.
Domestic fruit juice
production is growing.
Local products have
limited type of fruit
juices due to limited
fresh fruits supply
Breakfast
Cereals/Pancake
Mix
Net volume
import: 9.15
thousand ton
Value:$25.06
million
Malaysia 55.18
%
China 15.10%
Philippines
13.76%
Thailand 4.69 %
Australia 3.22%
The U.S. minor
supplier (1.10%)
Multinational companies
established their production
facilities in ASEAN
countries (such as The
Philippines, Malaysia and
Thailand) to reach the
market in surrounding
countries.
Domestic manufactured
produces limited
variety of breakfast
Cereals.
Tree nuts
Net volume
import: 4.03
thousand ton
Value: $23.24
million
Vietnam 31.39%
The U.S. 31.65
%
Thailand 14.61
%
Australia 7.37%
China 4.86%
Philippines
3.32%
Thailand supplies repacked
tree nuts from the U.S.
Vietnam supplies cashew
nut
Local tree nut
production is limited to
the cashew nut.
Wine & Beer
Net volume
n/a
Major supplier
Singapore is a transit
country for most of the
imported products to
Population mostly
Muslim.

import: n/a
Value: $7.87
million
are Singapore,
Australia, Italy,
Mexico, France,
Chili. Belgium
and The U.S.
Indonesia
Australia offers
competitive pricing and
geographic proximity.
Insignificant supply of
domestic wine
production and limited
local beer
manufacturers for the
rest of population and
tourists’ consumption.
Source: Global Trade Atlas (GTA)
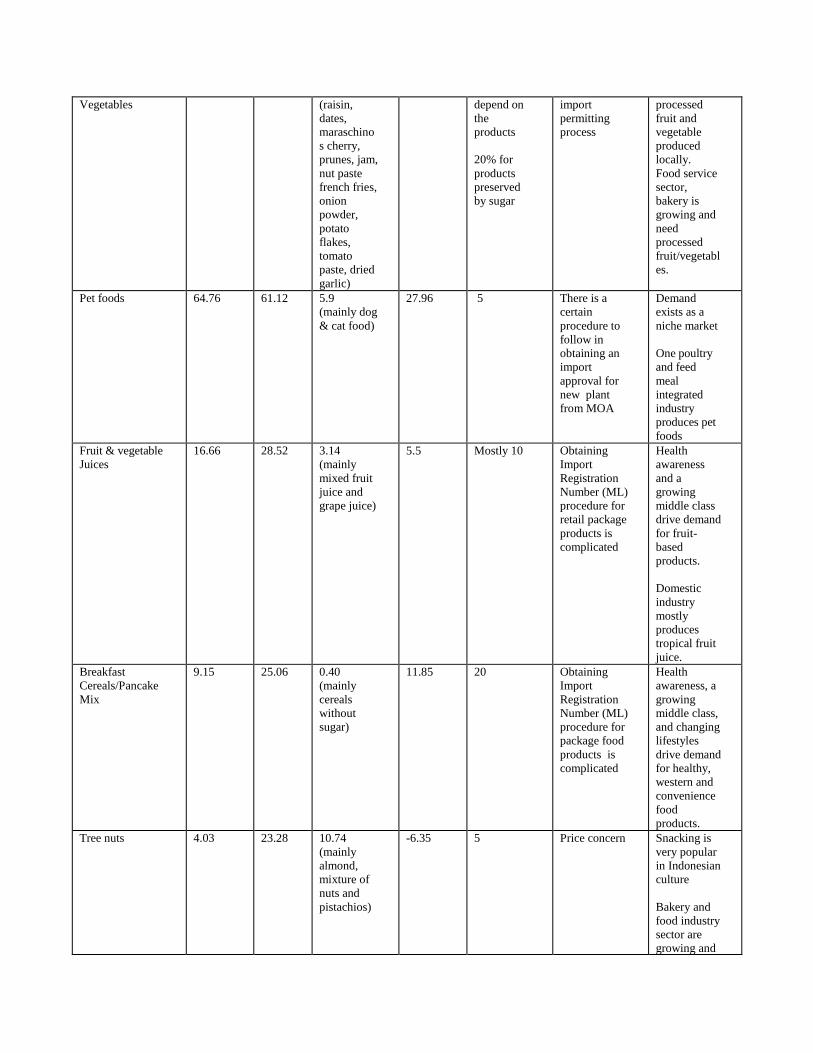
IV. BEST PRODUCT PROSPECTS
Many U.S. food items have strong sales potential in Indonesia. This is especially true of those for which
no local substitutes are available. The best opportunities for imported food products in retail packaging
are in retail outlets in Jakarta and surrounding areas, Bandung, Surabaya, Bali, and Medan. Potential
also exists where foreign companies employee high numbers of expatriates, such as Balikpapan
(Kalimantan), Pakanbaru (Sumatera), and Timika (West Papua). The expatriate community is diverse,
with more expatriates to coming to Indonesia from Asian countries.
There is typically at least one supermarket that caters to the expatriate community in every major city,
supplying imported products. Good opportunities exist for good quality, moderately priced items with
brand names well-known to expatriates. Because importers purchase in small quantities and
transportation costs can be high, products are expensive.
A. Products Present in the Market which have Good Sales Potential
Fresh fruits demonstrate the best sales of U.S. product category already present in the Indonesian
market. U.S processed vegetables products, processed fruit, dairy products, juice, snack food, tree nuts,
and pet food have also shown growth. Some of the best-selling foods include apples, table grapes,
lemons, oranges, frozen french fries, dates, raisins, jams, nut paste, cheese, ice cream, mix fruit juice,
popcorn, potato chips, almond, and dog & cat food.
Table 13. Products Present in the Market That Have Good Sales Potential Product
Category
2016
Import
(Volum
e,
thousa
nd MT)
2016
Impo
rt
($mil)
2016
Import
from U.S.
($mil)
5Yr.
Avg
Annual
Import
(Volum
e)
Growth
%)
Import
Tariff
Rates (%)
Key
Constraints
to Market
Development
Market
Attractivene
ss for USA
Fresh fruit 471 816 127.05
(mainly
apples,
grapes,
lemon &
orange)
-7.84 5% for all
fruit except
Mandarins
and mangos
(20%)
Competition
with China.
Current
Government
of Indonesia
regulations
inhibit fresh
fruit imports,
including
Health
awareness
and rising
middle class
pushes the
demand for
quality fresh
products.
Lack of

U.S. fresh
fruit
supply and
low quality
of domestic
fruit
products.
Fresh Vegetable 642.28 570.9
5
0.75
(mainly
potato)
-3.88 5
20% for
fresh/chille
d potatoes
shallot and
carrot
Price concern
Government
of Indonesia
regulations
inhibit some
U.S. fresh
vegetables
imports
Lack of
supply, low
quality
domestic
products and
demand of
other
vegetable
types.
Red Meats,
Fresh/Chilled/Fro
zen
150.26 574.7
5
41.58
(mainly
frozen beef
carcasses,
and offal to
include
heart, liver
and tongue)
38.55 5
30% for
processed
meat
Competition
with Australia
and New
Zealand and
lately with
Indian buffalo
meat.
Importer has
to obtain an
import
recommendati
on from
Ministry of
Agriculture
(MOA) then
an import
permit from
Ministry of
Trade before
importing the
products
Meat
establishment
must be
approved by
MOA before
they can ship
to Indonesia
Lack of
domestic
supply
Snack food
excluding nuts
57.68 188.2
7
1.16
(mainly
popcorn,
corn chips,
corn chip,
potato chip,
confectione
ry)
19.13 5
15-20% for
sugar
confectione
ry,
chocolate &
food
containing
chocolate,
bread,
pastry,
cakes, and
biscuit
The
procedure for
obtaining an
Import
Registration
Number (ML)
for package
food products
is
complicated
Expansion of
modern retail
outlets
creates
opportunity
to introduce
and sell
snack food
products
Snacking is
very popular
in Indonesian
culture and
Indonesian
eager to try
new products
Processed fruit & 152 203 51.24 6.3 5 and 10% Complicated Lack of
Vegetables (raisin,
dates,
maraschino
s cherry,
prunes, jam,
nut paste
french fries,
onion
powder,
potato
flakes,
tomato
paste, dried
garlic)
depend on
the
products
20% for
products
preserved
by sugar
import
permitting
process
processed
fruit and
vegetable
produced
locally.
Food service
sector,
bakery is
growing and
need
processed
fruit/vegetabl
es.
Pet foods 64.76 61.12 5.9
(mainly dog
& cat food)
27.96 5 There is a
certain
procedure to
follow in
obtaining an
import
approval for
new plant
from MOA
Demand
exists as a
niche market
One poultry
and feed
meal
integrated
industry
produces pet
foods
Fruit & vegetable
Juices
16.66 28.52 3.14
(mainly
mixed fruit
juice and
grape juice)
5.5 Mostly 10 Obtaining
Import
Registration
Number (ML)
procedure for
retail package
products is
complicated
Health
awareness
and a
growing
middle class
drive demand
for fruit-
based
products.
Domestic
industry
mostly
produces
tropical fruit
juice.
Breakfast
Cereals/Pancake
Mix
9.15 25.06 0.40
(mainly
cereals
without
sugar)
11.85 20 Obtaining
Import
Registration
Number (ML)
procedure for
package food
products is
complicated
Health
awareness, a
growing
middle class,
and changing
lifestyles
drive demand
for healthy,
western and
convenience
food
products.
Tree nuts
4.03
23.28 10.74
(mainly
almond,
mixture of
nuts and
pistachios)
-6.35 5 Price concern Snacking is
very popular
in Indonesian
culture
Bakery and
food industry
sector are
growing and
use tree nuts
as one of the
ingredient. Note: Source Global Trade Atlas (GTA) and no data on the size of the market
B. Products Not Present in Significant Quantities but That Have Good Sales Potential
There are good opportunities for high-value U.S. items that are not yet imported in significant quantities.
These include baby foods and and specialty fruits (especially berries). Challenges to entering the market
include complicated import and distribution procedures.
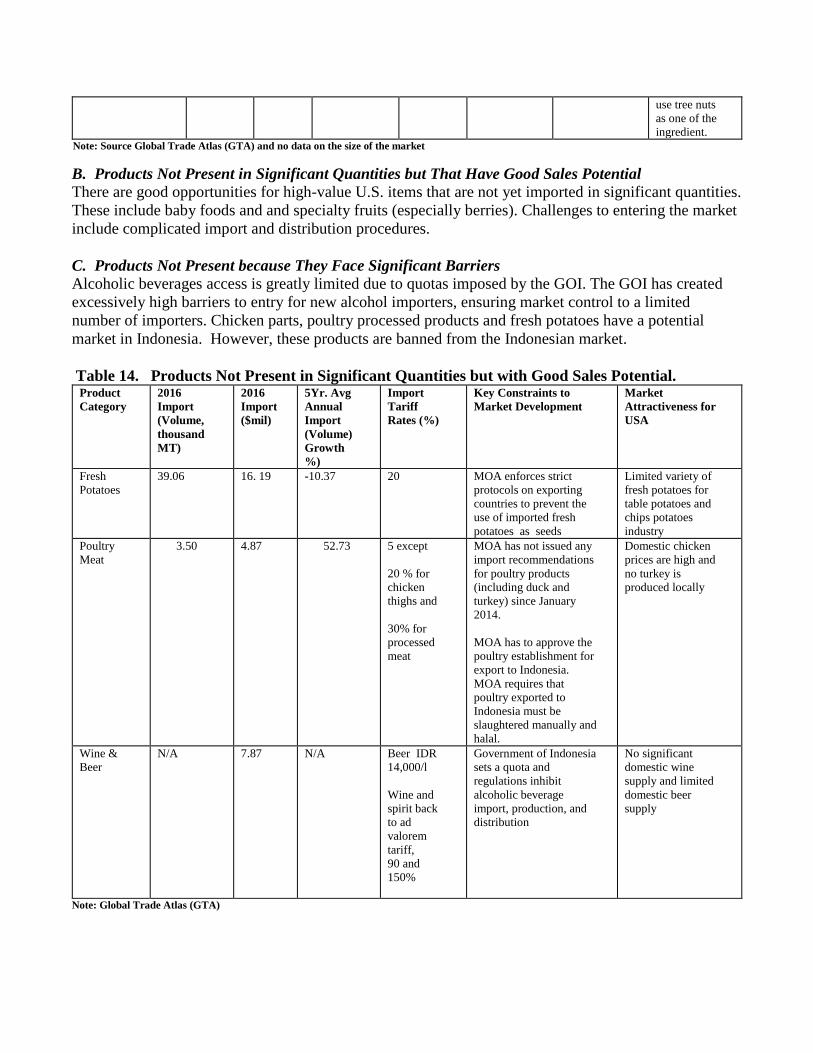
C. Products Not Present because They Face Significant Barriers
Alcoholic beverages access is greatly limited due to quotas imposed by the GOI. The GOI has created
excessively high barriers to entry for new alcohol importers, ensuring market control to a limited
number of importers. Chicken parts, poultry processed products and fresh potatoes have a potential
market in Indonesia. However, these products are banned from the Indonesian market.
Table 14. Products Not Present in Significant Quantities but with Good Sales Potential. Product
Category
2016
Import
(Volume,
thousand
MT)
2016
Import
($mil)
5Yr. Avg
Annual
Import
(Volume)
Growth
%)
Import
Tariff
Rates (%)
Key Constraints to
Market Development
Market
Attractiveness for
USA
Fresh
Potatoes
39.06 16. 19 -10.37 20 MOA enforces strict
protocols on exporting
countries to prevent the
use of imported fresh
potatoes as seeds
Limited variety of
fresh potatoes for
table potatoes and
chips potatoes
industry
Poultry
Meat
3.50
4.87 52.73
5 except
20 % for
chicken
thighs and
30% for
processed
meat
MOA has not issued any
import recommendations
for poultry products
(including duck and
turkey) since January
2014.
MOA has to approve the
poultry establishment for
export to Indonesia.
MOA requires that
poultry exported to
Indonesia must be
slaughtered manually and
halal.
Domestic chicken
prices are high and
no turkey is
produced locally
Wine &
Beer
N/A 7.87 N/A Beer IDR
14,000/l
Wine and
spirit back
to ad
valorem
tariff,
90 and
150%
Government of Indonesia
sets a quota and
regulations inhibit
alcoholic beverage
import, production, and
distribution
No significant
domestic wine
supply and limited
domestic beer
supply
Note: Global Trade Atlas (GTA)

V. POST CONTACT AND FURTHER INFORMATION
The Foreign Agricultural Service (FAS), U.S. Embassy Jakarta maintains up-to-date information
covering food and agricultural import opportunities in Indonesia and would be pleased to assist in
facilitating U.S. exports and entry to the Indonesian market. Questions or comments regarding this
report should be directed to FAS Jakarta at the following local or U.S. mailing address:
International Post: Foreign Agricultural Service
U.S. Embassy Jakarta
Sarana Jaya Building, 8th
Floor
Jl. Budi Kemuliaan I No. 1
Jakarta 10110
Tel: +62 21 3435-9161
Fax: +62 21 3435-9920
E-mail:[email protected]
U.S. mail: Foreign Agricultural Service
FAS
Unit 8200 Box 439
FPO, AP 96520-0439
For more information on exporting U.S. agricultural products to Indonesia and other countries, please
visit the Foreign Agricultural Service’s Home Page: http://usdaindonesia.org and
http://www.fas.usda.gov
VI. OTHER RELEVANT REPORTS
1. Indonesia Issues Local Content Requirement for Dairy Importers (ID1722)
2. Indonesia’s Fees on Import Application (ID1721)
3. FAIRS Export Certificate Report 2016 (ID1644)
4. FAIRS Country Report 2016 (ID1643)
5. Exporter Guide Update 2016 (ID1642)
6. Food Service - Hotel Restaurant Institutional Update 2016 (ID1640)
7. Food Processing Ingredients Update 2016 (ID1639)
8. Indonesia Revises FFPO Import Procedures (ID1637)
9. Ministry of Trade Updates Beef Import Regulation (ID1626)
10. Indonesia Expands U.S. Plants Products Eligible for Recognition (ID1624)
11. Indonesia Eases Import Rules for Meat Products (ID1623)
12. Indonesia Amends Import Regulations for Livestock Products (ID1618)
13. Indonesia Raises Import Tariffs on Value-Added Goods (ID1530)
14. California Recognized as Fruit Fly Free Area (ID1522)
15. Indonesia Revises Seafood Import Rules (ID1501)
16. New Regulation on Alcoholic Beverage Distribution (ID1411)
17. Alcohol Beverages Excise Tax Update (ID1408)
18. Unofficial Translation of Ministry of Agriculture Decree No 4390/2013 (ID1335)
19. Indonesia Extends Import Requirements on Food and Beverage Products (ID1304)
20. Phytosanitary Requirement for Fresh Bulb (ID1303)

21. Minister of Agriculture Regulations No 42 and 43 Year 2012 (ID1218)
22. Prior Notice-Application of Imported Fresh Food of Plant Origin (FFPO) (ID1206)
23. Market Brief-Wine (ID1113)
24. Mandatory Labeling of Imported Food and Beverage Products (ID1028)
25. Indonesian Market Brief on Functional Beverage Ingredients (ID1041)
26. Processed Meat-Chicken and Fish Products Ingredient (ID1039)
27. Snack Food Ingredient (ID1037)
28. Bakery Products Ingredient (ID1036)
Table 13. Indonesia: Exchange Rate (Rp./1U.S. $) on Period Month Ending Basis Year Jan Feb Mar Apr May Jun Jul Aug Sep Oct Nov Dec Avg
20
06
9,36
9
9,28
0
9,11
7
8,82
6
9,21
2
9,35
3
9,12
4
9,11
9
9,20
5
9,11
0
9,16
5
9,02
0
9,15
8
2007
9,090
9,160
9,118
9,083
8,828
9,054
9,186
9,410
9,137
9,379
9,376
9,419
9,187
20
08
9,30
4
9,05
1
9,19
9
9,23
4
9,31
8
9,22
5
9,11
8
9,15
3
9,37
8
10,9
95
12,1
51
10,9
50
9,75
6
2009
11,330
11,975
11,575
10,713
10,340
10,225
9,920
10,060
9,681
9,545
9,480
9,400
10,354
20
10
9,36
5
9,33
5
9,07
0
9,01
2
9,18
0
9,03
8
8,95
2
9,04
1
8,95
2
8,92
8
9,01
3
9,01
4
9,07
5
20
11
9,05
7
8,82
3
8,70
9
8,57
4
8,53
7
8,59
7
8,50
8
8,57
8
8,82
3
8,83
5
9,05
5
9,17
0
8,77
2
20
12
9,00
0
9,15
8
9,18
8
9,18
0
9,56
5
9,46
8
9,48
5
9,57
3
9,58
8
9,60
5
9,60
5
9,67
0
9,42
4
20
13
9,68
0
9,71
3
9,74
5
9,72
2
9,81
1
9,92
9
10,2
77
10,9
36
11,5
32
11,2
34
11,9
77
12,1
89
10,5
62
20
14
12,2
26
11,6
75
11,4
04
11,5
89
11,6
11
11,9
69
11,5
91
11,7
17
12,2
12
12,1
63
12,1
96
12,4
36
11,8
99
20
15
12,6
25
12,8
63
13,0
84
12,9
22
12,9
37
13,3
32
13,4
81
14,0
27
14,6
57
13,5
63
13,7
47
13,7
94
13,4
19
20
16
13,8
46
13,3
95
13,2
76
13,2
04
13,6
15
13,1
80
13,0
94
13,3
00
12,9
98
13,0
51
13,5
63
13,4
36
13,3
30
20
17
13,3
43
13,3
47
13,3
21
13,3
27
13,3
21
13,3
19
13,3
23
13,3
51
13,4
92
13,5
72
13,5
14
13,5
58
13,3
99
Source: Business Indonesia Daily Newspaper &Bank Indonesia