this foa virtual hands-on tutorial on fiber optics is ...otdr itself. the reflection causes an...
TRANSCRIPT
1
This FOA virtual hands-on tutorial on fiber optics is prepared for use by FOA CFOTs and Students. It is copyrighted by the FOA and may not be distributed without FOA permission.
2
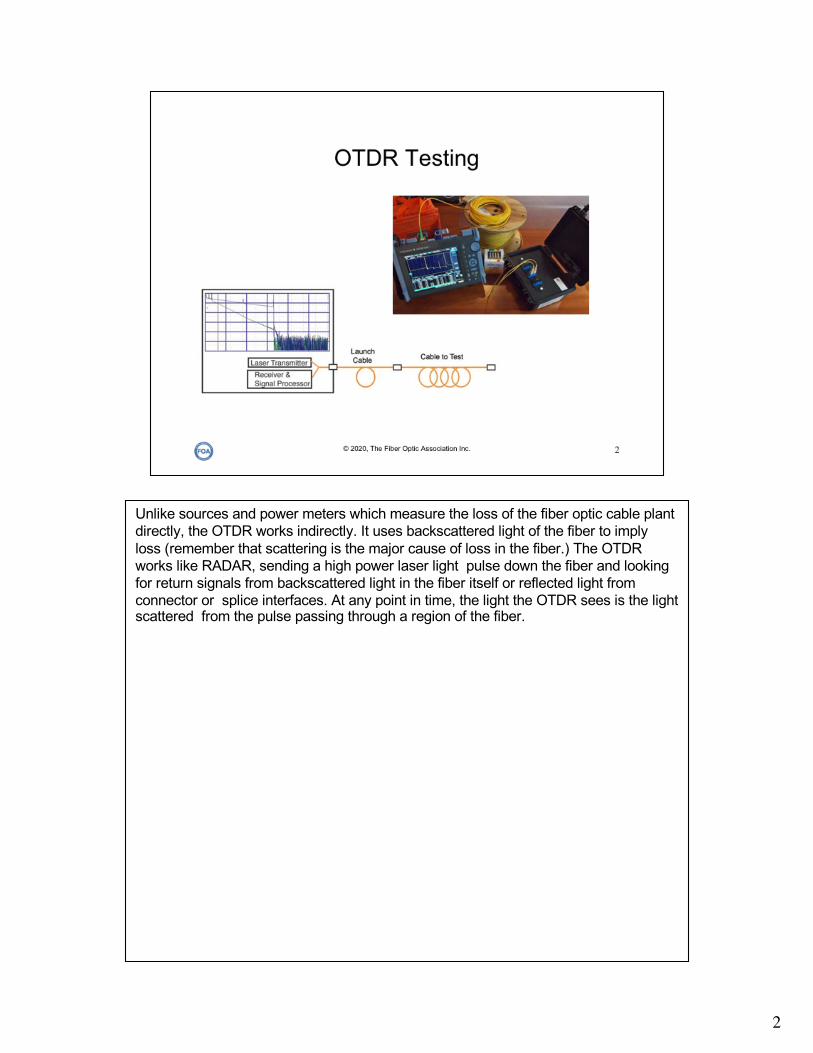
Unlike sources and power meters which measure the loss of the fiber optic cable plant directly, the OTDR works indirectly. It uses backscattered light of the fiber to imply loss (remember that scattering is the major cause of loss in the fiber.) The OTDR works like RADAR, sending a high power laser light pulse down the fiber and looking for return signals from backscattered light in the fiber itself or reflected light from connector or splice interfaces. At any point in time, the light the OTDR sees is the light scattered from the pulse passing through a region of the fiber.
3
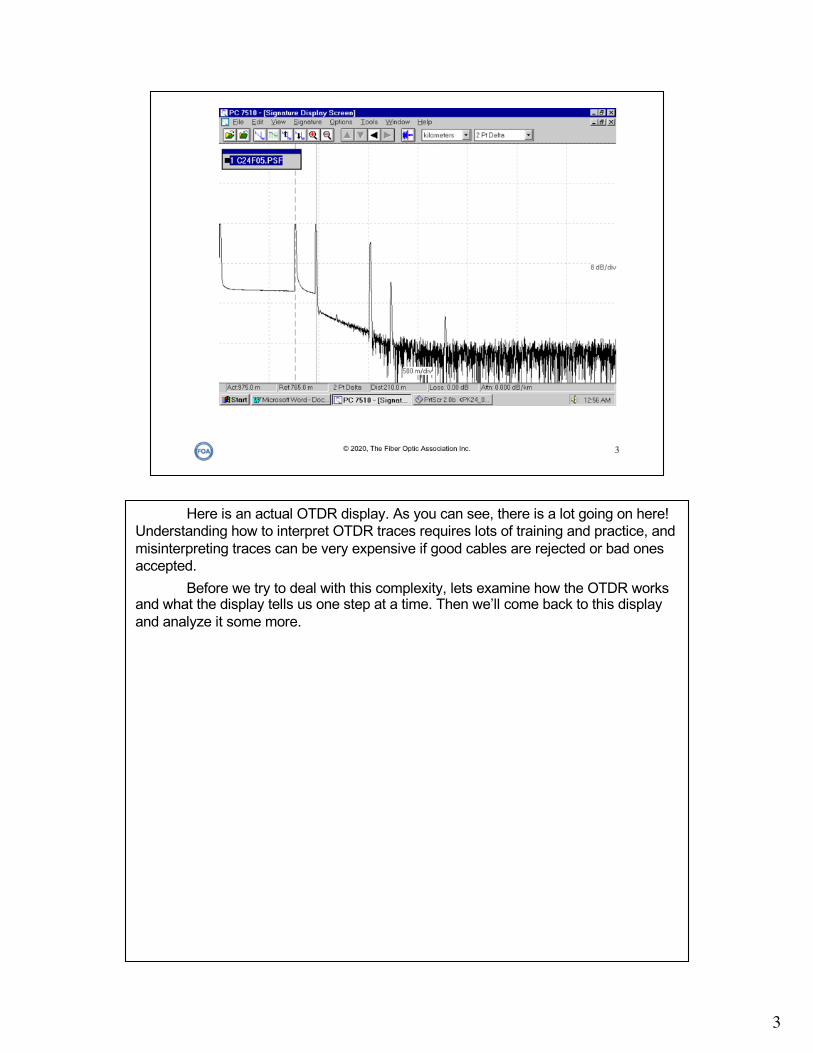
Here is an actual OTDR display. As you can see, there is a lot going on here! Understanding how to interpret OTDR traces requires lots of training and practice, and misinterpreting traces can be very expensive if good cables are rejected or bad ones accepted.
Before we try to deal with this complexity, lets examine how the OTDR works and what the display tells us one step at a time. Then we’ll come back to this display and analyze it some more.

4
There is a lot of information in an OTDR display. The position of a event along the horizontal axis shows the distance to the event in the fiber.The slope of the fiber trace shows the attenuation coefficient of the fiber and is calibrated in dB/km by the OTDR. In order to measure fiber attenuation, you need a fairly long length of fiber with no distortions on either end from the OTDR resolution or overloading due to large reflections. If the fiber looks nonlinear at either end, especially near a reflective event like a connector, avoid that section when measuring loss. Connectors and splices are called "events" in OTDR jargon. Both should show a loss, but connectors and mechanical splices will also show a reflective peak so you can distinguish them from fusion splices. Also, the height of a reflective peak will indicate the amount of reflection at the event, unless it is so large that it saturates the OTDR receiver. Then peak will have a flat top and tail on the far end, indicating the receiver was overloaded. The width of the peak shows the distance resolution of the OTDR, or how close it can detect events.

5
OTDRs should always be used with a launch cable often called a “pulse suppresser” cable, which doesn’t suppress pulses, but simply gives the OTDR time to recuperate before you start looking at the fiber in the cable plant you want to test. Do not ever use an OTDR without this launch cable!
You always want to see the beginning of the cable plant and you cannot do it without a launch cable. It allows the OTDR to recover properly after the test pulse and, because it mates with the first connector in the cable, gives you a chance to see the condition of the initial connector on the cable plant. It should be long, at least 500 to 1000 meters to be safe, and the connectors on it should be the best possible to reduce reflections. They must also match the connectors being tested, if they use any special polish techniques.
The far end of the cable under test also may have a connector, which the OTDR cannot measure unless it is connected to another cable - a receive cable - that is long enough to show the final connector in the trace. So keeping two reference cables with the OTDR kit is a necessity.
One trick can work on medium length cables, just loop back and forth through all the fibers in a multifiber cable. Then any problems will be traceable by knowing which fiber is which in the cable.
6
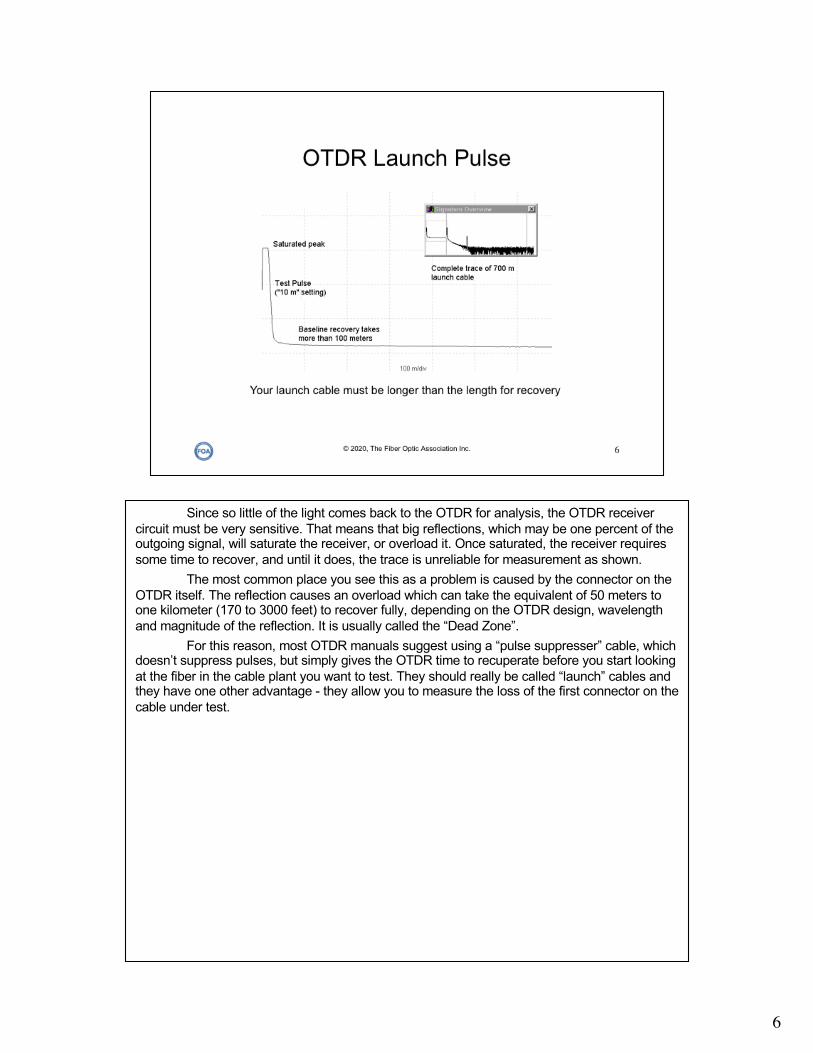
Since so little of the light comes back to the OTDR for analysis, the OTDR receiver circuit must be very sensitive. That means that big reflections, which may be one percent of the outgoing signal, will saturate the receiver, or overload it. Once saturated, the receiver requires some time to recover, and until it does, the trace is unreliable for measurement as shown.
The most common place you see this as a problem is caused by the connector on the OTDR itself. The reflection causes an overload which can take the equivalent of 50 meters to one kilometer (170 to 3000 feet) to recover fully, depending on the OTDR design, wavelength and magnitude of the reflection. It is usually called the “Dead Zone”.
For this reason, most OTDR manuals suggest using a “pulse suppresser” cable, which doesn’t suppress pulses, but simply gives the OTDR time to recuperate before you start looking at the fiber in the cable plant you want to test. They should really be called “launch” cables and they have one other advantage - they allow you to measure the loss of the first connector on the cable under test.
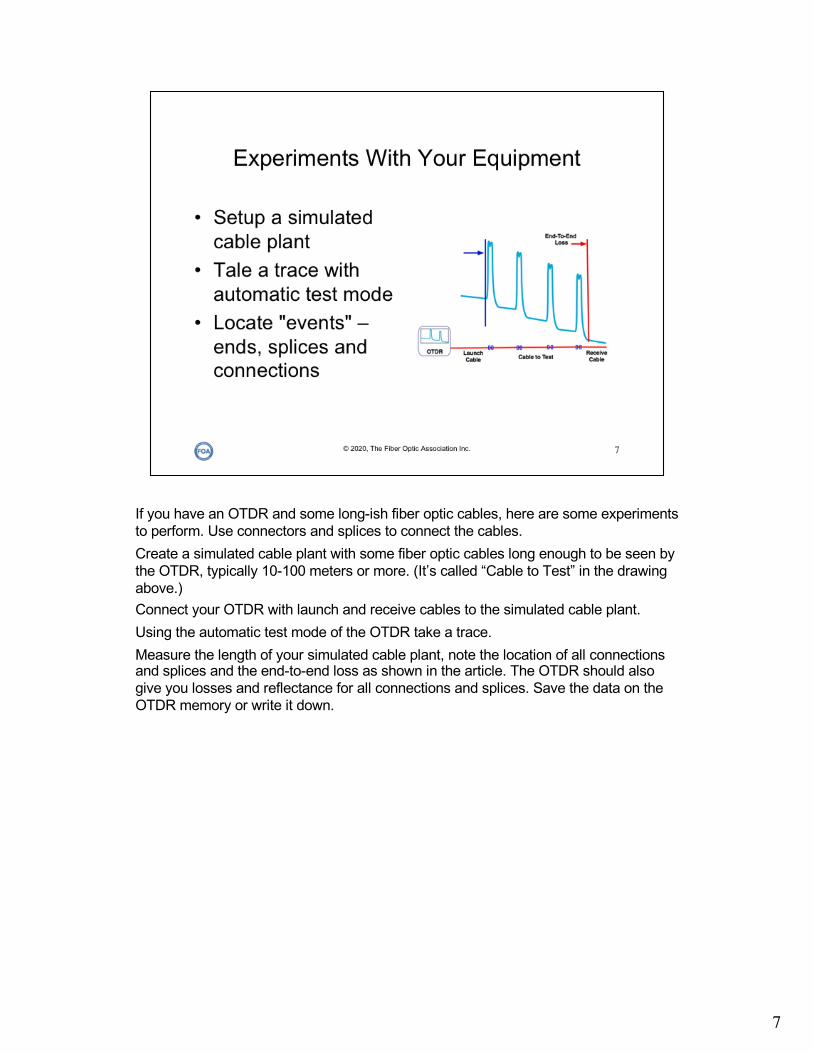
If you have an OTDR and some long-ish fiber optic cables, here are some experiments to perform. Use connectors and splices to connect the cables. Create a simulated cable plant with some fiber optic cables long enough to be seen by the OTDR, typically 10-100 meters or more. (It’s called “Cable to Test” in the drawing above.)Connect your OTDR with launch and receive cables to the simulated cable plant. Using the automatic test mode of the OTDR take a trace. Measure the length of your simulated cable plant, note the location of all connections and splices and the end-to-end loss as shown in the article. The OTDR should also give you losses and reflectance for all connections and splices. Save the data on the OTDR memory or write it down.
7

8
OTDRs offer several selectable parameters for making measurements.1. Of course, one can select the wavelength of the test source, since the fiber loss is different at each wavelength. 2. The range should be set at least 2 times the length of the fiber to prevent trace distortion and ghosting. 3. The pulse width should be minimum that allows reaching the end of the fiber so the resolution of close events is as good as possible. 4. The averaging should be the minimum number of averages that gives a low-noise trace
9
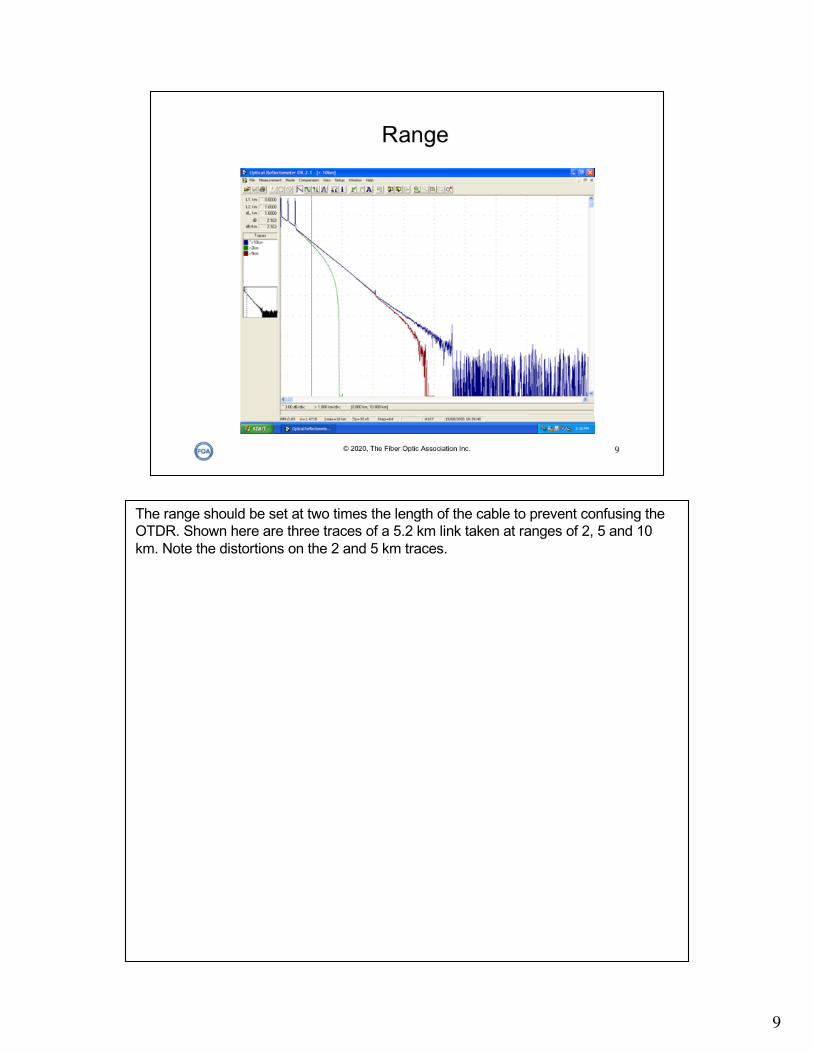
The range should be set at two times the length of the cable to prevent confusing the OTDR. Shown here are three traces of a 5.2 km link taken at ranges of 2, 5 and 10 km. Note the distortions on the 2 and 5 km traces.
10
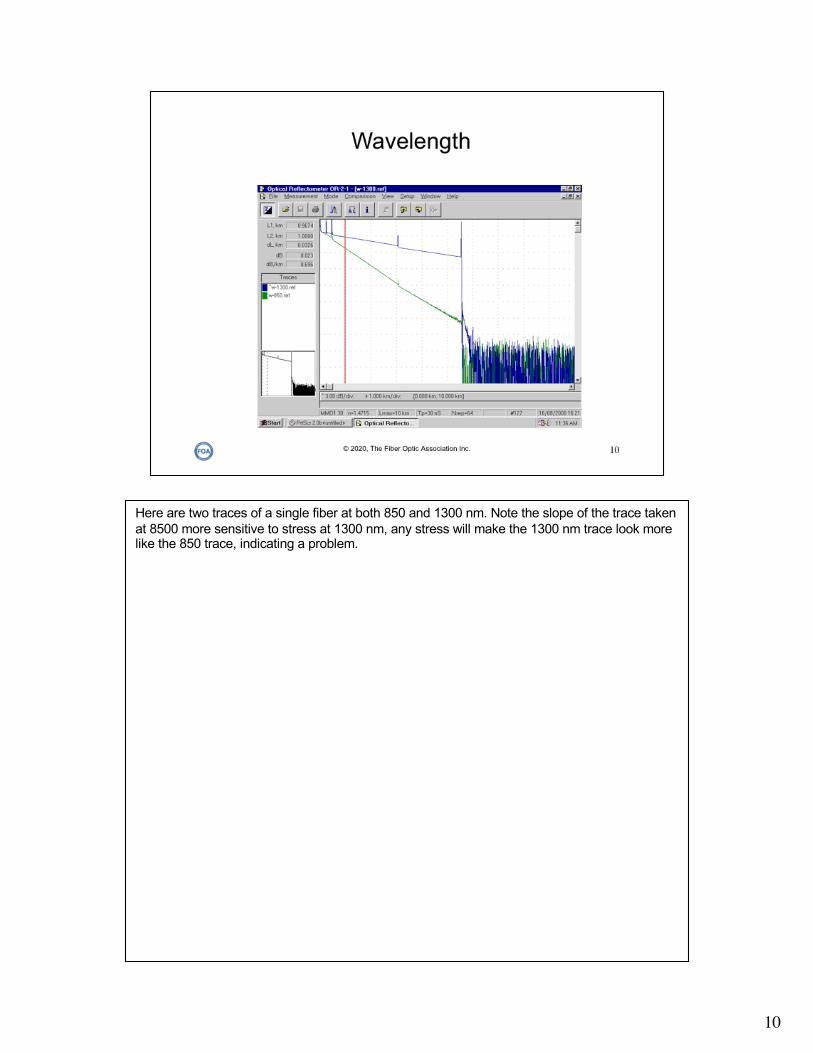
Here are two traces of a single fiber at both 850 and 1300 nm. Note the slope of the trace taken at 8500 more sensitive to stress at 1300 nm, any stress will make the 1300 nm trace look more like the 850 trace, indicating a problem.
11
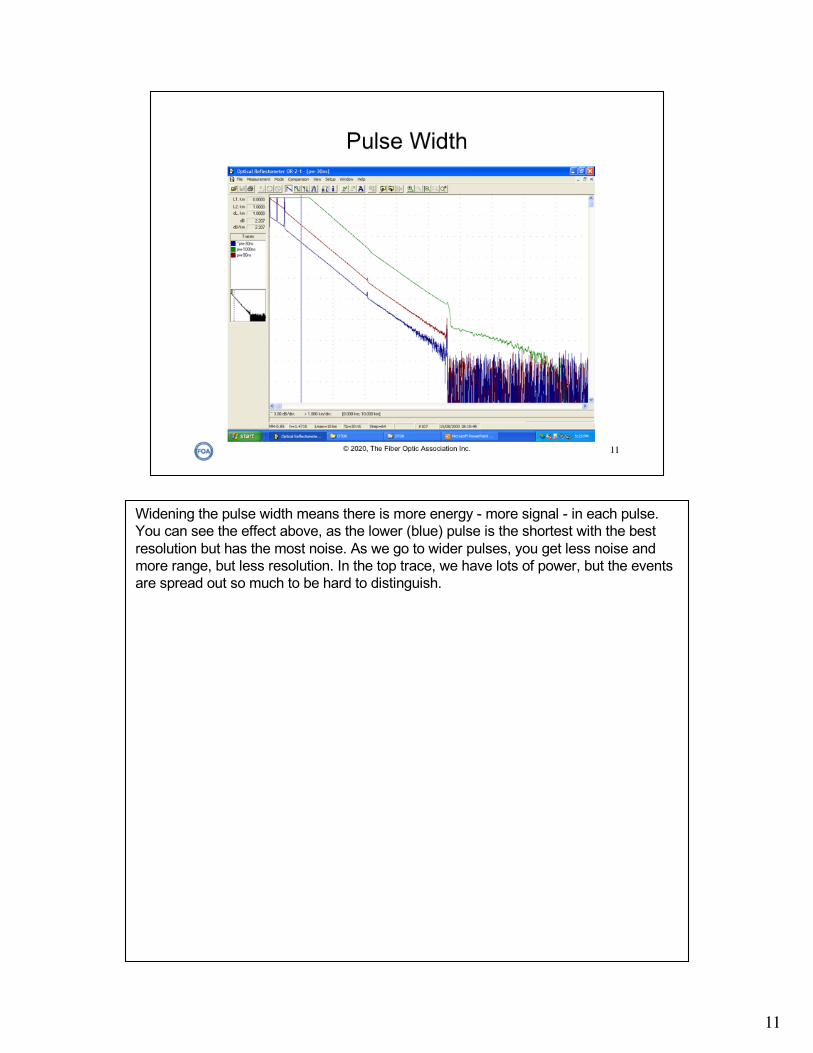
Widening the pulse width means there is more energy - more signal - in each pulse. You can see the effect above, as the lower (blue) pulse is the shortest with the best resolution but has the most noise. As we go to wider pulses, you get less noise and more range, but less resolution. In the top trace, we have lots of power, but the events are spread out so much to be hard to distinguish.
12
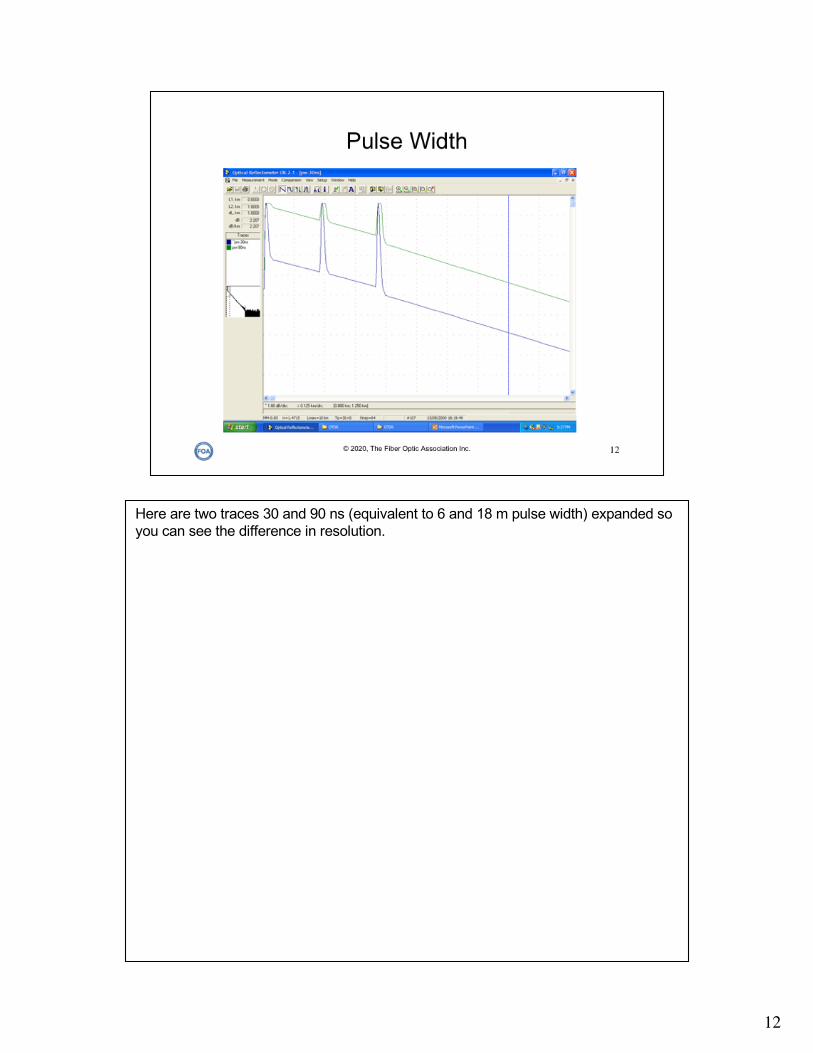
Here are two traces 30 and 90 ns (equivalent to 6 and 18 m pulse width) expanded so you can see the difference in resolution.
13
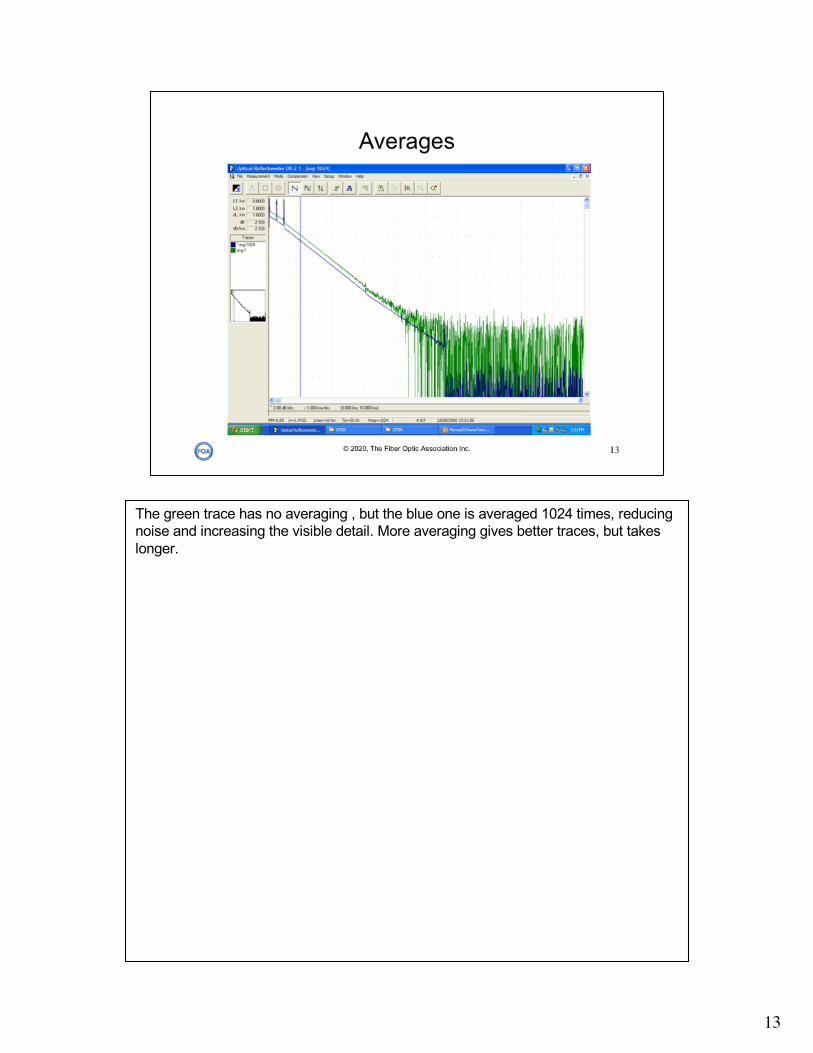
The green trace has no averaging , but the blue one is averaged 1024 times, reducing noise and increasing the visible detail. More averaging gives better traces, but takes longer.
14
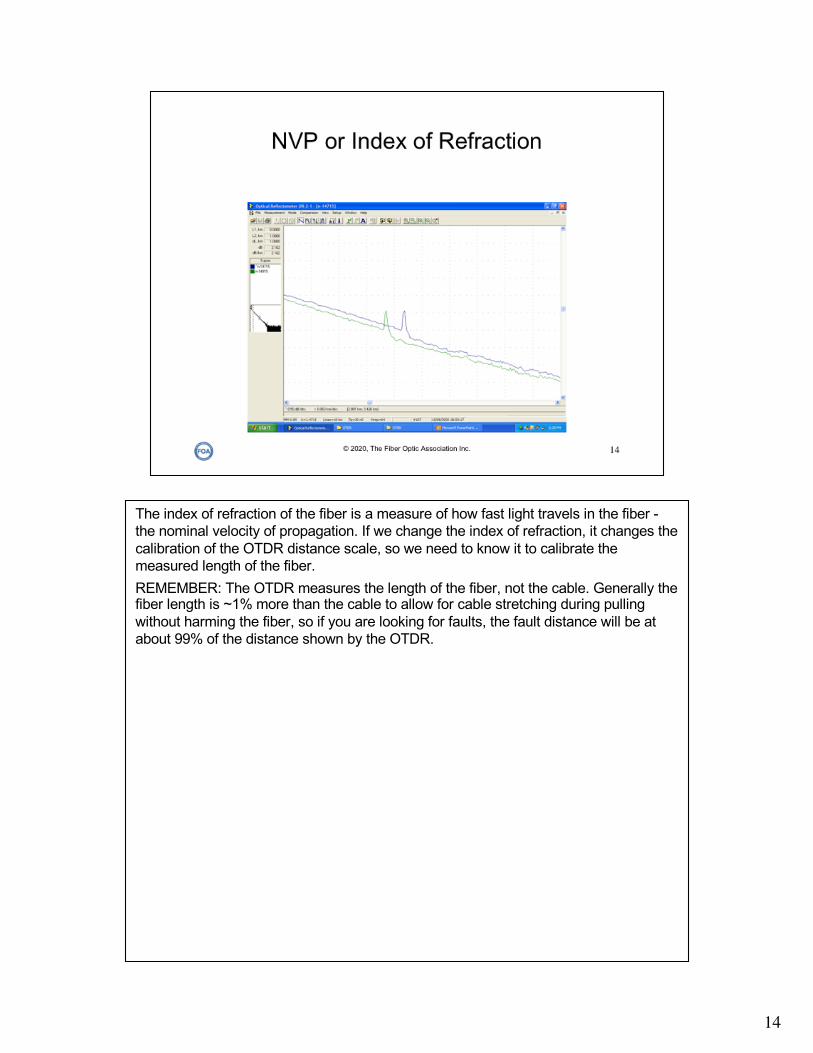
The index of refraction of the fiber is a measure of how fast light travels in the fiber -the nominal velocity of propagation. If we change the index of refraction, it changes the calibration of the OTDR distance scale, so we need to know it to calibrate the measured length of the fiber.REMEMBER: The OTDR measures the length of the fiber, not the cable. Generally the fiber length is ~1% more than the cable to allow for cable stretching during pulling without harming the fiber, so if you are looking for faults, the fault distance will be at about 99% of the distance shown by the OTDR.
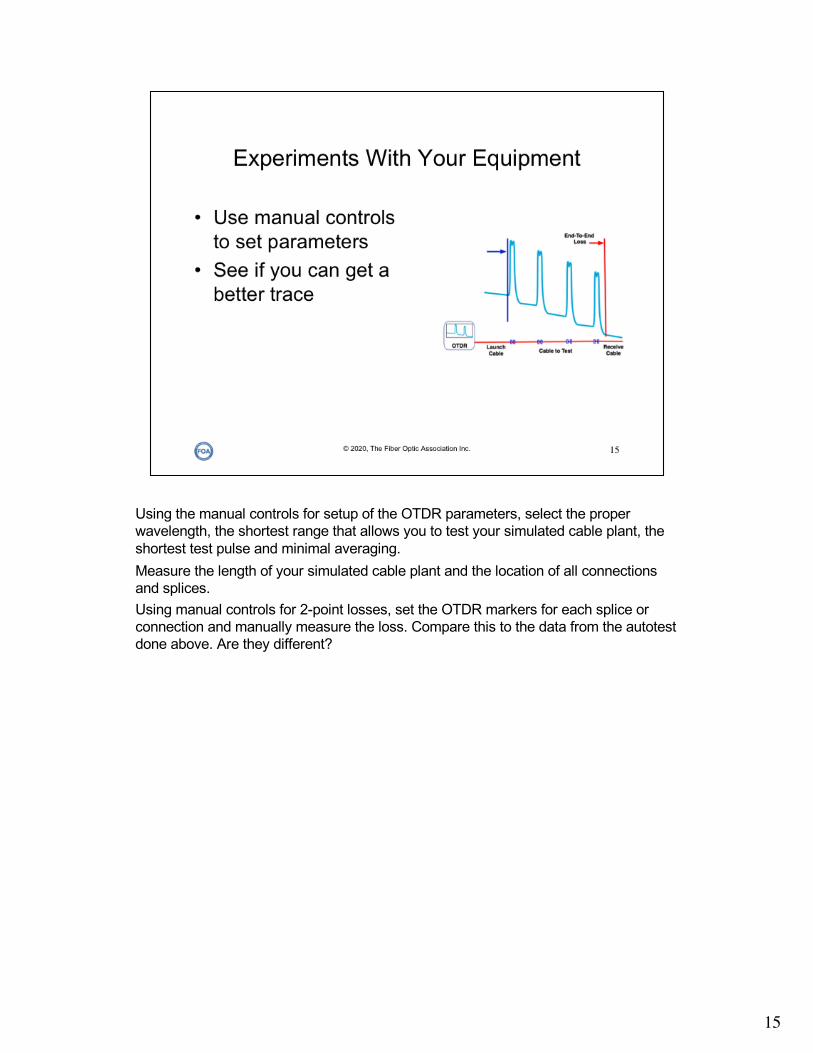
Using the manual controls for setup of the OTDR parameters, select the proper wavelength, the shortest range that allows you to test your simulated cable plant, the shortest test pulse and minimal averaging.Measure the length of your simulated cable plant and the location of all connections and splices.Using manual controls for 2-point losses, set the OTDR markers for each splice or connection and manually measure the loss. Compare this to the data from the autotestdone above. Are they different?
15

16
The OTDR display is usually called a “trace.” It includes the backscatter trace from the fiber under test, several “markers” which can be moved along the trace to pinpoint the places on the trace from which measurements are made, and usually a number of digital displays of distance and loss. The easiest way to understand what you see is to consider the figure below, a simple trace from which we will measure the length and attenuation coefficient of the fiber.
To measure the length and attenuation of the fiber, we place the markers on either end of the section of fiber we wish to measure. The OTDR will calculate the distance difference between the two markers and give the distance. It will also read the difference between the power levels of the two points where the markers cross the trace and calculate the loss, or difference in the two power levels in dB. Finally, it will calculate the attenuation coefficient of the fiber by dividing loss by distance and present the result in dB/km, the normal units for attenuation.
In order to get a good measurement, it is necessary to find a relatively long section of fiber to give a good baseline for the measurement. Short distances will mean small amounts of loss, and the uncertainty of the measurement will be higher than if the distance is longer. It is also advisable to stay away from events like splices or connectors, as the OTDR may have some settling time after these events, especially if they are reflective, causing the trace to have nonlinearities caused by the instrument itself.
Most OTDRs offer a measurement method called “LSA” for least squares analysis that uses statistical methods to average the trace and provide a more reliable measurement.
17
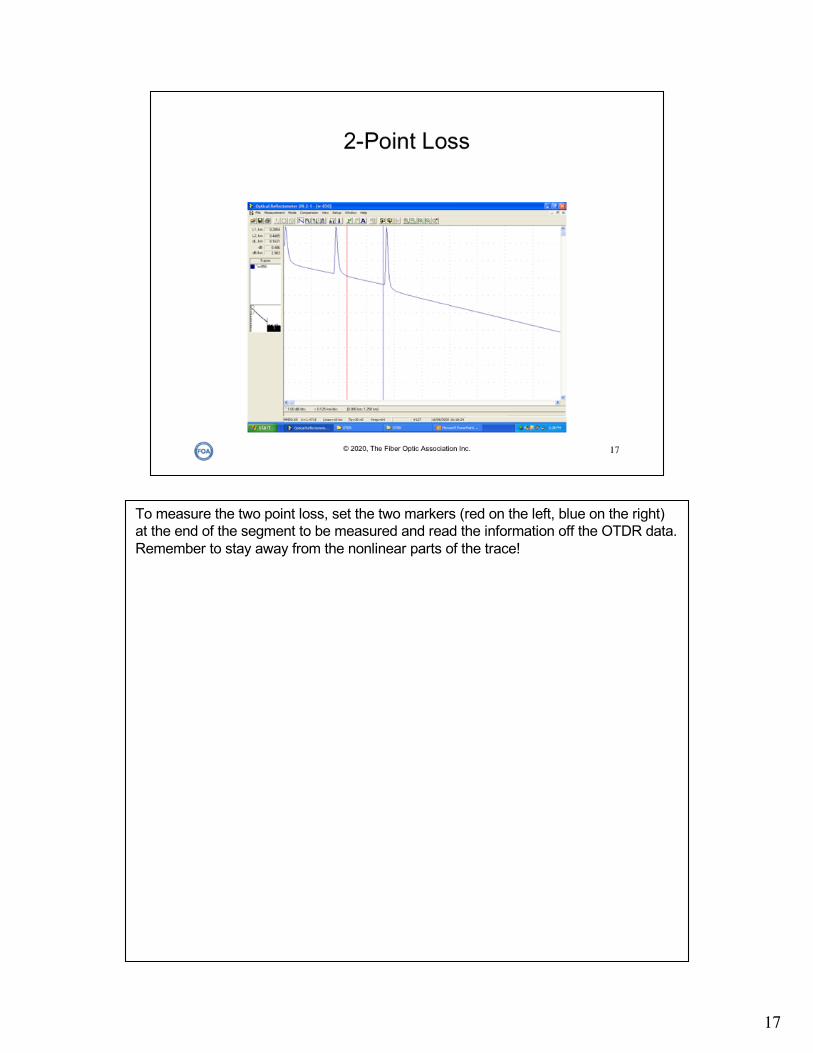
To measure the two point loss, set the two markers (red on the left, blue on the right) at the end of the segment to be measured and read the information off the OTDR data. Remember to stay away from the nonlinear parts of the trace!
18
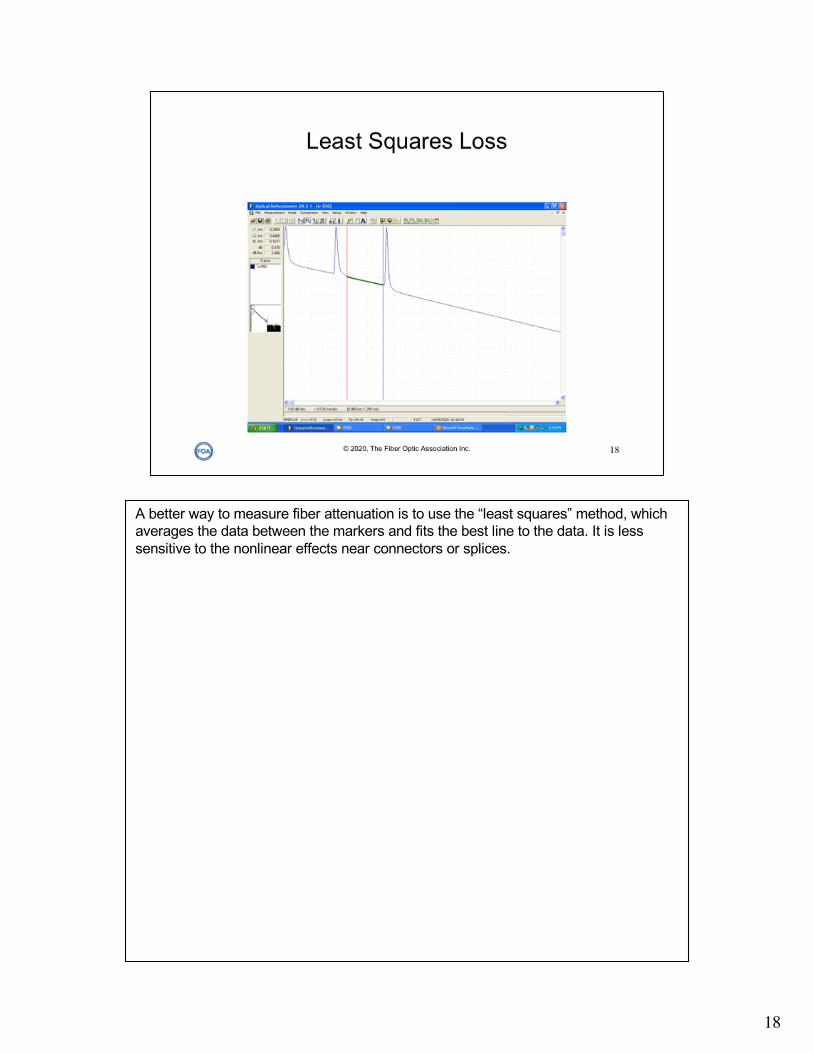
A better way to measure fiber attenuation is to use the “least squares” method, which averages the data between the markers and fits the best line to the data. It is less sensitive to the nonlinear effects near connectors or splices.
19
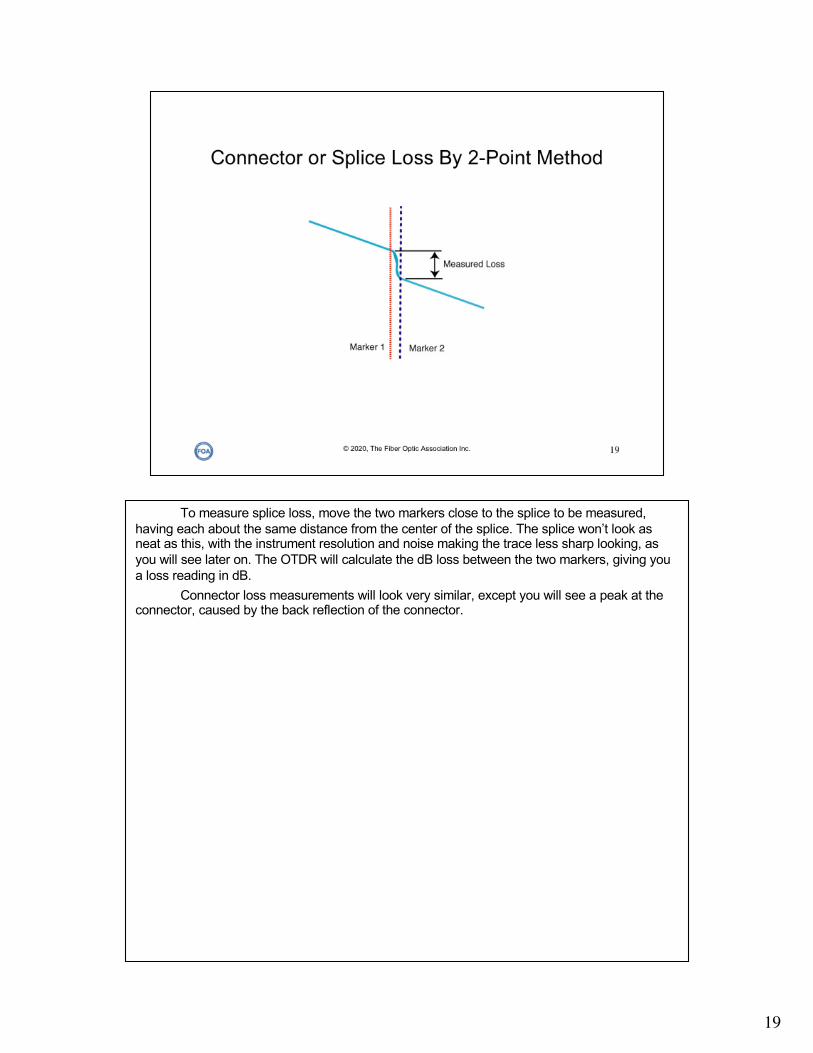
To measure splice loss, move the two markers close to the splice to be measured, having each about the same distance from the center of the splice. The splice won’t look as neat as this, with the instrument resolution and noise making the trace less sharp looking, as you will see later on. The OTDR will calculate the dB loss between the two markers, giving you a loss reading in dB.
Connector loss measurements will look very similar, except you will see a peak at the connector, caused by the back reflection of the connector.
20
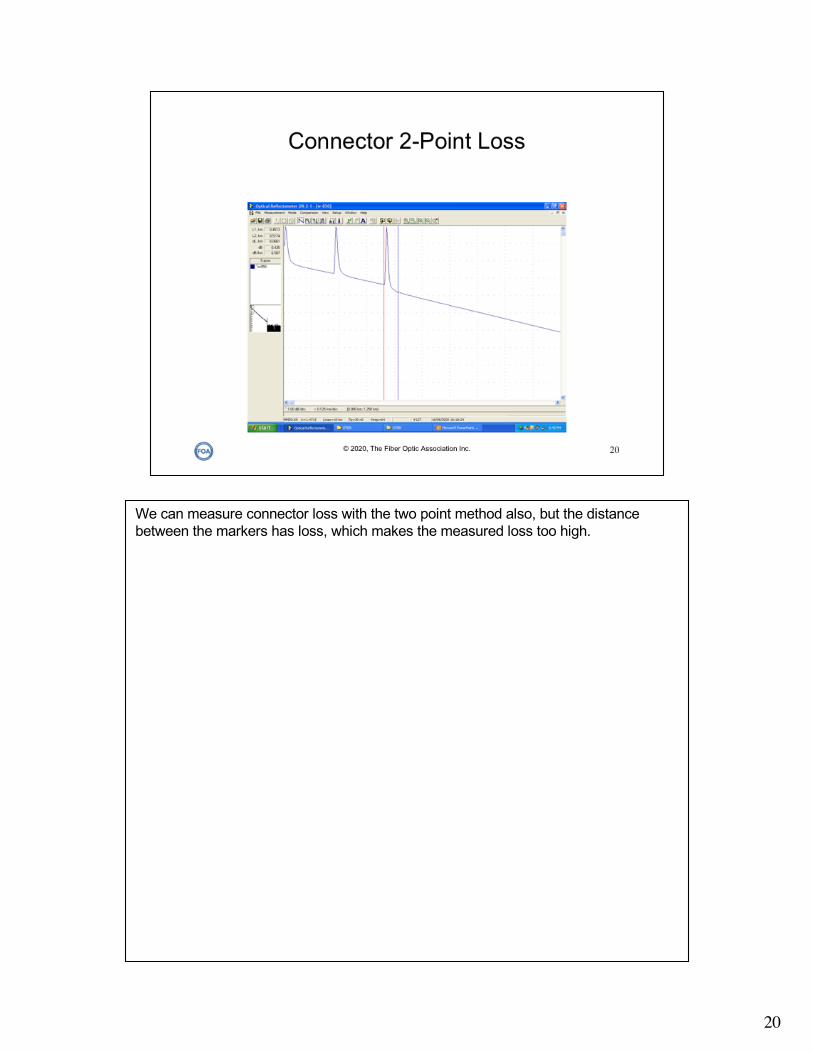
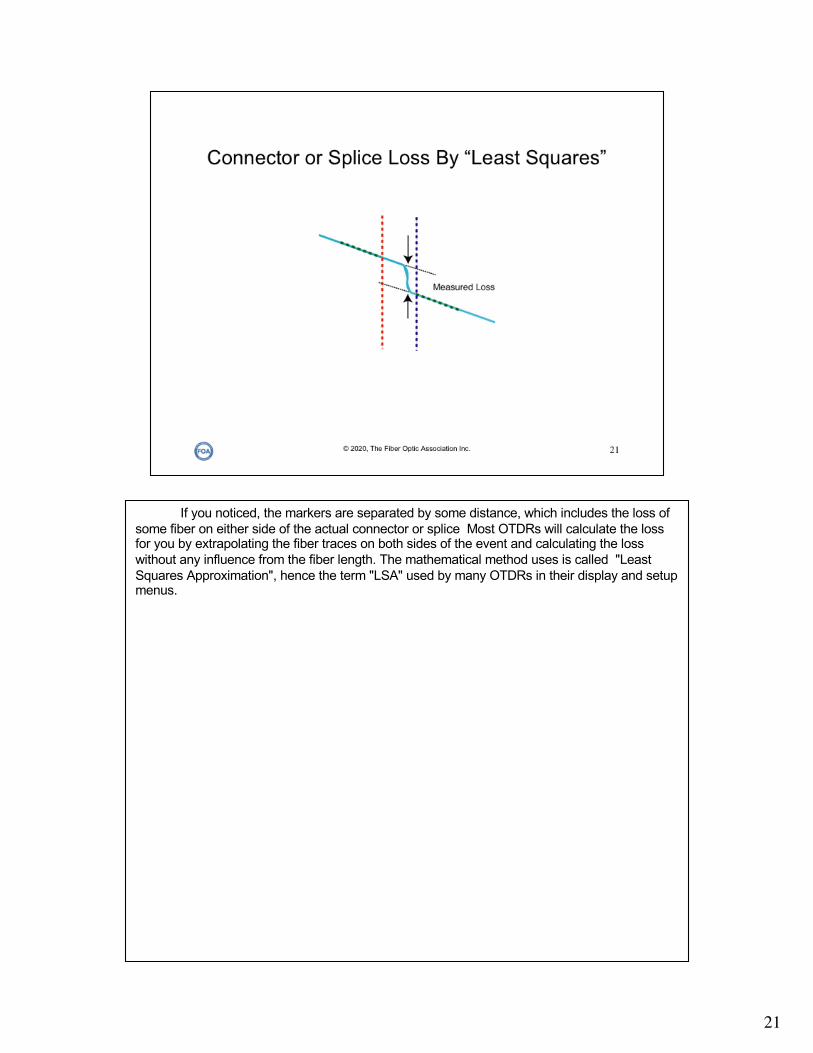
We can measure connector loss with the two point method also, but the distance between the markers has loss, which makes the measured loss too high.
21
If you noticed, the markers are separated by some distance, which includes the loss of some fiber on either side of the actual connector or splice Most OTDRs will calculate the loss for you by extrapolating the fiber traces on both sides of the event and calculating the loss without any influence from the fiber length. The mathematical method uses is called "Least Squares Approximation", hence the term "LSA" used by many OTDRs in their display and setup menus.
22
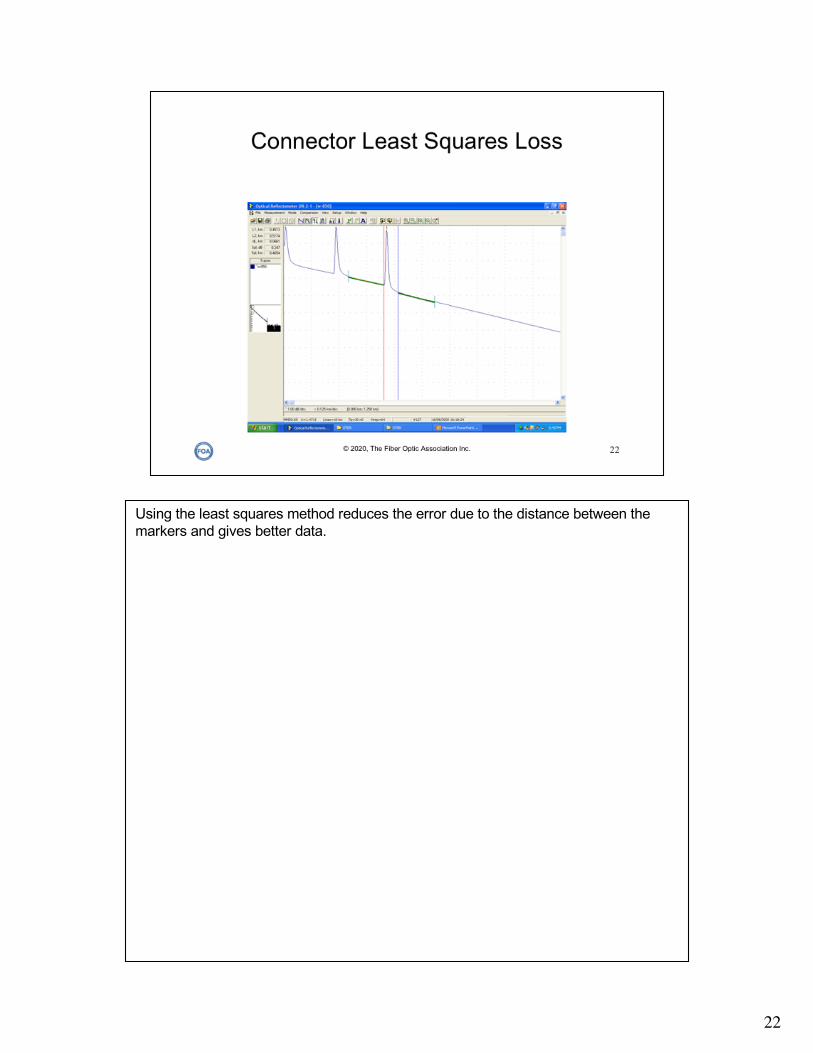
Using the least squares method reduces the error due to the distance between the markers and gives better data.
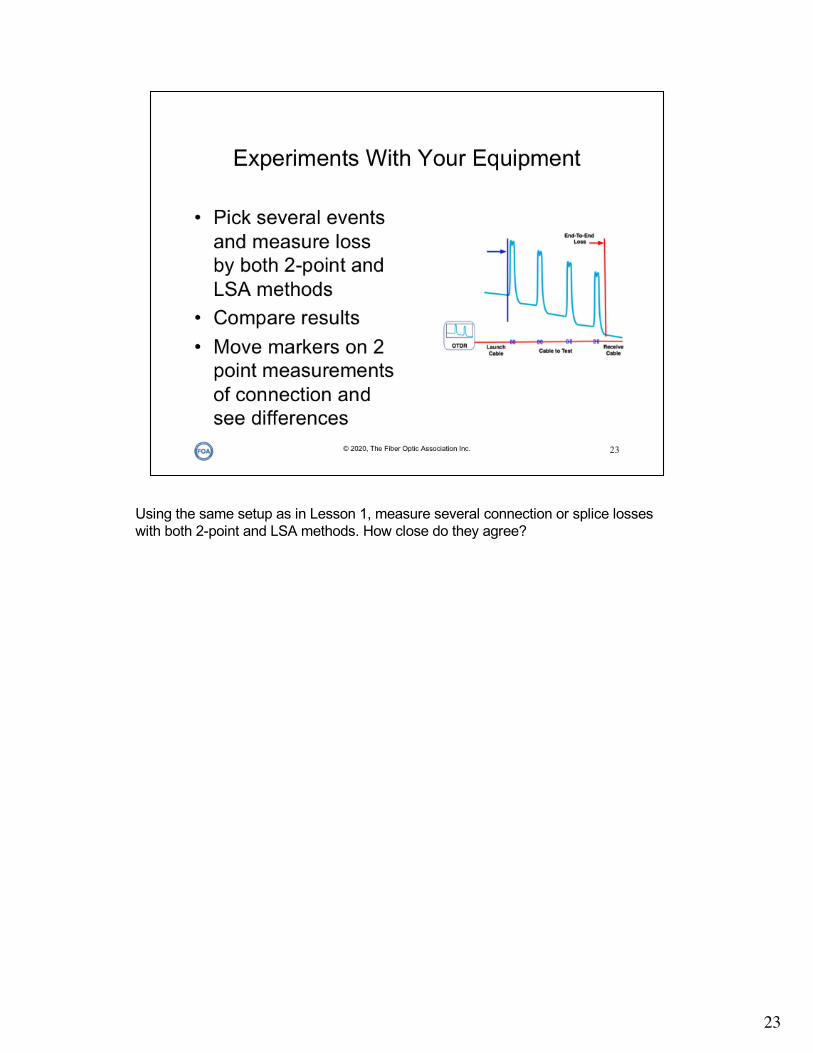
Using the same setup as in Lesson 1, measure several connection or splice losses with both 2-point and LSA methods. How close do they agree?
23

24
The OTDR is often programmed to measure return loss or the reflection from a connector or splice (usually a mechanical splice.) This is a complicated process involving the baseline of the OTDR, backscatter level and power in the reflected peak. Like all backscatter measurements, it has a fairly high measurement uncertainty, but has the advantage of showing where reflective events are located so they can be corrected if necessary.
25
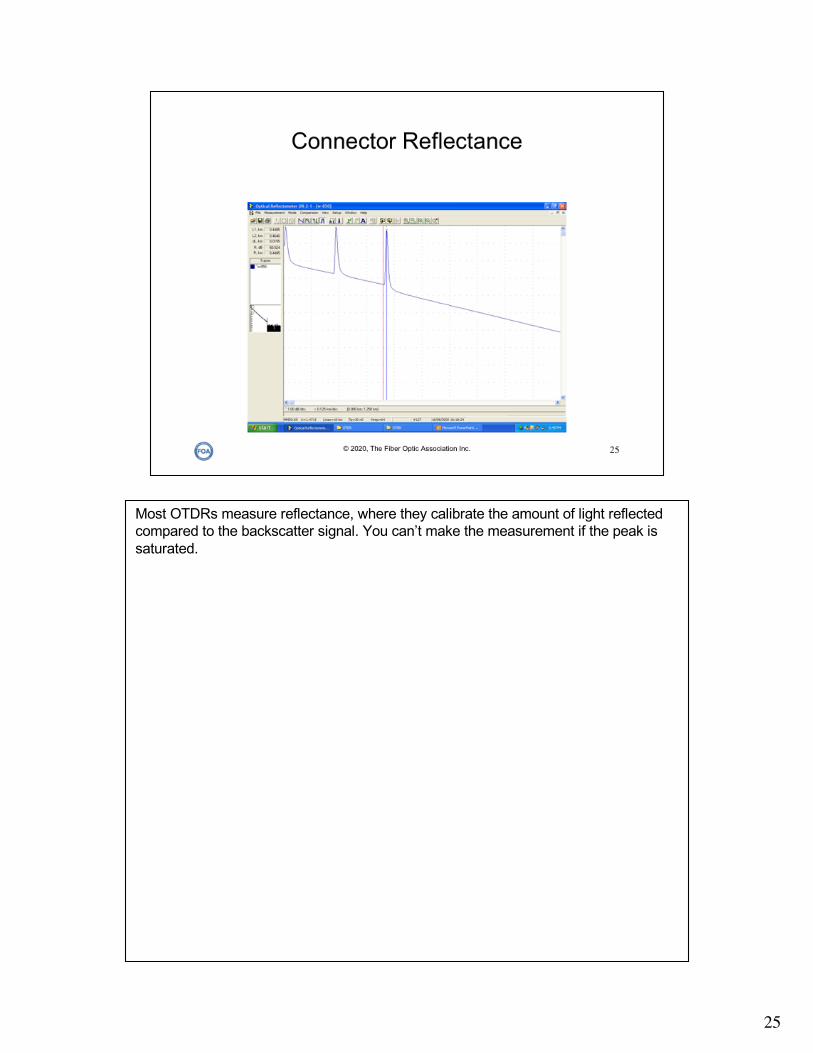
Most OTDRs measure reflectance, where they calibrate the amount of light reflected compared to the backscatter signal. You can’t make the measurement if the peak is saturated.
26
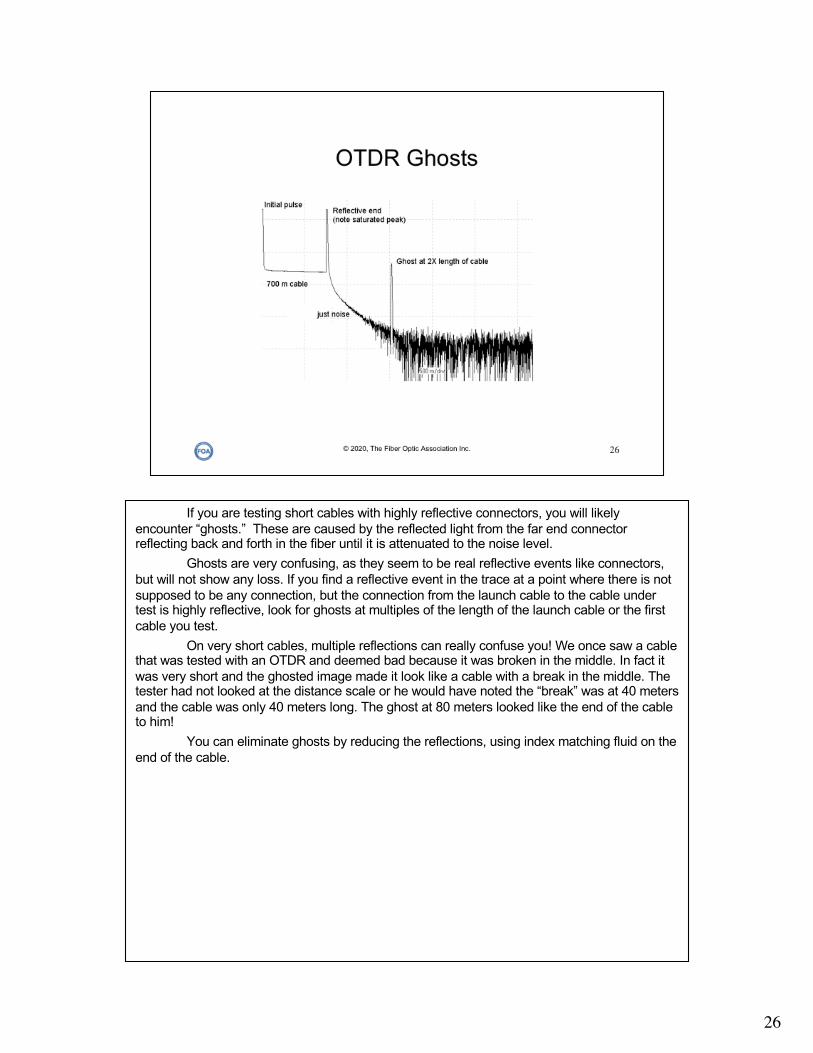
If you are testing short cables with highly reflective connectors, you will likely encounter “ghosts.” These are caused by the reflected light from the far end connector reflecting back and forth in the fiber until it is attenuated to the noise level.
Ghosts are very confusing, as they seem to be real reflective events like connectors, but will not show any loss. If you find a reflective event in the trace at a point where there is not supposed to be any connection, but the connection from the launch cable to the cable under test is highly reflective, look for ghosts at multiples of the length of the launch cable or the first cable you test.
On very short cables, multiple reflections can really confuse you! We once saw a cable that was tested with an OTDR and deemed bad because it was broken in the middle. In fact it was very short and the ghosted image made it look like a cable with a break in the middle. The tester had not looked at the distance scale or he would have noted the “break” was at 40 meters and the cable was only 40 meters long. The ghost at 80 meters looked like the end of the cable to him!
You can eliminate ghosts by reducing the reflections, using index matching fluid on the end of the cable.
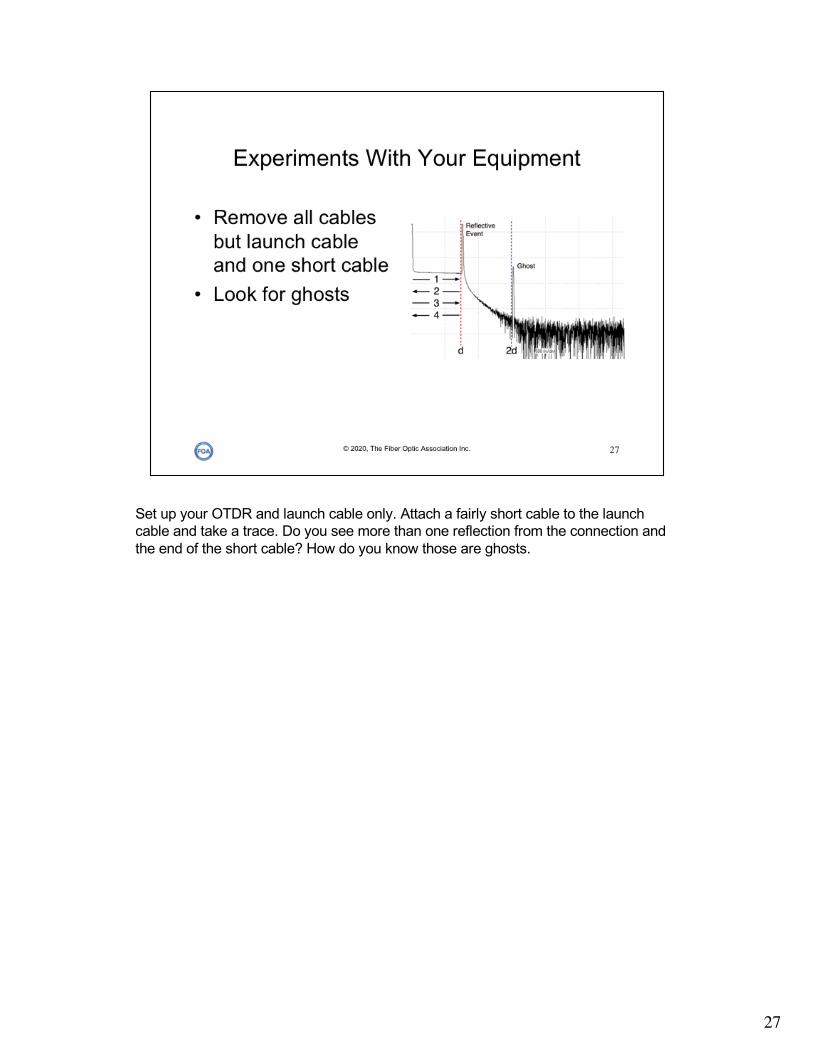
Set up your OTDR and launch cable only. Attach a fairly short cable to the launch cable and take a trace. Do you see more than one reflection from the connection and the end of the short cable? How do you know those are ghosts.
27
28
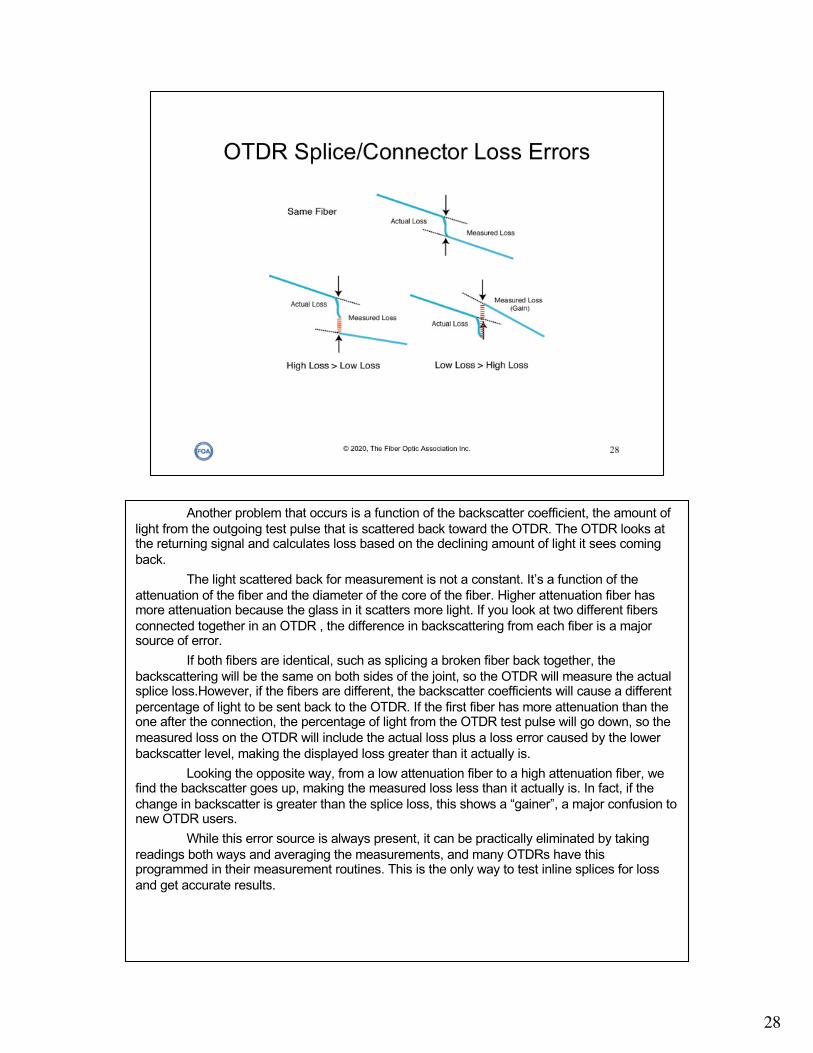
Another problem that occurs is a function of the backscatter coefficient, the amount of light from the outgoing test pulse that is scattered back toward the OTDR. The OTDR looks at the returning signal and calculates loss based on the declining amount of light it sees coming back.
The light scattered back for measurement is not a constant. It’s a function of the attenuation of the fiber and the diameter of the core of the fiber. Higher attenuation fiber has more attenuation because the glass in it scatters more light. If you look at two different fibers connected together in an OTDR , the difference in backscattering from each fiber is a major source of error.
If both fibers are identical, such as splicing a broken fiber back together, the backscattering will be the same on both sides of the joint, so the OTDR will measure the actual splice loss.However, if the fibers are different, the backscatter coefficients will cause a different percentage of light to be sent back to the OTDR. If the first fiber has more attenuation than the one after the connection, the percentage of light from the OTDR test pulse will go down, so the measured loss on the OTDR will include the actual loss plus a loss error caused by the lower backscatter level, making the displayed loss greater than it actually is.
Looking the opposite way, from a low attenuation fiber to a high attenuation fiber, we find the backscatter goes up, making the measured loss less than it actually is. In fact, if the change in backscatter is greater than the splice loss, this shows a “gainer”, a major confusion to new OTDR users.
While this error source is always present, it can be practically eliminated by taking readings both ways and averaging the measurements, and many OTDRs have this programmed in their measurement routines. This is the only way to test inline splices for loss and get accurate results.

Using the same setup, measure several connection or splice losses with LSA methods. Then reverse the test setup for the “cable under test” so you can test the same connections or splices in the opposite direction. (Be sure to not disconnect the connections your are testing so you have the same setup to compare the same connections or splices in opposite directions.) How close do they agree?
29
30
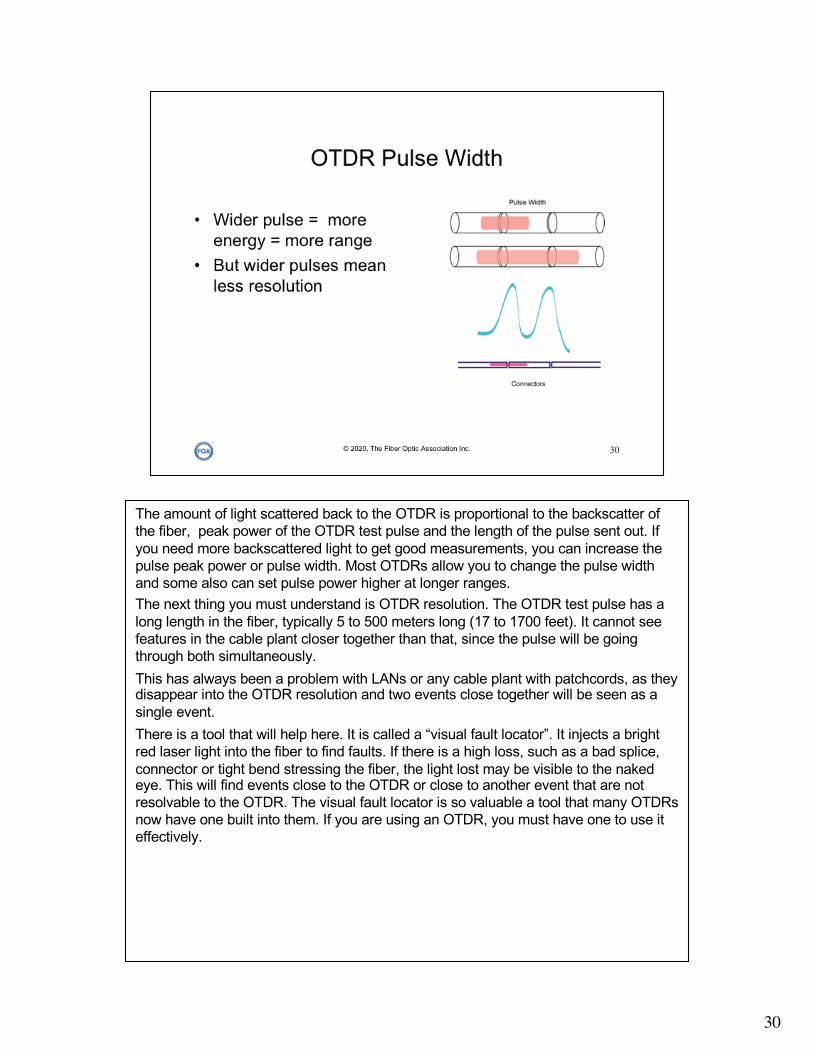
The amount of light scattered back to the OTDR is proportional to the backscatter of the fiber, peak power of the OTDR test pulse and the length of the pulse sent out. If you need more backscattered light to get good measurements, you can increase the pulse peak power or pulse width. Most OTDRs allow you to change the pulse width and some also can set pulse power higher at longer ranges.The next thing you must understand is OTDR resolution. The OTDR test pulse has a long length in the fiber, typically 5 to 500 meters long (17 to 1700 feet). It cannot see features in the cable plant closer together than that, since the pulse will be going through both simultaneously. This has always been a problem with LANs or any cable plant with patchcords, as they disappear into the OTDR resolution and two events close together will be seen as a single event. There is a tool that will help here. It is called a “visual fault locator”. It injects a bright red laser light into the fiber to find faults. If there is a high loss, such as a bad splice, connector or tight bend stressing the fiber, the light lost may be visible to the naked eye. This will find events close to the OTDR or close to another event that are not resolvable to the OTDR. The visual fault locator is so valuable a tool that many OTDRs now have one built into them. If you are using an OTDR, you must have one to use it effectively.
31
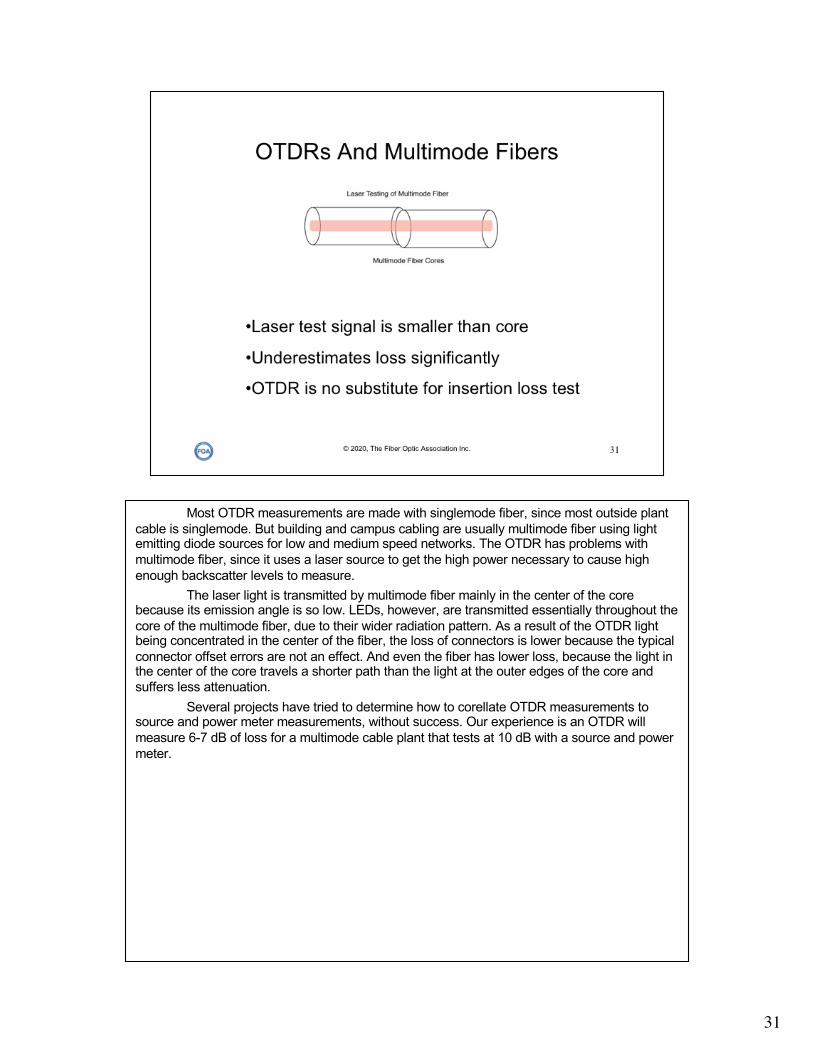
Most OTDR measurements are made with singlemode fiber, since most outside plant cable is singlemode. But building and campus cabling are usually multimode fiber using light emitting diode sources for low and medium speed networks. The OTDR has problems with multimode fiber, since it uses a laser source to get the high power necessary to cause high enough backscatter levels to measure.
The laser light is transmitted by multimode fiber mainly in the center of the core because its emission angle is so low. LEDs, however, are transmitted essentially throughout the core of the multimode fiber, due to their wider radiation pattern. As a result of the OTDR light being concentrated in the center of the fiber, the loss of connectors is lower because the typical connector offset errors are not an effect. And even the fiber has lower loss, because the light in the center of the core travels a shorter path than the light at the outer edges of the core and suffers less attenuation.
Several projects have tried to determine how to corellate OTDR measurements to source and power meter measurements, without success. Our experience is an OTDR will measure 6-7 dB of loss for a multimode cable plant that tests at 10 dB with a source and power meter.
32
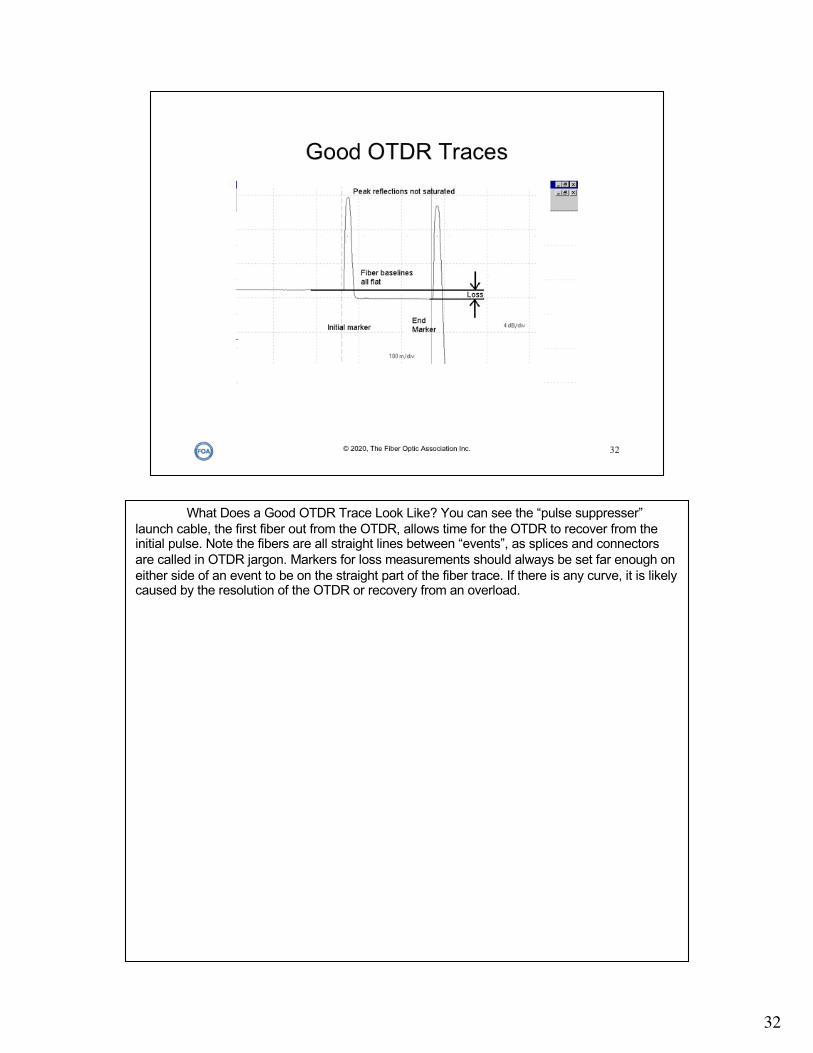
What Does a Good OTDR Trace Look Like? You can see the “pulse suppresser” launch cable, the first fiber out from the OTDR, allows time for the OTDR to recover from the initial pulse. Note the fibers are all straight lines between “events”, as splices and connectors are called in OTDR jargon. Markers for loss measurements should always be set far enough on either side of an event to be on the straight part of the fiber trace. If there is any curve, it is likely caused by the resolution of the OTDR or recovery from an overload.

33
There is a trick you can try if you are desperate. The reflection at an event that causes overloading the OTDR receiver can be tamed by using “index matching fluid” to reduce the effect that causes the reflection. The reflection is caused by an air gap between the ends of the fibers. Connectors are particularly bad at having this air gap and resulting high reflections. An index matching fluid replaces the air with a fluid or gel that closely matches the optical characteristics of the glass, causing the reflections to be greatly diminished.
Here are two traces of the same fiber. It is only 700 feet or 200 meters long, which is normally considered quite short for OTDR analysis. The intial trace shows the connector on the OTDR end has high reflections, saturating the OTDR and causing the baseline of the trace to decay slowly. Even the second pulse, from the connector at the far end of the cable has very high reflections. You can always tell a saturated pulse because it will have a flat top -unsaturated pulses have round tops. Both reflections caused ghosts also, not shown here.
Since the baseline between the two ends never becomes flat or straight, there is no reliable reference point for making a loss measurement.
But we can reduce the reflections by adding index matching fluid. We just add a drop of gel or fluid between the two connectors that matches the index of reflection of the glass in the fiber, reducing the reflections. Once we reduce the reflections, causing the receiver overload to go away, the OTDR will give us a good fiber trace just beyond the connector and a flat fiber trace which we can use for measuring the actual loss! We even got rid of the confusing ghosts!
34
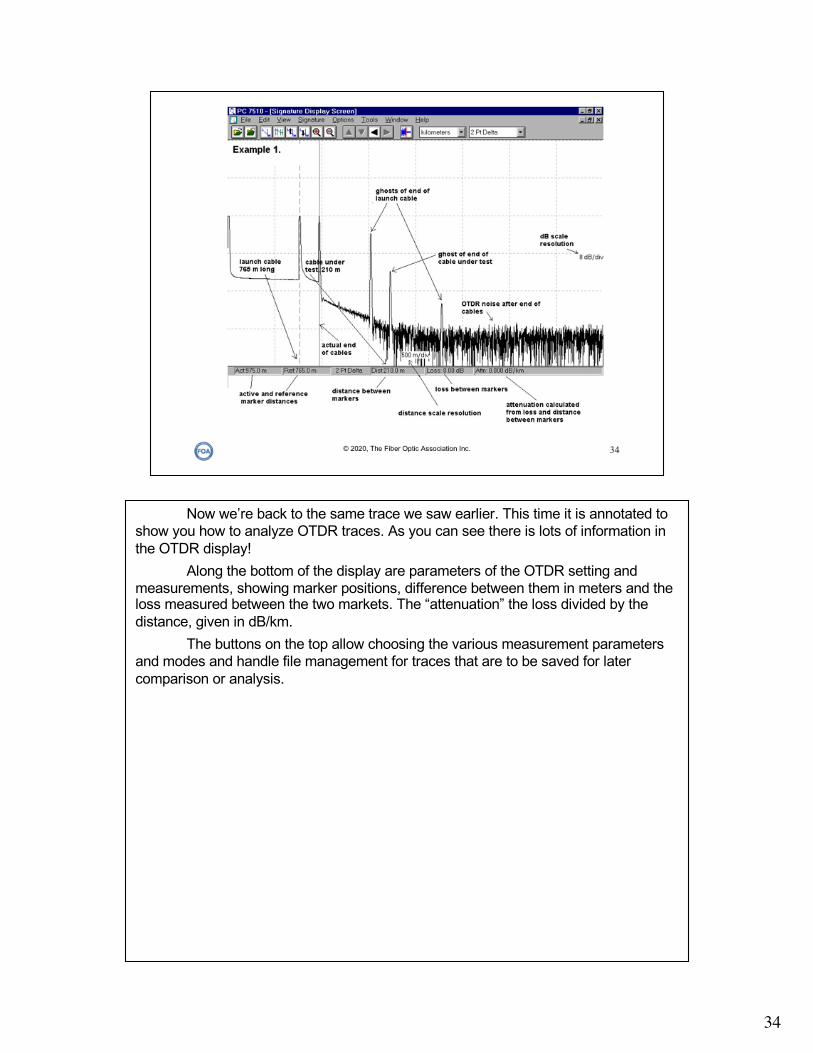
Now we’re back to the same trace we saw earlier. This time it is annotated to show you how to analyze OTDR traces. As you can see there is lots of information in the OTDR display!
Along the bottom of the display are parameters of the OTDR setting and measurements, showing marker positions, difference between them in meters and the loss measured between the two markets. The “attenuation” the loss divided by the distance, given in dB/km.
The buttons on the top allow choosing the various measurement parameters and modes and handle file management for traces that are to be saved for later comparison or analysis.
35