third quarter 2015 investor presentation · third quarter 2015 investor presentation ... aaia...
TRANSCRIPT
Third Quarter 2015 Investor Presentation
Updated 11/3/2015
Forward Looking Statements
Statements and information included in this presentation that are not purely historical are forward-looking statements within the meaning of the Private Securities Litigation Reform Act of 1995 andare made pursuant to the “safe harbor” provisions of such Act .
Forward-looking statements include, but are not limited to statements regarding our expectations,intentions, beliefs and strategies regarding the future, including statements regarding trends,cyclicality and changes in the markets we sell into; strategic direction; changes to procurementprocesses; the cost of compliance with environmental and other laws; expected tax rates; plannedcapital expenditures; liquidity positions; ability to generate cash from continuing operations; thepotential impact of adopting new accounting pronouncements; expected financial results, includingrevenue and profitability; obligations under our retirement plans; savings or additional costs frombusiness integrations and cost containment programs; and the adequacy of accruals.
All forward-looking statements we make are based on information available to us at the time thestatements are made, and we assume no obligation to update any forward-looking statements,except as may be required by law. The potential risks and uncertainties that could cause actualresults to differ from the results predicted or implied by our forward-looking statements include,among others, changes in federal or state laws or regulations that affect our business, changes inthe types of replacement parts that insurance carriers will accept, fluctuations in the prices ofmetals, as well as the risks and uncertainties included under the captions “Risk Factors” and“Management’s Discussion and Analysis of Financial Condition and Results of Operations” in ourAnnual Report on Form 10-K for the year ended December 31, 2014 and any of our subsequentQuarterly Reports on Form 10-Q. These reports are available on our investor relations website atlkqcorp.com and on the SEC website at sec.gov.
1
Company Overview
Mission Statement
To be the leading global value-added distributor of vehicle parts and accessories
by offering our customers the most comprehensive, available and cost effective
selection of part solutions while building strong partnerships with our employees and
the communities in which we operate.
3
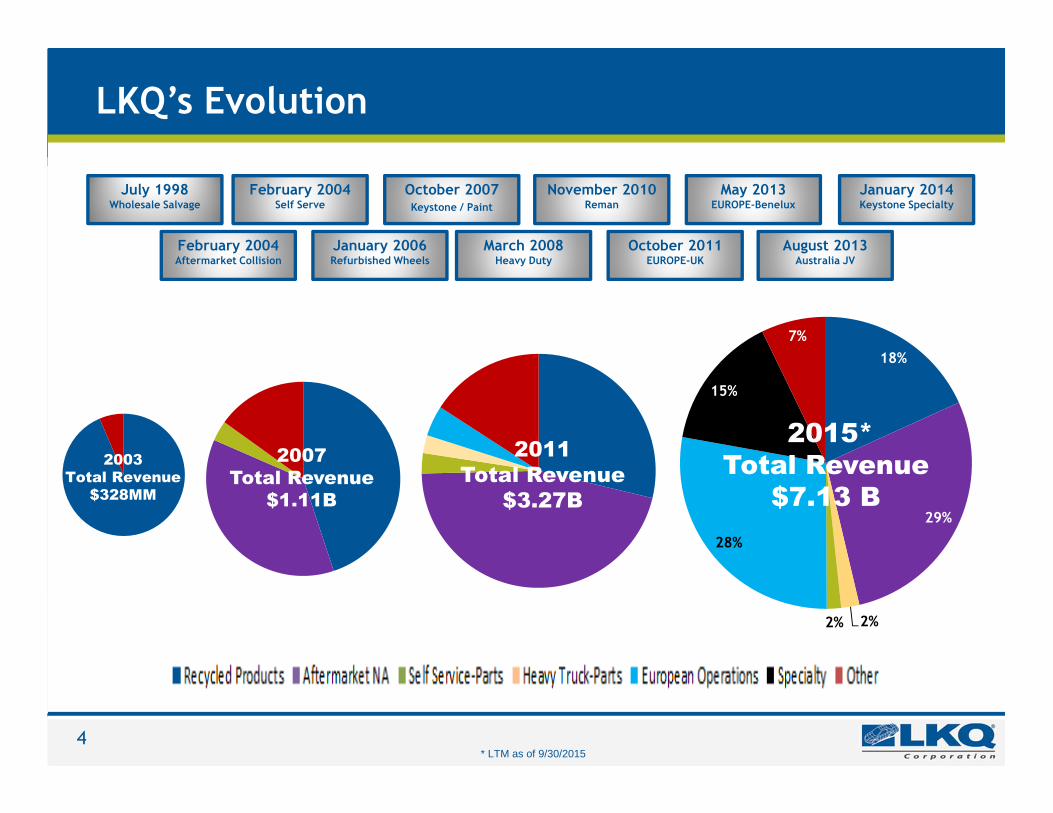
LKQ’s Evolution
4
July 1998Wholesale Salvage
February 2004Aftermarket Collision
February 2004Self Serve
January 2006Refurbished Wheels
2003
Total Revenue
$328MM
2007
Total Revenue
$1.11B
2011
Total Revenue
$3.27B
October 2007Keystone / Paint
* LTM as of 9/30/2015
March 2008Heavy Duty
November 2010Reman
October 2011EUROPE-UK
January 2014Keystone Specialty
May 2013EUROPE-Benelux
August 2013Australia JV
18%
29%
2%2%
28%
15%
7%
2015*
Total Revenue
$7.13 B
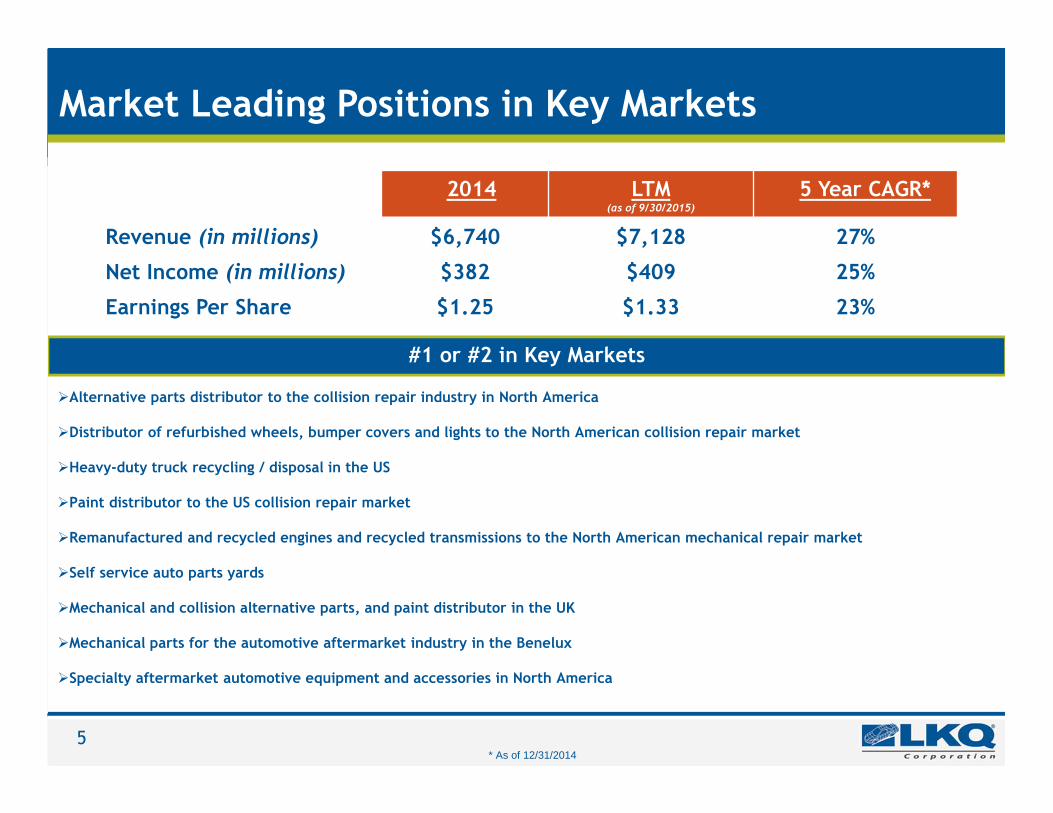
Market Leading Positions in Key Markets
* As of 12/31/2014
�Alternative parts distributor to the collision repair industry in North America
�Distributor of refurbished wheels, bumper covers and lights to the North American collision repair market
�Heavy-duty truck recycling / disposal in the US
�Paint distributor to the US collision repair market
�Remanufactured and recycled engines and recycled transmissions to the North American mechanical repair market
�Self service auto parts yards
�Mechanical and collision alternative parts, and paint distributor in the UK
�Mechanical parts for the automotive aftermarket industry in the Benelux
�Specialty aftermarket automotive equipment and accessories in North America
#1 or #2 in Key Markets
2014 LTM(as of 9/30/2015)
5 Year CAGR*
Revenue (in millions) $6,740 $7,128 27%
Net Income (in millions) $382 $409 25%
Earnings Per Share $1.25 $1.33 23%
5
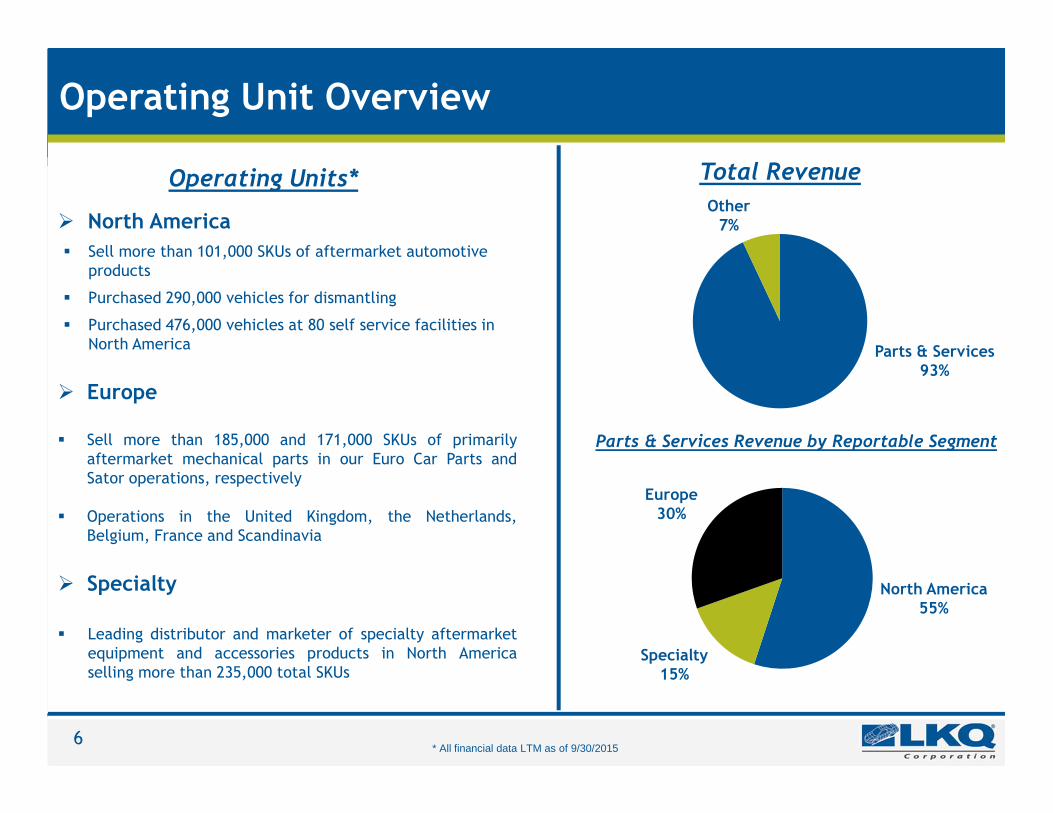
Operating Unit Overview
Operating Units*
� North America
� Sell more than 101,000 SKUs of aftermarket automotive products
� Purchased 290,000 vehicles for dismantling
� Purchased 476,000 vehicles at 80 self service facilities in North America
� Europe
� Sell more than 185,000 and 171,000 SKUs of primarilyaftermarket mechanical parts in our Euro Car Parts andSator operations, respectively
� Operations in the United Kingdom, the Netherlands,Belgium, France and Scandinavia
� Specialty
� Leading distributor and marketer of specialty aftermarketequipment and accessories products in North Americaselling more than 235,000 total SKUs
Total Revenue
Parts & Services Revenue by Reportable Segment
Parts & Services93%
North America55%
Europe30%
6* All financial data LTM as of 9/30/2015
Specialty 15%
Other7%
Segments Overview
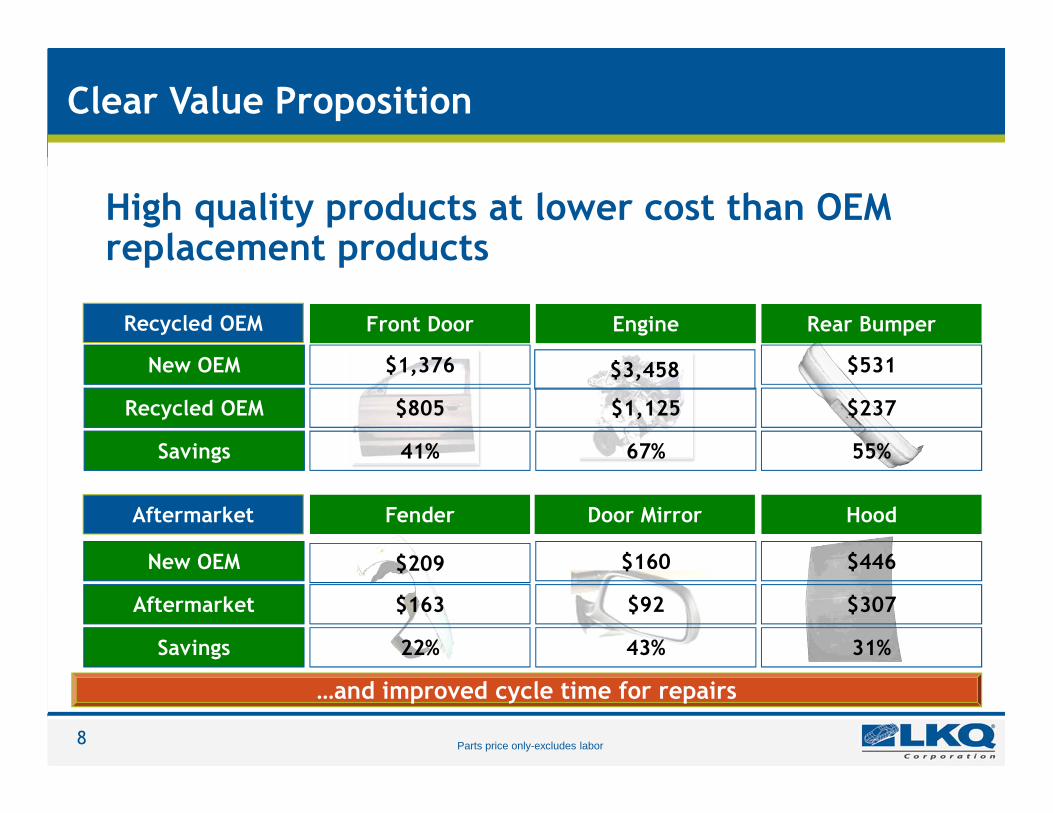
…and improved cycle time for repairs
New OEM
Recycled OEM
Savings
Front Door
$1,376
$805
41%
Engine
$3,458
$1,125
67%
Rear Bumper
$531
$237
55%
New OEM
Aftermarket
Savings
Fender
$209
$163
22%
Door Mirror
$160
$92
43%
Hood
$446
$307
31%
High quality products at lower cost than OEM replacement products
Clear Value Proposition
Recycled OEM
Aftermarket
Parts price only-excludes labor8
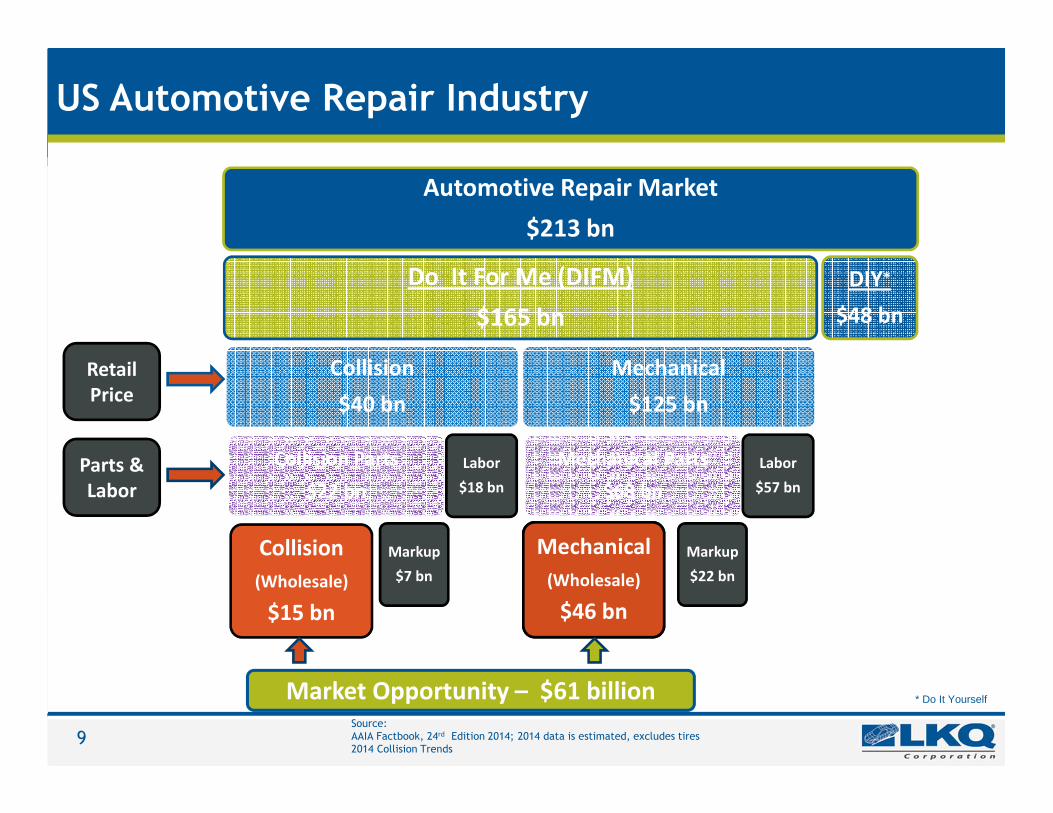
Automotive Repair Market
$213 bn
Do It For Me (DIFM)
$165 bn
Collision
$40 bn
Collision Parts
$22 bn
Collision
(Wholesale)
$15 bn
Markup
$7 bn
Labor
$18 bn
Mechanical
$125 bn
Mechanical Parts
$68 bn
Mechanical
(Wholesale)
$46 bn
Markup
$22 bn
Labor
$57 bn
DIY*
$48 bn
Source: AAIA Factbook, 24rd Edition 2014; 2014 data is estimated, excludes tires2014 Collision Trends
Retail
Price
Parts &
Labor
Market Opportunity – $61 billion
US Automotive Repair Industry
* Do It Yourself
9
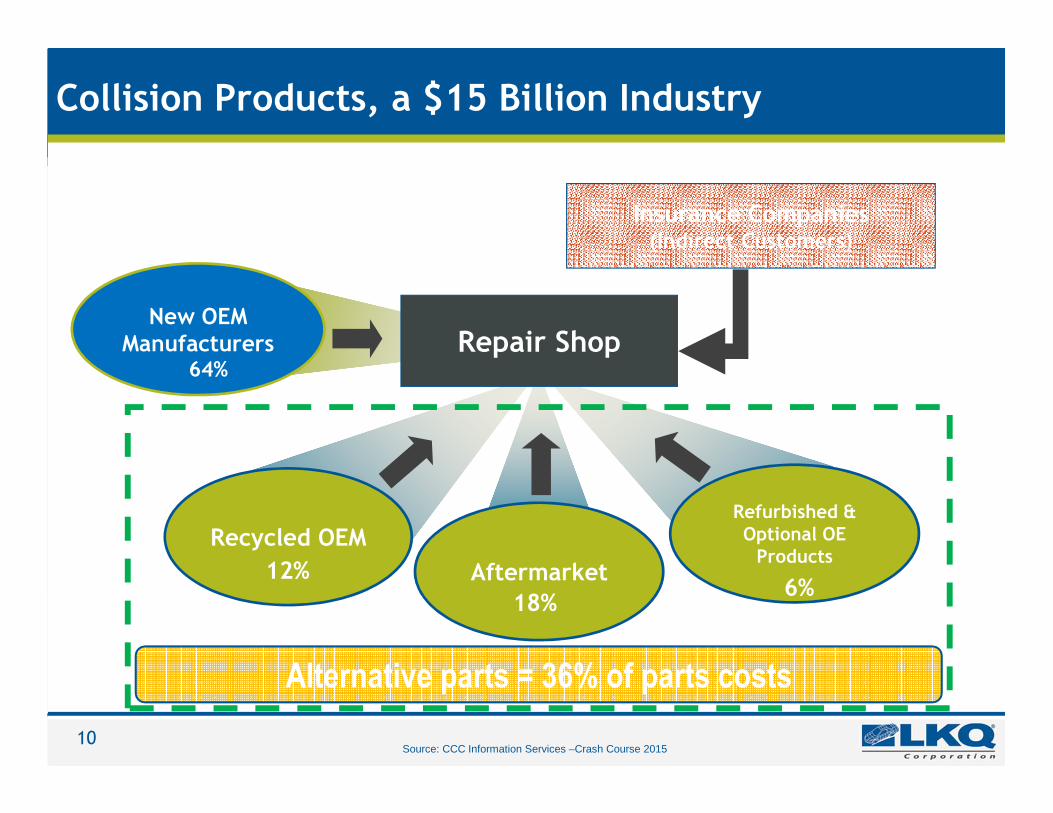
Repair ShopNew OEM
Manufacturers
Aftermarket
Recycled OEMRefurbished & Optional OE
Products
Insurance Companies (Indirect Customers)
18%
Source: CCC Information Services –Crash Course 2015
Alternative parts = 36% of parts costs
12%
64%
6%
Collision Products, a $15 Billion Industry
10

Average Parts Replaced Per Claim by Part Type
Source: CCC Information Services Inc.
5.8
2.0
7.8
6.3
2.6
8.9
0.0
2.0
4.0
6.0
8.0
10.0
OEM Alternative Parts Total
2009 2010 2011 2012 2013 2014
Over 19 million repairable claims
11
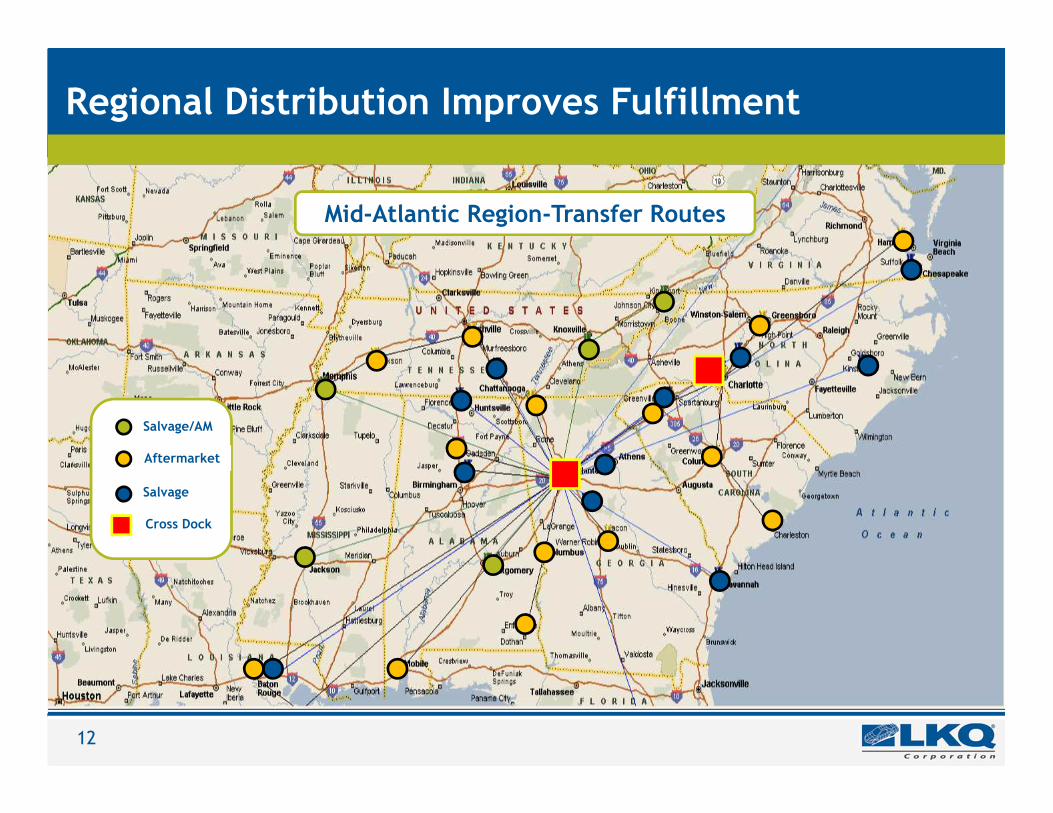
Regional Distribution Improves Fulfillment
Mid-Atlantic Region-Transfer Routes
Salvage/AM
Salvage
Aftermarket
Cross Dock
12
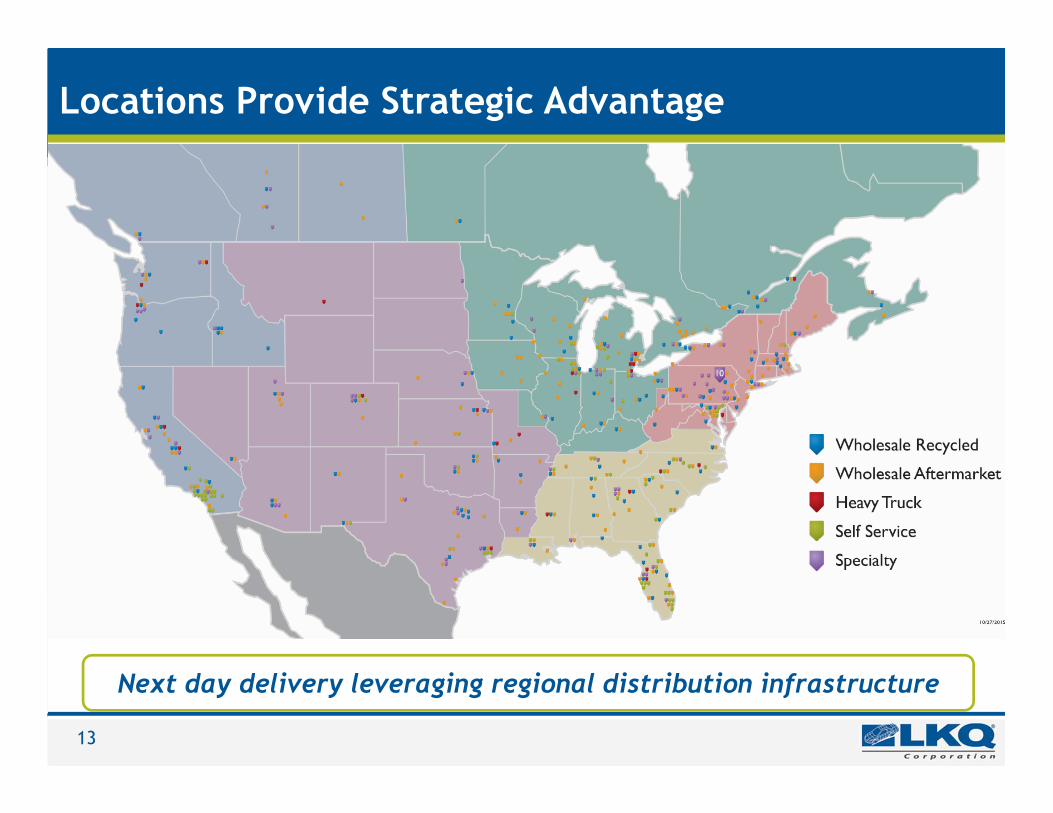
Locations Provide Strategic Advantage
Next day delivery leveraging regional distribution infrastructure
13
4 year timehorizon
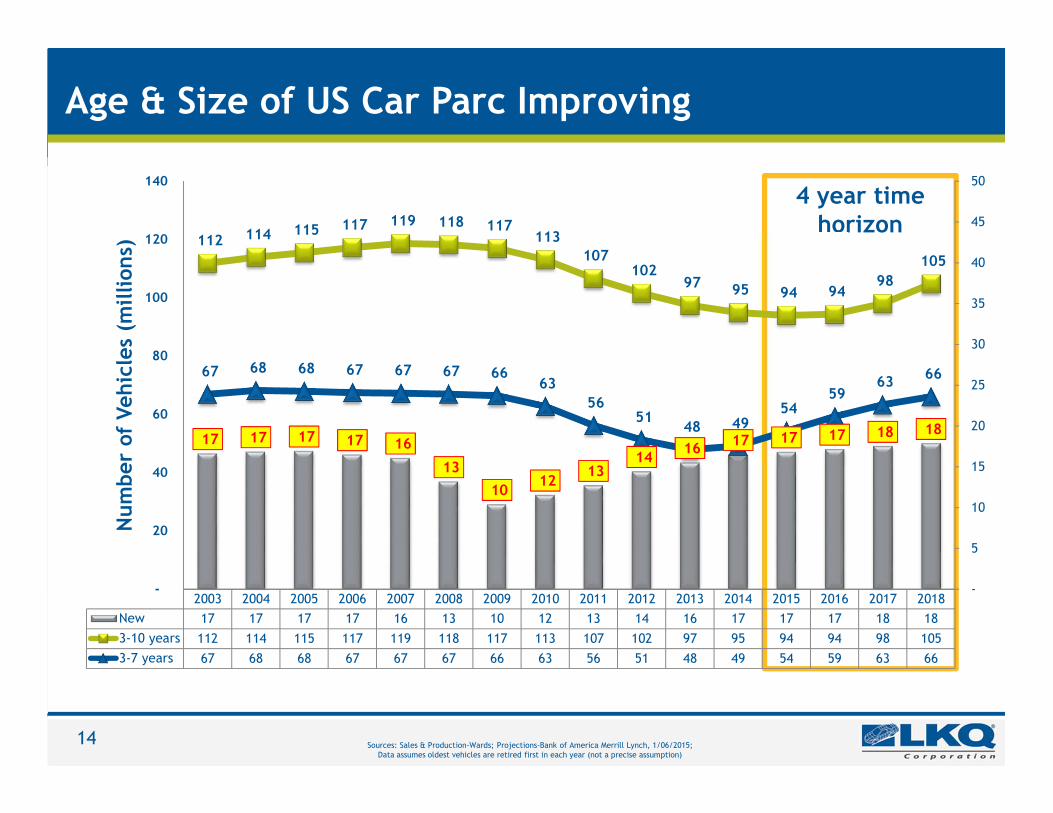
Age & Size of US Car Parc Improving
Sources: Sales & Production-Wards; Projections-Bank of America Merrill Lynch, 1/06/2015;Data assumes oldest vehicles are retired first in each year (not a precise assumption)
2003 2004 2005 2006 2007 2008 2009 2010 2011 2012 2013 2014 2015 2016 2017 2018
New 17 17 17 17 16 13 10 12 13 14 16 17 17 17 18 18
3-10 years 112 114 115 117 119 118 117 113 107 102 97 95 94 94 98 105
3-7 years 67 68 68 67 67 67 66 63 56 51 48 49 54 59 63 66
17 17 17 17 16
13
10 12
13 14
16 17 17 17 18 18
112 114 115 117 119 118 117 113
107 102
97 95 94 94 98
105
67 68 68 67 67 67 66 63
56 51
48 49 54
59 63
66
-
5
10
15
20
25
30
35
40
45
50
-
20
40
60
80
100
120
140
Num
ber
of
Vehic
les
(millions)
14
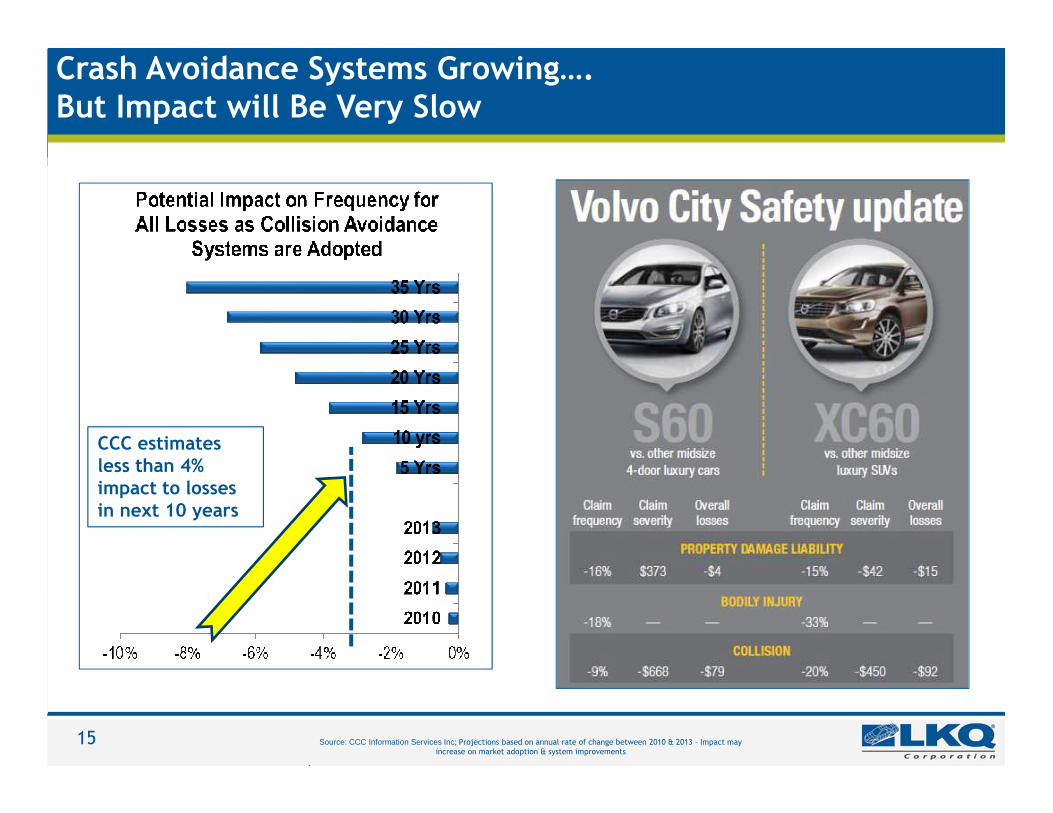
Crash Avoidance Systems Growing….But Impact will Be Very Slow
Source: CCC Information Services Inc; Projections based on annual rate of change between 2010 & 2013 – Impact may increase on market adoption & system improvements
.
CCC estimates less than 4% impact to losses in next 10 years
15
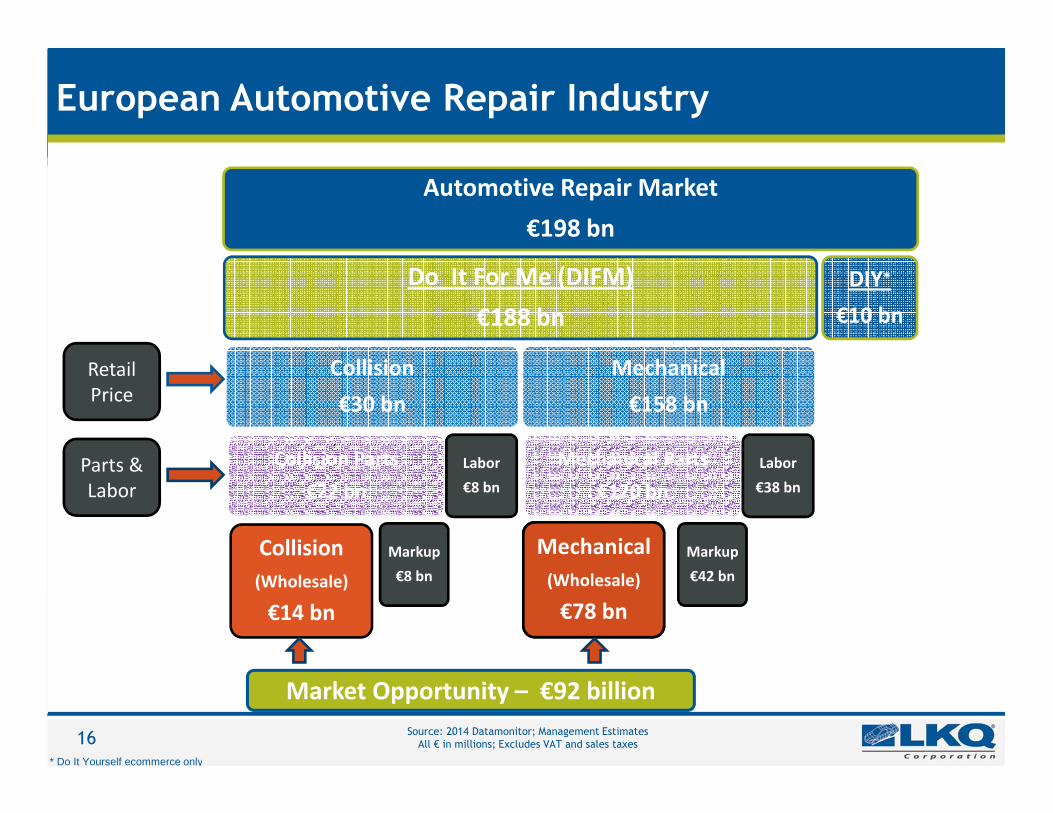
Automotive Repair Market
€198 bn
Do It For Me (DIFM)
€188 bn
Collision
€30 bn
Collision Parts
€22 bn
Collision
(Wholesale)
€14 bn
Markup
€8 bn
Labor
€8 bn
Mechanical
€158 bn
Mechanical Parts
€120 bn
Mechanical
(Wholesale)
€78 bn
Markup
€42 bn
Labor
€38 bn
DIY*
€10 bn
Source: 2014 Datamonitor; Management EstimatesAll € in millions; Excludes VAT and sales taxes
Retail
Price
Parts &
Labor
Market Opportunity – €92 billion
European Automotive Repair Industry
* Do It Yourself ecommerce only
16
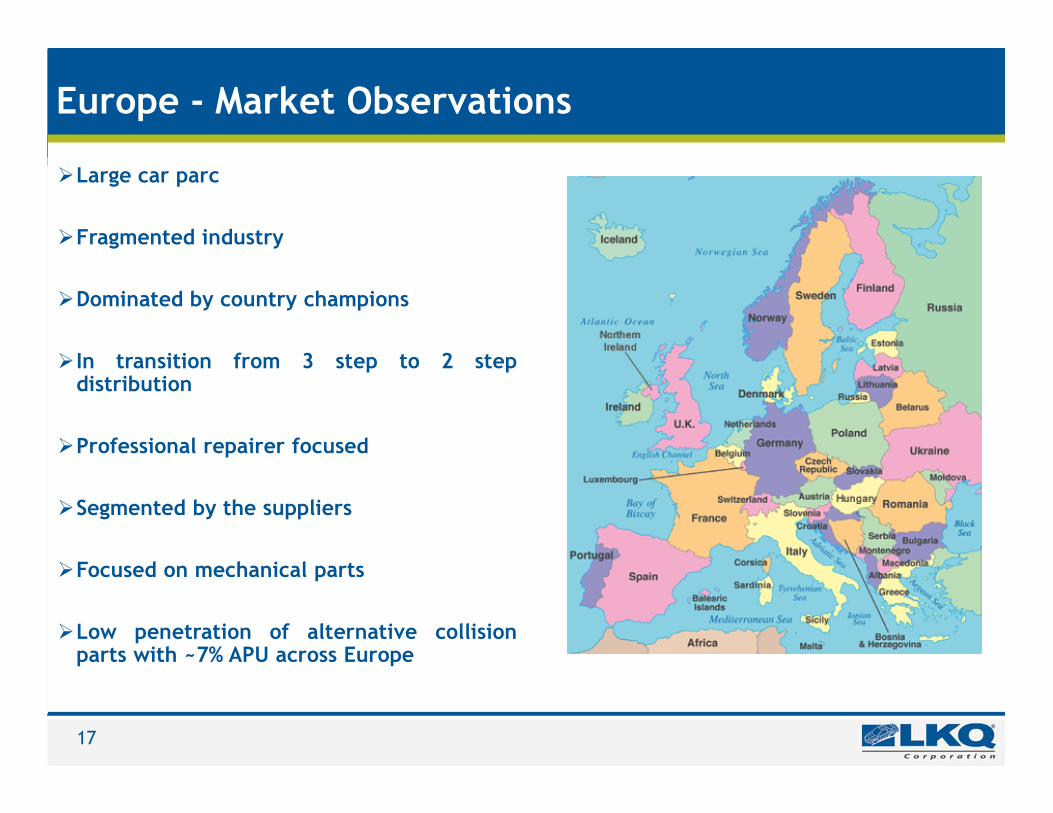
Europe - Market Observations
�Large car parc
�Fragmented industry
�Dominated by country champions
� In transition from 3 step to 2 stepdistribution
�Professional repairer focused
�Segmented by the suppliers
�Focused on mechanical parts
�Low penetration of alternative collisionparts with ~7% APU across Europe
17
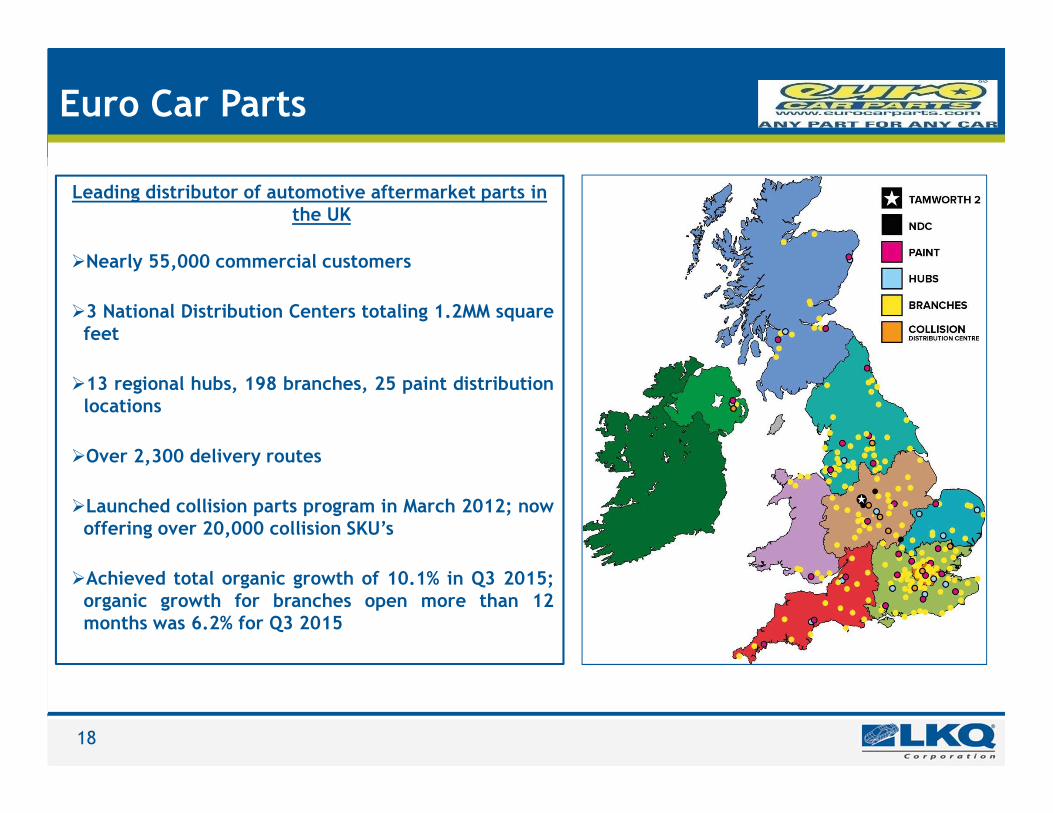
Euro Car Parts
Leading distributor of automotive aftermarket parts in the UK
�Nearly 55,000 commercial customers
�3 National Distribution Centers totaling 1.2MM squarefeet
�13 regional hubs, 198 branches, 25 paint distributionlocations
�Over 2,300 delivery routes
�Launched collision parts program in March 2012; nowoffering over 20,000 collision SKU’s
�Achieved total organic growth of 10.1% in Q3 2015;organic growth for branches open more than 12months was 6.2% for Q3 2015
18
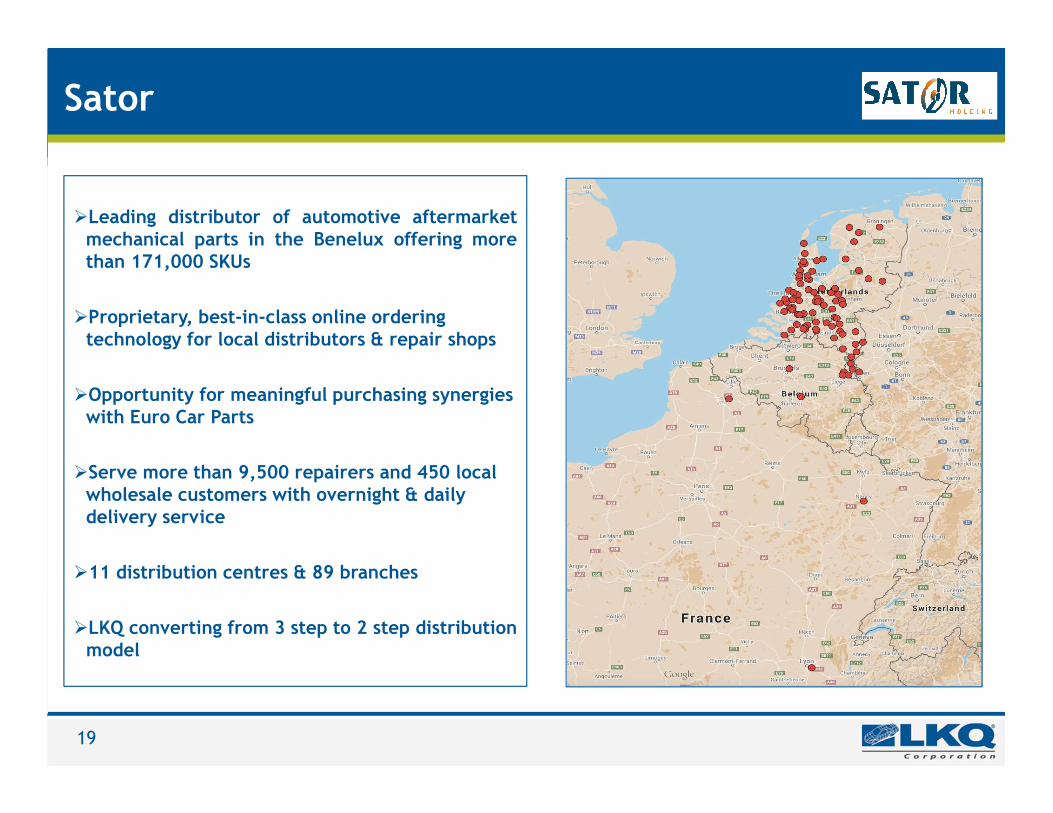
Sator
�Leading distributor of automotive aftermarketmechanical parts in the Benelux offering morethan 171,000 SKUs
�Proprietary, best-in-class online ordering technology for local distributors & repair shops
�Opportunity for meaningful purchasing synergies with Euro Car Parts
�Serve more than 9,500 repairers and 450 local wholesale customers with overnight & daily delivery service
�11 distribution centres & 89 branches
�LKQ converting from 3 step to 2 step distribution model
19
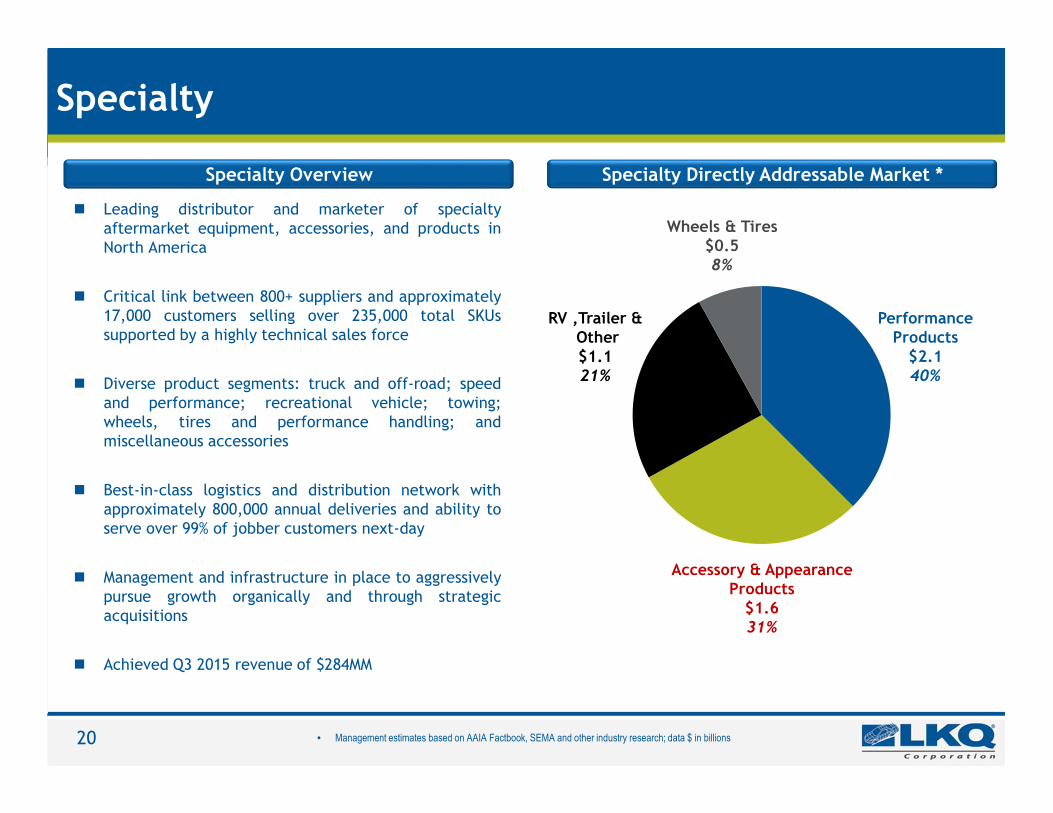
Specialty
Specialty Directly Addressable Market * Specialty Overview
� Leading distributor and marketer of specialtyaftermarket equipment, accessories, and products inNorth America
� Critical link between 800+ suppliers and approximately17,000 customers selling over 235,000 total SKUssupported by a highly technical sales force
� Diverse product segments: truck and off-road; speedand performance; recreational vehicle; towing;wheels, tires and performance handling; andmiscellaneous accessories
� Best-in-class logistics and distribution network withapproximately 800,000 annual deliveries and ability toserve over 99% of jobber customers next-day
� Management and infrastructure in place to aggressivelypursue growth organically and through strategicacquisitions
� Achieved Q3 2015 revenue of $284MM
• Management estimates based on AAIA Factbook, SEMA and other industry research; data $ in billions
Performance Products
$2.140%
Accessory & Appearance Products
$1.631%
RV ,Trailer &Other$1.121%
Wheels & Tires$0.58%
20
Financial Overview

Acquisition Revenue Growth Rates*Organic Revenue Growth Rates*
* Parts and services only
Unique Combination of Strong Organic & Acquisition Revenue Growth
0%
5%
10%
15%
20%
25%
30%
2009 2010 2011 2012 2013 2014 Q3-2015
6.1%6.6%
7.9%6.0%
11.0%9.0%
6.8%4.0%
8.3%
21.3%
23.6%
13.7%
27.8%
8.1%
22
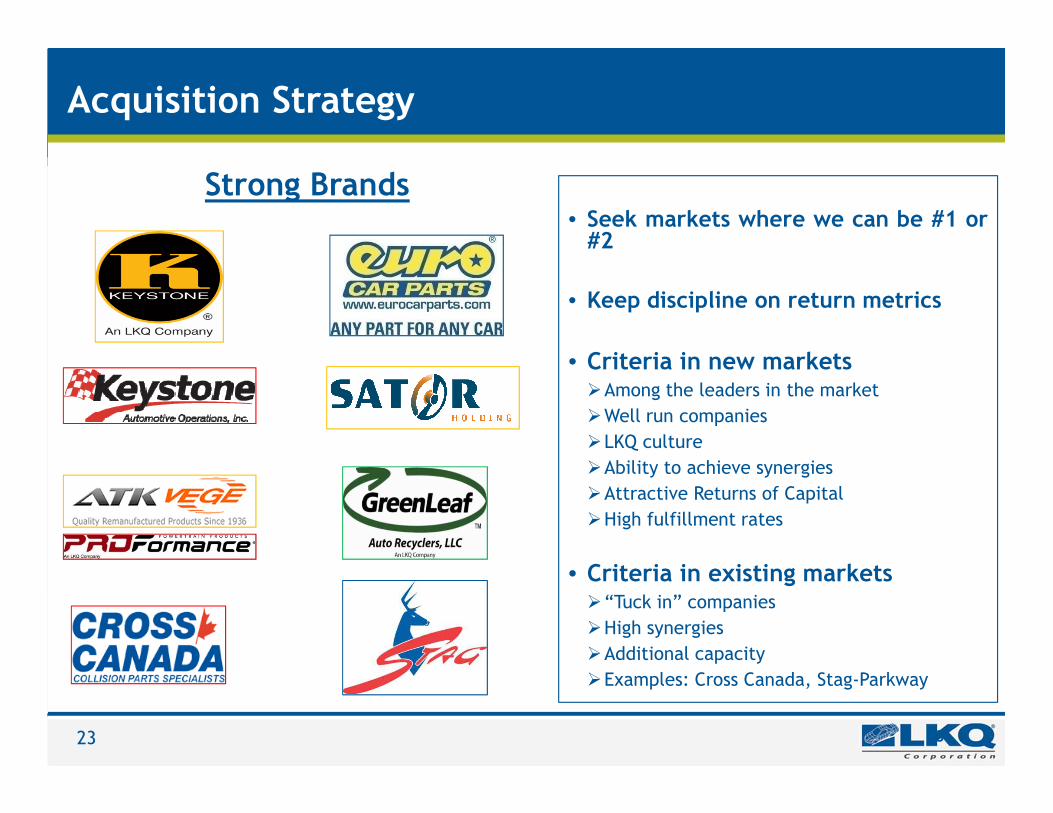
Acquisition Strategy
• Seek markets where we can be #1 or#2
• Keep discipline on return metrics
• Criteria in new markets�Among the leaders in the market
�Well run companies
�LKQ culture
�Ability to achieve synergies
�Attractive Returns of Capital
�High fulfillment rates
• Criteria in existing markets�“Tuck in” companies
�High synergies
�Additional capacity
�Examples: Cross Canada, Stag-Parkway
23
Strong Brands
23
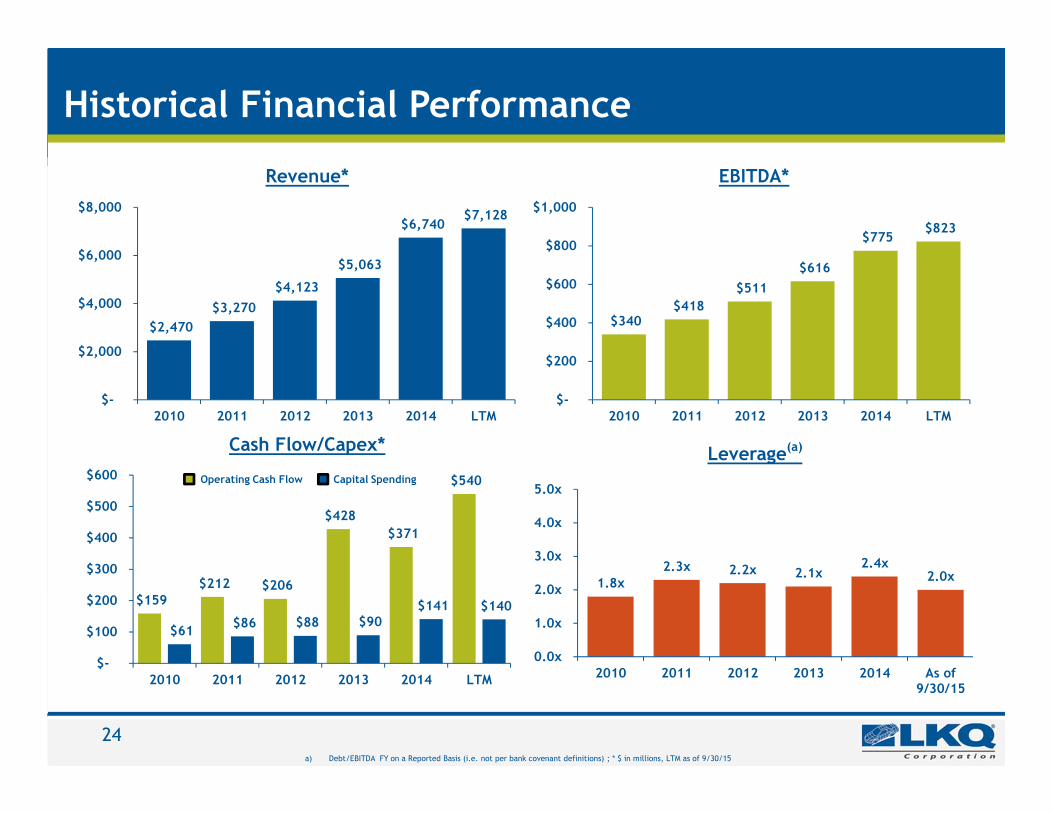
Historical Financial Performance
Revenue*
Cash Flow/Capex* Leverage(a)
EBITDA*
a) Debt/EBITDA FY on a Reported Basis (i.e. not per bank covenant definitions) ; * $ in millions, LTM as of 9/30/15
$159 $212 $206
$428
$371
$540
$61 $86 $88 $90
$141 $140
$-
$100
$200
$300
$400
$500
$600
2010 2011 2012 2013 2014 LTM
Operating Cash Flow Capital Spending
$340 $418
$511
$616
$775 $823
$-
$200
$400
$600
$800
$1,000
2010 2011 2012 2013 2014 LTM
1.8x 2.3x 2.2x 2.1x
2.4x 2.0x
0.0x
1.0x
2.0x
3.0x
4.0x
5.0x
2010 2011 2012 2013 2014 As of9/30/15
$2,470
$3,270
$4,123
$5,063
$6,740 $7,128
$-
$2,000
$4,000
$6,000
$8,000
2010 2011 2012 2013 2014 LTM
24
$5,056
$5,444
$4,800
$4,900
$5,000
$5,100
$5,200
$5,300
$5,400
$5,500
YTD 2014 YTD 2015
Revenue*
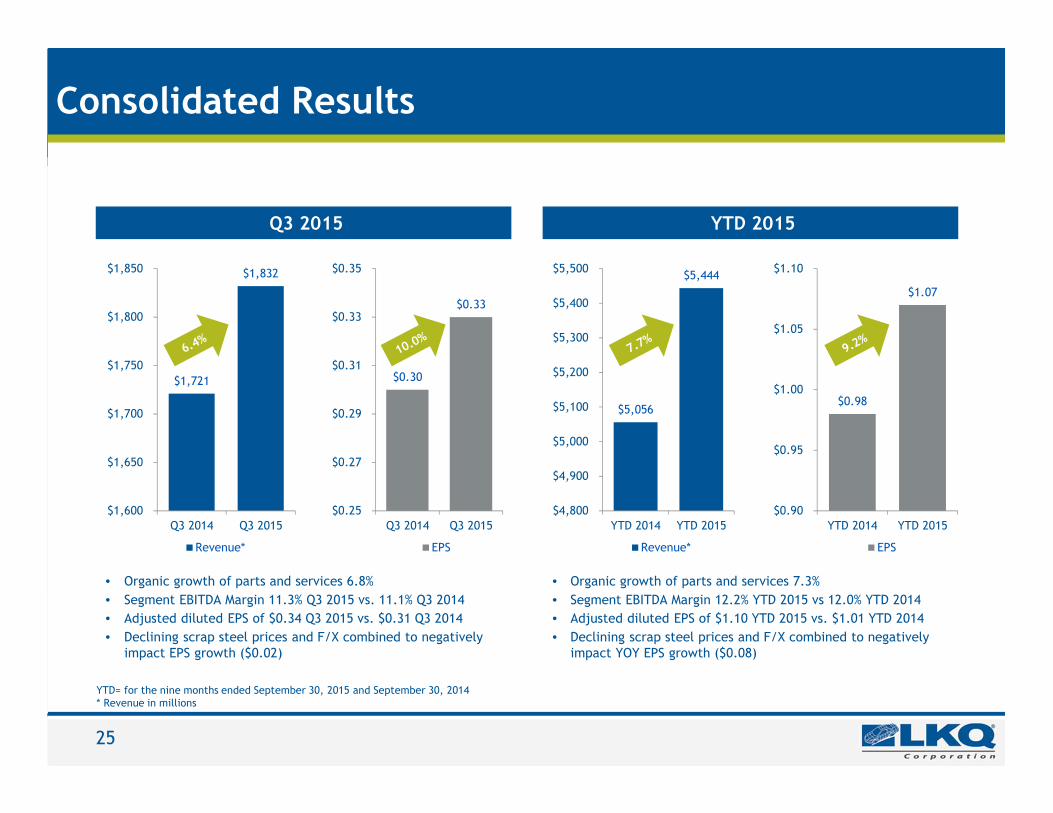
Consolidated Results
• Organic growth of parts and services 7.3%
• Segment EBITDA Margin 12.2% YTD 2015 vs 12.0% YTD 2014
• Adjusted diluted EPS of $1.10 YTD 2015 vs. $1.01 YTD 2014
• Declining scrap steel prices and F/X combined to negatively impact YOY EPS growth ($0.08)
Q3 2015 YTD 2015
YTD= for the nine months ended September 30, 2015 and September 30, 2014* Revenue in millions
• Organic growth of parts and services 6.8%
• Segment EBITDA Margin 11.3% Q3 2015 vs. 11.1% Q3 2014
• Adjusted diluted EPS of $0.34 Q3 2015 vs. $0.31 Q3 2014
• Declining scrap steel prices and F/X combined to negatively impact EPS growth ($0.02)
25
$1,721
$1,832
$1,600
$1,650
$1,700
$1,750
$1,800
$1,850
Q3 2014 Q3 2015
Revenue*
$0.30
$0.33
$0.25
$0.27
$0.29
$0.31
$0.33
$0.35
Q3 2014 Q3 2015
EPS
$0.98
$1.07
$0.90
$0.95
$1.00
$1.05
$1.10
YTD 2014 YTD 2015
EPS
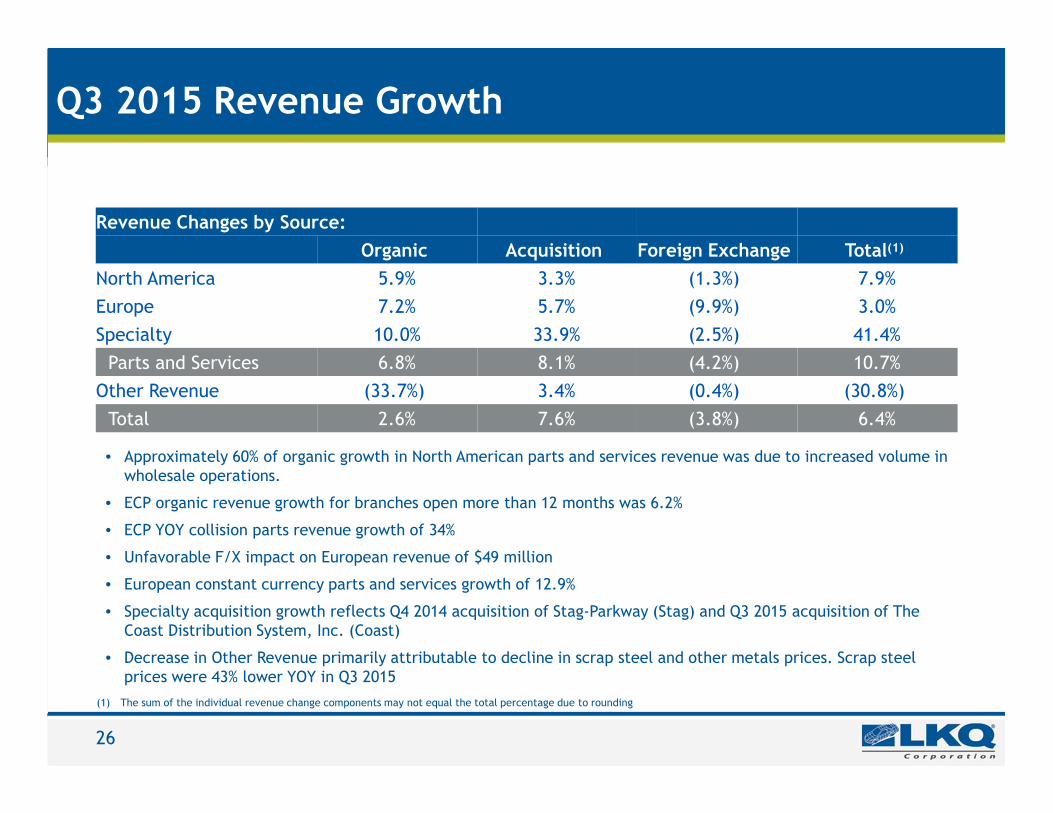
Q3 2015 Revenue Growth
• Approximately 60% of organic growth in North American parts and services revenue was due to increased volume in wholesale operations.
• ECP organic revenue growth for branches open more than 12 months was 6.2%
• ECP YOY collision parts revenue growth of 34%
• Unfavorable F/X impact on European revenue of $49 million
• European constant currency parts and services growth of 12.9%
• Specialty acquisition growth reflects Q4 2014 acquisition of Stag-Parkway (Stag) and Q3 2015 acquisition of The Coast Distribution System, Inc. (Coast)
• Decrease in Other Revenue primarily attributable to decline in scrap steel and other metals prices. Scrap steel prices were 43% lower YOY in Q3 2015
26
(1) The sum of the individual revenue change components may not equal the total percentage due to rounding
Revenue Changes by Source:
Organic Acquisition Foreign Exchange Total(1)
North America 5.9% 3.3% (1.3%) 7.9%
Europe 7.2% 5.7% (9.9%) 3.0%
Specialty 10.0% 33.9% (2.5%) 41.4%
Parts and Services 6.8% 8.1% (4.2%) 10.7%
Other Revenue (33.7%) 3.4% (0.4%) (30.8%)
Total 2.6% 7.6% (3.8%) 6.4%
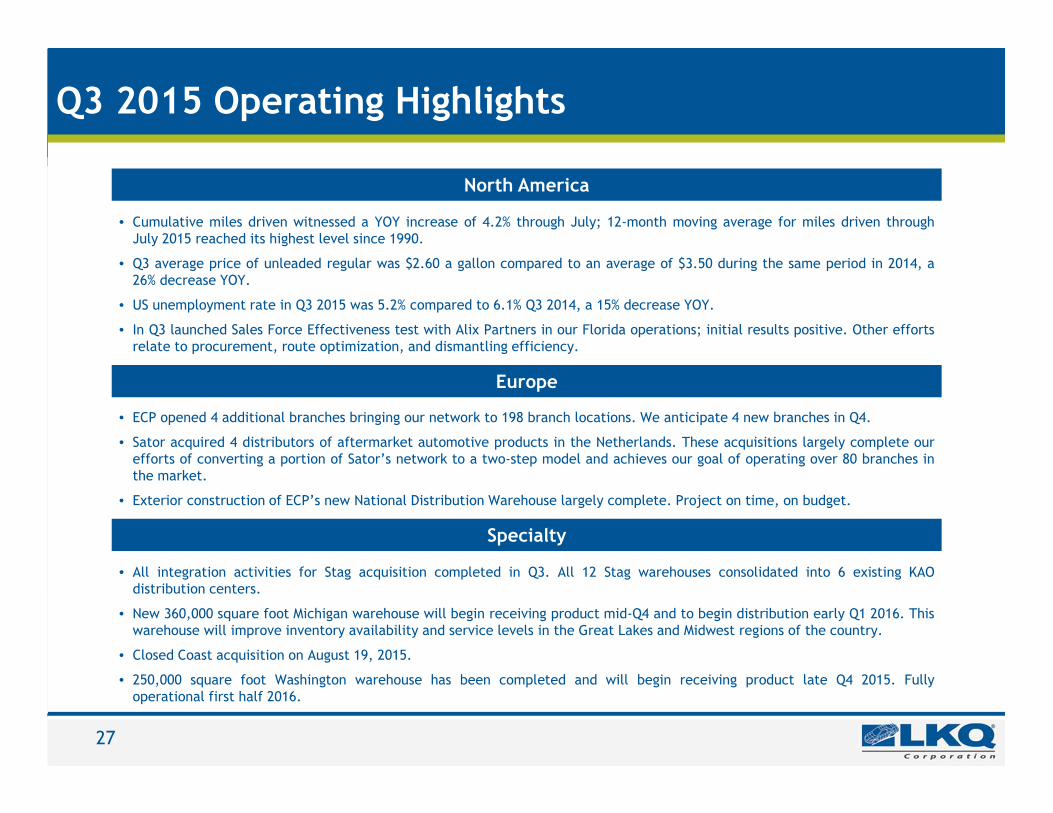
Q3 2015 Operating Highlights
27
Europe
• ECP opened 4 additional branches bringing our network to 198 branch locations. We anticipate 4 new branches in Q4.
• Sator acquired 4 distributors of aftermarket automotive products in the Netherlands. These acquisitions largely complete ourefforts of converting a portion of Sator’s network to a two-step model and achieves our goal of operating over 80 branches inthe market.
• Exterior construction of ECP’s new National Distribution Warehouse largely complete. Project on time, on budget.
Specialty
• All integration activities for Stag acquisition completed in Q3. All 12 Stag warehouses consolidated into 6 existing KAOdistribution centers.
• New 360,000 square foot Michigan warehouse will begin receiving product mid-Q4 and to begin distribution early Q1 2016. Thiswarehouse will improve inventory availability and service levels in the Great Lakes and Midwest regions of the country.
• Closed Coast acquisition on August 19, 2015.
• 250,000 square foot Washington warehouse has been completed and will begin receiving product late Q4 2015. Fullyoperational first half 2016.
North America
• Cumulative miles driven witnessed a YOY increase of 4.2% through July; 12-month moving average for miles driven throughJuly 2015 reached its highest level since 1990.
• Q3 average price of unleaded regular was $2.60 a gallon compared to an average of $3.50 during the same period in 2014, a26% decrease YOY.
• US unemployment rate in Q3 2015 was 5.2% compared to 6.1% Q3 2014, a 15% decrease YOY.
• In Q3 launched Sales Force Effectiveness test with Alix Partners in our Florida operations; initial results positive. Other effortsrelate to procurement, route optimization, and dismantling efficiency.
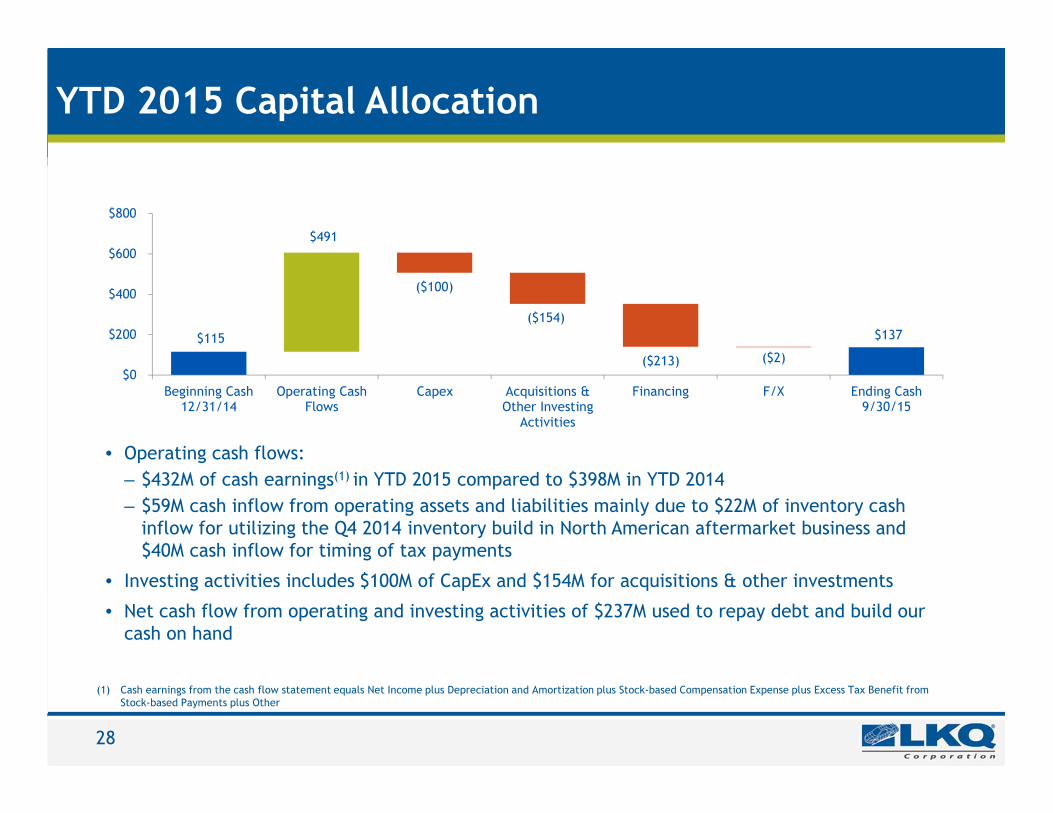
YTD 2015 Capital Allocation
• Operating cash flows:
– $432M of cash earnings(1) in YTD 2015 compared to $398M in YTD 2014
– $59M cash inflow from operating assets and liabilities mainly due to $22M of inventory cash inflow for utilizing the Q4 2014 inventory build in North American aftermarket business and $40M cash inflow for timing of tax payments
• Investing activities includes $100M of CapEx and $154M for acquisitions & other investments
• Net cash flow from operating and investing activities of $237M used to repay debt and build our cash on hand
28
$115 $137
$491
($100)
($154)
($213) ($2)
$0
$200
$400
$600
$800
Beginning Cash12/31/14
Operating CashFlows
Capex Acquisitions &Other Investing
Activities
Financing F/X Ending Cash9/30/15
(1) Cash earnings from the cash flow statement equals Net Income plus Depreciation and Amortization plus Stock-based Compensation Expense plus Excess Tax Benefit from Stock-based Payments plus Other
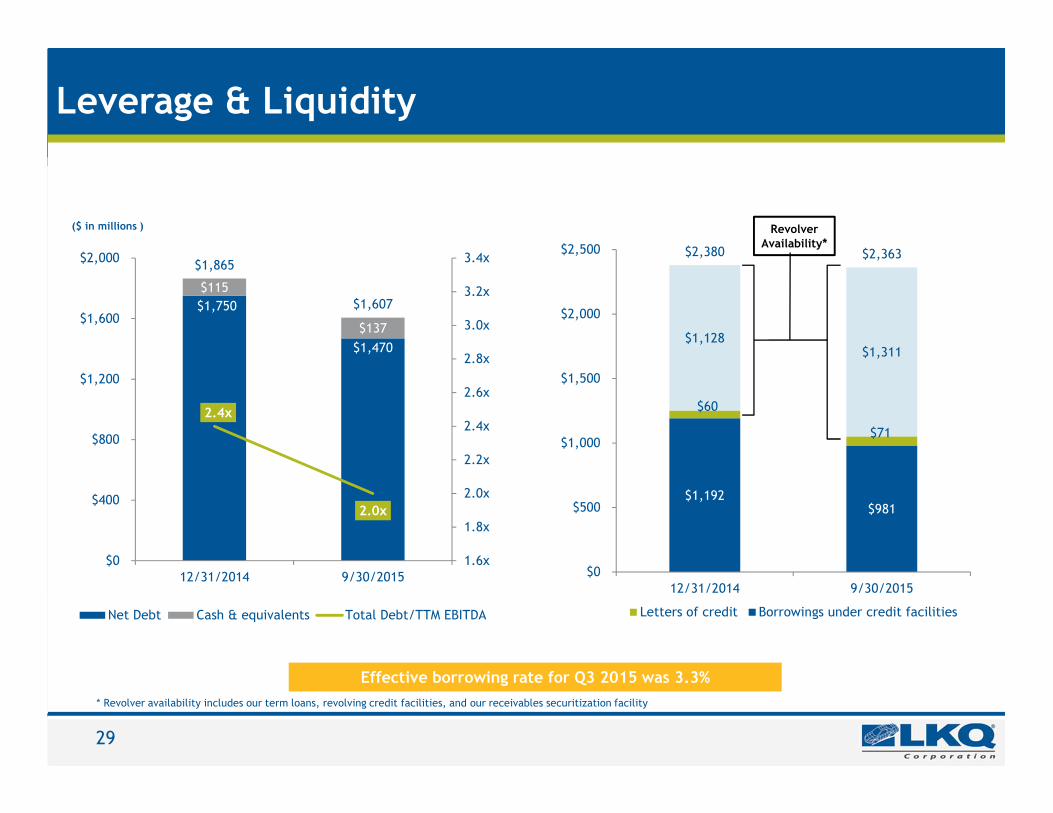
Leverage & Liquidity
29
Effective borrowing rate for Q3 2015 was 3.3%
Revolver Availability*
($ in millions )
* Revolver availability includes our term loans, revolving credit facilities, and our receivables securitization facility
$1,192 $981
$60
$71
$1,128 $1,311
$2,380 $2,363
$0
$500
$1,000
$1,500
$2,000
$2,500
12/31/2014 9/30/2015
Letters of credit Borrowings under credit facilities
$1,750
$1,470
$115
$137
$1,865
$1,607
2.4x
2.0x
1.6x
1.8x
2.0x
2.2x
2.4x
2.6x
2.8x
3.0x
3.2x
3.4x
$0
$400
$800
$1,200
$1,600
$2,000
12/31/2014 9/30/2015
Net Debt Cash & equivalents Total Debt/TTM EBITDA
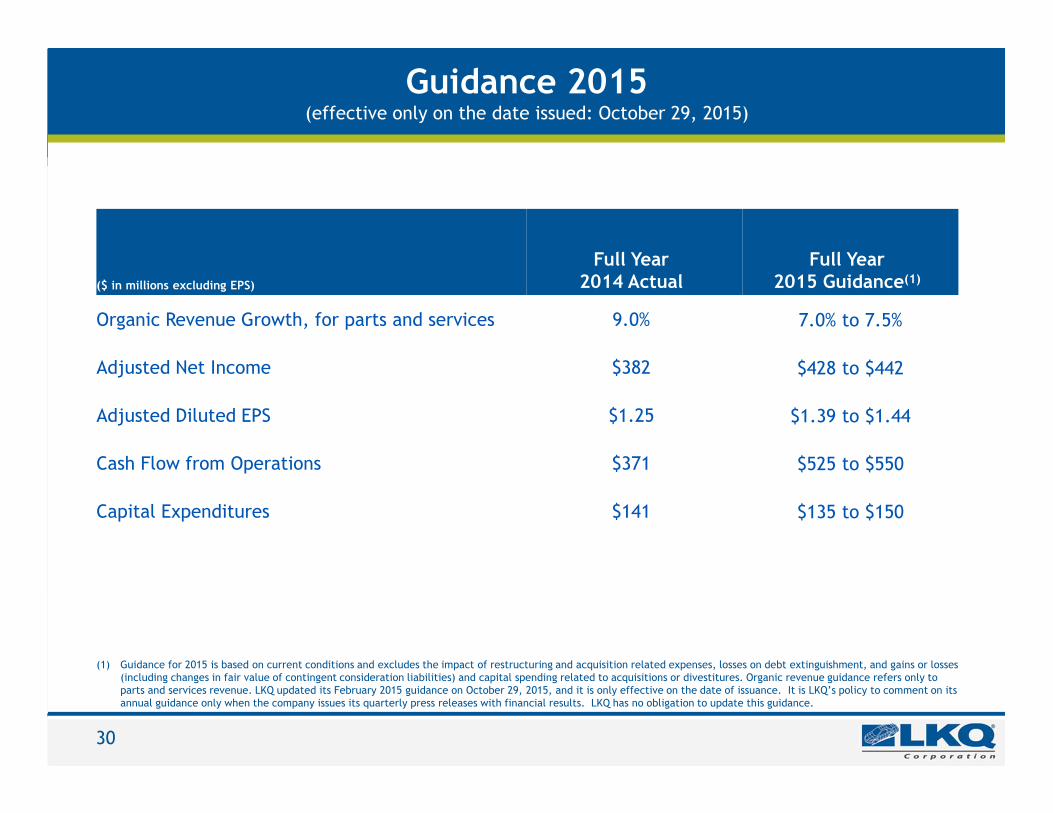
Guidance 2015 (effective only on the date issued: October 29, 2015)
30
(1) Guidance for 2015 is based on current conditions and excludes the impact of restructuring and acquisition related expenses, losses on debt extinguishment, and gains or losses (including changes in fair value of contingent consideration liabilities) and capital spending related to acquisitions or divestitures. Organic revenue guidance refers only to parts and services revenue. LKQ updated its February 2015 guidance on October 29, 2015, and it is only effective on the date of issuance. It is LKQ’s policy to comment on its annual guidance only when the company issues its quarterly press releases with financial results. LKQ has no obligation to update this guidance.
($ in millions excluding EPS)
Full Year2014 Actual
Full Year2015 Guidance(1)
Organic Revenue Growth, for parts and services 9.0% 7.0% to 7.5%
Adjusted Net Income $382 $428 to $442
Adjusted Diluted EPS $1.25 $1.39 to $1.44
Cash Flow from Operations $371 $525 to $550
Capital Expenditures $141 $135 to $150
Appendix - Non-GAAP Financial Measures
31
The financial data contained in the presentation materials includes earnings before interest, taxes, depreciation andamortization ("EBITDA") and provides a reconciliation of net income to EBITDA. The financial data contained in thepresentation materials also includes adjusted net income and adjusted diluted earnings per share ("EPS") andprovides a reconciliation of net income and diluted EPS to adjusted net income and adjusted diluted EPS. TheCompany defines adjusted net income and adjusted diluted EPS as net income and diluted EPS adjusted to eliminatethe impact of restructuring and acquisition related expenses, net of tax, loss on debt extinguishment, net of tax, andthe change in fair value of contingent consideration liabilities. EBITDA, adjusted net income and adjusted diluted EPSare not measures of financial performance under generally accepted accounting principles in the United States.
We have presented EBITDA, adjusted net income and adjusted diluted EPS information solely as supplementaldisclosures because we believe they offer investors, securities analysts and other interested parties usefulinformation regarding our results of operations because they assist in analyzing our performance and the value of ourbusiness. EBITDA provides insight into our profitability trends, and allows management and investors to analyze ouroperating results with and without the impact of depreciation, amortization, interest and income tax expense. Webelieve EBITDA is used by securities analysts, investors and other interested parties in evaluating companies, many ofwhich present EBITDA when reporting their results. EBITDA should not be construed as an alternative to operatingincome, net income or net cash provided by (used in) operating activities, as determined in accordance withaccounting principles generally accepted in the United States. Adjusted net income and adjusted diluted EPS arepresented as supplemental measures of our performance that management believes are useful for evaluating andcomparing our operating activities across reporting periods. Adjusted net income and adjusted diluted EPS should notbe construed as alternatives to net income or diluted EPS as determined in accordance with accounting principlesgenerally accepted in the United States. Not all companies that report EBITDA, adjusted net income and adjusteddiluted EPS information calculate these measures in the same manner as we do and, accordingly, our calculations arenot necessarily comparable to similarly named measures of other companies and may not be appropriate measuresfor performance relative to other companies.
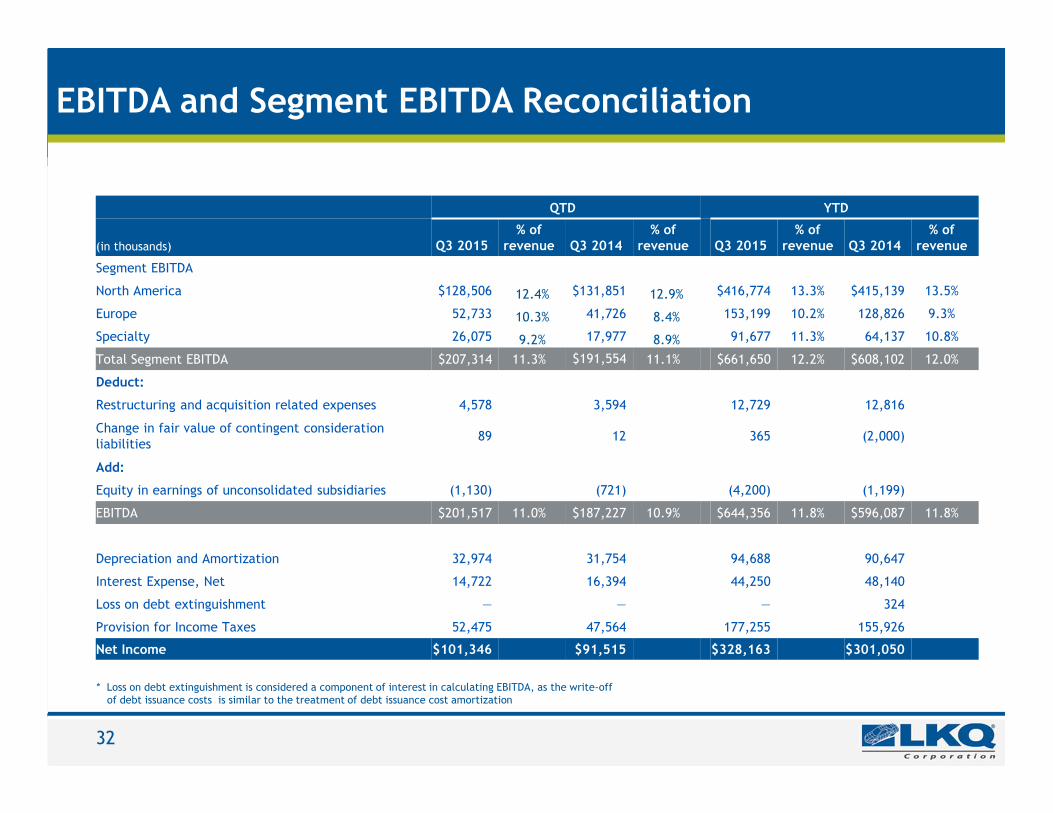
EBITDA and Segment EBITDA Reconciliation
32
* Loss on debt extinguishment is considered a component of interest in calculating EBITDA, as the write-off of debt issuance costs is similar to the treatment of debt issuance cost amortization
QTD YTD
(in thousands) Q3 2015% of
revenue Q3 2014% of
revenue Q3 2015% of
revenue Q3 2014% of
revenue
Segment EBITDA
North America $128,506 12.4% $131,851 12.9% $416,774 13.3% $415,139 13.5%
Europe 52,733 10.3% 41,726 8.4% 153,199 10.2% 128,826 9.3%
Specialty 26,075 9.2% 17,977 8.9% 91,677 11.3% 64,137 10.8%
Total Segment EBITDA $207,314 11.3% $191,554 11.1% $661,650 12.2% $608,102 12.0%
Deduct:
Restructuring and acquisition related expenses 4,578 3,594 12,729 12,816
Change in fair value of contingent consideration liabilities
89 12 365 (2,000)
Add:
Equity in earnings of unconsolidated subsidiaries (1,130) (721) (4,200) (1,199)
EBITDA $201,517 11.0% $187,227 10.9% $644,356 11.8% $596,087 11.8%
Depreciation and Amortization 32,974 31,754 94,688 90,647
Interest Expense, Net 14,722 16,394 44,250 48,140
Loss on debt extinguishment — — — 324
Provision for Income Taxes 52,475 47,564 177,255 155,926
Net Income $101,346 $91,515 $328,163 $301,050
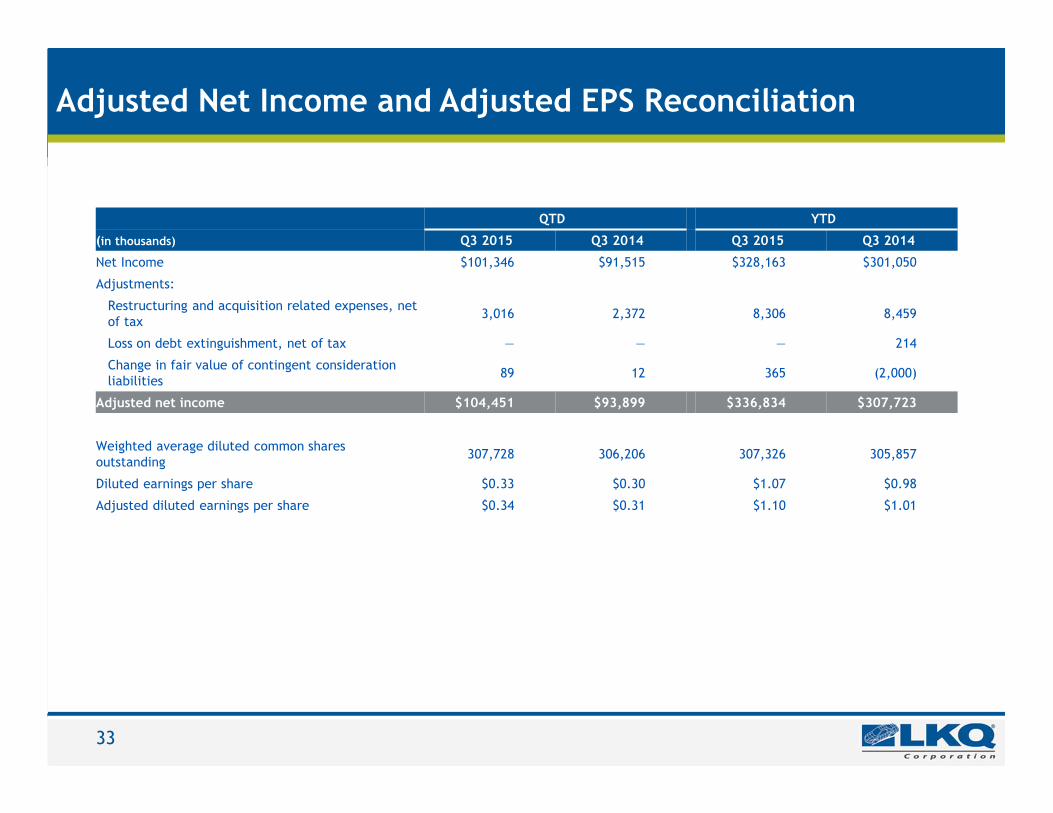
Adjusted Net Income and Adjusted EPS Reconciliation
33
QTD YTD
(in thousands) Q3 2015 Q3 2014 Q3 2015 Q3 2014
Net Income $101,346 $91,515 $328,163 $301,050
Adjustments:
Restructuring and acquisition related expenses, net of tax
3,016 2,372 8,306 8,459
Loss on debt extinguishment, net of tax — — — 214
Change in fair value of contingent consideration liabilities
89 12 365 (2,000)
Adjusted net income $104,451 $93,899 $336,834 $307,723
Weighted average diluted common shares outstanding
307,728 306,206 307,326 305,857
Diluted earnings per share $0.33 $0.30 $1.07 $0.98
Adjusted diluted earnings per share $0.34 $0.31 $1.10 $1.01
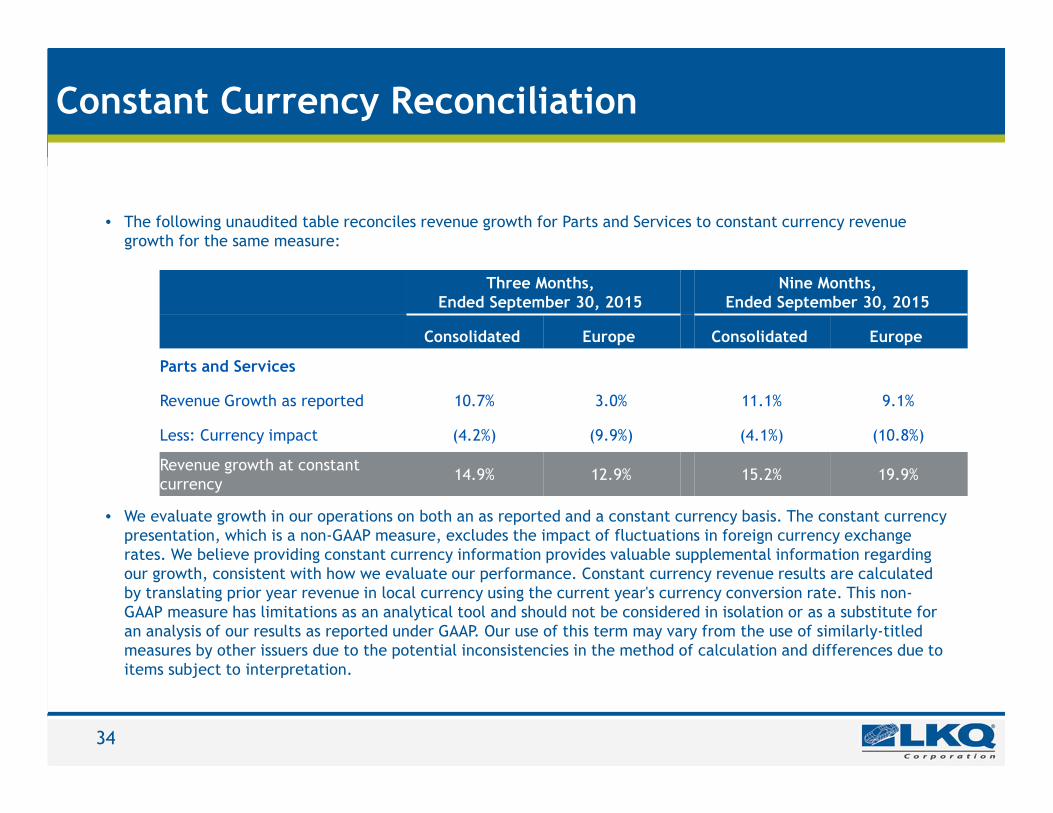
Constant Currency Reconciliation
• The following unaudited table reconciles revenue growth for Parts and Services to constant currency revenue growth for the same measure:
34
• We evaluate growth in our operations on both an as reported and a constant currency basis. The constant currency presentation, which is a non-GAAP measure, excludes the impact of fluctuations in foreign currency exchange rates. We believe providing constant currency information provides valuable supplemental information regarding our growth, consistent with how we evaluate our performance. Constant currency revenue results are calculated by translating prior year revenue in local currency using the current year's currency conversion rate. This non-GAAP measure has limitations as an analytical tool and should not be considered in isolation or as a substitute for an analysis of our results as reported under GAAP. Our use of this term may vary from the use of similarly-titled measures by other issuers due to the potential inconsistencies in the method of calculation and differences due to items subject to interpretation.
Three Months, Ended September 30, 2015
Nine Months, Ended September 30, 2015
Consolidated Europe Consolidated Europe
Parts and Services
Revenue Growth as reported 10.7% 3.0% 11.1% 9.1%
Less: Currency impact (4.2%) (9.9%) (4.1%) (10.8%)
Revenue growth at constant currency
14.9% 12.9% 15.2% 19.9%