third quarter 2014 quarterly supplement€¦ · 2 third quarter 2014 quarterly supplement apache...
TRANSCRIPT
Third Quarter 2014 QUARTERLY SUPPLEMENT
TABLE OF CONTENTS Operational Overview ........................................................................................................................................................... 2
NORTH AMERICA .............................................................................................................................................................. 6
Permian ........................................................................................................................................................................ 6
Central ........................................................................................................................................................................ 10
Gulf Coast ................................................................................................................................................................... 12
Canada ........................................................................................................................................................................ 14
Gulf of Mexico ............................................................................................................................................................ 15
INTERNATIONAL ............................................................................................................................................................. 16
Australia ...................................................................................................................................................................... 16
Egypt ........................................................................................................................................................................... 18
North Sea .................................................................................................................................................................... 21
Supplementary Financial Data ............................................................................................................................................ 22
Debt Bridge ................................................................................................................................................................. 22
Oil and Gas Capital Investment .................................................................................................................................. 23
1
THIRD QUARTER 2014
QUARTERLY SUPPLEMENT
NOTICE TO INVESTORS This earnings release operations supplement contains certain "forward-looking statements" within the meaning of Section 27A of
the Securities Act of 1933, as amended, and Section 21E of the Securities Exchange Act of 1934, as amended and, whenever
possible, are identified by use of the words such as “anticipates,” “intends,” “plans,” “seeks,” “believes,” “estimates,” “expects” and
similar references to future periods. Any matters that are not historical facts are forward-looking and, accordingly, involve
estimates, assumptions, risks and uncertainties, including, without limitation, our assumptions and estimates about the market
prices of oil, natural gas, NGLs and other products or services, our commodity hedging arrangements, the supply and demand for oil,
natural gas, NGLs and other products or services, production and reserve levels, drilling risks, the number of wells drilled, economic
and competitive conditions, the availability of capital resources, capital expenditure and other contractual obligations, and our
ability to complete, test and produce the wells identified in this supplement. Because such statements involve risks and
uncertainties, Apache’s actual results and performance may differ materially from the results expressed or implied by the forward-
looking statements contained in this supplement. Other important factors that could cause actual results to differ materially from
expected results are described in “Risk Factors” in our most recently filed Annual Report on Form 10-K, recent Quarterly Reports on
Form 10-Q and amendments thereto, available on our Web site and in our other public filings and press releases. There is no
assurance that Apache's expectations will be realized, and readers are cautioned not to place undue reliance on forward looking
statements, which speak only as of the date hereof. Unless otherwise required by law, we assume no duty to update these
statements as of any future date.
Cautionary Note to Investors: The United States Securities and Exchange Commission ("SEC") permits oil and gas companies, in their
filings with the SEC, to disclose only proved, probable, and possible reserves that meet the SEC's definitions for such terms. Apache
may use certain terms in this earnings release operations supplement, such as “resources,” “potential resources,” “resource
potential,” “reserves potential,” and other similar terms that the SEC guidelines strictly prohibit Apache from including in filings with
the SEC. Such terms do not take into account the certainty of resource recovery, which is contingent on exploration success,
technical improvements in drilling access, commerciality and other factors, and are therefore not indicative of expected future
resource recovery and should not be relied upon. Investors are urged to consider carefully the disclosure in Apache’s Annual Report
on Form 10-K for the fiscal year ended December 31, 2013, available from Apache at www.apachecorp.com or by writing Apache at:
2000 Post Oak Blvd., Suite 100, Houston, Texas 77056 (Attn: Corporate Secretary). You can also obtain this report from the SEC by
calling 1-800-SEC-0330 or from the SEC's website at www.sec.gov.
Certain information may be provided in this supplement that includes financial measurements that are not required by, or presented
in accordance with, generally accepted accounting principles (GAAP), including these measures: adjusted earnings, pre-tax margin,
and cash from operations. These non-GAAP measures should not be considered as alternatives to GAAP measures, such as net
income or cash from operating activities, and may be calculated differently from, and therefore may not be comparable to, similarly
titled measures used at other companies. Reconciliation to the most directly comparable GAAP financial measure has been provided
on our website at www.apachecorp.com/financialdata.
None of the information contained in this document has been audited by any independent auditor. This supplemental document is
prepared as a convenience for securities analysts and investors and may be useful as a reference tool. Apache intends to continue
to publish this supplement in conjunction with our quarterly earnings release, but may elect to modify the format or discontinue
publication at any time, without notice to securities analysts or investors.
2
THIRD QUARTER 2014
QUARTERLY SUPPLEMENT
APACHE WORLDWIDE OPERATIONS
GLOBAL KEY STATS Third-Quarter 2014
3Q Production: 636,802 Boe/d (60% Liquids)
3Q Wells: 382 gross, 285 net
3Q Rigs: Avg 126 rigs
NORTH AMERICAN ONSHORE KEY STATS
Third-Quarter 2014 3Q Production: 354,862 Boe/d (60% Liquids)
3Q Wells: 309 gross, 224 net
3Q Rigs: Avg 91 rigs
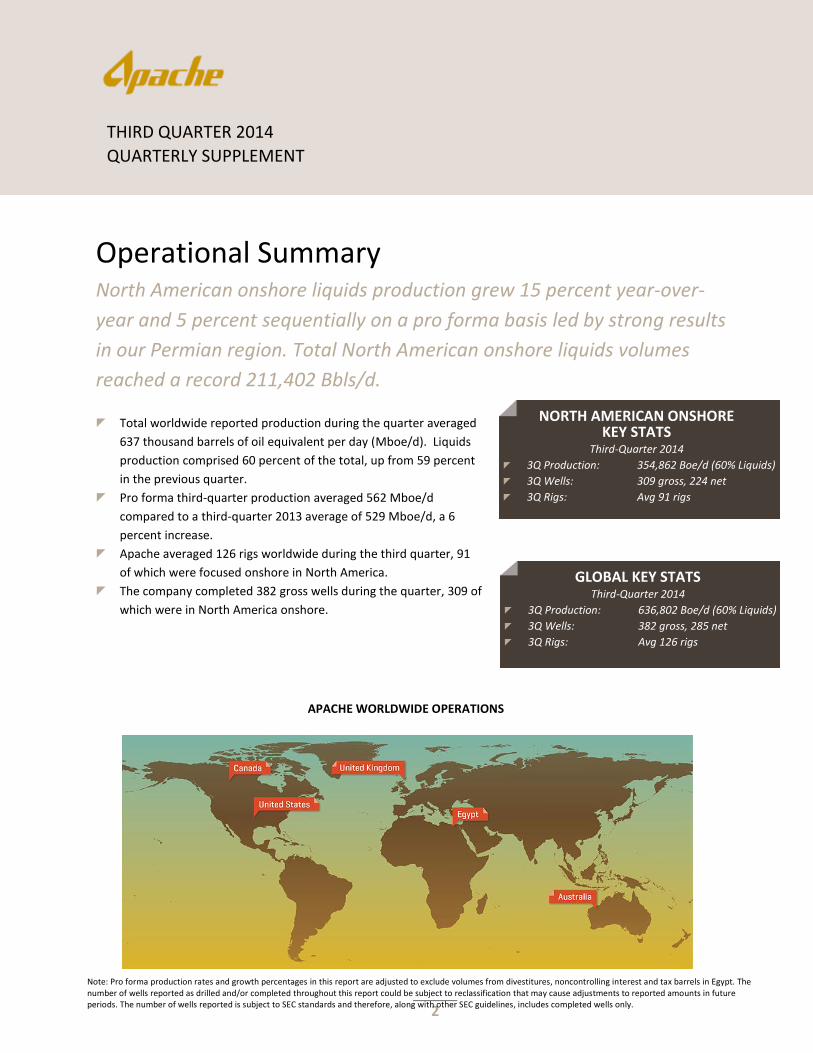
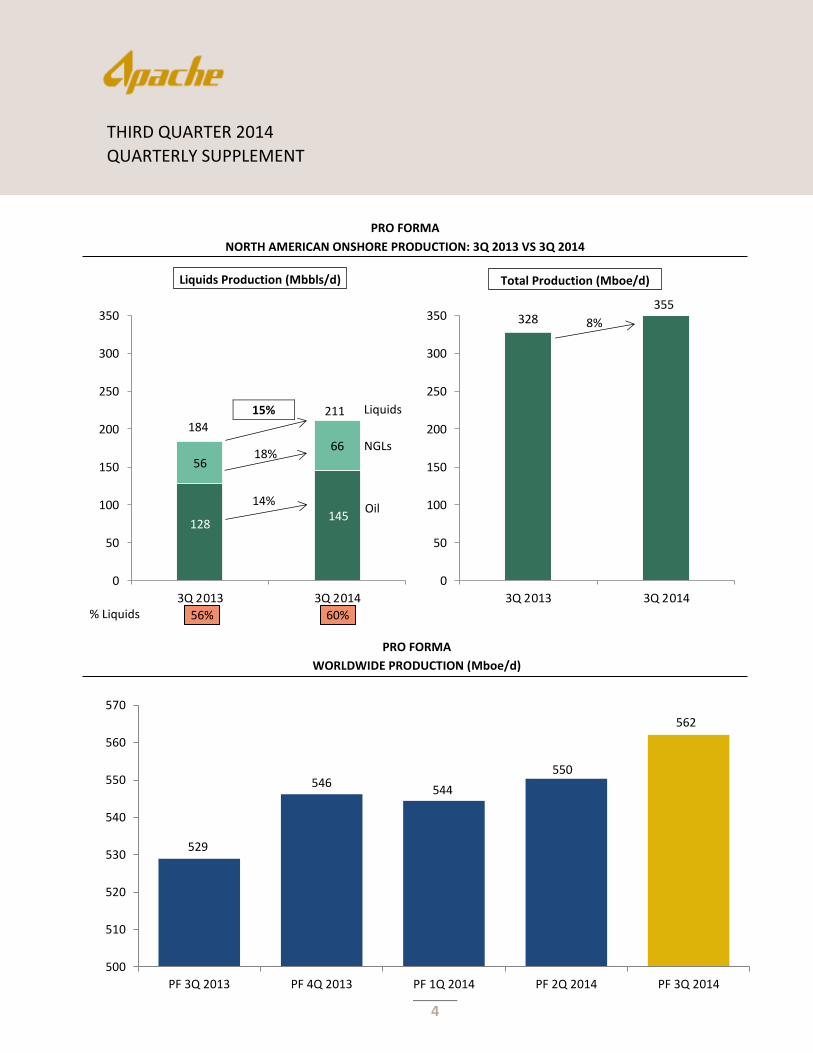
Operational Summary North American onshore liquids production grew 15 percent year-over-
year and 5 percent sequentially on a pro forma basis led by strong results
in our Permian region. Total North American onshore liquids volumes
reached a record 211,402 Bbls/d.
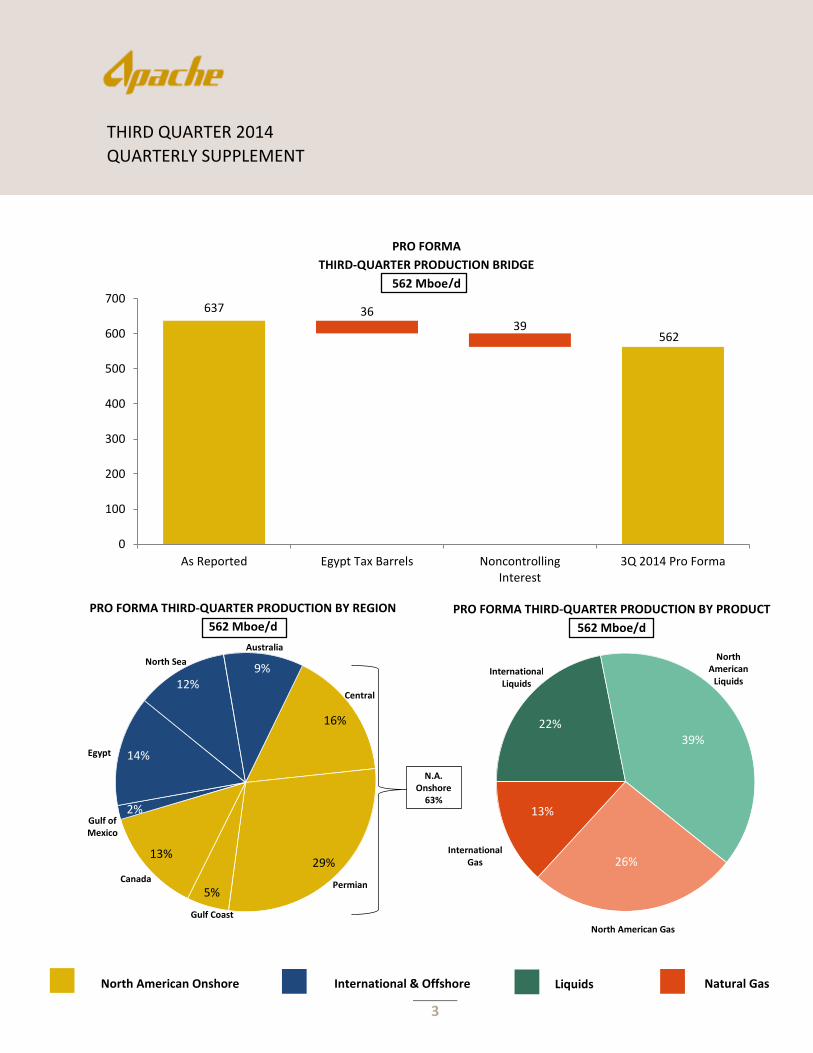
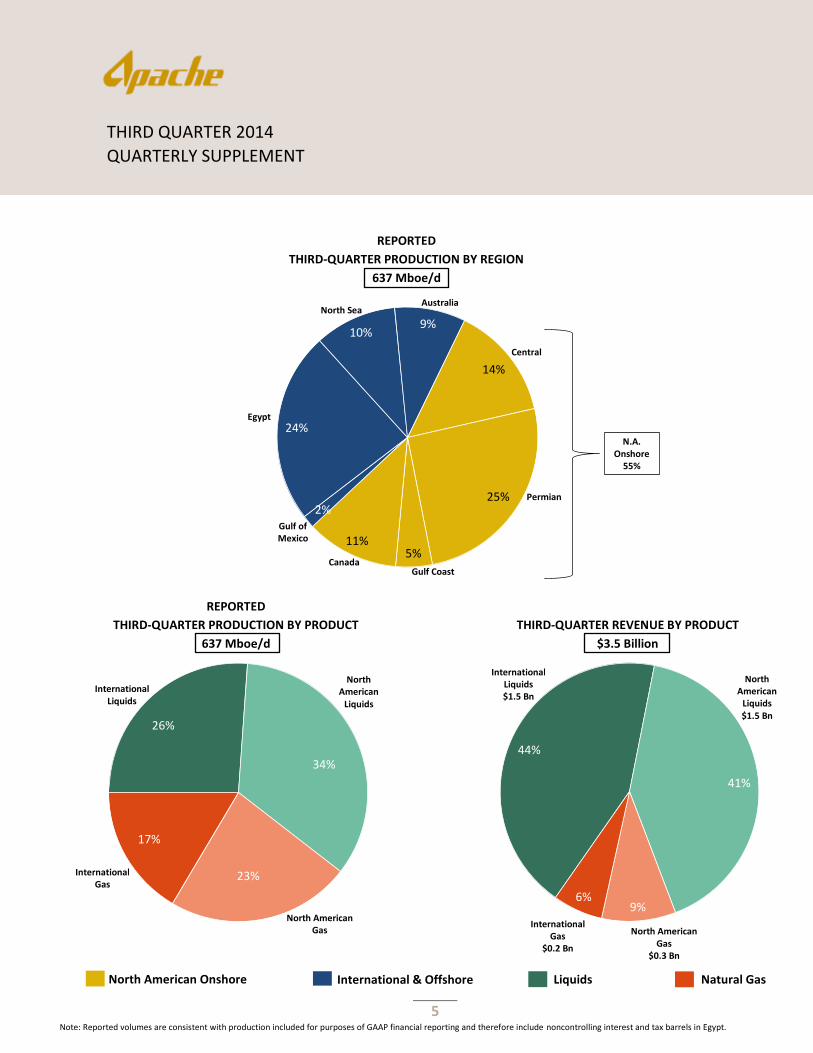
Total worldwide reported production during the quarter averaged
637 thousand barrels of oil equivalent per day (Mboe/d). Liquids
production comprised 60 percent of the total, up from 59 percent
in the previous quarter.
Pro forma third-quarter production averaged 562 Mboe/d
compared to a third-quarter 2013 average of 529 Mboe/d, a 6
percent increase.
Apache averaged 126 rigs worldwide during the third quarter, 91
of which were focused onshore in North America.
The company completed 382 gross wells during the quarter, 309 of
which were in North America onshore.
Note: Pro forma production rates and growth percentages in this report are adjusted to exclude volumes from divestitures, noncontrolling interest and tax barrels in Egypt. The number of wells reported as drilled and/or completed throughout this report could be subject to reclassification that may cause adjustments to reported amounts in future periods. The number of wells reported is subject to SEC standards and therefore, along with other SEC guidelines, includes completed wells only.
3
THIRD QUARTER 2014
QUARTERLY SUPPLEMENT
637 36 39
562
0
100
200
300
400
500
600
700
As Reported Egypt Tax Barrels NoncontrollingInterest
3Q 2014 Pro Forma
PRO FORMA THIRD-QUARTER PRODUCTION BY REGION
562 Mboe/d
583 Mboe/d
North American Gas
International Gas
Australia
Canada Permian
Central
Gulf of Mexico
Gulf Coast
North Sea
Egypt
N.A. Onshore
63%
North American Onshore International & Offshore Liquids Natural Gas
PRO FORMA THIRD-QUARTER PRODUCTION BY PRODUCT
562 Mboe/d
International
Liquids
North American
Liquids
16%
29%
5%
13%
2%
14%
12%9%
PRO FORMA
THIRD-QUARTER PRODUCTION BRIDGE
562 Mboe/d
583 Mboe/d
22%39%
26%
13%
4
THIRD QUARTER 2014
QUARTERLY SUPPLEMENT
328355
0
50
100
150
200
250
300
350
3Q 2013 3Q 2014
128145
56
66
0
50
100
150
200
250
300
350
3Q 2013 3Q 2014
PRO FORMA
NORTH AMERICAN ONSHORE PRODUCTION: 3Q 2013 VS 3Q 2014
PRO FORMA
WORLDWIDE PRODUCTION (Mboe/d)
184 211
Oil
Liquids
NGLs
56% % Liquids
14%
18%
8%
15%
Total Production (Mboe/d)
60%
Liquids Production (Mbbls/d)
529
546 544
550
562
500
510
520
530
540
550
560
570
PF 3Q 2013 PF 4Q 2013 PF 1Q 2014 PF 2Q 2014 PF 3Q 2014
5
THIRD QUARTER 2014
QUARTERLY SUPPLEMENT
REPORTED
THIRD-QUARTER PRODUCTION BY REGION
637 Mboe/d
North American Onshore International & Offshore Liquids Natural Gas
Australia
Canada
Permian
Central
Gulf of Mexico
Gulf Coast
North Sea
Egypt
REPORTED
THIRD-QUARTER PRODUCTION BY PRODUCT
637 Mboe/d
THIRD-QUARTER REVENUE BY PRODUCT
$3.5 Billion
International Liquids
North American
Liquids
North American Gas
International Gas
International Liquids $1.5 Bn
North American
Liquids $1.5 Bn
North American Gas
$0.3 Bn
International Gas
$0.2 Bn
N.A. Onshore
55%
Note: Reported volumes are consistent with production included for purposes of GAAP financial reporting and therefore include noncontrolling interest and tax barrels in Egypt.
14%
25%
5%11%
2%
24%
10%9%
26%
34%
23%
17%
44%
41%
9%6%
6
THIRD QUARTER 2014
QUARTERLY SUPPLEMENT
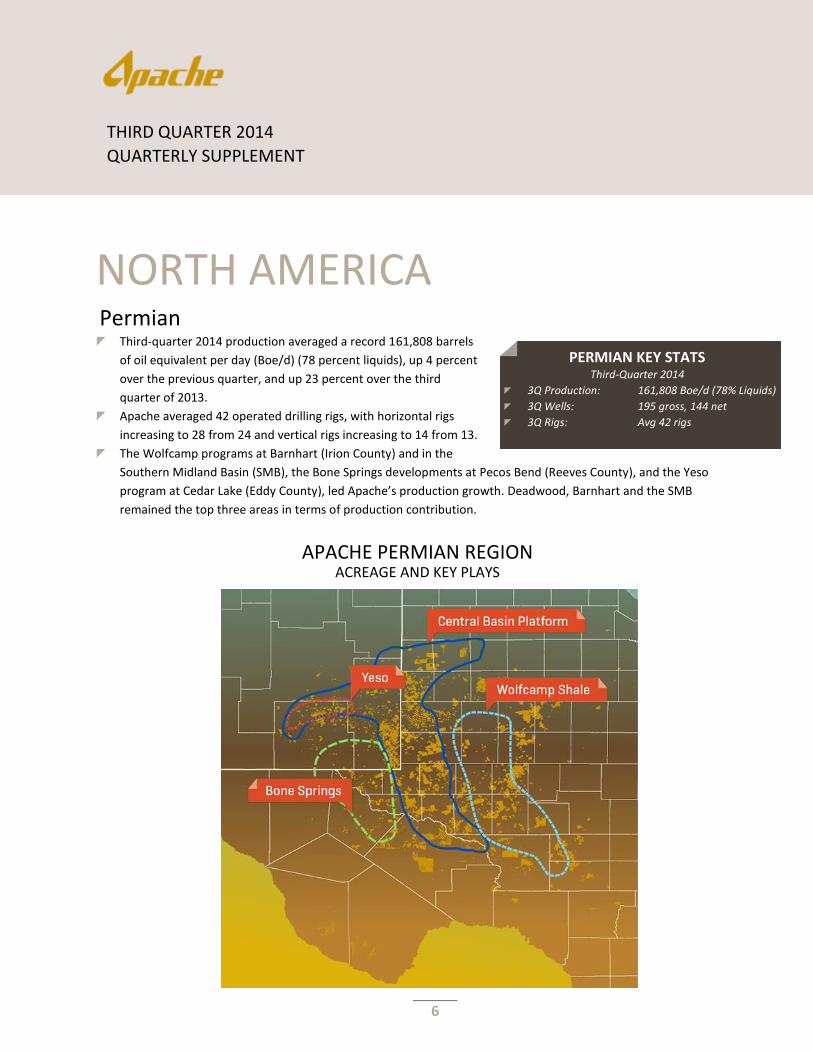
PERMIAN KEY STATS Third-Quarter 2014
3Q Production: 161,808 Boe/d (78% Liquids)
3Q Wells: 195 gross, 144 net
3Q Rigs: Avg 42 rigs
NORTH AMERICA Permian Third-quarter 2014 production averaged a record 161,808 barrels
of oil equivalent per day (Boe/d) (78 percent liquids), up 4 percent
over the previous quarter, and up 23 percent over the third
quarter of 2013.
Apache averaged 42 operated drilling rigs, with horizontal rigs
increasing to 28 from 24 and vertical rigs increasing to 14 from 13.
The Wolfcamp programs at Barnhart (Irion County) and in the
Southern Midland Basin (SMB), the Bone Springs developments at Pecos Bend (Reeves County), and the Yeso
program at Cedar Lake (Eddy County), led Apache’s production growth. Deadwood, Barnhart and the SMB
remained the top three areas in terms of production contribution.
APACHE PERMIAN REGION ACREAGE AND KEY PLAYS
7
THIRD QUARTER 2014
QUARTERLY SUPPLEMENT
Permian (Continued)
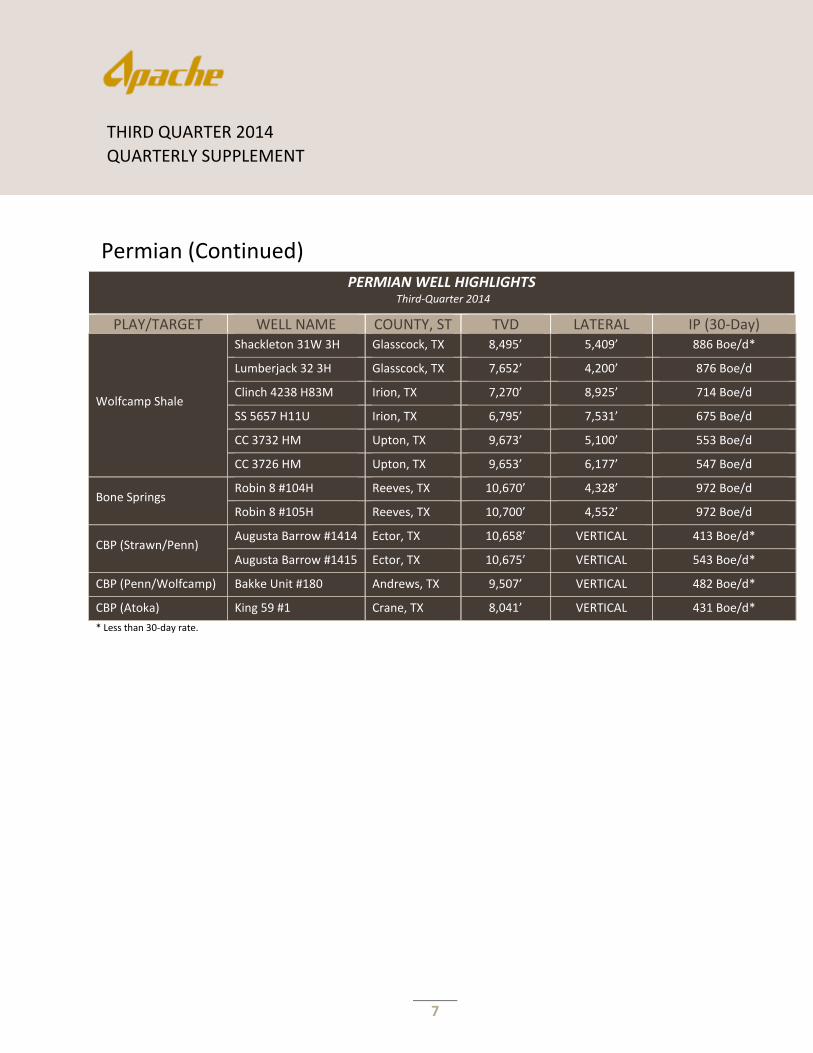
* Less than 30-day rate.
PERMIAN WELL HIGHLIGHTS
Third-Quarter 2014
PLAY/TARGET WELL NAME COUNTY, ST TVD LATERAL IP (30-Day)
Wolfcamp Shale
Shackleton 31W 3H Glasscock, TX 8,495’ 5,409’ 886 Boe/d*
Lumberjack 32 3H Glasscock, TX 7,652’ 4,200’ 876 Boe/d
Clinch 4238 H83M Irion, TX 7,270’ 8,925’ 714 Boe/d
SS 5657 H11U Irion, TX 6,795’ 7,531’ 675 Boe/d
CC 3732 HM Upton, TX 9,673’ 5,100’ 553 Boe/d
CC 3726 HM Upton, TX 9,653’ 6,177’ 547 Boe/d
Bone Springs Robin 8 #104H Reeves, TX 10,670’ 4,328’ 972 Boe/d
Robin 8 #105H Reeves, TX 10,700’ 4,552’ 972 Boe/d
CBP (Strawn/Penn) Augusta Barrow #1414 Ector, TX 10,658’ VERTICAL 413 Boe/d*
Augusta Barrow #1415 Ector, TX 10,675’ VERTICAL 543 Boe/d*
CBP (Penn/Wolfcamp) Bakke Unit #180 Andrews, TX 9,507’ VERTICAL 482 Boe/d*
CBP (Atoka) King 59 #1 Crane, TX 8,041’ VERTICAL 431 Boe/d*
8
THIRD QUARTER 2014
QUARTERLY SUPPLEMENT
Permian (Continued)
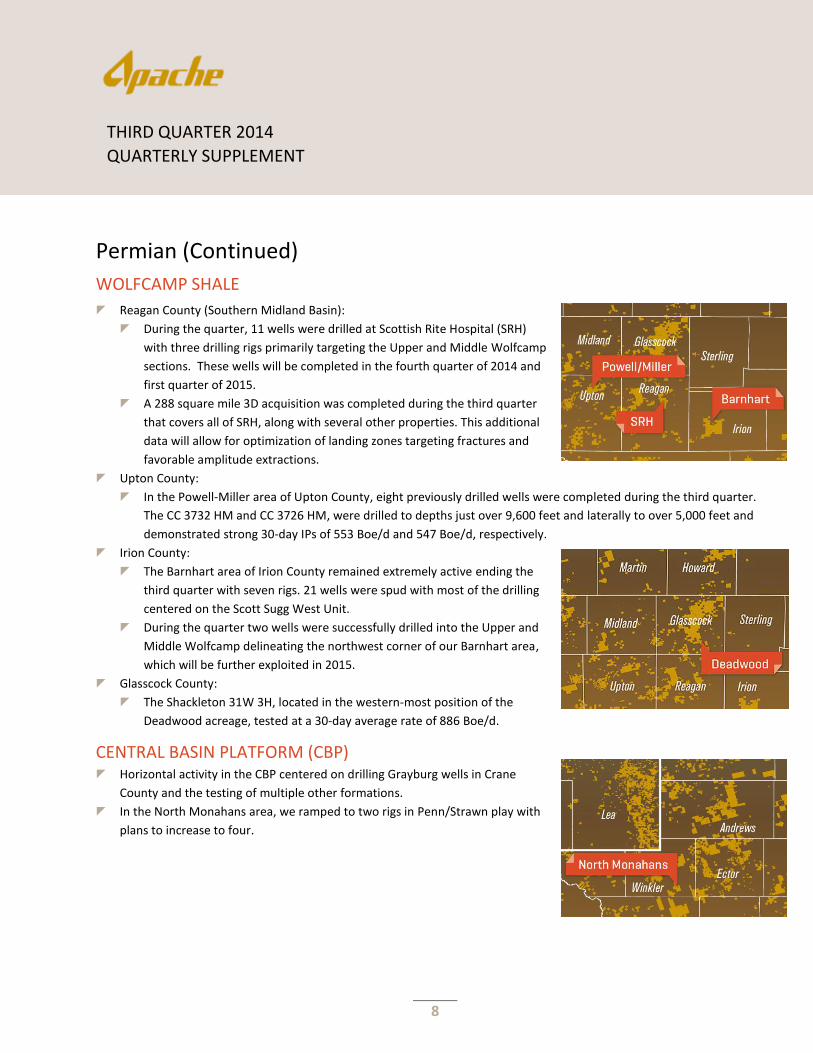
WOLFCAMP SHALE
Reagan County (Southern Midland Basin):
During the quarter, 11 wells were drilled at Scottish Rite Hospital (SRH)
with three drilling rigs primarily targeting the Upper and Middle Wolfcamp
sections. These wells will be completed in the fourth quarter of 2014 and
first quarter of 2015.
A 288 square mile 3D acquisition was completed during the third quarter
that covers all of SRH, along with several other properties. This additional
data will allow for optimization of landing zones targeting fractures and
favorable amplitude extractions.
Upton County:
In the Powell-Miller area of Upton County, eight previously drilled wells were completed during the third quarter.
The CC 3732 HM and CC 3726 HM, were drilled to depths just over 9,600 feet and laterally to over 5,000 feet and
demonstrated strong 30-day IPs of 553 Boe/d and 547 Boe/d, respectively.
Irion County:
The Barnhart area of Irion County remained extremely active ending the
third quarter with seven rigs. 21 wells were spud with most of the drilling
centered on the Scott Sugg West Unit.
During the quarter two wells were successfully drilled into the Upper and
Middle Wolfcamp delineating the northwest corner of our Barnhart area,
which will be further exploited in 2015.
Glasscock County:
The Shackleton 31W 3H, located in the western-most position of the
Deadwood acreage, tested at a 30-day average rate of 886 Boe/d.
CENTRAL BASIN PLATFORM (CBP) Horizontal activity in the CBP centered on drilling Grayburg wells in Crane
County and the testing of multiple other formations.
In the North Monahans area, we ramped to two rigs in Penn/Strawn play with
plans to increase to four.
9
THIRD QUARTER 2014
QUARTERLY SUPPLEMENT
Permian (Continued)
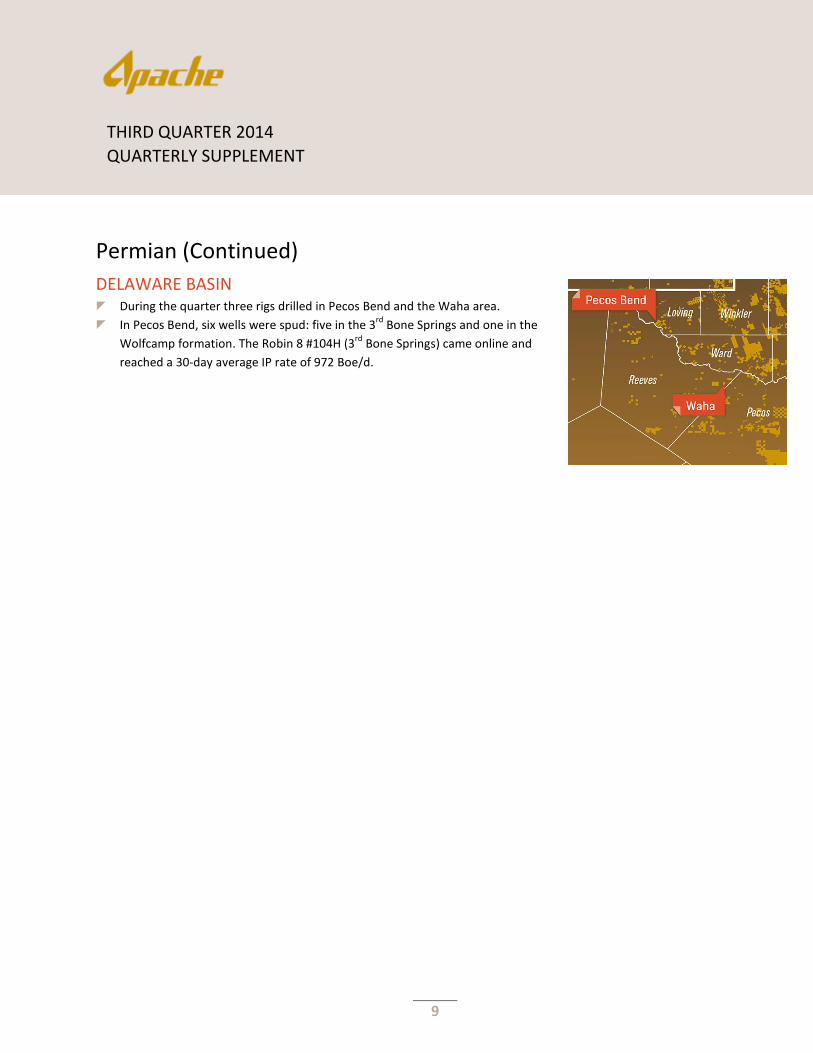
DELAWARE BASIN During the quarter three rigs drilled in Pecos Bend and the Waha area.
In Pecos Bend, six wells were spud: five in the 3rd
Bone Springs and one in the
Wolfcamp formation. The Robin 8 #104H (3rd
Bone Springs) came online and
reached a 30-day average IP rate of 972 Boe/d.
10
THIRD QUARTER 2014
QUARTERLY SUPPLEMENT
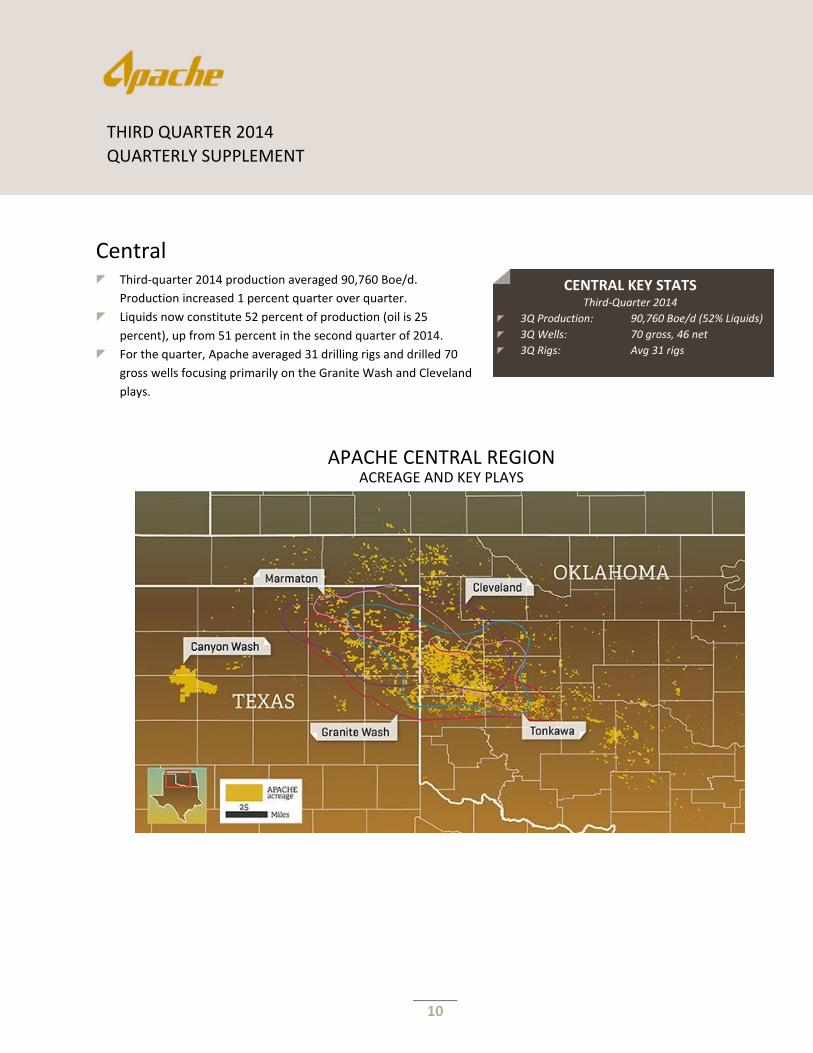
CENTRAL KEY STATS Third-Quarter 2014
3Q Production: 90,760 Boe/d (52% Liquids)
3Q Wells: 70 gross, 46 net
3Q Rigs: Avg 31 rigs
Central Third-quarter 2014 production averaged 90,760 Boe/d.
Production increased 1 percent quarter over quarter.
Liquids now constitute 52 percent of production (oil is 25
percent), up from 51 percent in the second quarter of 2014.
For the quarter, Apache averaged 31 drilling rigs and drilled 70
gross wells focusing primarily on the Granite Wash and Cleveland
plays.
APACHE CENTRAL REGION ACREAGE AND KEY PLAYS
11
THIRD QUARTER 2014
QUARTERLY SUPPLEMENT
Central (Continued)
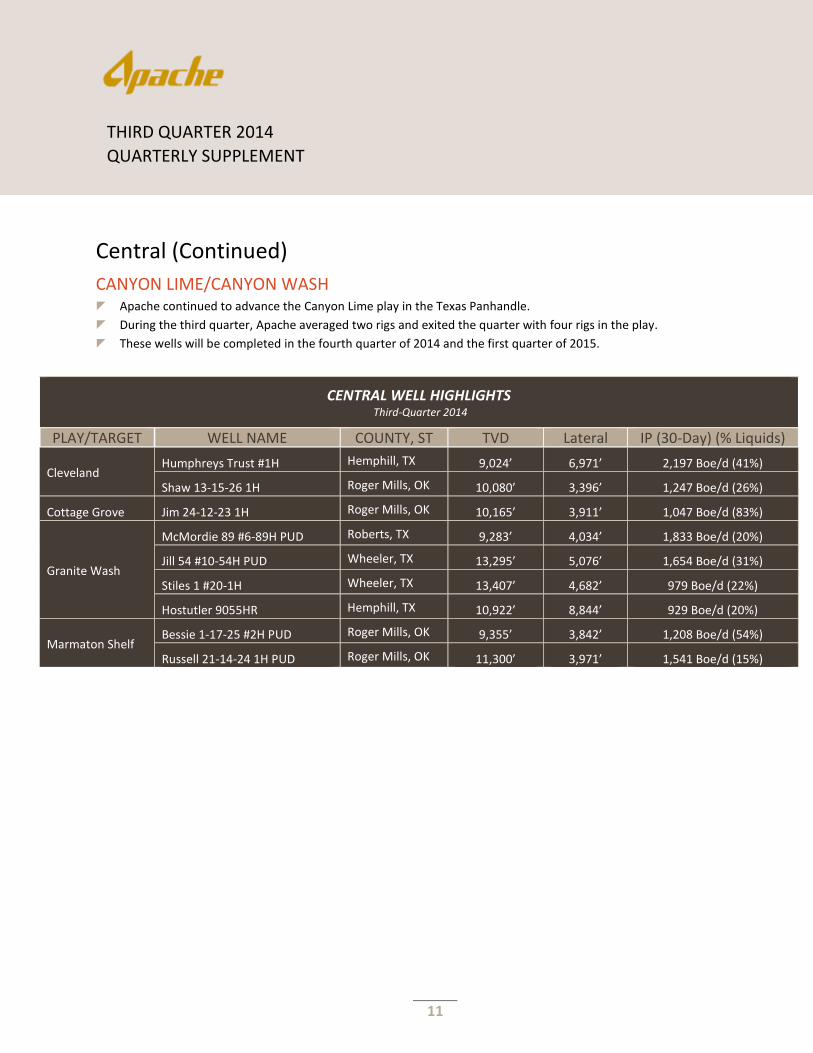
CANYON LIME/CANYON WASH Apache continued to advance the Canyon Lime play in the Texas Panhandle.
During the third quarter, Apache averaged two rigs and exited the quarter with four rigs in the play.
These wells will be completed in the fourth quarter of 2014 and the first quarter of 2015.
CENTRAL WELL HIGHLIGHTS
Third-Quarter 2014
PLAY/TARGET WELL NAME COUNTY, ST TVD Lateral IP (30-Day) (% Liquids)
Cleveland Humphreys Trust #1H Hemphill, TX 9,024’ 6,971’ 2,197 Boe/d (41%)
Shaw 13-15-26 1H Roger Mills, OK 10,080’ 3,396’ 1,247 Boe/d (26%)
Cottage Grove Jim 24-12-23 1H Roger Mills, OK 10,165’ 3,911’ 1,047 Boe/d (83%)
Granite Wash
McMordie 89 #6-89H PUD Roberts, TX 9,283’ 4,034’ 1,833 Boe/d (20%)
Jill 54 #10-54H PUD Wheeler, TX 13,295’ 5,076’ 1,654 Boe/d (31%)
Stiles 1 #20-1H Wheeler, TX 13,407’ 4,682’ 979 Boe/d (22%)
Hostutler 9055HR Hemphill, TX 10,922’ 8,844’ 929 Boe/d (20%)
Marmaton Shelf Bessie 1-17-25 #2H PUD Roger Mills, OK 9,355’ 3,842’ 1,208 Boe/d (54%)
Russell 21-14-24 1H PUD Roger Mills, OK 11,300’ 3,971’ 1,541 Boe/d (15%)
12
THIRD QUARTER 2014
QUARTERLY SUPPLEMENT
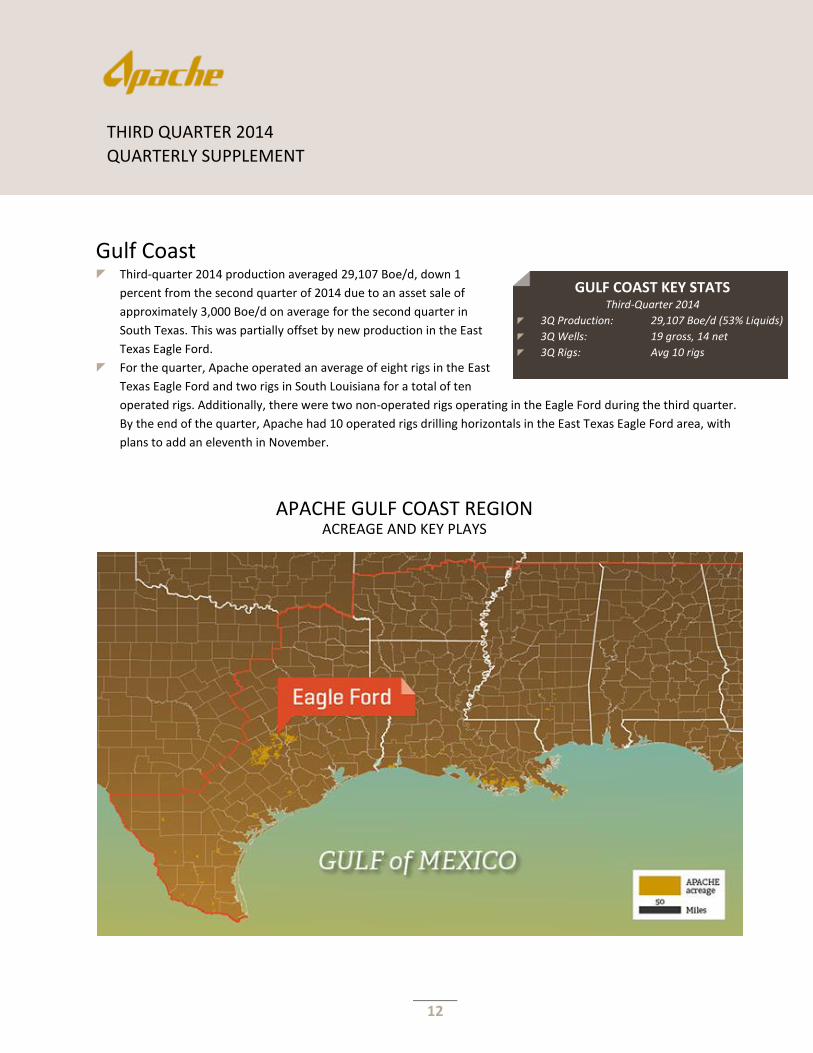
GULF COAST KEY STATS Third-Quarter 2014
3Q Production: 29,107 Boe/d (53% Liquids)
3Q Wells: 19 gross, 14 net
3Q Rigs: Avg 10 rigs
Gulf Coast Third-quarter 2014 production averaged 29,107 Boe/d, down 1
percent from the second quarter of 2014 due to an asset sale of
approximately 3,000 Boe/d on average for the second quarter in
South Texas. This was partially offset by new production in the East
Texas Eagle Ford.
For the quarter, Apache operated an average of eight rigs in the East
Texas Eagle Ford and two rigs in South Louisiana for a total of ten
operated rigs. Additionally, there were two non-operated rigs operating in the Eagle Ford during the third quarter.
By the end of the quarter, Apache had 10 operated rigs drilling horizontals in the East Texas Eagle Ford area, with
plans to add an eleventh in November.
APACHE GULF COAST REGION ACREAGE AND KEY PLAYS
13
THIRD QUARTER 2014
QUARTERLY SUPPLEMENT
Gulf Coast (Continued)
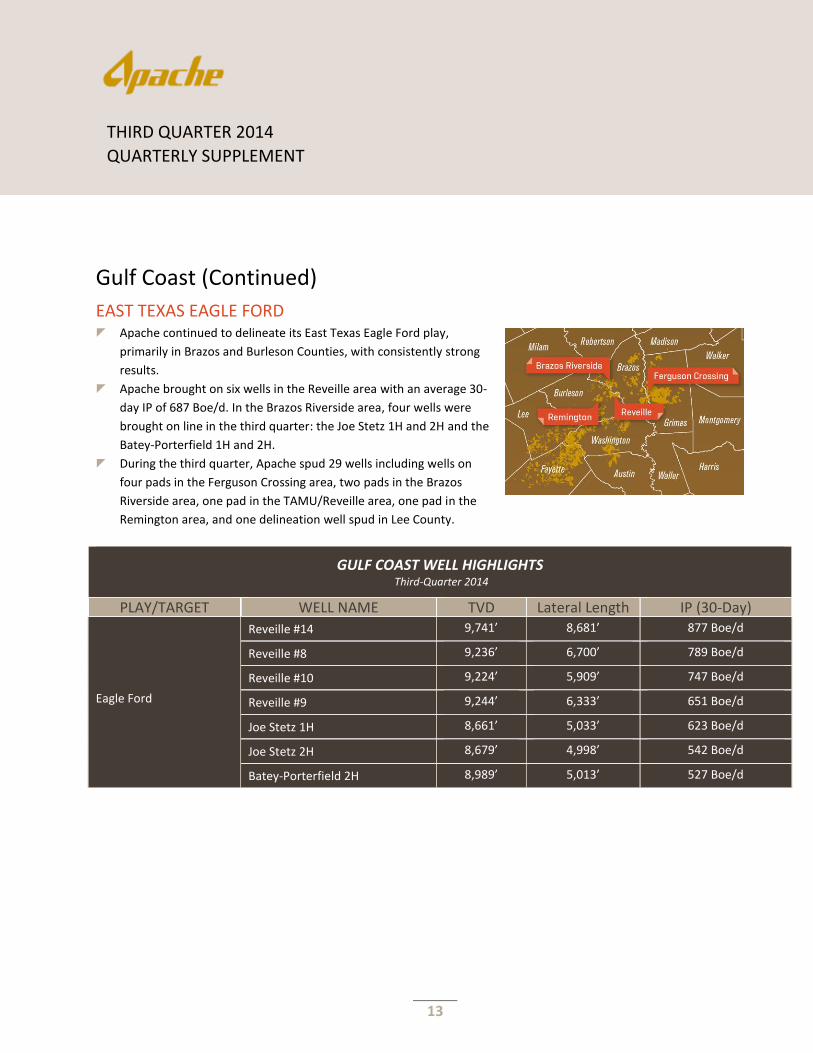
EAST TEXAS EAGLE FORD Apache continued to delineate its East Texas Eagle Ford play,
primarily in Brazos and Burleson Counties, with consistently strong
results.
Apache brought on six wells in the Reveille area with an average 30-
day IP of 687 Boe/d. In the Brazos Riverside area, four wells were
brought on line in the third quarter: the Joe Stetz 1H and 2H and the
Batey-Porterfield 1H and 2H.
During the third quarter, Apache spud 29 wells including wells on
four pads in the Ferguson Crossing area, two pads in the Brazos
Riverside area, one pad in the TAMU/Reveille area, one pad in the
Remington area, and one delineation well spud in Lee County.
GULF COAST WELL HIGHLIGHTS
Third-Quarter 2014
PLAY/TARGET WELL NAME TVD Lateral Length IP (30-Day)
Eagle Ford
Reveille #14 9,741’ 8,681’ 877 Boe/d
Reveille #8 9,236’ 6,700’ 789 Boe/d
Reveille #10 9,224’ 5,909’ 747 Boe/d
Reveille #9 9,244’ 6,333’ 651 Boe/d
Joe Stetz 1H 8,661’ 5,033’ 623 Boe/d
Joe Stetz 2H 8,679’ 4,998’ 542 Boe/d
Batey-Porterfield 2H 8,989’ 5,013’ 527 Boe/d
14
THIRD QUARTER 2014
QUARTERLY SUPPLEMENT
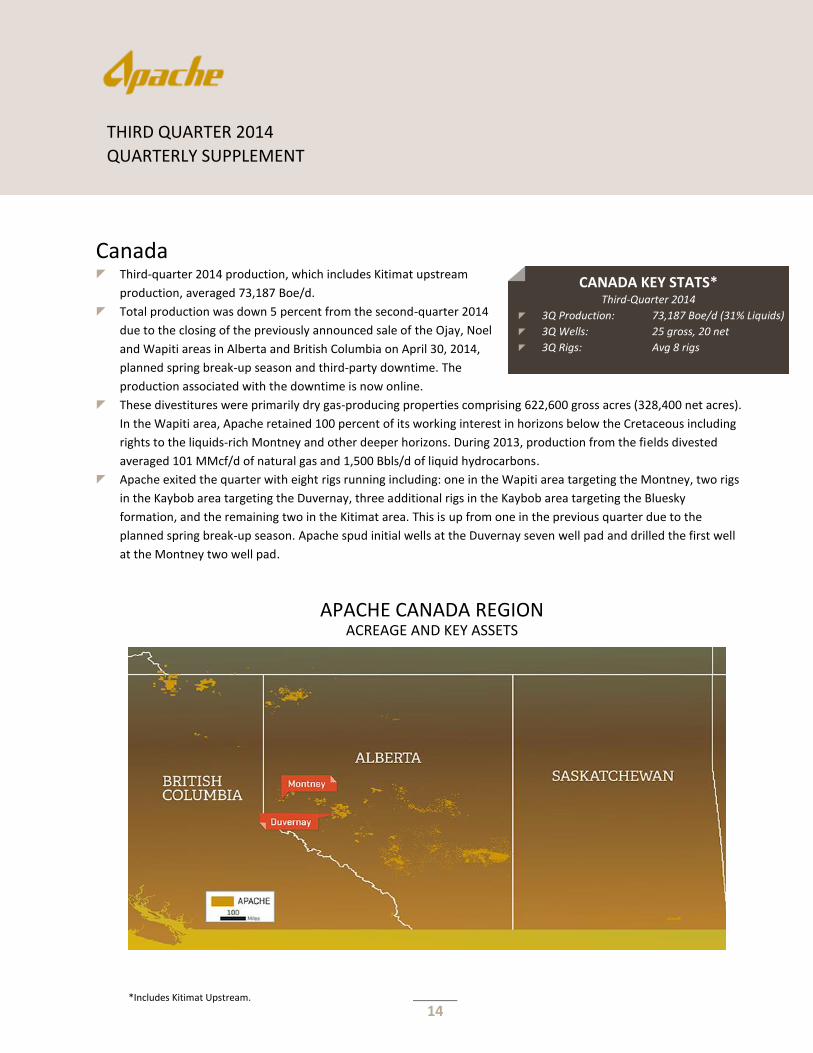
Canada Third-quarter 2014 production, which includes Kitimat upstream
production, averaged 73,187 Boe/d.
Total production was down 5 percent from the second-quarter 2014
due to the closing of the previously announced sale of the Ojay, Noel
and Wapiti areas in Alberta and British Columbia on April 30, 2014,
planned spring break-up season and third-party downtime. The
production associated with the downtime is now online.
These divestitures were primarily dry gas-producing properties comprising 622,600 gross acres (328,400 net acres).
In the Wapiti area, Apache retained 100 percent of its working interest in horizons below the Cretaceous including
rights to the liquids-rich Montney and other deeper horizons. During 2013, production from the fields divested
averaged 101 MMcf/d of natural gas and 1,500 Bbls/d of liquid hydrocarbons.
Apache exited the quarter with eight rigs running including: one in the Wapiti area targeting the Montney, two rigs
in the Kaybob area targeting the Duvernay, three additional rigs in the Kaybob area targeting the Bluesky
formation, and the remaining two in the Kitimat area. This is up from one in the previous quarter due to the
planned spring break-up season. Apache spud initial wells at the Duvernay seven well pad and drilled the first well
at the Montney two well pad.
APACHE CANADA REGION ACREAGE AND KEY ASSETS
*Includes Kitimat Upstream.
CANADA KEY STATS* Third-Quarter 2014
3Q Production: 73,187 Boe/d (31% Liquids)
3Q Wells: 25 gross, 20 net
3Q Rigs: Avg 8 rigs
15
THIRD QUARTER 2014
QUARTERLY SUPPLEMENT
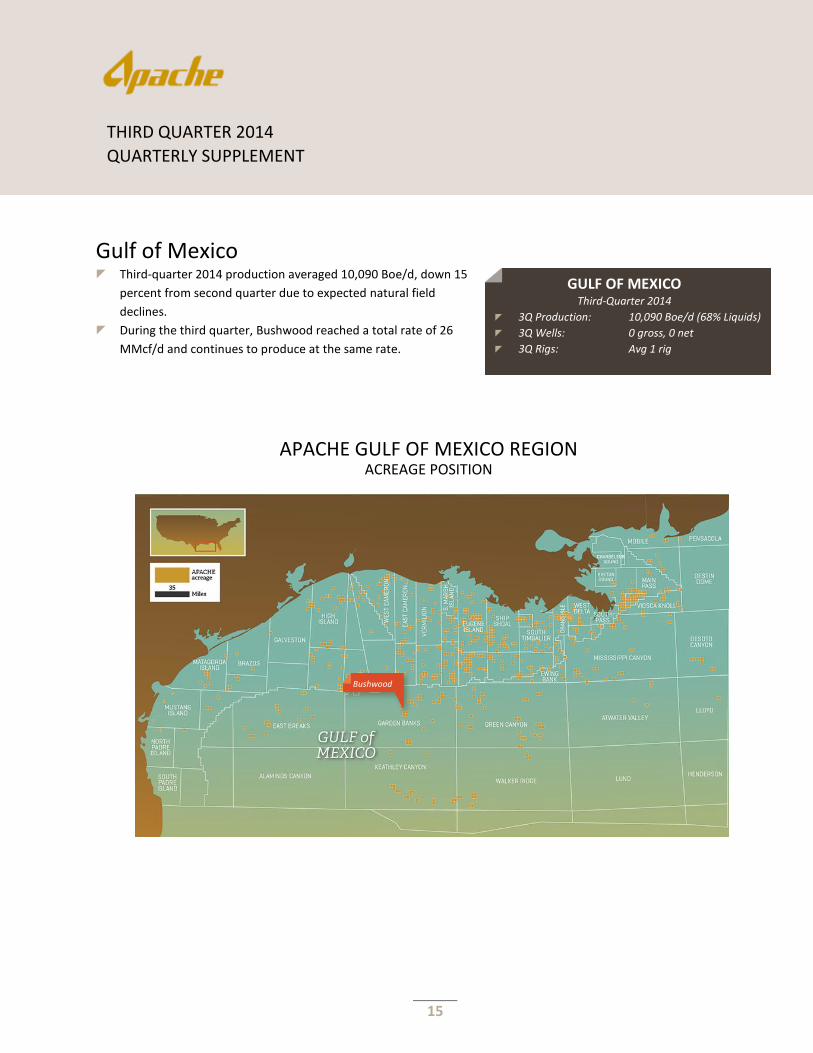
APACHE GULF OF MEXICO REGION ACREAGE POSITION
GULF OF MEXICO Third-Quarter 2014
3Q Production: 10,090 Boe/d (68% Liquids)
3Q Wells: 0 gross, 0 net
3Q Rigs: Avg 1 rig
Gulf of Mexico Third-quarter 2014 production averaged 10,090 Boe/d, down 15
percent from second quarter due to expected natural field
declines.
During the third quarter, Bushwood reached a total rate of 26
MMcf/d and continues to produce at the same rate.
Bushwood
16
THIRD QUARTER 2014
QUARTERLY SUPPLEMENT
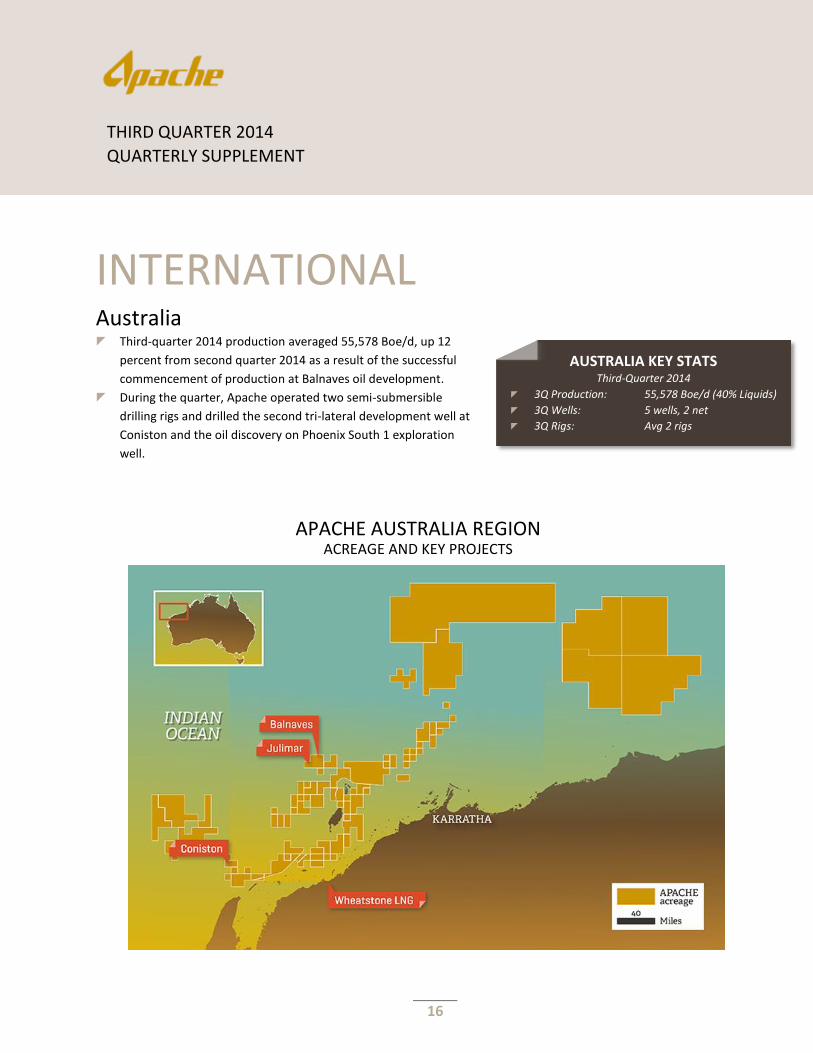
APACHE AUSTRALIA REGION ACREAGE AND KEY PROJECTS
INTERNATIONAL Australia Third-quarter 2014 production averaged 55,578 Boe/d, up 12
percent from second quarter 2014 as a result of the successful
commencement of production at Balnaves oil development.
During the quarter, Apache operated two semi-submersible
drilling rigs and drilled the second tri-lateral development well at
Coniston and the oil discovery on Phoenix South 1 exploration
well.
AUSTRALIA KEY STATS Third-Quarter 2014
3Q Production: 55,578 Boe/d (40% Liquids)
3Q Wells: 5 wells, 2 net
3Q Rigs: Avg 2 rigs
17
THIRD QUARTER 2014
QUARTERLY SUPPLEMENT
AUSTRALIA (CONTINUED)
BALNAVES (65 PERCENT APA) The Armada Claire FPSO completed the final hook-up and commissioning activities and commenced oil production
from the Balnaves field in August 2014.
Current net production at Balnaves is 18,300 Boe/d (as of October 2014).
NINGALOO VISION UPGRADE PROJECT AND CONISTON DEVELOPMENT (52.5 PERCENT APA) Development drilling on the Coniston oil development continued during third quarter with the completion of its
second tri-lateral development well. Apache has now successfully drilled ten of the 17 well laterals.
Scheduled maintenance and upgrade work for Coniston continued during the quarter on the Ningaloo Vision FPSO
in the shipyard dry-dock.
Offshore installation work required for the Coniston development was completed during the third quarter.
Resumption of oil production from the Van Gogh field and first oil from Coniston is expected in the second quarter
2015.
18
THIRD QUARTER 2014
QUARTERLY SUPPLEMENT
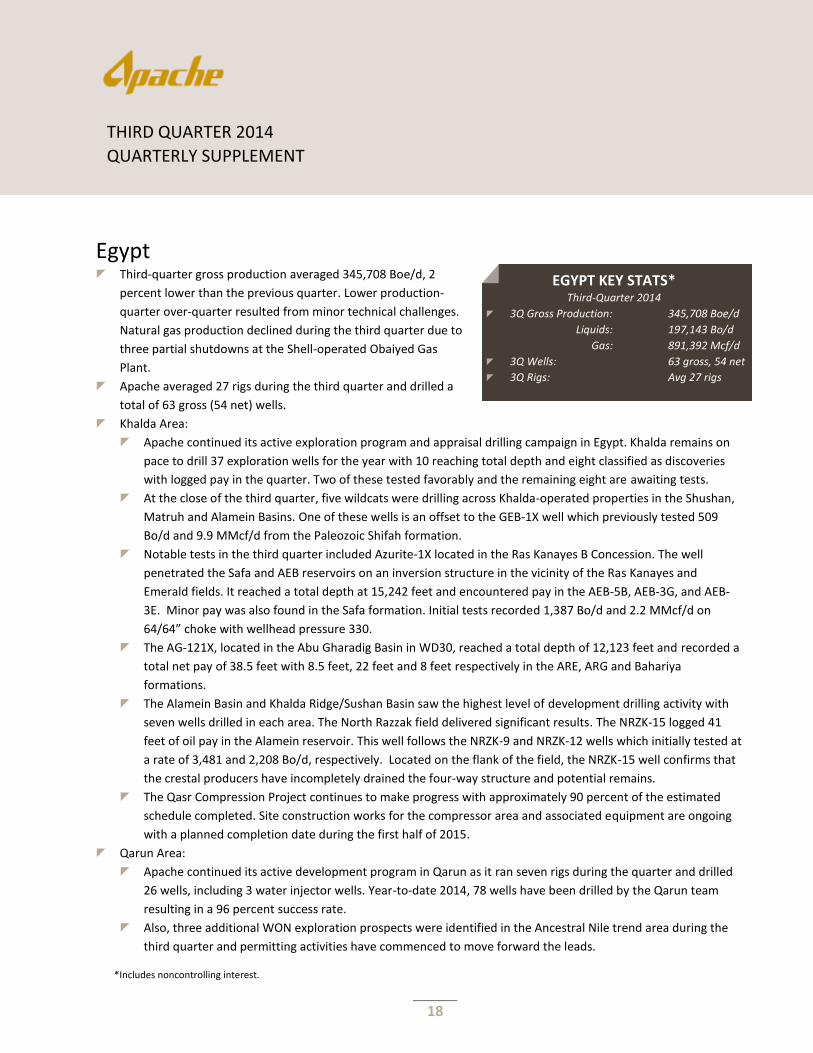
EGYPT KEY STATS* Third-Quarter 2014
3Q Gross Production: 345,708 Boe/d
Liquids: 197,143 Bo/d
Gas: 891,392 Mcf/d
3Q Wells: 63 gross, 54 net
3Q Rigs: Avg 27 rigs
Egypt Third-quarter gross production averaged 345,708 Boe/d, 2
percent lower than the previous quarter. Lower production-
quarter over-quarter resulted from minor technical challenges.
Natural gas production declined during the third quarter due to
three partial shutdowns at the Shell-operated Obaiyed Gas
Plant.
Apache averaged 27 rigs during the third quarter and drilled a
total of 63 gross (54 net) wells.
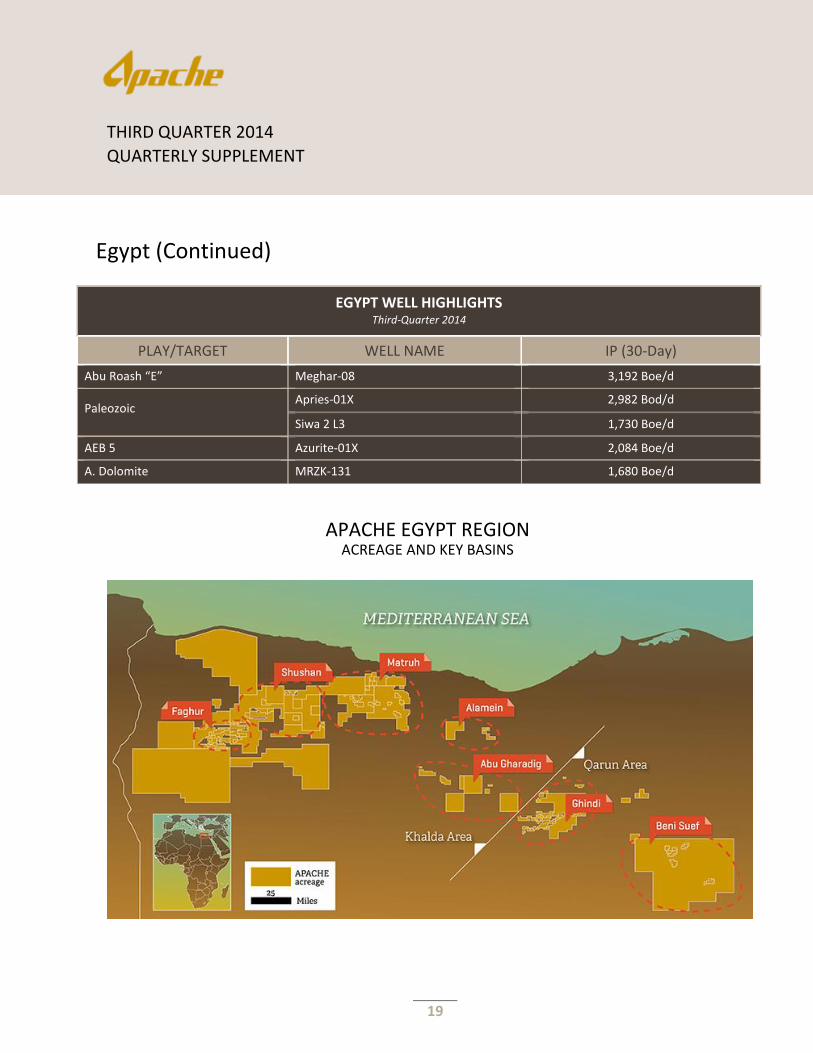
Khalda Area:
Apache continued its active exploration program and appraisal drilling campaign in Egypt. Khalda remains on
pace to drill 37 exploration wells for the year with 10 reaching total depth and eight classified as discoveries
with logged pay in the quarter. Two of these tested favorably and the remaining eight are awaiting tests.
At the close of the third quarter, five wildcats were drilling across Khalda-operated properties in the Shushan,
Matruh and Alamein Basins. One of these wells is an offset to the GEB-1X well which previously tested 509
Bo/d and 9.9 MMcf/d from the Paleozoic Shifah formation.
Notable tests in the third quarter included Azurite-1X located in the Ras Kanayes B Concession. The well
penetrated the Safa and AEB reservoirs on an inversion structure in the vicinity of the Ras Kanayes and
Emerald fields. It reached a total depth at 15,242 feet and encountered pay in the AEB-5B, AEB-3G, and AEB-
3E. Minor pay was also found in the Safa formation. Initial tests recorded 1,387 Bo/d and 2.2 MMcf/d on
64/64” choke with wellhead pressure 330.
The AG-121X, located in the Abu Gharadig Basin in WD30, reached a total depth of 12,123 feet and recorded a
total net pay of 38.5 feet with 8.5 feet, 22 feet and 8 feet respectively in the ARE, ARG and Bahariya
formations.
The Alamein Basin and Khalda Ridge/Sushan Basin saw the highest level of development drilling activity with
seven wells drilled in each area. The North Razzak field delivered significant results. The NRZK-15 logged 41
feet of oil pay in the Alamein reservoir. This well follows the NRZK-9 and NRZK-12 wells which initially tested at
a rate of 3,481 and 2,208 Bo/d, respectively. Located on the flank of the field, the NRZK-15 well confirms that
the crestal producers have incompletely drained the four-way structure and potential remains.
The Qasr Compression Project continues to make progress with approximately 90 percent of the estimated
schedule completed. Site construction works for the compressor area and associated equipment are ongoing
with a planned completion date during the first half of 2015.
Qarun Area:
Apache continued its active development program in Qarun as it ran seven rigs during the quarter and drilled
26 wells, including 3 water injector wells. Year-to-date 2014, 78 wells have been drilled by the Qarun team
resulting in a 96 percent success rate.
Also, three additional WON exploration prospects were identified in the Ancestral Nile trend area during the
third quarter and permitting activities have commenced to move forward the leads.
*Includes noncontrolling interest.
19
THIRD QUARTER 2014
QUARTERLY SUPPLEMENT
Egypt (Continued)
EGYPT WELL HIGHLIGHTS Third-Quarter 2014
PLAY/TARGET WELL NAME IP (30-Day)
Abu Roash “E” Meghar-08 3,192 Boe/d
Paleozoic Apries-01X 2,982 Bod/d
Siwa 2 L3 1,730 Boe/d
AEB 5 Azurite-01X 2,084 Boe/d
A. Dolomite MRZK-131 1,680 Boe/d
APACHE EGYPT REGION ACREAGE AND KEY BASINS
20
THIRD QUARTER 2014
QUARTERLY SUPPLEMENT
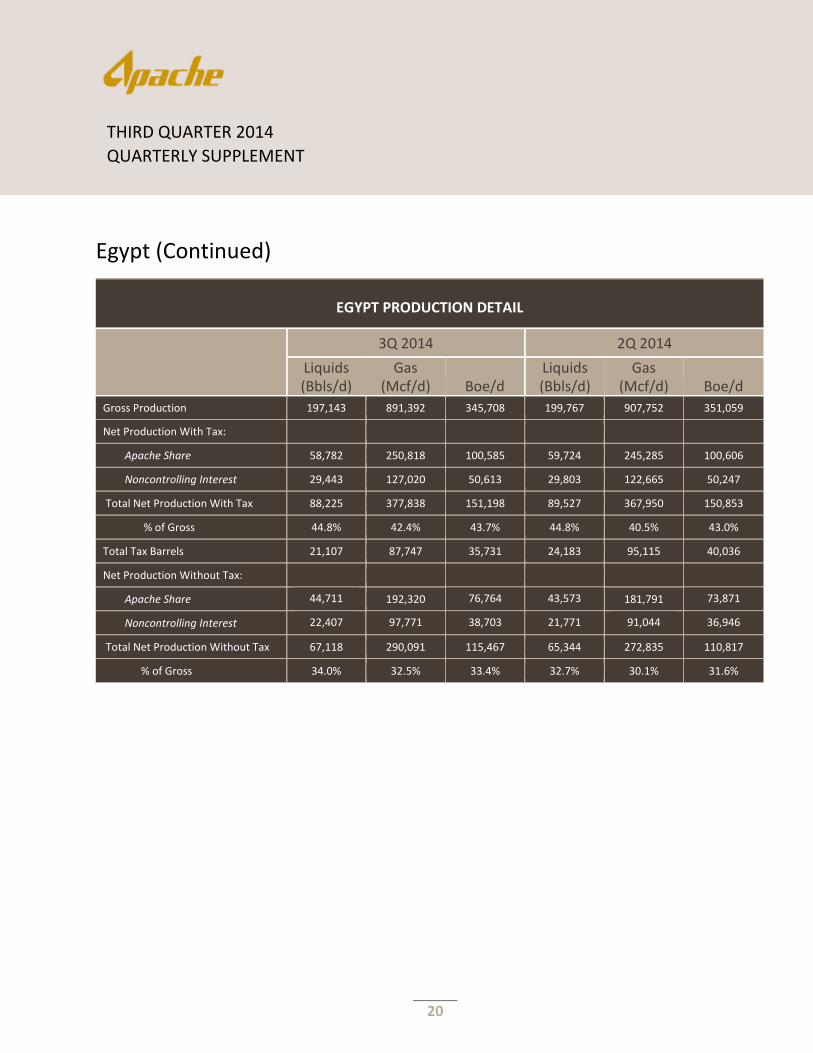
Egypt (Continued)
EGYPT PRODUCTION DETAIL
3Q 2014 2Q 2014
Liquids (Bbls/d)
Gas (Mcf/d) Boe/d
Liquids (Bbls/d)
Gas (Mcf/d) Boe/d
Gross Production 197,143 891,392 345,708 199,767 907,752 351,059
Net Production With Tax:
Apache Share 58,782 250,818 100,585 59,724 245,285 100,606
Noncontrolling Interest 29,443 127,020 50,613 29,803 122,665 50,247
Total Net Production With Tax 88,225 377,838 151,198 89,527 367,950 150,853
% of Gross 44.8% 42.4% 43.7% 44.8% 40.5% 43.0%
Total Tax Barrels 21,107 87,747 35,731 24,183 95,115 40,036
Net Production Without Tax:
Apache Share 44,711 192,320 76,764 43,573 181,791 73,871
Noncontrolling Interest 22,407
97,771 38,703 21,771
91,044 36,946
Total Net Production Without Tax 67,118 290,091 115,467 65,344 272,835 110,817
% of Gross 34.0% 32.5% 33.4% 32.7% 30.1% 31.6%

21
THIRD QUARTER 2014
QUARTERLY SUPPLEMENT
NORTH SEA KEY STATS Third-Quarter 2014
3Q Production: 64,982 Boe/d (87% Liquids)
3Q Wells: 4 gross, 4 net
3Q Rigs: Avg 5 rigs
North Sea Third-quarter 2014 production averaged 64,982 Boe/d, down 10
percent from the second quarter due to annual maintenance
turnaround activities across all operated assets.
During the third quarter, Apache operated an average of five drilling
rigs and drilled four gross (four net) wells with a 100 percent
success rate.
In Forties, the T5 well encountered 138 feet of stacked net oil pay and achieved an initial 30-day production rate of
2,246 Bo/d and the T248 achieved an initial 30-day production rate of 3,135 Bo/d.
The Forties Alpha Satellite Platform (FASP) was commissioned and the first drill at the T240 well encountered 75
feet of net oil pay and achieved an initial production rate of 2,728 Bo/d over the first 23 days of production.
During the quarter, we completed full field Forties TAR and SSIV installation successfully and ahead of schedule.
* Less than 30-day rate.
NORTH SEA WELL HIGHLIGHTS Third-Quarter 2014
PLAY/TARGET WELL NAME IP (30-Day)
Forties T248 FD1-2 3,135 Bo/d
Forties T240 FASP11 2,728 Bo/d*
Forties T5 FA1-4 2,246 Bo/d
Beryl BLN B77 1,596 Boe/d
APACHE NORTH SEA REGION ACREAGE AND KEY PROJECTS
22
THIRD QUARTER 2014
QUARTERLY SUPPLEMENT
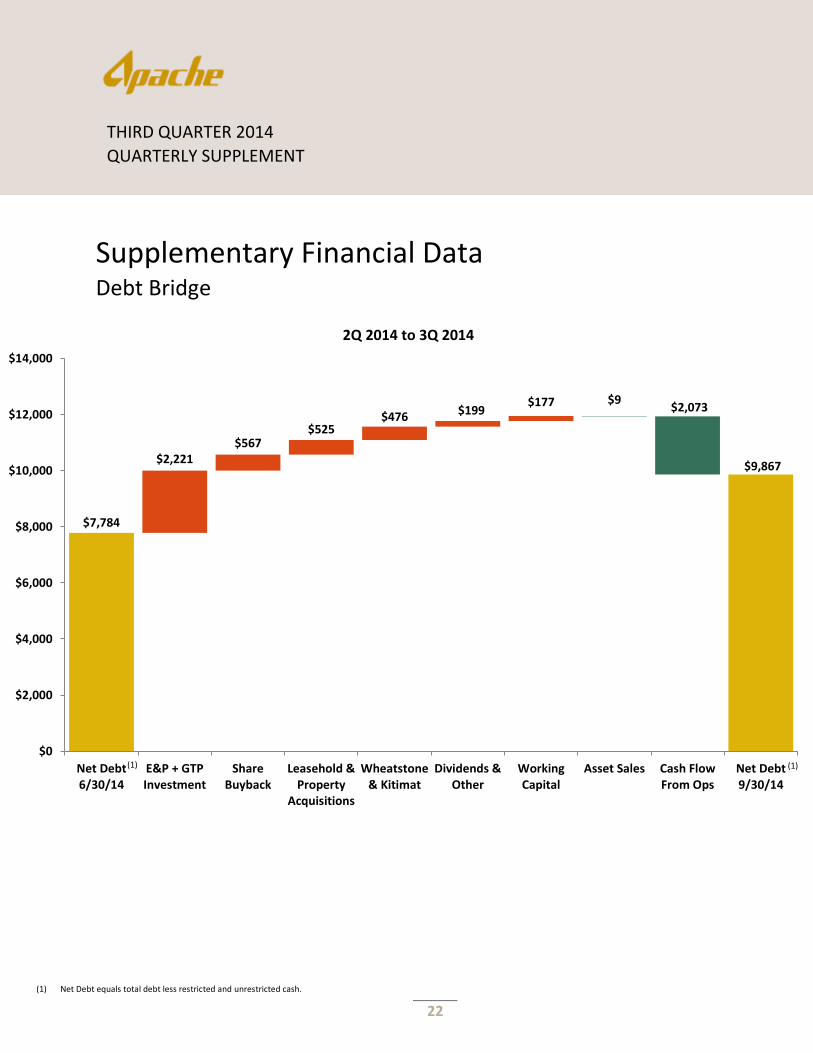
$7,784
$9,867 $2,221
$567 $525
$476 $199 $177 $9
$2,073
$0
$2,000
$4,000
$6,000
$8,000
$10,000
$12,000
$14,000
Net Debt6/30/14
E&P + GTPInvestment
ShareBuyback
Leasehold &Property
Acquisitions
Wheatstone& Kitimat
Dividends &Other
WorkingCapital
Asset Sales Cash FlowFrom Ops
Net Debt9/30/14
Supplementary Financial Data Debt Bridge
2Q 2014 to 3Q 2014
(1) Net Debt equals total debt less restricted and unrestricted cash.
(1) (1)
23
THIRD QUARTER 2014
QUARTERLY SUPPLEMENT
3Q14
(1) YTD 2014
(1)
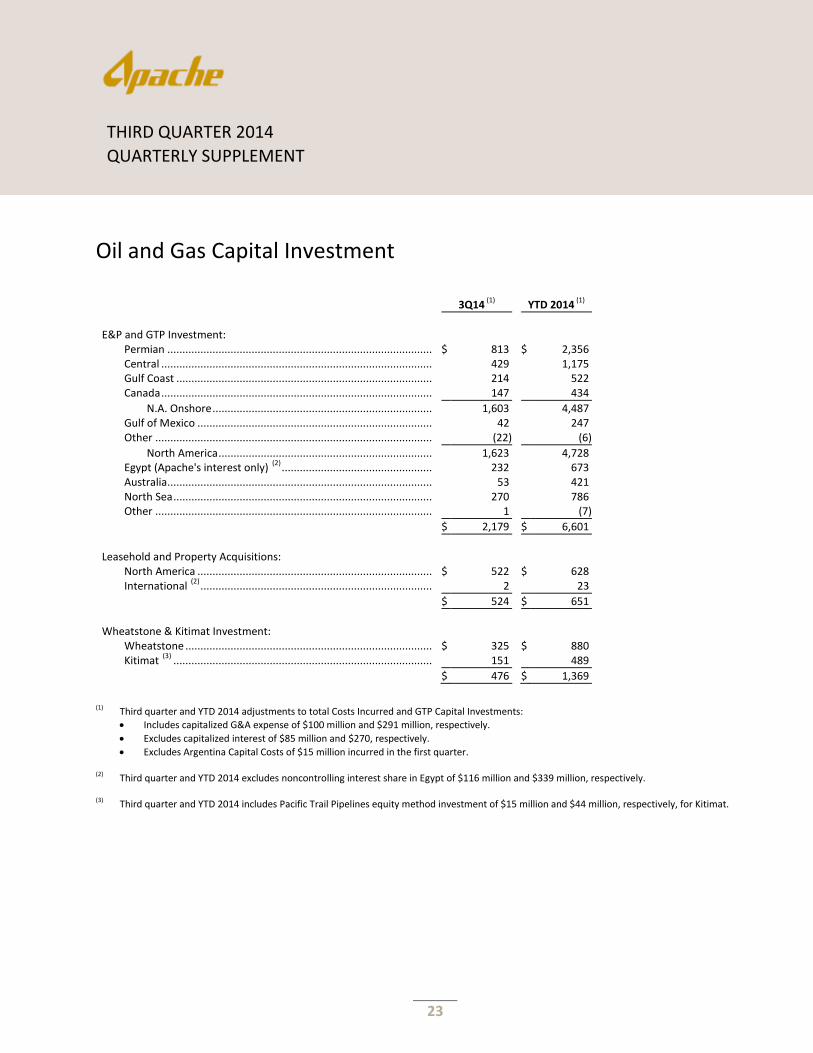
E&P and GTP Investment:
Permian ...............................................................................................................................................................................................................................
$ 813
$
2,356
Central .................................................................................................................................................................................................................................
429
1,175
Gulf Coast ............................................................................................................................................................................................................................
214
522
Canada .................................................................................................................................................................................................................................
147
434
N.A. Onshore ........................................................................................................................................................................................................................
1,603
4,487
Gulf of Mexico .....................................................................................................................................................................................................................
42
247
Other ...................................................................................................................................................................................................................................
(22)
(6)
North America ......................................................................................................................................................................................................................
1,623
4,728
Egypt (Apache's interest only)
(2) .........................................................................................................................................................................................
232
673
Australia...............................................................................................................................................................................................................................
53
421
North Sea .............................................................................................................................................................................................................................
270
786
Other ...................................................................................................................................................................................................................................
1
(7)
$
2,179
$
6,601
Leasehold and Property Acquisitions:
North America .....................................................................................................................................................................................................................
$ 522
$
628
International
(2) ....................................................................................................................................................................................................................
2
23
$
524
$
651
Wheatstone & Kitimat Investment:
Wheatstone .........................................................................................................................................................................................................................
$ 325
$
880
Kitimat
(3) .............................................................................................................................................................................................................................
151
489
$
476
$
1,369
Oil and Gas Capital Investment
(1) Third quarter and YTD 2014 adjustments to total Costs Incurred and GTP Capital Investments:
Includes capitalized G&A expense of $100 million and $291 million, respectively.
Excludes capitalized interest of $85 million and $270, respectively.
Excludes Argentina Capital Costs of $15 million incurred in the first quarter.
(2) Third quarter and YTD 2014 excludes noncontrolling interest share in Egypt of $116 million and $339 million, respectively.
(3)
Third quarter and YTD 2014 includes Pacific Trail Pipelines equity method investment of $15 million and $44 million, respectively, for Kitimat.