thesis - discovering the temporal patterns in the use of flickr in amsterdam
TRANSCRIPT

Discovering the Temporal Patterns in the Use of Flickr in Amsterdam!
Hsu-Young Ho!Master Information Studies!Human-Centered Multimedia!
Supervisor Prof. dr. Stevan Rudinac!
!!
18th August 2015!
Outline • Introduction!• Literature review!• Methodology!• Finding!• Discussion!
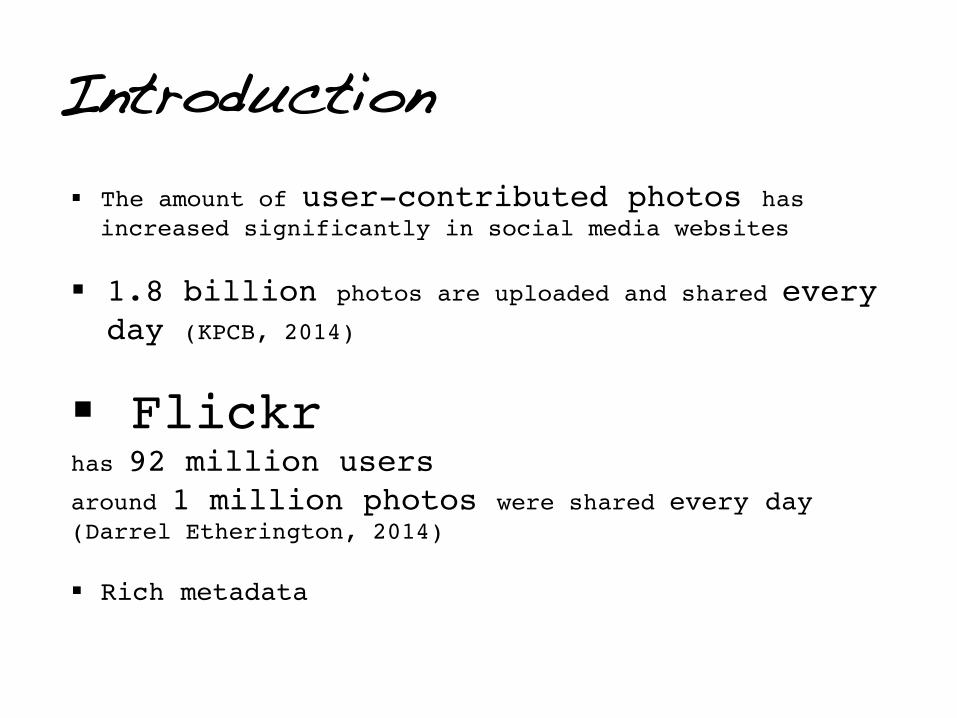
Introduction § The amount of user-contributed photos has
increased significantly in social media websites!
§ 1.8 billion photos are uploaded and shared every day (KPCB, 2014) !
§ Flickr !has 92 million users !around 1 million photos were shared every day (Darrel Etherington, 2014)!!§ Rich metadata!

Introduction Can we understand !
and overview in a city by using these great quantities of social media and the rich metadata? !
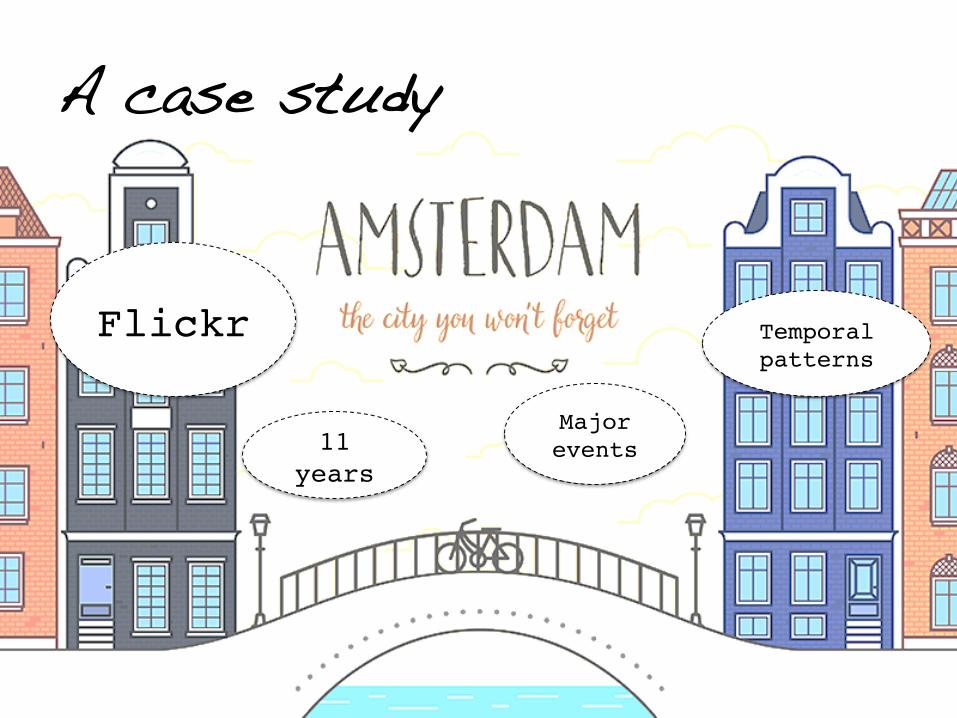
Flickr!
A case study!
11 years!
Major events!
Temporal patterns!
Research question “What are the temporal patterns in the use of Flickr in Amsterdam?”!!!
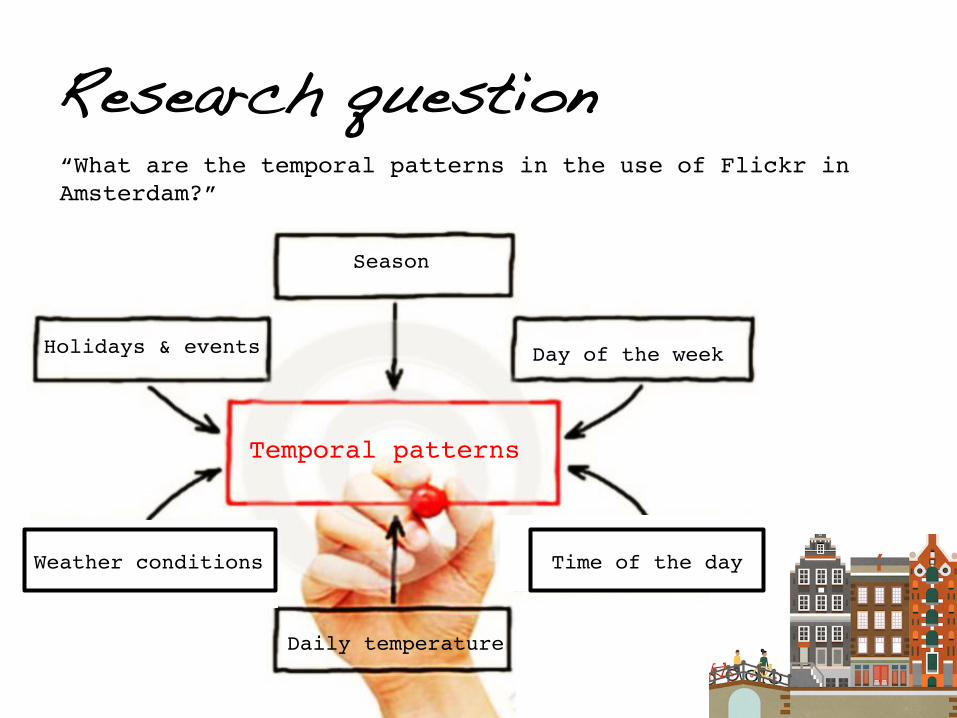
Temporal patterns!
Season!
Day of the week!
Daily temperature!
Weather conditions!
Holidays & events!
Time of the day!
“What are the temporal patterns in the use of Flickr in Amsterdam?”
Research question
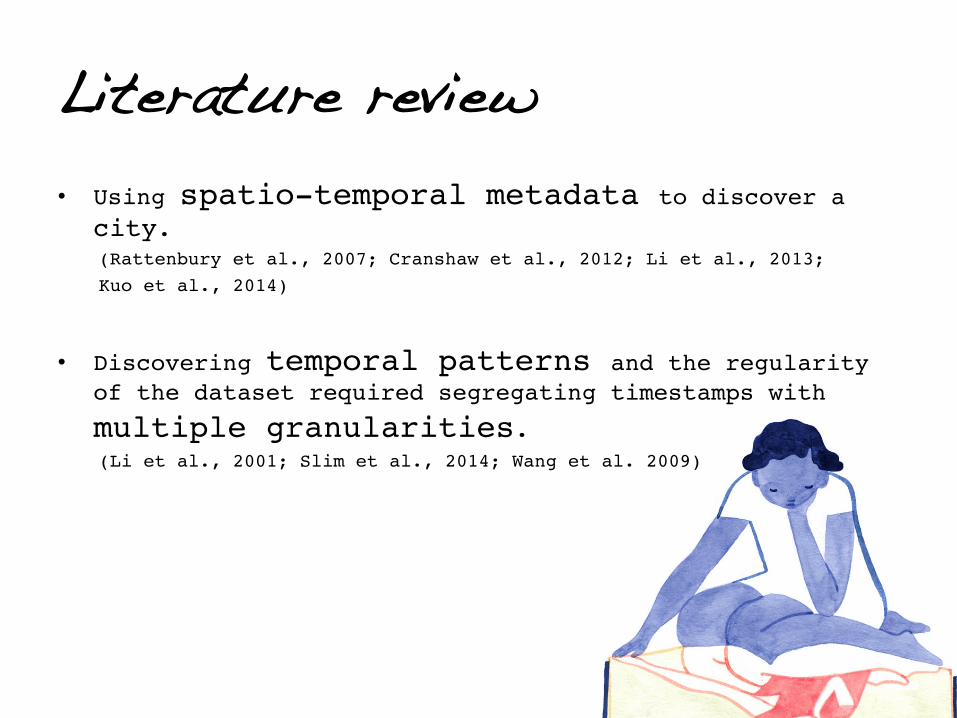
Literature review • Using spatio-temporal metadata to discover a
city.!(Rattenbury et al., 2007; Cranshaw et al., 2012; Li et al., 2013; !Kuo et al., 2014) !
• Discovering temporal patterns and the regularity of the dataset required segregating timestamps with
multiple granularities.!(Li et al., 2001; Slim et al., 2014; Wang et al. 2009)!
Literature review
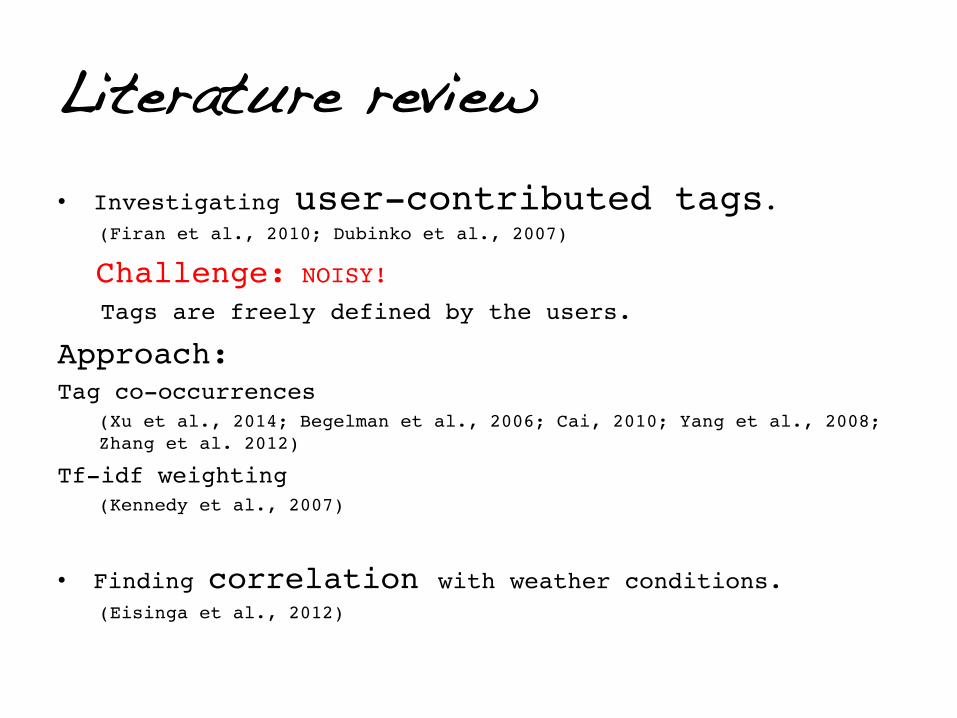
• Investigating user-contributed tags.!(Firan et al., 2010; Dubinko et al., 2007)!
Challenge: NOISY!! Tags are freely defined by the users.!
Approach:!Tag co-occurrences !
(Xu et al., 2014; Begelman et al., 2006; Cai, 2010; Yang et al., 2008; Zhang et al. 2012)!
Tf-idf weighting !(Kennedy et al., 2007)!
!
• Finding correlation with weather conditions.!(Eisinga et al., 2012)!
!
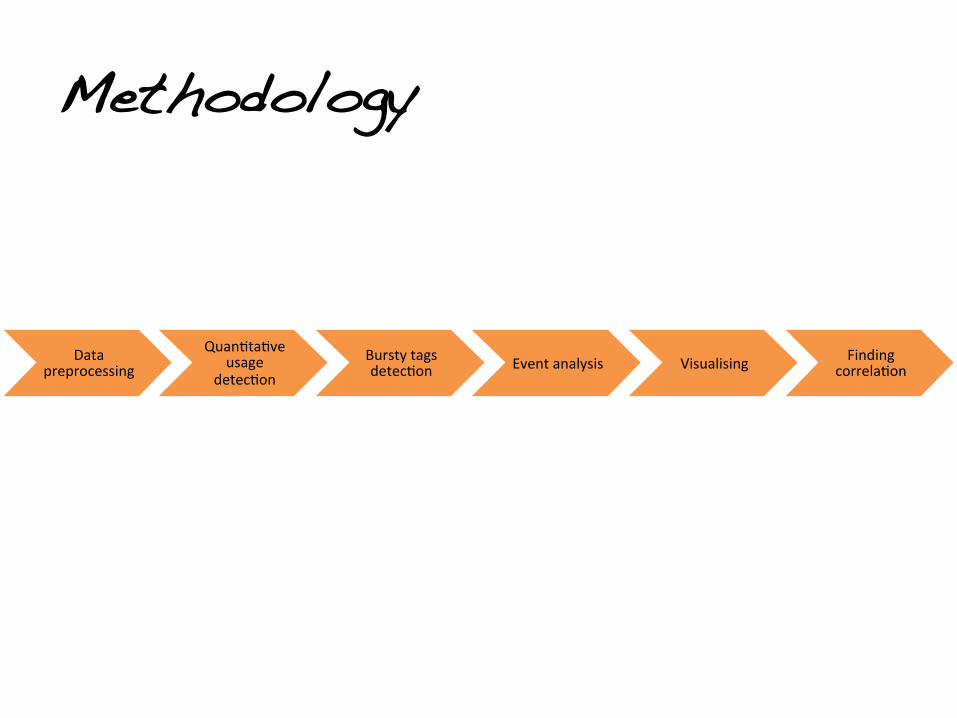
Methodology
Data preprocessing
Quan0ta0ve usage
detec0on Bursty tags detec0on Event analysis Visualising Finding
correla0on
Methodology
Data preprocessing
Quan0ta0ve usage
detec0on Bursty tags detec0on
Event analysis Visualising Finding
correla0on
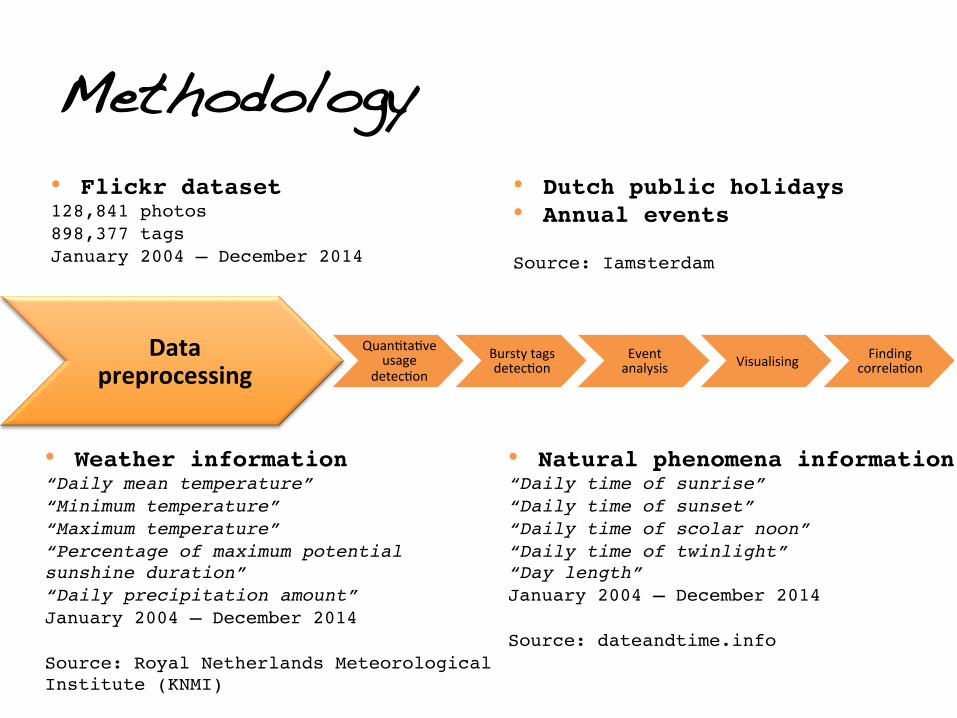
• Flickr dataset!128,841 photos!898,377 tags!January 2004 – December 2014!
• Weather information!“Daily mean temperature”!“Minimum temperature”!“Maximum temperature”!“Percentage of maximum potential sunshine duration”!“Daily precipitation amount”!January 2004 – December 2014!!Source: Royal Netherlands Meteorological Institute (KNMI)!!
• Natural phenomena information!“Daily time of sunrise”!“Daily time of sunset”!“Daily time of scolar noon” !“Daily time of twinlight”!“Day length”!January 2004 – December 2014!!Source: dateandtime.info!!
• Dutch public holidays!• Annual events!Source: Iamsterdam!
Methodology
Data preprocessing
Quan0ta0ve usage detec0on
Bursty tags detec0on
Event analysis Visualising Finding
correla0on
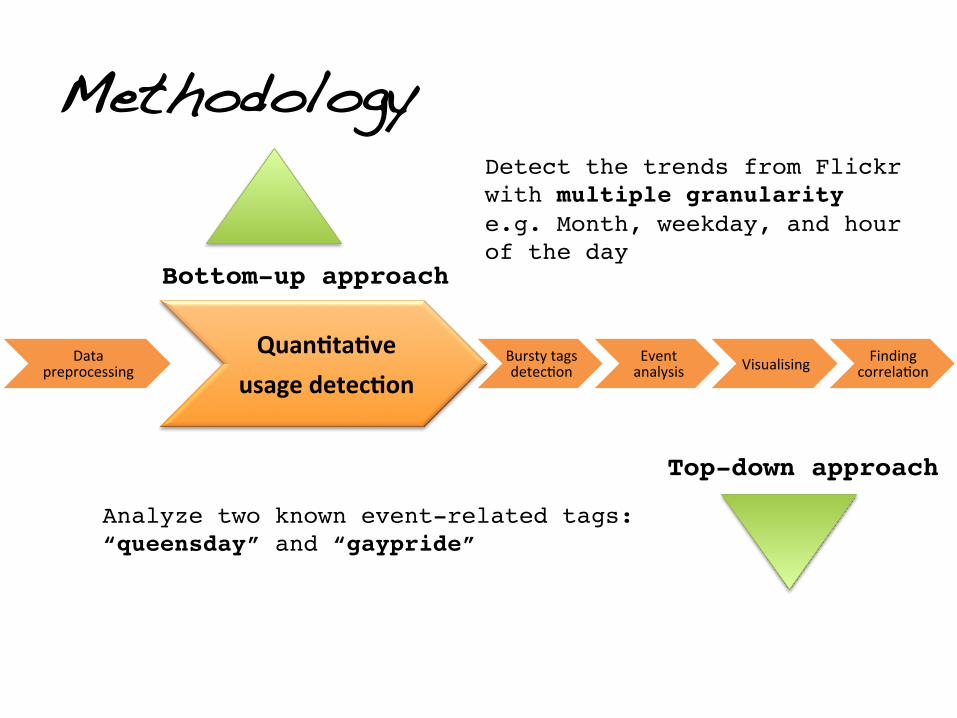
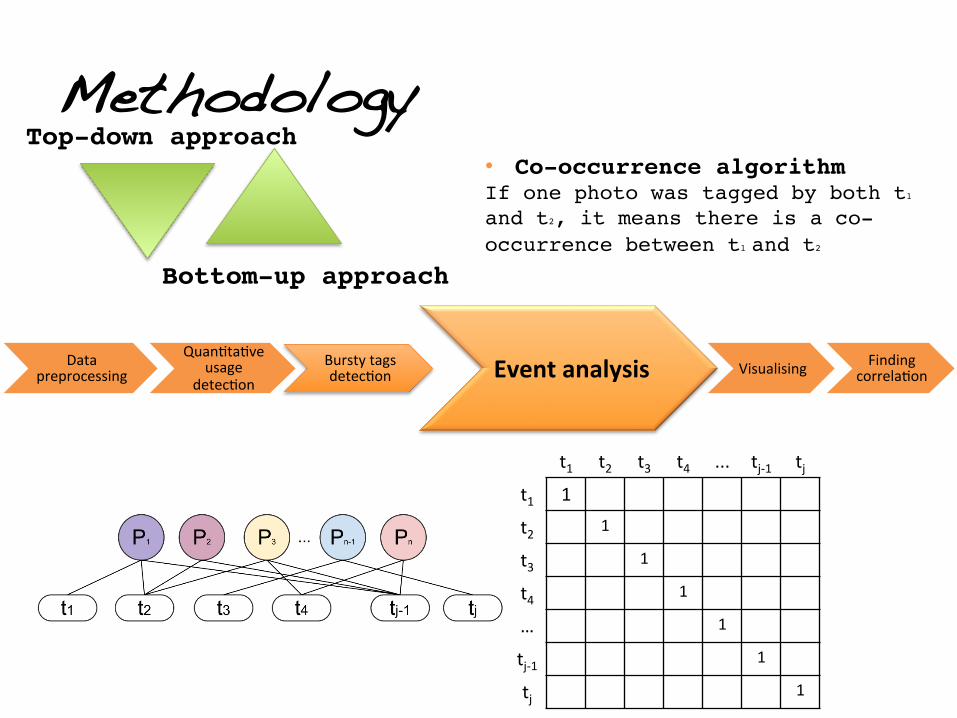
Bottom-up approach!
Top-down approach!
Detect the trends from Flickr with multiple granularity!e.g. Month, weekday, and hour of the day!
Analyze two known event-related tags: “queensday” and “gaypride”!
Methodology
Data preprocessing
Quan0ta0ve usage
detec0on
Bursty tags detec0on
Event analysis Visualising Finding
correla0on
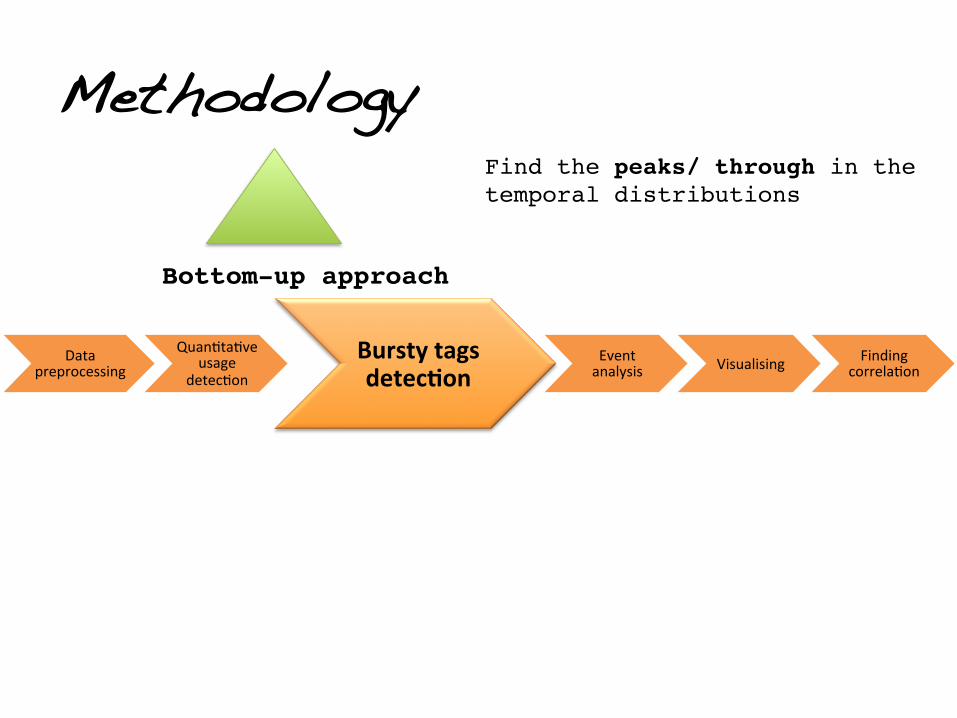
Find the peaks/ through in the temporal distributions!
Bottom-up approach!
Methodology
Data preprocessing
Quan0ta0ve usage
detec0on Bursty tags detec0on Event analysis Visualising Finding
correla0on
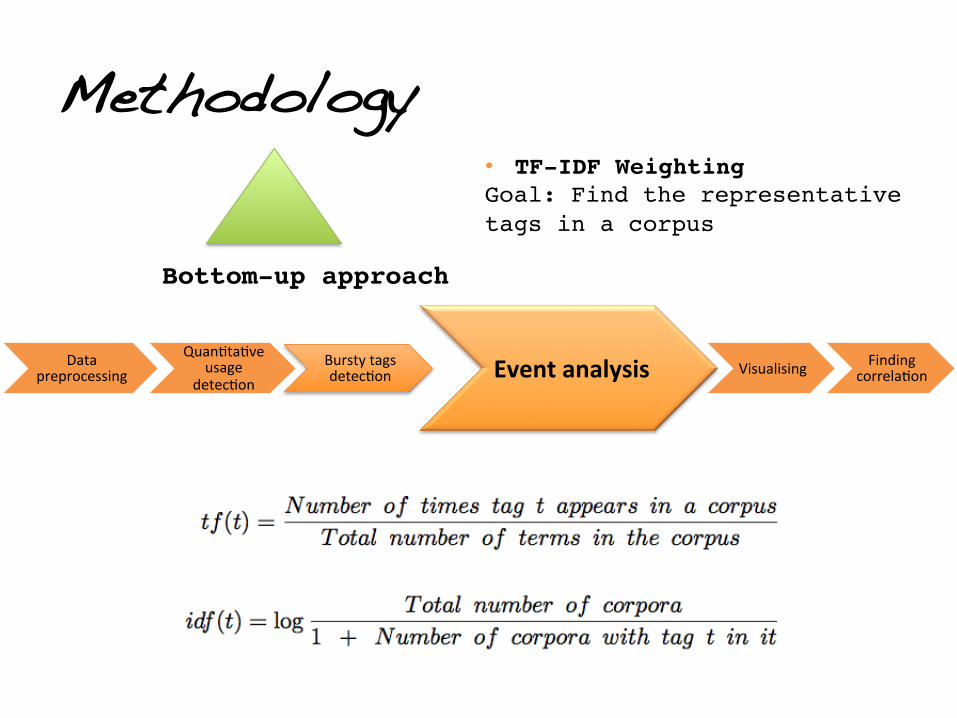
• TF-IDF Weighting!Goal: Find the representative tags in a corpus!
Bottom-up approach!
!
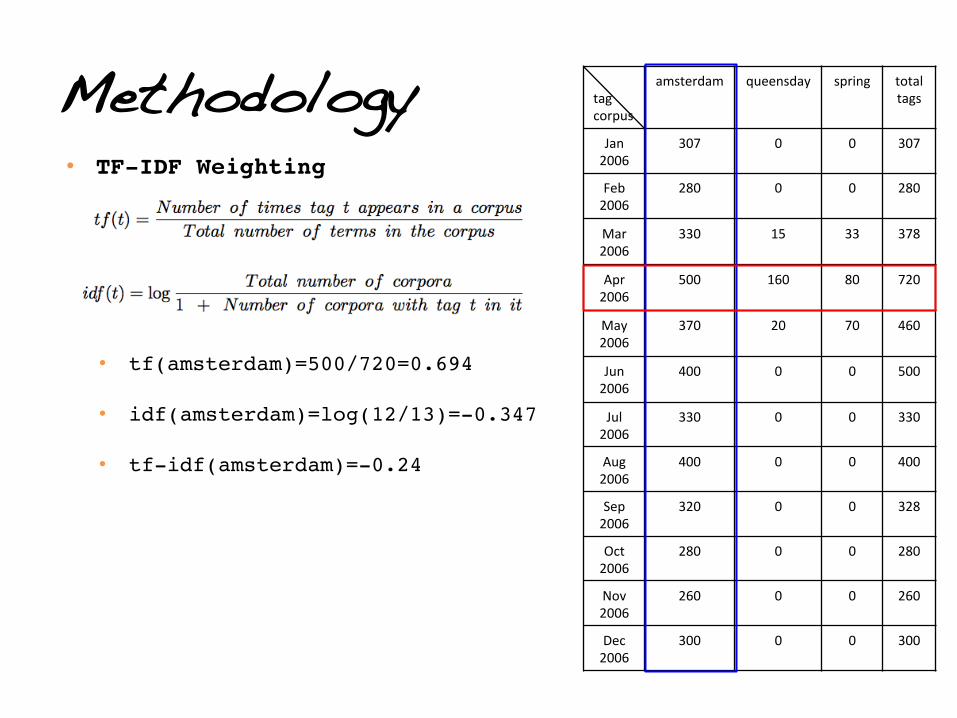
tag corpus
amsterdam queensday spring total tags
Jan 2006
307 0 0 307
Feb 2006
280 0 0 280
Mar 2006
330 15 33 378
Apr 2006
500 160 80 720
May 2006
370 20 70 460
Jun 2006
400 0 0 500
Jul 2006
330 0 0 330
Aug 2006
400 0 0 400
Sep 2006
320 0 0 328
Oct 2006
280 0 0 280
Nov 2006
260 0 0
260
Dec 2006
300 0 0 300
Methodology • TF-IDF Weighting!
• tf(amsterdam)=500/720=0.694!
• idf(amsterdam)=log(12/13)=-0.347!
• tf-idf(amsterdam)=-0.24!

tag corpus
amsterdam queensday spring total tags
Jan 2006
307 0 0 307
Feb 2006
280 0 0 280
Mar 2006
330 15 33 378
Apr 2006
500 160 80 720
May 2006
370 20 70 460
Jun 2006
400 0 0 500
Jul 2006
330 0 0 330
Aug 2006
400 0 0 400
Sep 2006
320 0 0 328
Oct 2006
280 0 0 280
Nov 2006
260 0 0
260
Dec 2006
300 0 0 300
Methodology • TF-IDF Weighting!
• tf-idf(amsterdam)=-0.24!
• tf(queensday)=160/720=0.222!
• idf(queensday)=log(12/4)=0.4771!
• tf-idf(queensday)=0.1!
tag corpus
amsterdam queensday spring total tags
Jan 2006
307 0 0 307
Feb 2006
280 0 0 280
Mar 2006
330 15 33 378
Apr 2006
500 160 80 720
May 2006
370 20 70 460
Jun 2006
400 0 0 500
Jul 2006
330 0 0 330
Aug 2006
400 0 0 400
Sep 2006
320 0 0 328
Oct 2006
280 0 0 280
Nov 2006
260 0 0
260
Dec 2006
300 0 0 300
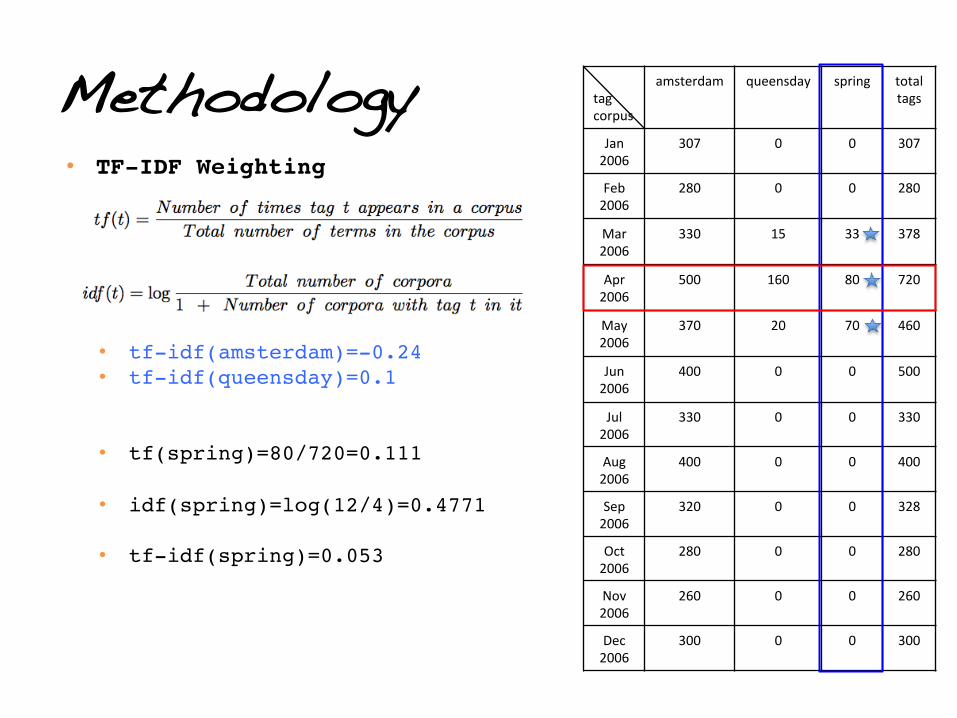
Methodology • TF-IDF Weighting!
!
• tf-idf(amsterdam)=-0.24!• tf-idf(queensday)=0.1!
• tf(spring)=80/720=0.111!
• idf(spring)=log(12/4)=0.4771!
• tf-idf(spring)=0.053!
tag corpus
amsterdam queensday spring total tags
Jan 2006
307 0 0 307
Feb 2006
280 0 0 280
Mar 2006
330 15 33 378
Apr 2006
500 160 80 720
May 2006
370 20 70 460
Jun 2006
400 0 0 500
Jul 2006
330 0 0 330
Aug 2006
400 0 0 400
Sep 2006
320 0 0 328
Oct 2006
280 0 0 280
Nov 2006
260 0 0
260
Dec 2006
300 0 0 300
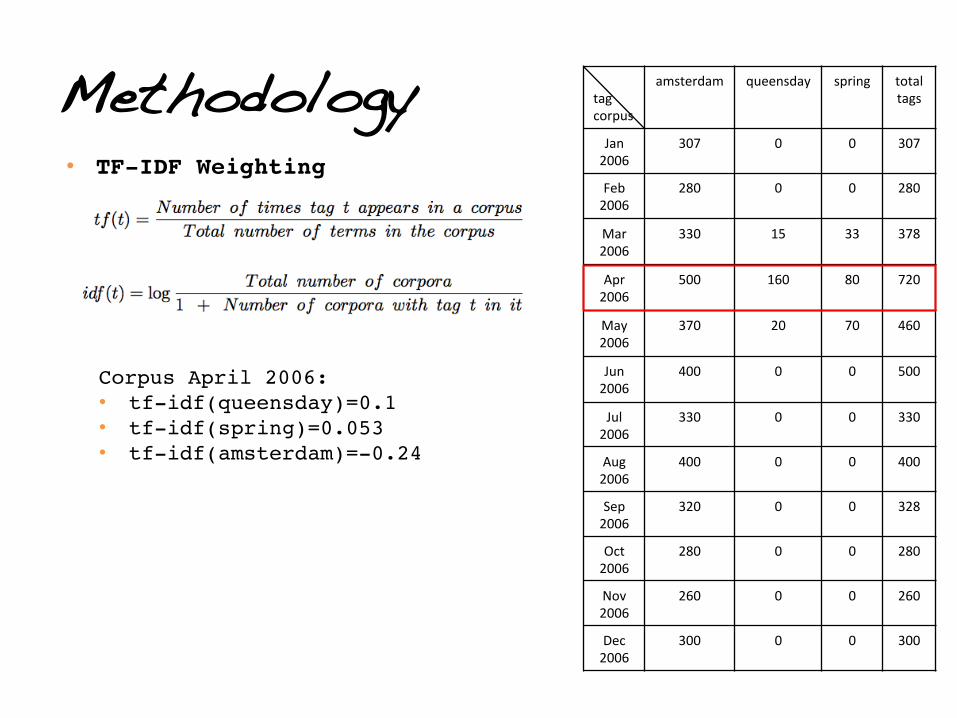
Methodology • TF-IDF Weighting!
!
!Corpus April 2006:!• tf-idf(queensday)=0.1!• tf-idf(spring)=0.053!• tf-idf(amsterdam)=-0.24!
Methodology
Data preprocessing
Quan0ta0ve usage
detec0on Bursty tags detec0on Event analysis Visualising Finding
correla0on
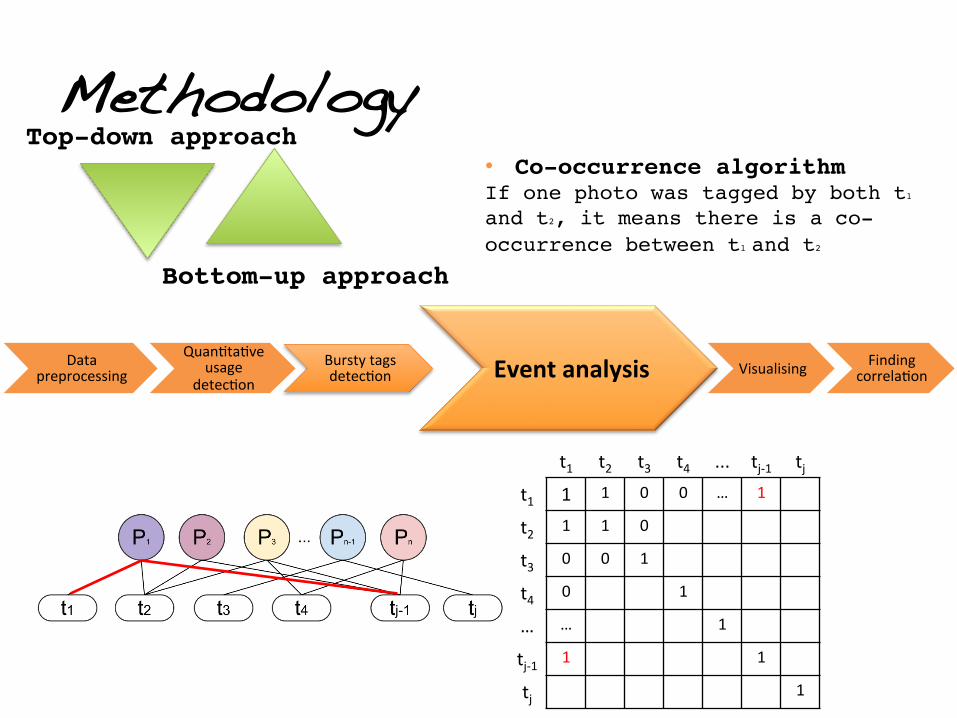
• Co-occurrence algorithm!If one photo was tagged by both t1
and t2, it means there is a co-occurrence between t1 and t2 !
Top-down approach!
Bottom-up approach!
t1 t2 t3 t4 ... tj-‐1 tj
t1 1
t2 1
t3 1
t4 1
… 1
tj-‐1 1
tj 1

Methodology
Data preprocessing
Quan0ta0ve usage
detec0on Bursty tags detec0on Event analysis Visualising Finding
correla0on
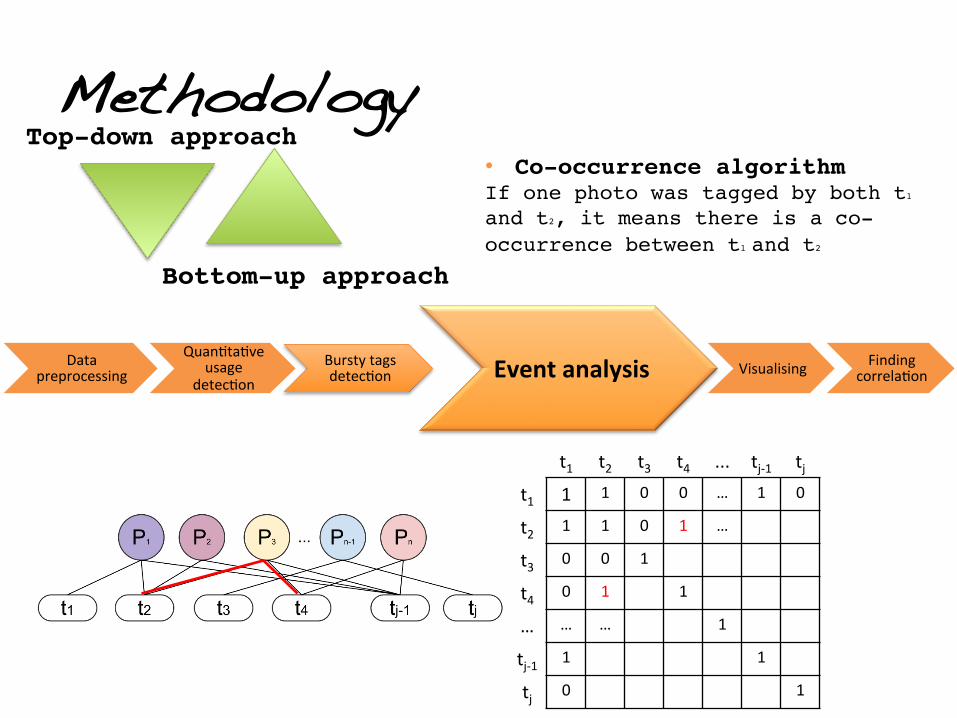
• Co-occurrence algorithm!If one photo was tagged by both t1
and t2, it means there is a co-occurrence between t1 and t2 !
Top-down approach!
Bottom-up approach!
t1 t2 t3 t4 ... tj-‐1 tj
t1 1 1
t2 1 1
t3 1
t4 1
… 1
tj-‐1 1
tj 1
Methodology
Data preprocessing
Quan0ta0ve usage
detec0on Bursty tags detec0on Event analysis Visualising Finding
correla0on
• Co-occurrence algorithm!If one photo was tagged by both t1
and t2, it means there is a co-occurrence between t1 and t2 !
Top-down approach!
Bottom-up approach!
t1 t2 t3 t4 ... tj-‐1 tj
t1 1 1 0 0 … 1
t2 1 1 0
t3 0 0 1
t4 0 1
… … 1
tj-‐1 1 1
tj 1
Methodology
Data preprocessing
Quan0ta0ve usage
detec0on Bursty tags detec0on Event analysis Visualising Finding
correla0on
• Co-occurrence algorithm!If one photo was tagged by both t1
and t2, it means there is a co-occurrence between t1 and t2 !
Top-down approach!
Bottom-up approach!
t1 t2 t3 t4 ... tj-‐1 tj
t1 1 1 0 0 … 1 0
t2 1 1 0 1 …
t3 0 0 1
t4 0 1 1
… … … 1
tj-‐1 1 1
tj 0 1

Methodology
Data preprocessing
Quan0ta0ve usage
detec0on Bursty tags detec0on Event analysis Visualising Finding
correla0on
• Co-occurrence algorithm!If one photo was tagged by both t1
and t2, it means there is a co-occurrence between t1 and t2 !
Top-down approach!
Bottom-up approach!
t1 t2 t3 t4 ... tj-‐1 tj
t1 1 1 0 0 … 1 0
t2 1 1 0 1 … 3
t3 0 0 1
t4 0 1 1
… … … 1
tj-‐1 1 3 1
tj 0 1
Methodology
Data preprocessing
Quan0ta0ve usage
detec0on Bursty tags detec0on Event analysis Visualising Finding
correla0on
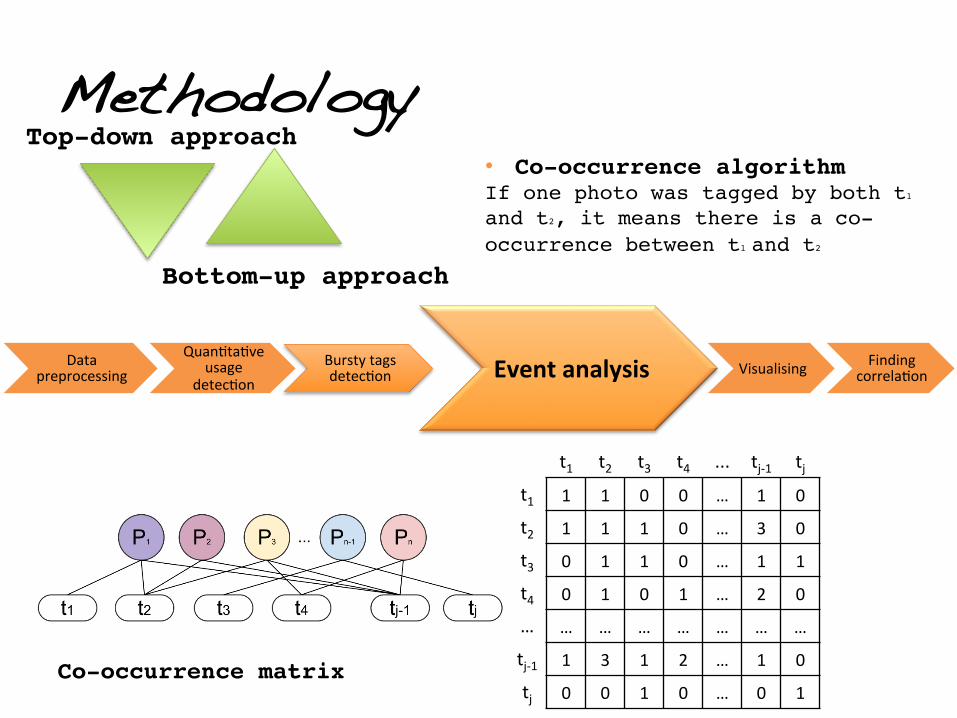
• Co-occurrence algorithm!If one photo was tagged by both t1
and t2, it means there is a co-occurrence between t1 and t2 !
Top-down approach!
Bottom-up approach!
t1 t2 t3 t4 ... tj-‐1 tj
t1 1 1 0 0 … 1 0
t2 1 1 1 0 … 3 0
t3 0 1 1 0 … 1 1
t4 0 1 0 1 … 2 0
… … … … … … … …
tj-‐1 1 3 1 2 … 1 0
tj 0 0 1 0 … 0 1 Co-occurrence matrix
Data preprocessing
Quan0ta0ve usage
detec0on Bursty tags detec0on
Event analysis Visualising Finding
correla0on
Methodology
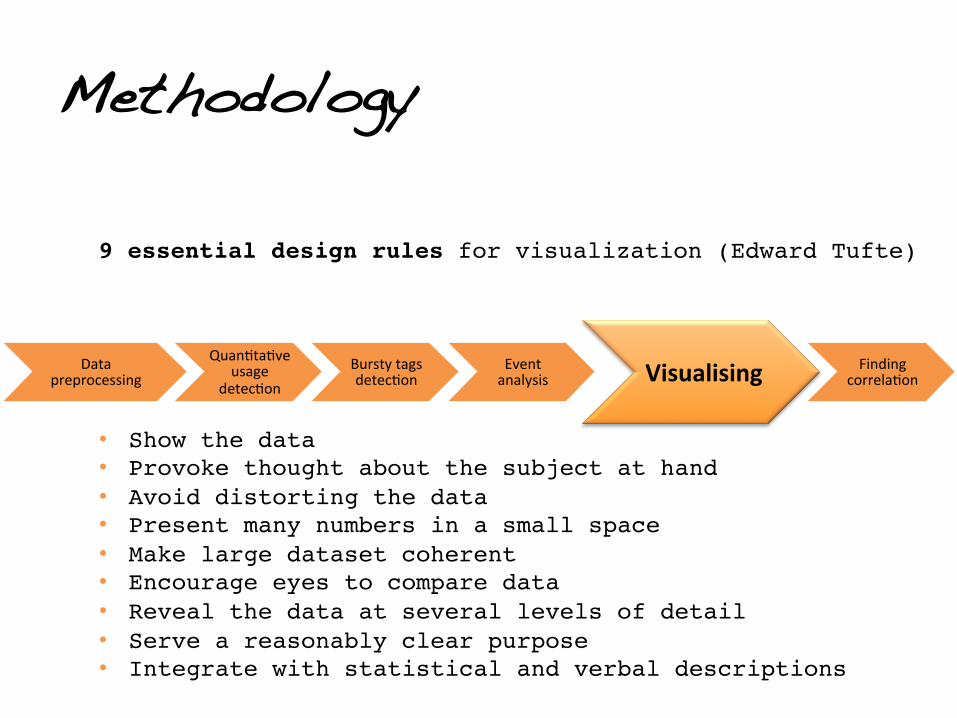
• Show the data!• Provoke thought about the subject at hand!• Avoid distorting the data!• Present many numbers in a small space!• Make large dataset coherent!• Encourage eyes to compare data!• Reveal the data at several levels of detail!• Serve a reasonably clear purpose!• Integrate with statistical and verbal descriptions!
9 essential design rules for visualization (Edward Tufte)!
Methodology
Data preprocessing
Quan0ta0ve usage
detec0on Bursty tags detec0on
Event analysis Visualising
Finding correla0on
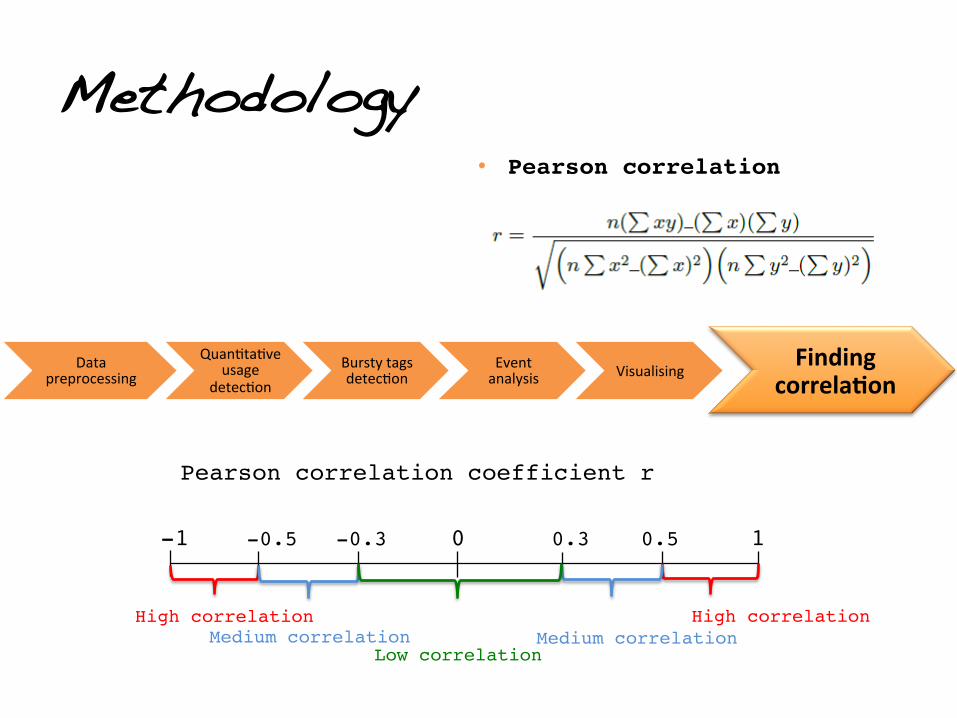
• Pearson correlation!
-1 -0.5 -0.3 0 0.3 0.5 1
High correlation Medium correlation
Low correlation
Pearson correlation coefficient r
High correlation Medium correlation

Findings
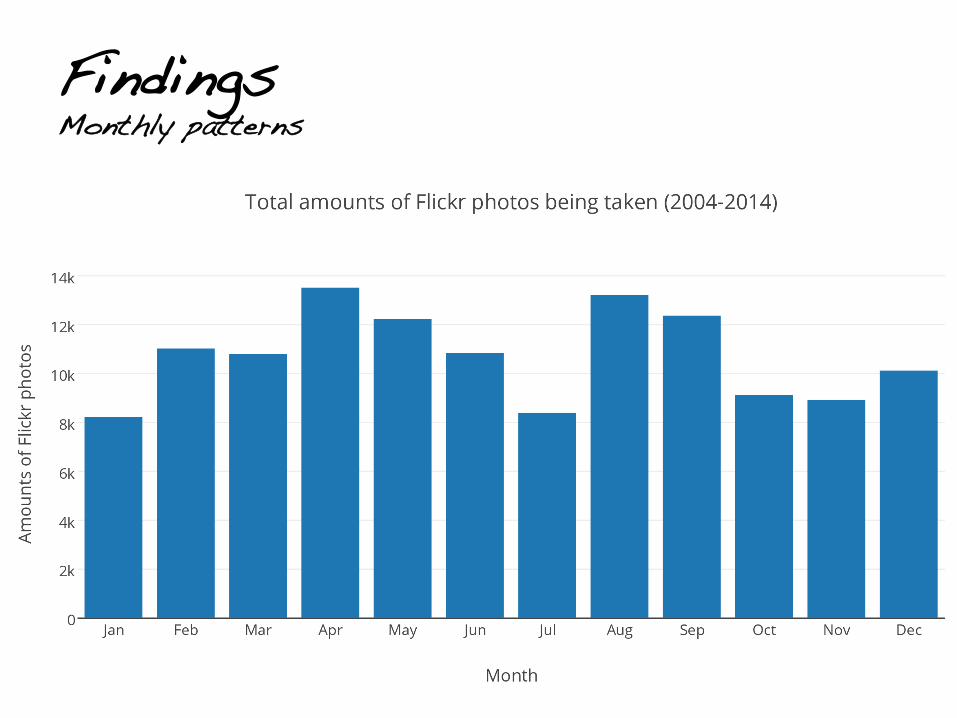
Findings!Monthly patterns
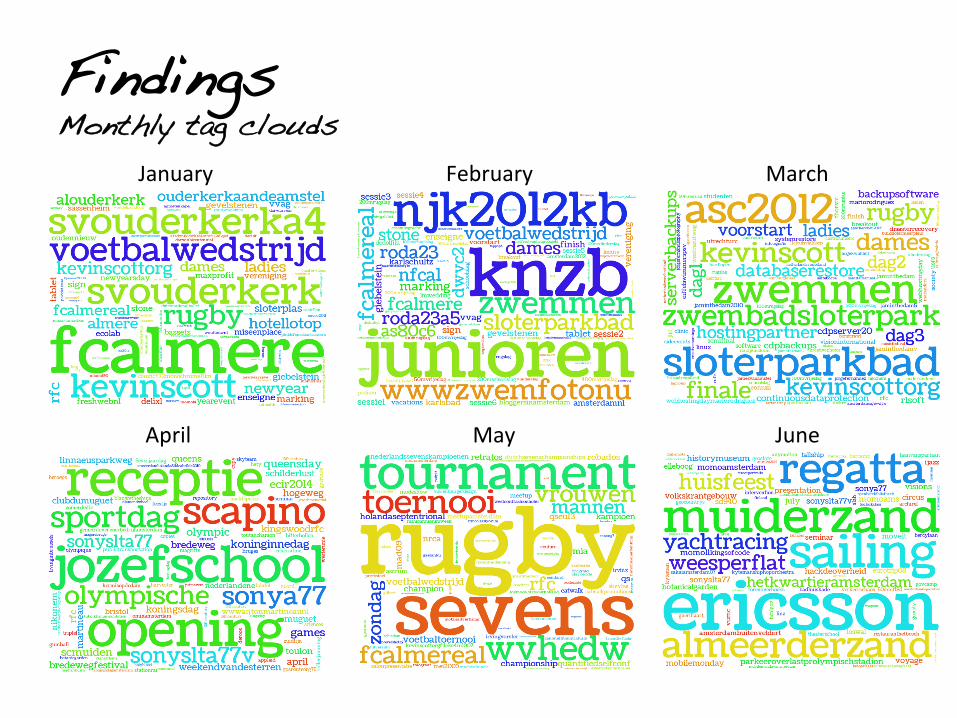
Findings!Monthly tag clouds
January February March
April May June
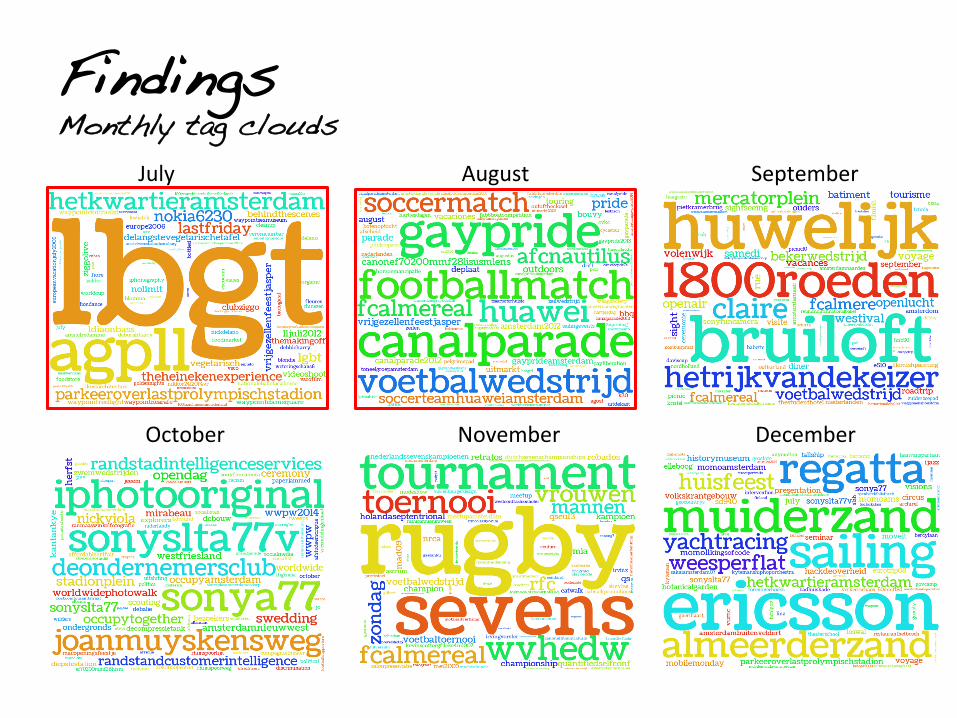
Findings!Monthly tag clouds
July August September
October November December
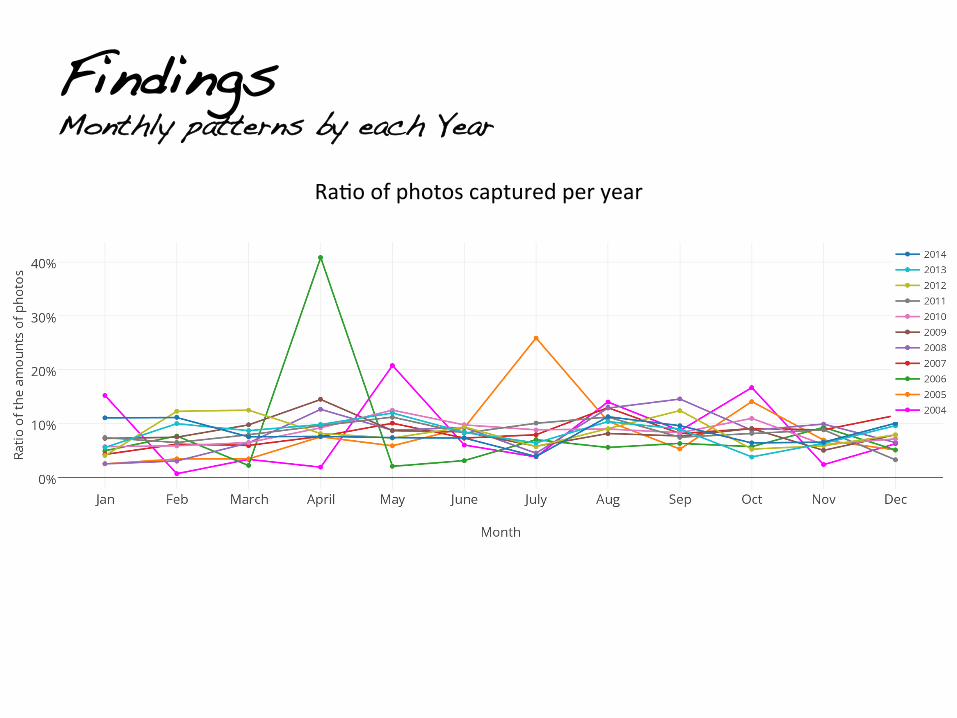
Findings!Monthly patterns by each Year
Ra0o of photos captured per year
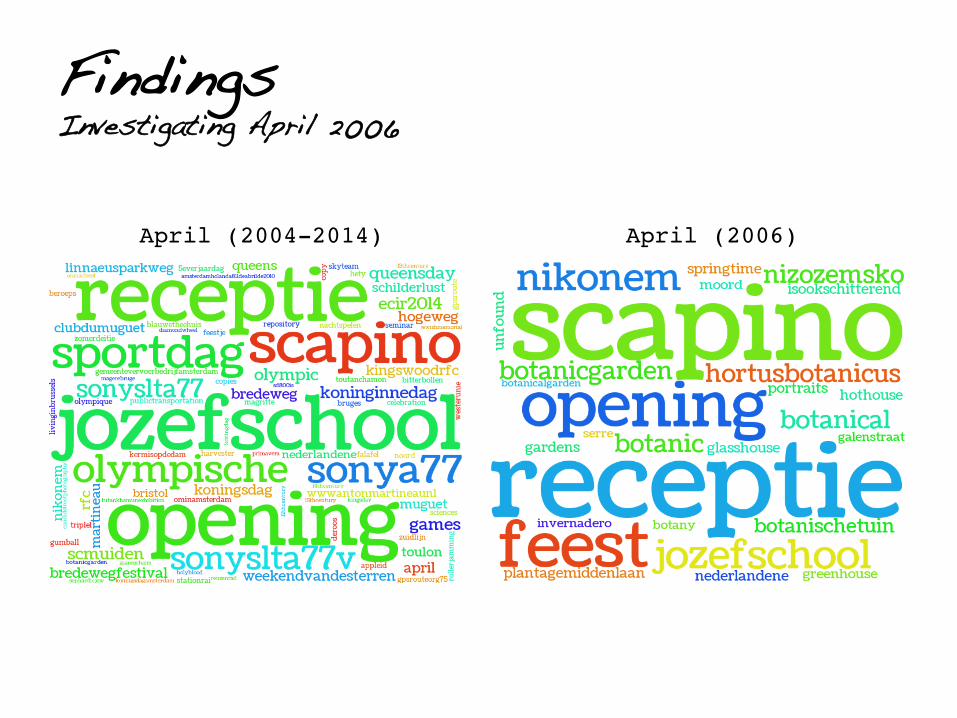
Findings!Investigating April 2006
April (2004-2014)! April (2006)!
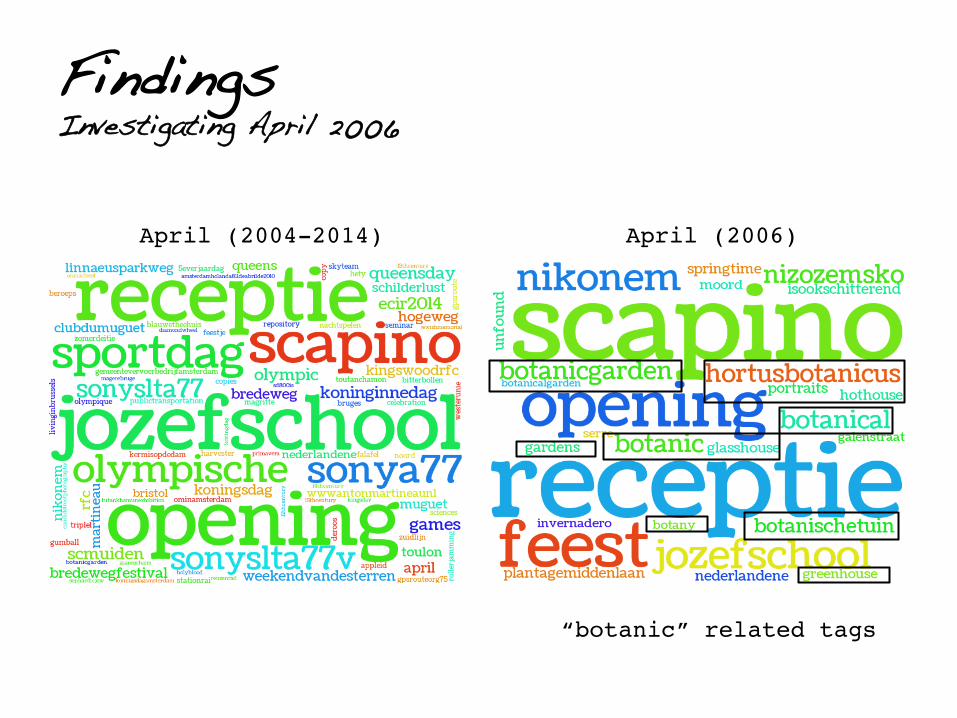
Findings!Investigating April 2006
April (2004-2014)! April (2006)!
“botanic” related tags!
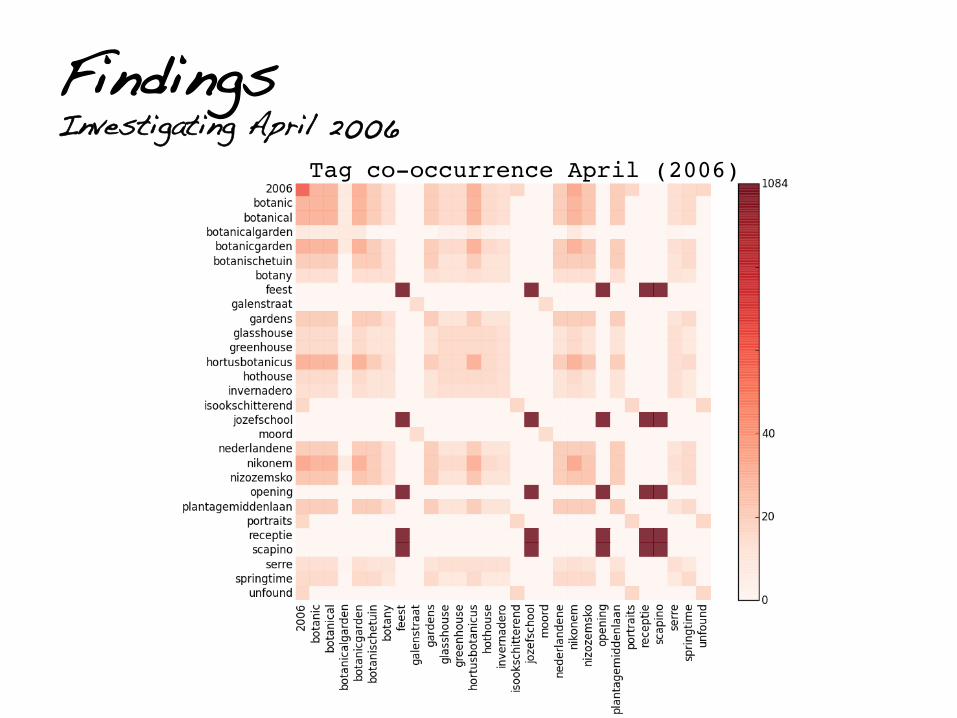
Findings!Investigating April 2006
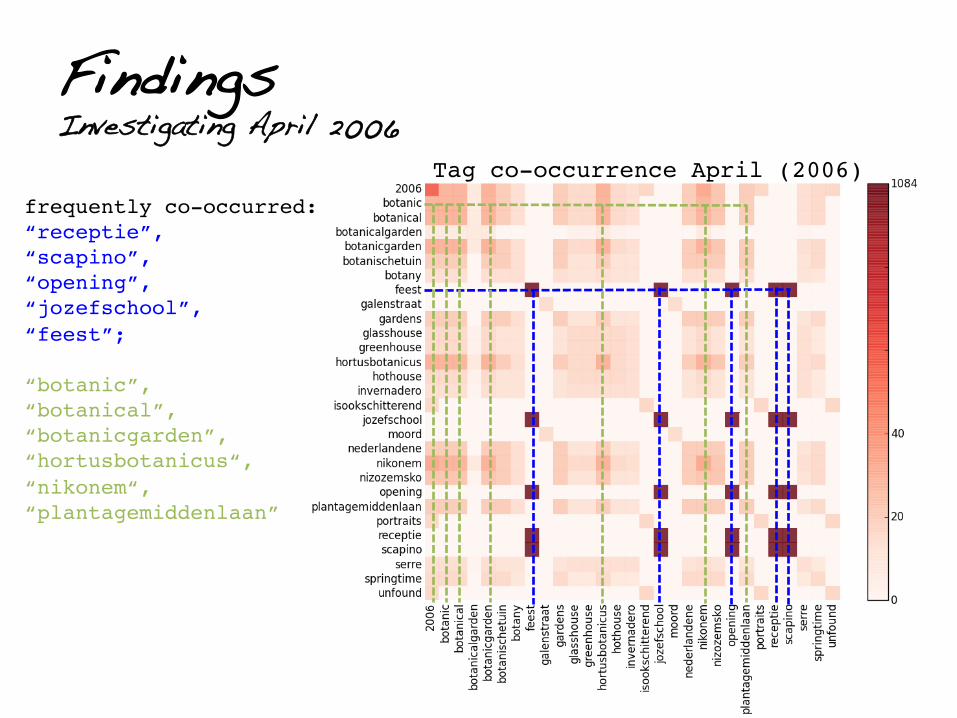
Tag co-occurrence April (2006)!
Findings!Investigating April 2006
Tag co-occurrence April (2006)!
frequently co-occurred:!“receptie”, !“scapino”,!“opening”,!“jozefschool”, !“feest”;!!“botanic”,!“botanical”,!“botanicgarden”,!“hortusbotanicus“,!“nikonem“, “plantagemiddenlaan” ! ! !
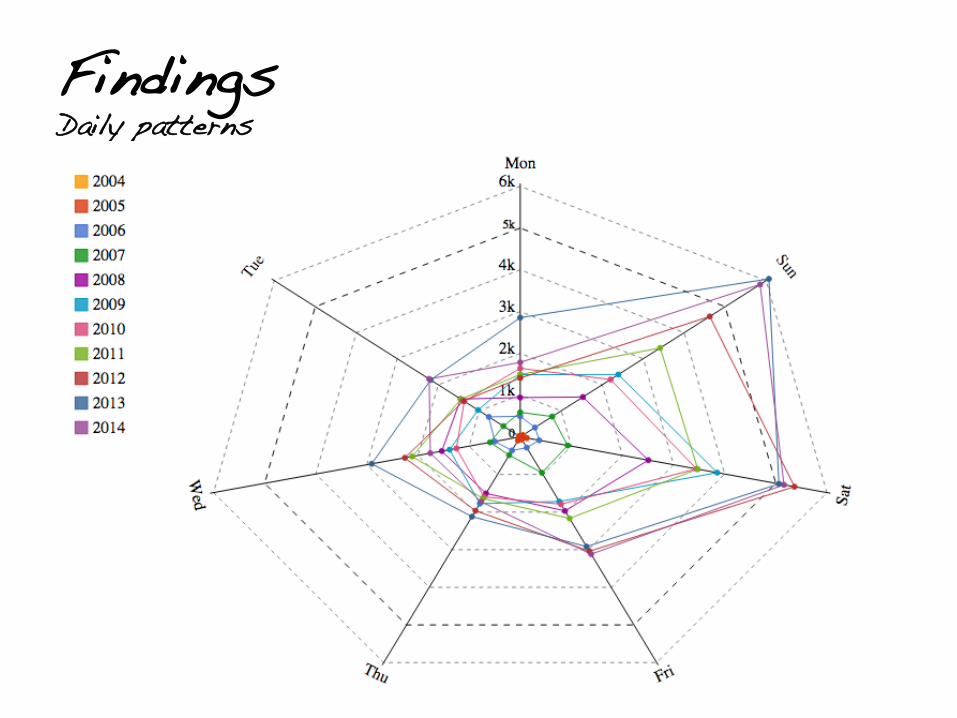
Findings!Daily patterns
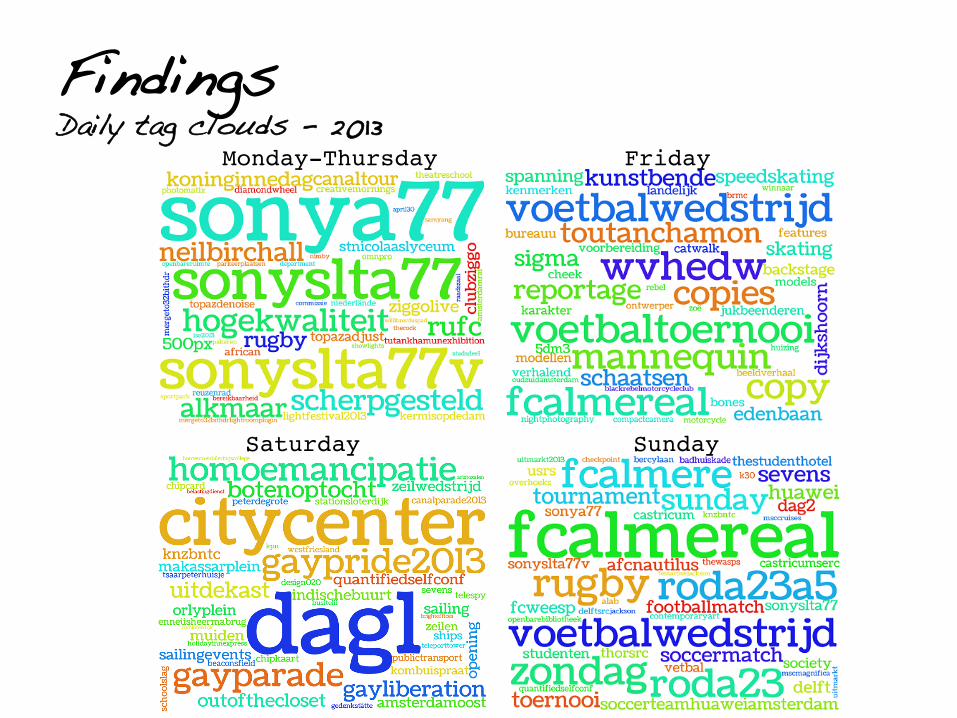
Findings!Daily tag clouds - 2013
Monday-Thursday Friday!
Saturday Sunday!
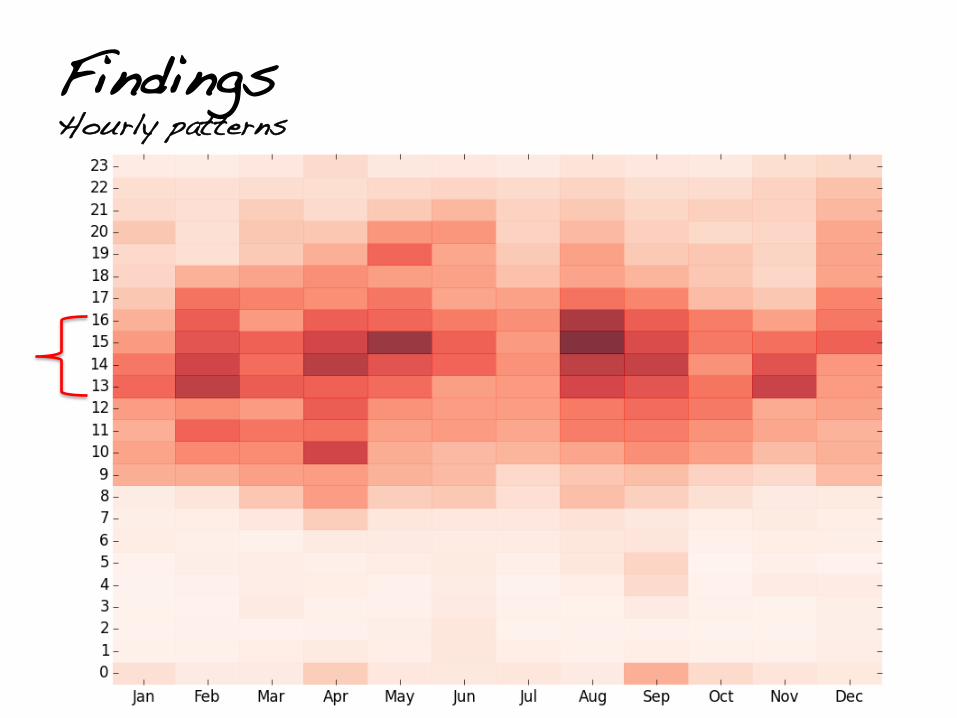
Findings!Hourly patterns
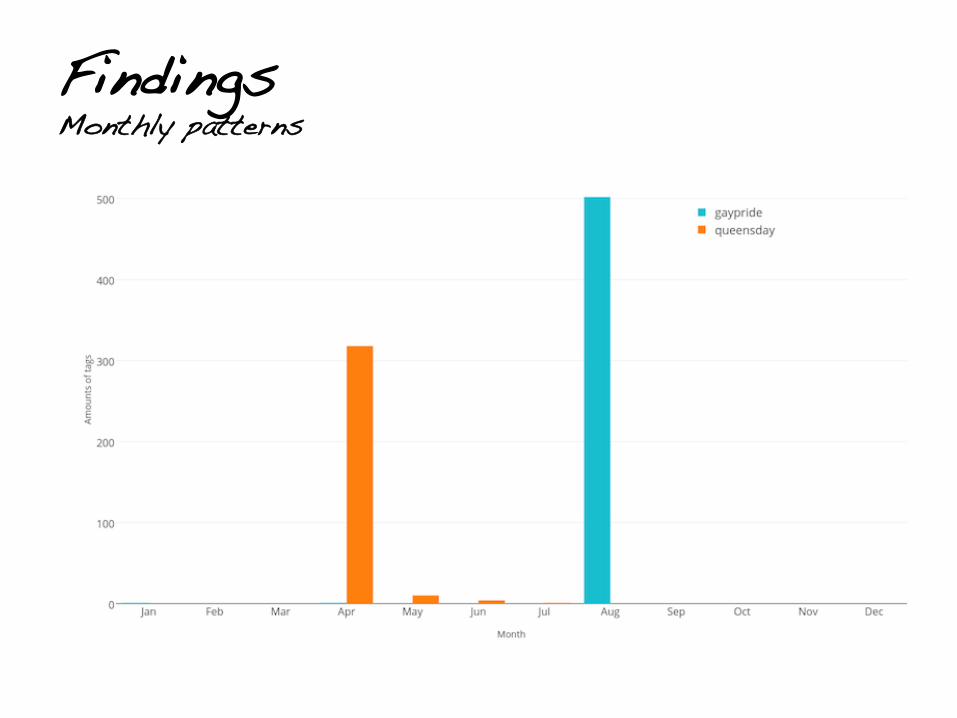
Findings!Monthly patterns
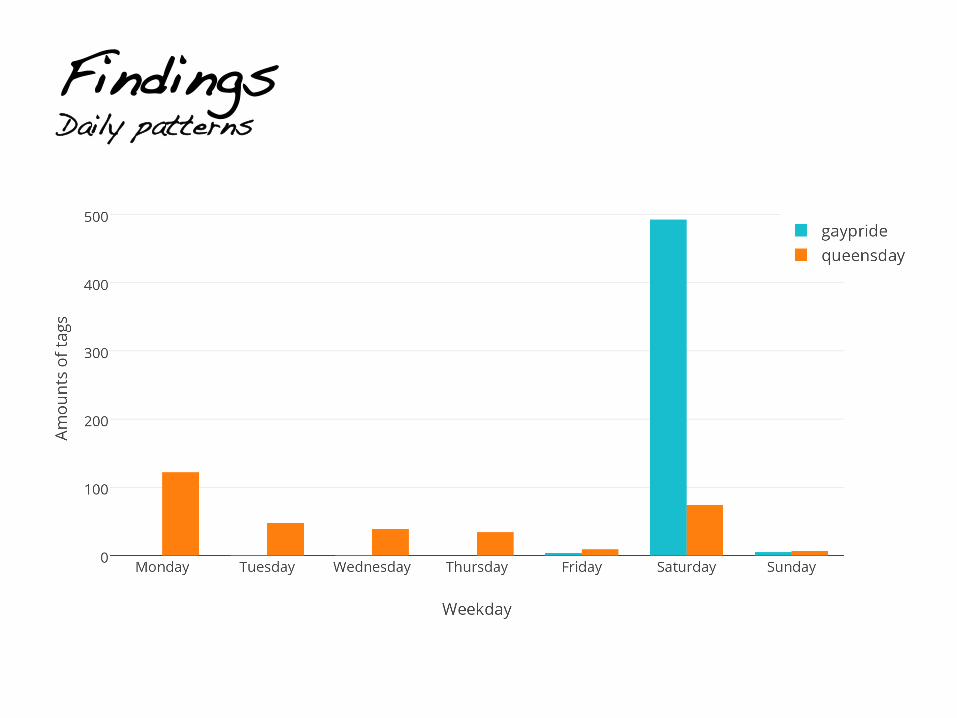
Findings!Daily patterns
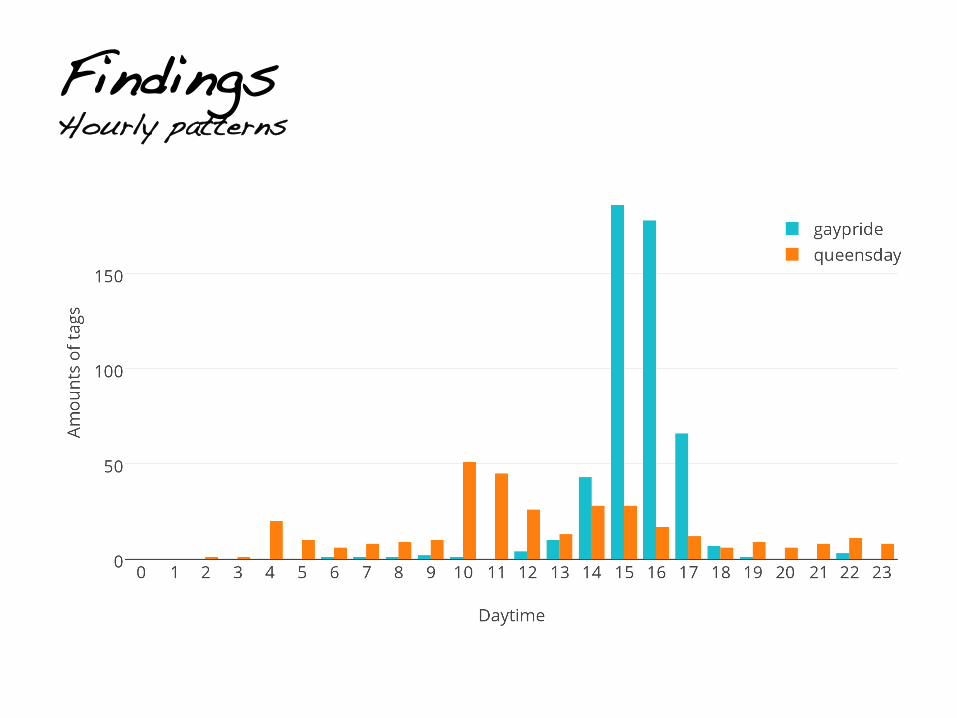
Findings!Hourly patterns
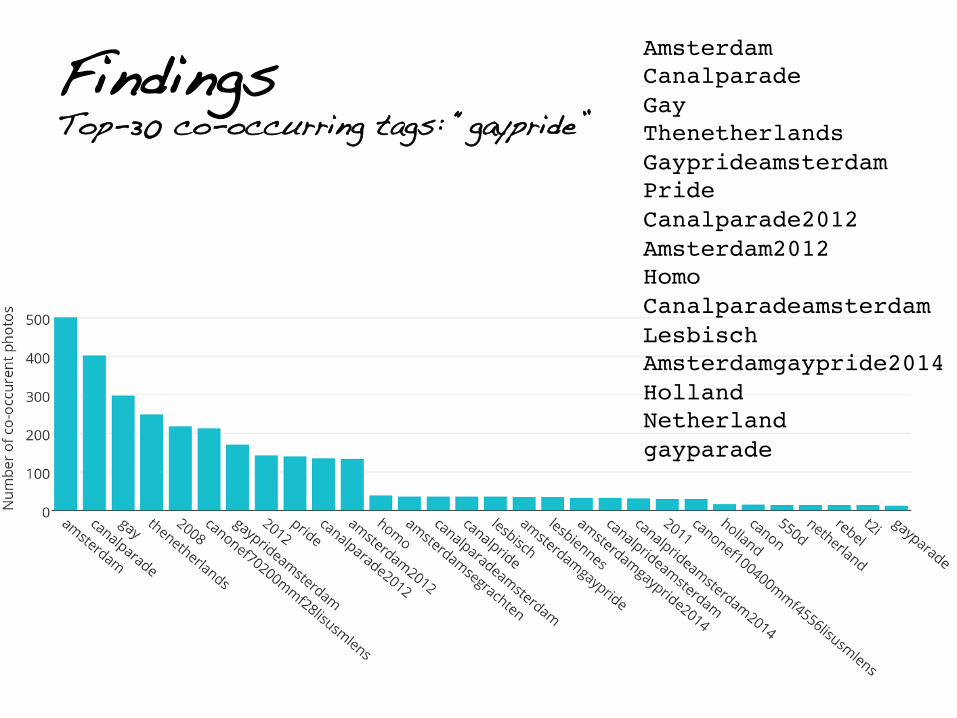
Findings!Top-30 co-occurring tags: “gaypride”
Amsterdam!Canalparade!Gay!Thenetherlands!Gayprideamsterdam!Pride!Canalparade2012!Amsterdam2012!Homo!Canalparadeamsterdam!Lesbisch!Amsterdamgaypride2014!Holland!Netherland!gayparade!
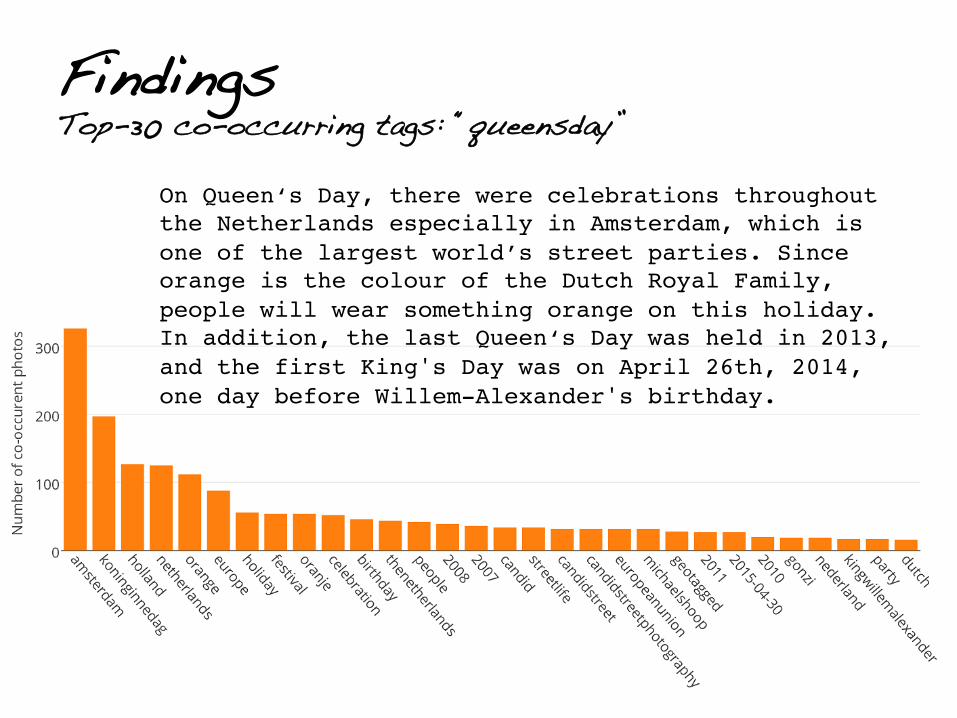
Findings!Top-30 co-occurring tags: “queensday”
On Queen‘s Day, there were celebrations throughout the Netherlands especially in Amsterdam, which is one of the largest world’s street parties. Since orange is the colour of the Dutch Royal Family, people will wear something orange on this holiday. In addition, the last Queen‘s Day was held in 2013, and the first King's Day was on April 26th, 2014, one day before Willem-Alexander's birthday.!
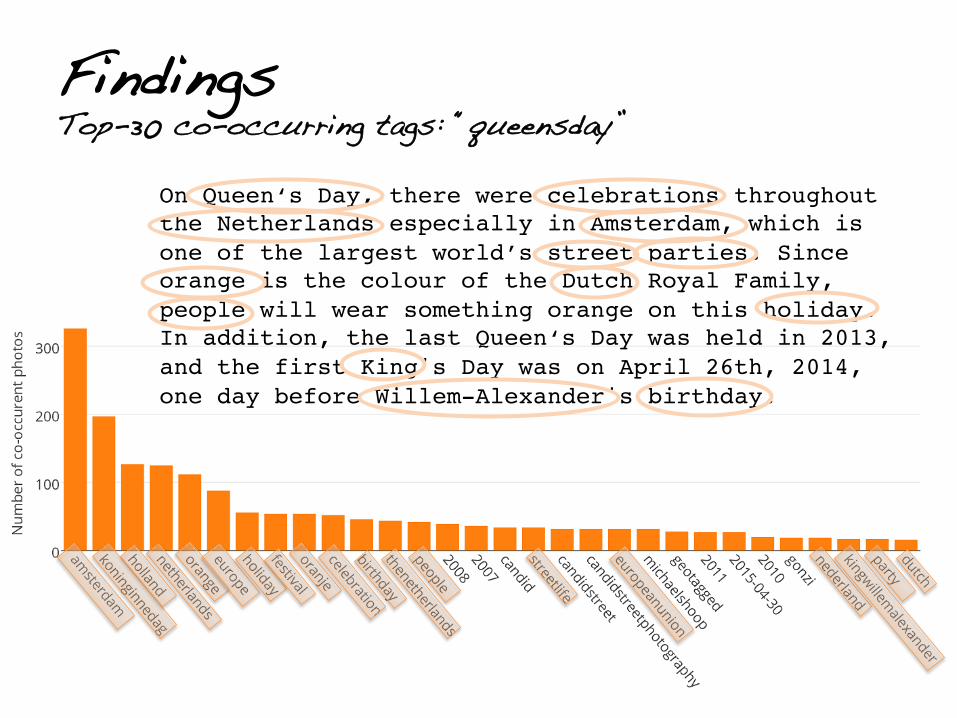
Findings!Correlation

Findings!Ratio of photos v.s Weather conditions
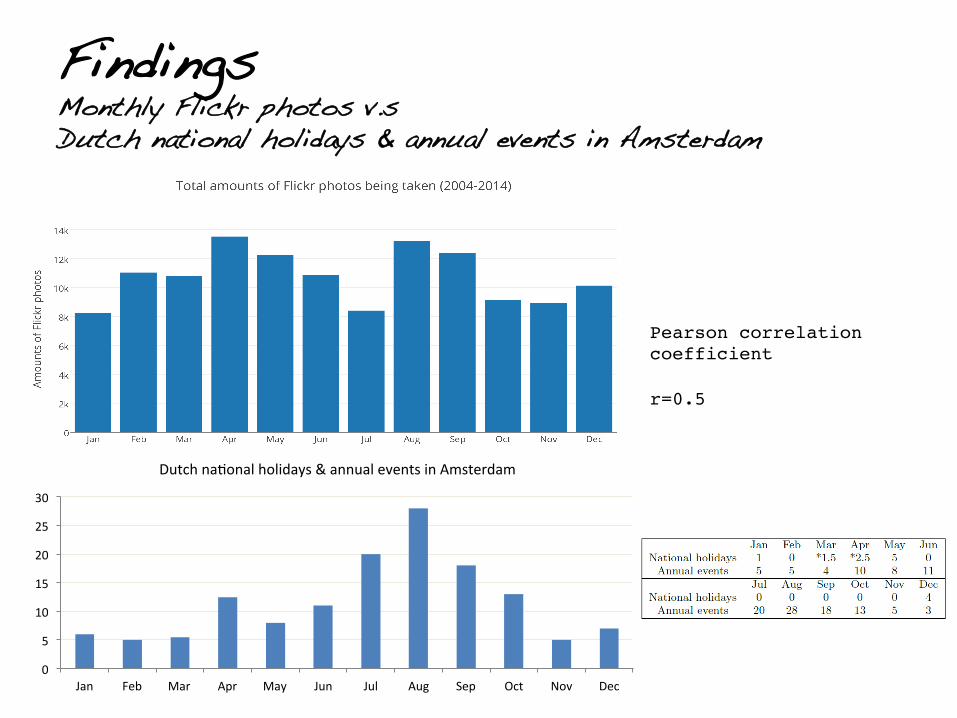
Findings!Monthly Flickr photos v.s !Dutch national holidays & annual events in Amsterdam
0
5
10
15
20
25
30
Jan Feb Mar Apr May Jun Jul Aug Sep Oct Nov Dec
Dutch na0onal holidays & annual events in Amsterdam
Pearson correlation coefficient!!r=0.5!
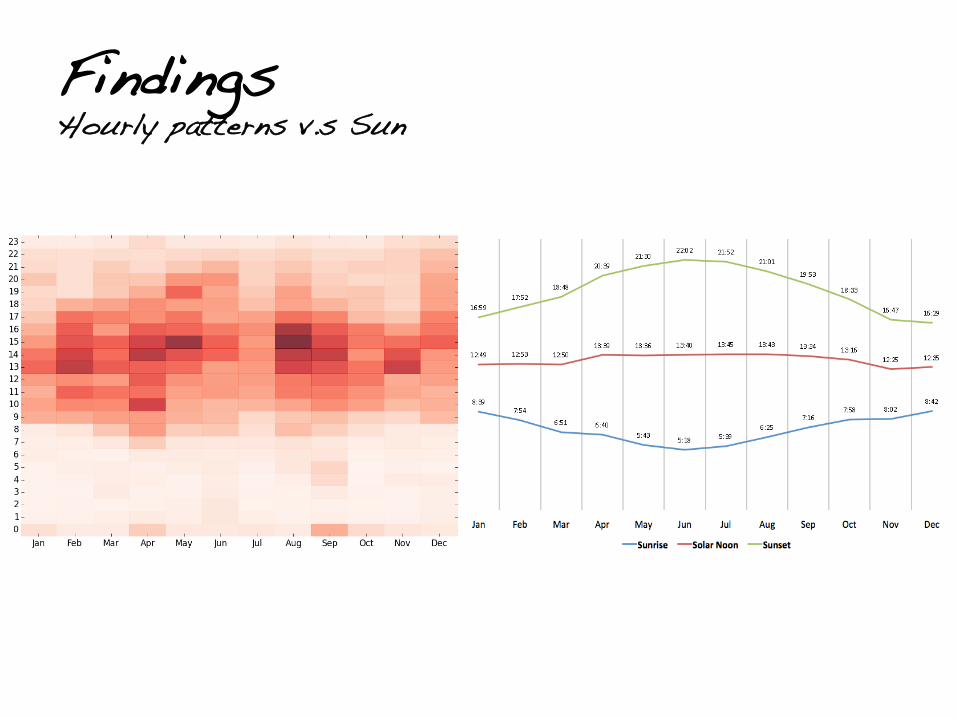
Findings!Hourly patterns v.s Sun
Discussion & Conclusions
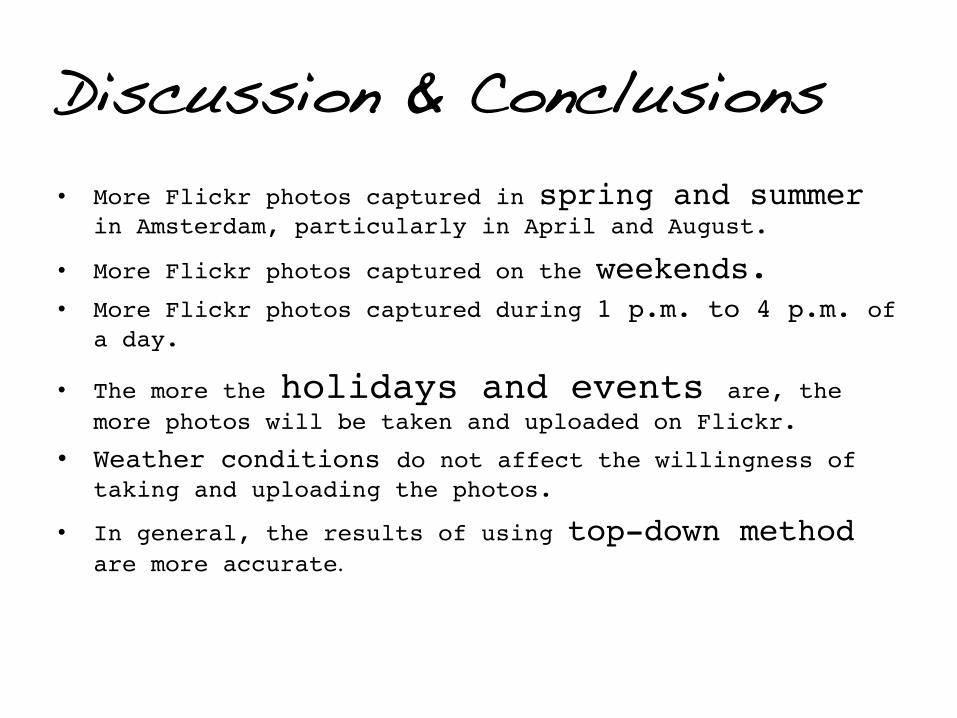
• More Flickr photos captured in spring and summer in Amsterdam, particularly in April and August. !
• More Flickr photos captured on the weekends.!• More Flickr photos captured during 1 p.m. to 4 p.m. of
a day.!
• The more the holidays and events are, the more photos will be taken and uploaded on Flickr. !
• Weather conditions do not affect the willingness of taking and uploading the photos.!
• In general, the results of using top-down method are more accurate.
Discussion & Conclusions!Future research • Language translations. !!• Applying other clustering measures.!!• Combining different modalities. ! E.g.: visual content extraction. !!• Gathering information from other social media sites.!!• Extracting geo-spatial information. !!• Interactive visualization!