thermography: high sensitivity and specificity diagnosing ... · fig. 2. a: weak positive (þ)...
TRANSCRIPT
lable at ScienceDirect
Allergology International xxx (xxxx) xxx
Contents lists avai
Allergology International
journal homepage: ht tp: / /www.elsevier .com/locate/al i t
Original Article
Thermography: High sensitivity and specificity diagnosing contactdermatitis in patch testing
Florian Anzengruber a, b, Fayez Alotaibi a, b, Lilian S. Kaufmann a, b, Adhideb Ghosh a, b, c,Martin R. Oswald d, Julia-Tatjana Maul a, b, Barbara Meier a, b, Lars E. French a, b,Mathias Bonmarin e, 1, Alexander A. Navarini a, b, c, *, 1
a Department of Dermatology, University Hospital Zurich, Zurich, Switzerlandb Faculty of Medicine, University of Zurich, Zurich, Switzerlandc Competence Center Personalized Medicine, University of Zurich and ETH Zurich, Zurich, Switzerlandd Department of Computer Science, University of Zurich and ETH Zurich, Zurich, Switzerlande School of Engineering, Zurich University of Applied Sciences, Winterthur, Switzerland
a r t i c l e i n f o
Article history:Received 4 September 2018Received in revised form31 October 2018Accepted 12 November 2018Available online xxx
Keywords:Allergic contact dermatitisContact allergyInfraredIrritant contact dermatitisPatch testing
Abbreviations:ACD allergic contact dermatitisFLIR forward-looking infraredIR irritant
* Corresponding author. Department of DermatologGloriastrasse 31, 8091, Zurich, Switzerland.
E-mail address: [email protected] (A.A. NPeer review under responsibility of Japanese Soci
1 Shared last authorship.
https://doi.org/10.1016/j.alit.2018.12.0011323-8930/Copyright © 2018, Japanese Society of Allelicenses/by-nc-nd/4.0/).
Please cite this article as: Anzengruber F etAllergology International, https://doi.org/10
a b s t r a c t
Background: Patch testing of contact allergens to diagnose allergic contact dermatitis (ACD) is a tradi-tional, useful tool. The most important decision is the distinction between allergic and irritant reactions,as this has direct implications on diagnosis and management. Our objective was to evaluate a newmethod of non-contact infrared reading of patch tests. Secondary objectives included a possible corre-lation between the intensity of the patch test reaction and temperature change.Methods: 420 positive reactions from patients were included in our study. An independent patch testreader assessed the positive reactions and classified them as allergic (of intensity þ to þþþ) or irritant(IR). At the same time, a forward-looking infrared (FLIR) camera attachment for an iPhone was used toacquire infrared thermal images of the patch tests, and images were analyzed using the FLIR ONE app.Results: Allergic patch test reactions were characterized by temperature increases of 0.72 ± 0.67 �Ccompared to surrounding skin. Irritant reactions only resulted in 0.17 ± 0.31 �C temperature increase. Themean temperature difference between the two groups was highly significant (p < 0.0001) and thereforewas used to predict the type of contact dermatitis.Conclusions: Thermography is a reliable and effective way to distinguish between allergic and irritantcontact dermatitis.Copyright © 2018, Japanese Society of Allergology. Production and hosting by Elsevier B.V. This is an open access
article under the CC BY-NC-ND license (http://creativecommons.org/licenses/by-nc-nd/4.0/).
Introduction
Eczema is a frequent symptom that can be the clinical expres-sion of allergic contact (ACD), non-allergic, irritant contactdermatitis or other inflammatory diseases. Patch testing is a valu-able clinical tool for identifying culprit substance(s) in patients withsuspected contact sensitization. Non-toxic substances known tohave allergenic potential are applied to the back of the patientunder occlusion for 48 h. Subsequently, the skin is evaluated forerythema, infiltration and vesicles/blisters. Later readings are
y, University Hospital Zurich,
avarini).ety of Allergology.
rgology. Production and hosting by Else
al., Thermography: High sens.1016/j.alit.2018.12.001
performed at 72 h, 96 h and sometimes even later. The interpre-tation of the test can be challenging, requires experience, andparticularly the distinction between irritant and allergic reactionscan be frequently difficult to make.1
In some cases, irritant reactions can be difficult to distinguishfrom mild allergic reactions. When patch tests are removed after48 h, the inflammation induced by irritants tends to declinewithin 24 h. This phenomenon is called the “decrescendo-phe-nomenon”. Vice versa, the intensity of inflammation caused byACD tends to increase, a phenomenon referred to as the “cre-scendo-phenomenon”.
Positive patch-tests contain skin lesions that are erythematous,infiltrated and can show vesicles. The latter is in part due to vaso-dilation and increased local blood circulation.2 The increased bloodflow suggests that the temperature of patch test lesions may bewarmer than the surrounding normal skin. Indeed, a few earlystudies with thermographic equipment have confirmed this
vier B.V. This is an open access article under the CC BY-NC-ND license (http://creativecommons.org/
itivity and specificity diagnosing contact dermatitis in patch testing,
F. Anzengruber et al. / Allergology International xxx (xxxx) xxx2
hypothesis.3e7 In the previous studies, erythematous, irritant lesionslead to an increased blood flow and thus to a mild increase in tem-perature, however allergic reactions were more intense and werecharacterized by a higher temperature increase, compared to sur-rounding skin, possibly because of a stronger vessel vasodilatation.
Recently mobile technology has produced at least two suffi-ciently accurate and portable solutions that technically wouldenable infrared patch test reading in the clinic. In consequence, wesought to study the potential utility of integrating an infraredcamera in the clinical routine of patch test evaluation. Hence, thisstudy had the purpose to evaluate if distinguishing betweenallergic and irritant patch test reactions is feasible by non-contactmeasurement of the skin temperature (thermography). The sec-ondary objective of the study was to determine if the severity of thepatch test reactions correlates to the increase of temperature.
Methods
Following informed consent (ethics commission number: KEK2017-647), a forward-looking infrared (FLIR) camera attachment foran iPhone 6S was used to acquire infrared thermal images andstandard digital images of 126 patients (Table 1) that presented tothe patch testing laboratory of the University Hospital Zurich(Department of Dermatology). 79 participants were male, 47 fe-male. On average, patients were 46 years of age ±16.6 years[18e82]. A total of 420 lesions were analyzed.
Only patients with an erythematous reaction reactions wereincluded. 2 min after removing the occlusive patches, the infraredcamera was held vertically and positioned approximately 20 cmfrom the skin's surface. The room temperature was steadily around21 �C. All erythematous lesions were analyzed. Independently, aphysician (who is not part of the study team) clinically evaluatedthe lesion (negative, IR, þ, þþ, þþþ) (Table 2).8,9
Assessing differences in temperature (Dt)
Then, the temperature of the lesion and the temperature of thefield besides it were assessed using an infrared image analysis tool
Table 1Demographics.
Total number of erythematous patchtest lesions
420
Irritant contact dermatitis 166Dt 0.17�C ± 0.31 [�1.0e1.5]*
Allergic contact dermatitis 254Dt 0.72�C ± 0.67 [�2.8e3.3]*
allergic contact dermatitis of intensity þ 153Dt 0.54�C ± 0.47 [�0.5e3]*
allergic contact dermatitis of intensity þþ 73Dt 0.96�C ± 0.67 [�1.2e3]*
allergic contact dermatitis of intensity þþþ 30Dt 1.03�C ± 1.16 [�2.8e3.3]*
Table 2Reading criteria for patch tests according to the International Contact DermatitisResearch Group (ICDRG)8 and the European Society of Contact Dermatitis.9
Symbol Morphology Diagnosis
� No reaction Negative reaction?þ Faint erythema only Doubtful reactionþ Erythema, infiltration, possibly papules Weak positive reactionþþ Erythema, infiltration, papules, vesicles Strong positive reactionþþþ Intense erythema, infiltrate,
coalescing vesiclesExtreme positive reaction
IR Various morphologies, e.g. soap effect,bulla, necrosis
Irritant reaction
Please cite this article as: Anzengruber F et al., Thermography: High sensAllergology International, https://doi.org/10.1016/j.alit.2018.12.001
and the app FLIR ONE (Version 20.52). The differences in temper-ature (Dt) were compared to the clinical evaluation (Fig. 2).
Statistical analysis and prediction of contact dermatitis
For statistical analysis, the Mann Whitney U test as well as theKruskal Wallis test were used. The Dt values were utilized forpredicting the type of contact dermatitis. There are different ap-proaches to analyze such data, which include powerful classifiers(e.g. support vector machine). However, boosting approaches canachieve the similar classification results with much less parametertweaking. Boosting starts with building a model from training dataand keeps on creating models in order to rectify the error fromprevious model(s) until either the training data is perfectly pre-dicted or the maximum number of models is reached. Thereforeboosting algorithm combines the predictions of several weaklearners into a strong classifier with better prediction accuracy.10 Inorder to successfully predict the binary classes of contact derma-titis, an adaptive boosting classifier was developed using the Ada-Boost method of R package caret.11
Results
Out of 420 lesions, 166 were clinically diagnosed as irritantcontact dermatitis and the remaining 254 as allergic contactdermatitis of various degrees. The difference in temperature be-tween a patch test clinically classified as an irritant reaction (Fig. 1)compared to adjacent, the mean change of temperature (Dt) ofirritant skin was 0.17 �C ± 0.31 [-1.0e1.5]. Patch tests classified asallergic reactions (Fig. 2) were warmer (mean D t ¼ 0.72 �C ± 0.67[-2.8e3.3]). Weak positive reactions (þ) had on average a change intemperature of 0.54 �C ± 0.47 [-0.5 - 3], strong positive reactions(þþ) showed an increase in temperature on average of0.96 �C ± 0.67 [-1.2 - 3] and extreme positive reactions (þþþ) were1.03 �C ± 1.16 [-2.8e3.3] warmer than the surrounding non affectedskin. Thermography revealed that the temperature of patch testlesions did correlate with the intensity of the allergic lesions, withthe exception of strong (þþ) and extreme strong (þþþ) reactions(Fig. 3A).
The Dt between irritant and allergic lesions was highly signifi-cant (p < 0.0001). Therefore, an adaptive boosting classifier wasbuilt using these Dt values. Multiple performance metrics wereselected to evaluate the classifier's performance. The area underreceiver operating characteristic (ROC) curve (Fig. 3B) of 0.85indicated high discriminative power of the classifier.
Also overall sensitivity and specificity of the classifier were0.84 and 0.83 respectively which portrayed how effectively
Fig. 1. Irritant reaction to sodium dodecyl sulfate (irritant lesion) showing a minorincrease in temperature of 0.1 �C (1) clinical picture, 2) infrared picture 3) measure-ment of temperature difference).
itivity and specificity diagnosing contact dermatitis in patch testing,
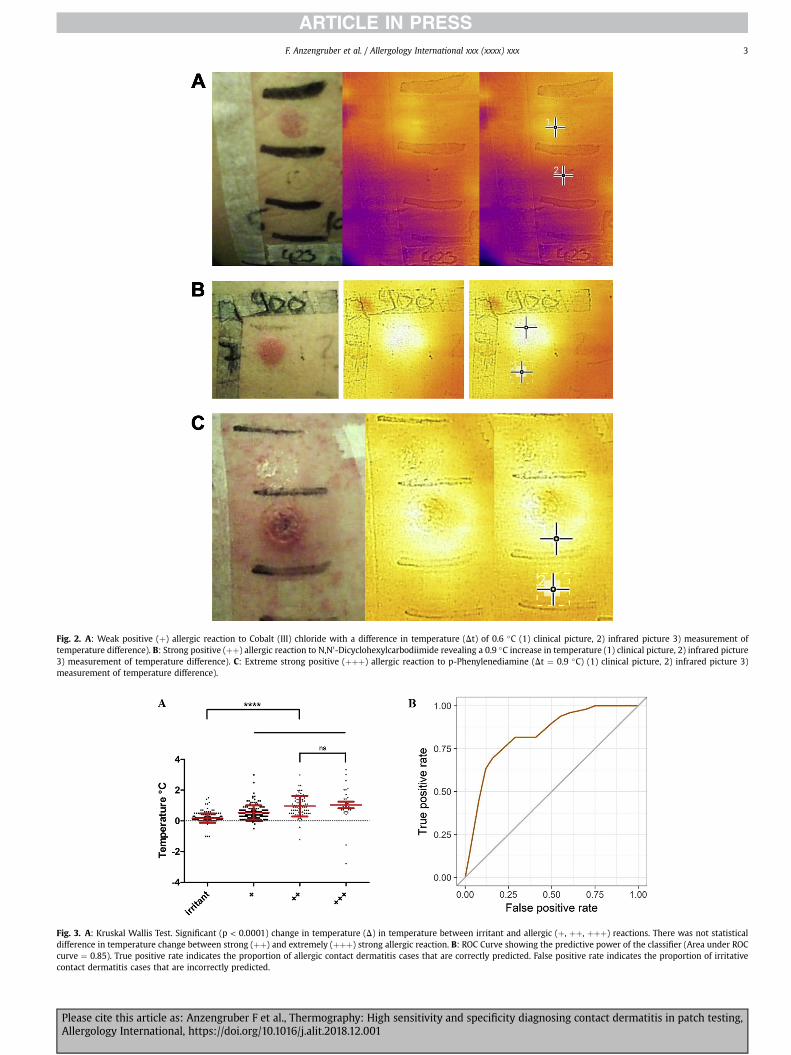
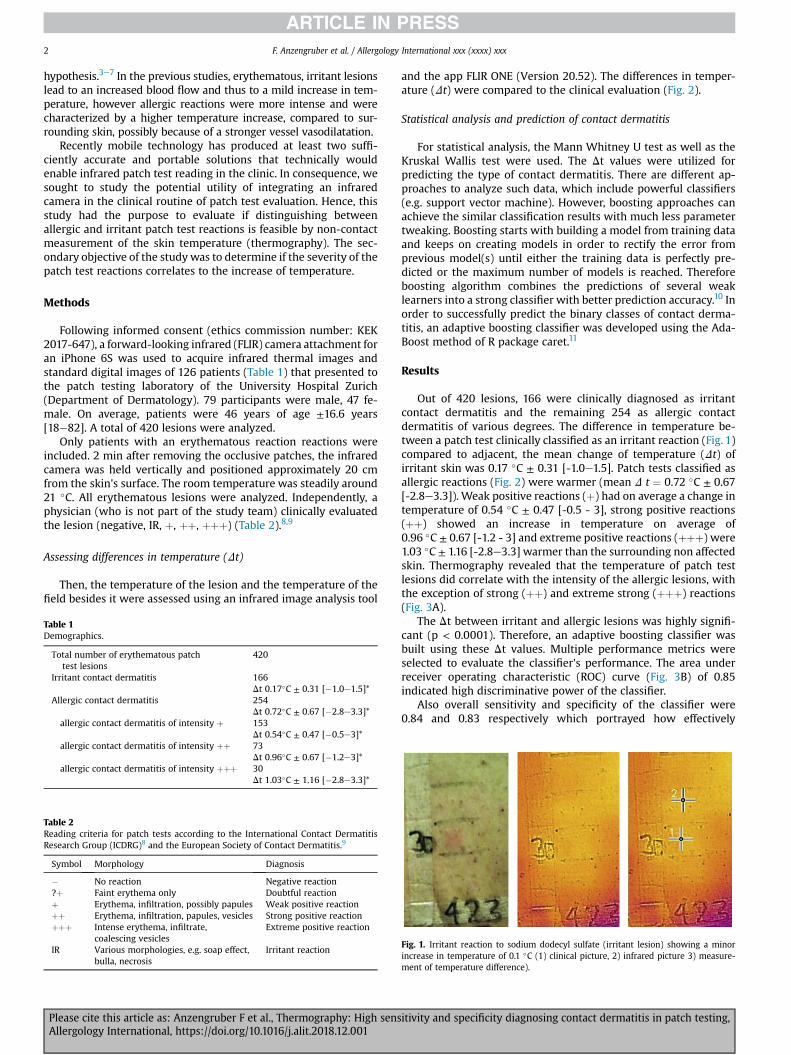
Fig. 2. A: Weak positive (þ) allergic reaction to Cobalt (III) chloride with a difference in temperature (Dt) of 0.6 �C (1) clinical picture, 2) infrared picture 3) measurement oftemperature difference). B: Strong positive (þþ) allergic reaction to N,N0-Dicyclohexylcarbodiimide revealing a 0.9 �C increase in temperature (1) clinical picture, 2) infrared picture3) measurement of temperature difference). C: Extreme strong positive (þþþ) allergic reaction to p-Phenylenediamine (Dt ¼ 0.9 �C) (1) clinical picture, 2) infrared picture 3)measurement of temperature difference).
Fig. 3. A: Kruskal Wallis Test. Significant (p < 0.0001) change in temperature (D) in temperature between irritant and allergic (þ, þþ, þþþ) reactions. There was not statisticaldifference in temperature change between strong (þþ) and extremely (þþþ) strong allergic reaction. B: ROC Curve showing the predictive power of the classifier (Area under ROCcurve ¼ 0.85). True positive rate indicates the proportion of allergic contact dermatitis cases that are correctly predicted. False positive rate indicates the proportion of irritativecontact dermatitis cases that are incorrectly predicted.
F. Anzengruber et al. / Allergology International xxx (xxxx) xxx 3
Please cite this article as: Anzengruber F et al., Thermography: High sensitivity and specificity diagnosing contact dermatitis in patch testing,Allergology International, https://doi.org/10.1016/j.alit.2018.12.001
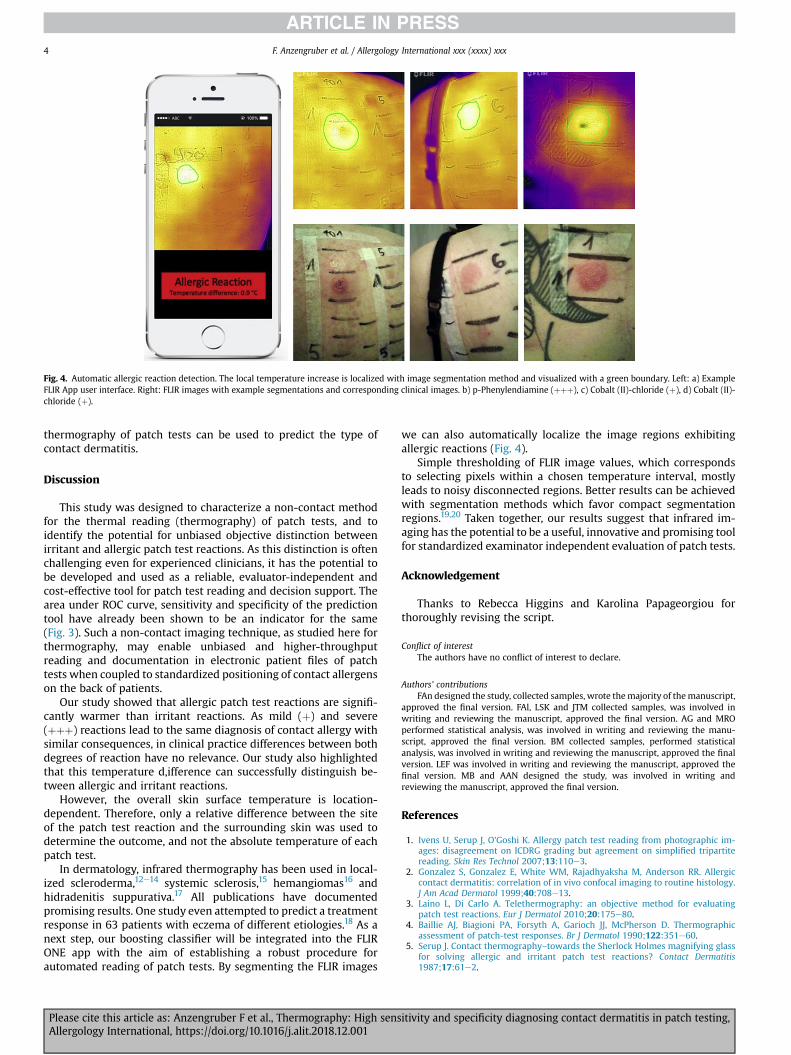
Fig. 4. Automatic allergic reaction detection. The local temperature increase is localized with image segmentation method and visualized with a green boundary. Left: a) ExampleFLIR App user interface. Right: FLIR images with example segmentations and corresponding clinical images. b) p-Phenylendiamine (þþþ), c) Cobalt (II)-chloride (þ), d) Cobalt (II)-chloride (þ).
F. Anzengruber et al. / Allergology International xxx (xxxx) xxx4
thermography of patch tests can be used to predict the type ofcontact dermatitis.
Discussion
This study was designed to characterize a non-contact methodfor the thermal reading (thermography) of patch tests, and toidentify the potential for unbiased objective distinction betweenirritant and allergic patch test reactions. As this distinction is oftenchallenging even for experienced clinicians, it has the potential tobe developed and used as a reliable, evaluator-independent andcost-effective tool for patch test reading and decision support. Thearea under ROC curve, sensitivity and specificity of the predictiontool have already been shown to be an indicator for the same(Fig. 3). Such a non-contact imaging technique, as studied here forthermography, may enable unbiased and higher-throughputreading and documentation in electronic patient files of patchtests when coupled to standardized positioning of contact allergenson the back of patients.
Our study showed that allergic patch test reactions are signifi-cantly warmer than irritant reactions. As mild (þ) and severe(þþþ) reactions lead to the same diagnosis of contact allergy withsimilar consequences, in clinical practice differences between bothdegrees of reaction have no relevance. Our study also highlightedthat this temperature d,ifference can successfully distinguish be-tween allergic and irritant reactions.
However, the overall skin surface temperature is location-dependent. Therefore, only a relative difference between the siteof the patch test reaction and the surrounding skin was used todetermine the outcome, and not the absolute temperature of eachpatch test.
In dermatology, infrared thermography has been used in local-ized scleroderma,12e14 systemic sclerosis,15 hemangiomas16 andhidradenitis suppurativa.17 All publications have documentedpromising results. One study even attempted to predict a treatmentresponse in 63 patients with eczema of different etiologies.18 As anext step, our boosting classifier will be integrated into the FLIRONE app with the aim of establishing a robust procedure forautomated reading of patch tests. By segmenting the FLIR images
Please cite this article as: Anzengruber F et al., Thermography: High sensAllergology International, https://doi.org/10.1016/j.alit.2018.12.001
we can also automatically localize the image regions exhibitingallergic reactions (Fig. 4).
Simple thresholding of FLIR image values, which correspondsto selecting pixels within a chosen temperature interval, mostlyleads to noisy disconnected regions. Better results can be achievedwith segmentation methods which favor compact segmentationregions.19,20 Taken together, our results suggest that infrared im-aging has the potential to be a useful, innovative and promising toolfor standardized examinator independent evaluation of patch tests.
Acknowledgement
Thanks to Rebecca Higgins and Karolina Papageorgiou forthoroughly revising the script.
Conflict of interestThe authors have no conflict of interest to declare.
Authors’ contributionsFAn designed the study, collected samples, wrote themajority of themanuscript,
approved the final version. FAl, LSK and JTM collected samples, was involved inwriting and reviewing the manuscript, approved the final version. AG and MROperformed statistical analysis, was involved in writing and reviewing the manu-script, approved the final version. BM collected samples, performed statisticalanalysis, was involved in writing and reviewing the manuscript, approved the finalversion. LEF was involved in writing and reviewing the manuscript, approved thefinal version. MB and AAN designed the study, was involved in writing andreviewing the manuscript, approved the final version.
References
1. Ivens U, Serup J, O'Goshi K. Allergy patch test reading from photographic im-ages: disagreement on ICDRG grading but agreement on simplified tripartitereading. Skin Res Technol 2007;13:110e3.
2. Gonzalez S, Gonzalez E, White WM, Rajadhyaksha M, Anderson RR. Allergiccontact dermatitis: correlation of in vivo confocal imaging to routine histology.J Am Acad Dermatol 1999;40:708e13.
3. Laino L, Di Carlo A. Telethermography: an objective method for evaluatingpatch test reactions. Eur J Dermatol 2010;20:175e80.
4. Baillie AJ, Biagioni PA, Forsyth A, Garioch JJ, McPherson D. Thermographicassessment of patch-test responses. Br J Dermatol 1990;122:351e60.
5. Serup J. Contact thermography–towards the Sherlock Holmes magnifying glassfor solving allergic and irritant patch test reactions? Contact Dermatitis1987;17:61e2.
itivity and specificity diagnosing contact dermatitis in patch testing,

F. Anzengruber et al. / Allergology International xxx (xxxx) xxx 5
6. Agner T, Serup J. Contact thermography for assessment of skin damage due toexperimental irritants. Acta Derm Venereol 1988;68:192e5.
7. Stuttgen G, Flesch U, Witt H, Wendt H. Thermographic analysis of skin testreaction using AGA thermovision. Arch Dermatol Res 1980;268:113e28.
8. Fregert S. Manual of Contact Dermatitis. Copenhagen: Munksgaard; 1974.9. Johansen JD, Aalto-Korte K, Agner T, Andersen KE, Bircher A, Bruze M, et al.
European Society of Contact Dermatitis guideline for diagnostic patch testing -recommendations on best practice. Contact Dermatitis 2015;73:195e221.
10. Freund YSRE. Experiments with a new boosting algorithm. 13th InternationalConference on Machine Learning; 1996;148e56.
11. Kuhn M. Building predictive models in R using the caret package. J Stat Softw2008;28:1e26.
12. Howell KJ, Lavorato A, Visentin MT, Smith RE, Schaefer G, Jones CD, et al.Validation of a protocol for the assessment of skin temperature and blood flowin childhood localised scleroderma. Skin Res Technol 2009;15:346e56.
13. Weibel L, Howell KJ, Visentin MT, Rudiger A, Denton CP, Zulian F, et al. LaserDoppler flowmetry for assessing localized scleroderma in children. ArthritisRheum 2007;56:3489e95.
Please cite this article as: Anzengruber F et al., Thermography: High sensAllergology International, https://doi.org/10.1016/j.alit.2018.12.001
14. Garcia-Romero MT, Randhawa HK, Laxer R, Pope E. The role of local temper-ature and other clinical characteristics of localized scleroderma as markers ofdisease activity. Int J Dermatol 2017;56:63e7.
15. Nowicka D. Thermography improves clinical assessment in patients with sys-temic sclerosis treated with ozone therapy. Biomed Res Int 2017;2017:5842723.
16. Garcia-Romero MT, Chakkittakandiyil A, Pope E. The role of infrared ther-mography in evaluation of proliferative infantile hemangiomas. Results of apilot study. Int J Dermatol 2014;53:e216e7.
17. Polidori G, Renard Y, Lorimier S, Pron H, Derruau S, Taiar R. Medical InfraredThermography assistance in the surgical treatment of axillary HidradenitisSuppurativa: a case report. Int J Surg Case Rep 2017;34:56e9.
18. Dzhevaga VN. [Infrared thermography in the diagnosis and assessment oftreatment efficacy in patients with eczema nad allergic dermatitis]. Lik Sprava1992:95e8 [in Russian].
19. Unger M, Pock T, Trobin W, Cremers D, Bischof H. TVSeg - interactive totalvariation based image segmentation. BMVC 2008:1e10.
20. Boykov YY, Jolly MP. Interactive graph cuts for optimal boundary region seg-mentation of objects in n-d images. ICCV 2001;1:105e12.
itivity and specificity diagnosing contact dermatitis in patch testing,