thermo-environmental life cycle assessment of hydrogen...
TRANSCRIPT
Energy for Sustainable Development 37 (2017) 66–78
Contents lists available at ScienceDirect
Energy for Sustainable Development
Thermo-environmental life cycle assessment of hydrogen productionby autothermal reforming of bioethanol
Zouhour Khila a, Ines Baccar a,b, Intidhar Jemel a,b, Noureddine Hajjaji a,⁎a Unité de Recherche Catalyse et Matériaux pour l'Environnement et les Procédés URCMEP (UR11ES85), Ecole Nationale d'Ingénieurs de Gabès, Université de Gabès, Rue Omar Ibn Alkhattab, 6029Gabès, Tunisiab Institut Supèrieur des Etudes Technologiques de Gabès, Route de Medenine, 6011 Gabès, Tunisia
⁎ Corresponding author.E-mail address: [email protected] (N. Hajjaji).
http://dx.doi.org/10.1016/j.esd.2016.12.0030973-0826/© 2017 International Energy Initiative. Publish
a b s t r a c t
a r t i c l e i n f oArticle history:Received 29 February 2016Revised 23 November 2016Accepted 29 December 2016Available online xxxx
This paper proposes amethodologydevoted tofinding and selectingmore accurate conditions for sustainable hy-drogen production via autothermal reforming of bioethanol. This methodology implies entire hydrogen produc-tion process design and simulation, energetic, exergetic and environmental life cycle assessment analysis studiesand parametric (intuitive and design of experiment based methods) investigations.A base-case process operating under conditions recommended by simple investigation of chemical reactions wasthoroughly studied. The results show that this base case process suffers from low performance. This is becausethe energetic, exergetic and environmental performances are comparatively lower than similar findings previ-ously reported by other researchers for other reformates. The parametric investigation indicates that the processperformances could be ensured by a proper and rational combination of the reactor temperature and the steam-to-carbon ratio. A key outcome of this research lies in establishing of second order mathematical models. Thesemodels can rapidly estimate the process performances (energetic, exergetic and environmental) based on tem-perature and the steam-to-carbon ratio.This paper recommends a reforming a temperature of 800 °C and a steam-to-carbon ratio of 4 as the accurateconditions for autothermal reforming of bioethanol. Such conditions ensure not only the lowest consumptionof energy to generate a given amount of hydrogen but also the best environmental performance of the entiresystem.
© 2017 International Energy Initiative. Published by Elsevier Inc. All rights reserved.
Keywords:HydrogenBioethanolAutothermal reformingExergyLife cycle assessment
Introduction
Dependence on fossil hydrocarbon fuels as the main energy sourceshas led to not only serious energy crisis but also environmental pollu-tions. The only way to resolve these problems is to move towards alter-native, renewable, efficient and cost-effective energy sources with lessenvironmental impacts. Hydrogen is, currently, considered as one ofthe leading candidates in the search for an alternative to fossil fuels(FF). Nevertheless, H2 is only an energy carrier like electricity and nota primary energy source. H2 can be produced from awide variety of en-ergy sources, such as natural gas, coal, biomass, solar (thermal and pho-tovoltaic), etc. (Martinez-Frias, 2003). Despite all the effortmade, 96% ofthe produced H2 in the world comes from FF, with a considerableamount of CO2 produced emissions in these processes (Abánadeset al., 2013). FF-to-H2 system appears to have limited horizons, andthe development and implementation of new methods for eco-friendly H2 production, especially from biorenewable feedstocks, are
ed by Elsevier Inc. All rights reserved
absolutely required. Therefore, there has been, recently, a significantamount of research going on to produce H2 efficiently at low cost andminimum environmental impact from renewable sources.
Among various renewable feedstock alternatives for H2 production,bioethanol has attracted much attention because of its relatively highH2 content, availability, ease of storage, handling and safety, includingits low comparative toxicity (Hou et al., 2015). Moreover, bioethanolcan be produced renewably from several biomass sources such as(i) sugar or starch crops (sugar beet, sugar cane, corn and wheat, etc.),(ii) lignocellulosic biomass, and (iii) algae biomass (Lee and Kim,2013). It should be noted that usingH2 from bioethanol ismore efficientthan bioethanol used directly in internal combustion engines and/orblended with gasoline (Seelam et al., 2012). The upgrading of rawbioethanol (crude bioethanol) requires various purification steps priorto be blended with gasoline or supplied to an internal combustion en-gine (Seelam et al., 2012). In fact, fuel grade bioethanol needs to bewater-free. Thus the purification requires distillation beyond theazeotropic point, and this is one of the major production costs of fuel-grade ethanol, consuming almost 3/4 of the energy used in thebioethanol production process (Ni et al., 2007; Rass-Hansen et al.,
.
67Z. Khila et al. / Energy for Sustainable Development 37 (2017) 66–78
2008; Mondal et al., 2015). Therefore, the use of raw bioethanol as afeedstock in H2 production will minimize the heat consumption duringthe distillation process.
Several catalytic processes have been developed in recent years toconvert bioethanol-to-H2 by different routes, such as catalytic steamreforming (SR), partial oxidation (POX), autothermal reforming (ATR),CO2 reforming, etc. Among these reforming processes, the ATR has re-ceived much attention in research during the recent years as a viableprocess for H2 generation for fuel cell systems (Divins et al., 2013).ATR or, more generally denoted oxidative steam reforming, is a combi-nation of SR and POX reactions. This combination is considered as one ofthe most attractive options for the on-board reforming of complex hy-drocarbons. ATR has been suggested to ameliorate the difficulties ofsteam reforming. Specifically, autothermal reforming overcomes thesteamreforming limitations of high temperature operations and fast dy-namic responses. Additionally, an autothermal reformer can reduce thesize, weight, start-up, shut-down, and other dynamic response times(Ahmed and Krumpelt, 2001). For these reasons, many efforts havebeen made to improve H2 productivity in the ATR of ethanol. However,most of the efforts in this field have been focused on thermodynamic in-vestigations of the bioethanol ATR reaction and/or researching catalysisin this system, but little attention has been devoted to the energetic andenvironmental performances of an entire system that includes all of thesteps involved in the production of H2 via ATR of bioethanol.
In recent decades, there has been an increasing interest in using bothenergy and exergy analysis modeling techniques for energy-utilizationassessments. The energy analysis is the basicmethod of a process inves-tigation. It is based on the first lawof thermodynamics, which expressesthe principle of the conservation of energy. Energy analysis has some in-herent limitations, such as not accounting for degradation of the qualityof energy through dissipative processes, and does not characterize theirreversibility of operations within the process (Wang et al., 2010).The exergy analysis is a modern thermodynamic method used as an ad-vanced tool for process evaluation (Szargut et al., 1998). Based on boththe first and the second laws of thermodynamics, exergy analysis com-pensates for the inability of the energy analysis to reveal the losses ofenergy due to its thermodynamic imperfections, and it plays uniqueroles in revealing the reasons for, location of and direction of improve-ment for losses. Therefore, exergy analysis has been widely used in re-cent years in assessing the performance of various bioenergyproduction processes. For example, Modarresi and colleagues(Modarresi et al., 2010) applied exergy analysis to a novel process for bi-ological production of H2 from biomass employing thermophilic andphoto-heterotrophic bacteria. The authors obtained a chemicalexergetic efficiency of 36–45% without considering any heat and pro-cess integration. In another study, Li and co-workers (Li et al., 2015)established a theoretical framework for the exergy analysis and advancedexergy analysis of a real biomass boiler. They showed that the maximumexergy destruction occurs in the combustion process, followed by thewaterwalls and radiant superheater and the low temperature superheat-er. Most recently, Karellas and Braimakis (2015) have performed anenergy–exergy analysis and economic investigation of a cogenerationand trigeneration organic Rankine cycle - vapor compression cycle hybridsystem utilizing biomass fuel and solar power. Their results showed that,in the base case scenario, the net electric efficiency is 2.38%, with an elec-tricity output equal to 1.42 kWe and a heating output of 53.5 kWth.
One of the most important criteria to inform decision-makers on themost sustainable options for process design is the evaluation of the envi-ronmental impacts. In this context, life cycle assessment (LCA)methodol-ogy could be used in parallel with the process design for finding andassessing technical solutions that could be adopted in the production pro-cess for reducing the environmental impacts (Hajjaji, 2014). LCA is a ho-listic method that assesses the impact of a product by considering allstages of its life cycle. LCA is considered as a “cradle to grave”method ofassessing resource use and emissions to the environment from the ex-traction of resources through manufacturing, transportation, operation
and recycling or final disposal (Guinée et al., 2002). LCA has been exten-sively applied as a design-support tool for highlighting environmentalcriticalities and improvement solutions in the life cycle of bio-based ener-gy systems such as H2 (Hajjaji, 2014), bioethanol (Morales et al., 2015),biogas (Tufvesson et al., 2013), biodiesel (Castanheira et al., 2015) andsecond generation biofuels (Lindorfer et al., 2014).
Themain objective of this study is to provide accurate conditions forsustainable H2 production via ATR of bioethanol. Indeed, for this pur-pose, a comprehensive thermo-environmental study of an H2 produc-tion system from bioethanol has been carried out based on energeticand exergetic analyses and environmental assessment.
Materials and methods
In this study, various assessment tools are simultaneously applied toinvestigate aH2 production systembyATR of bioethanol. These tools areused to design and simulate the entire H2 production process. The sim-ulation results are used to investigate the energetic and exergetic per-formances and to study the environmental performance using LCAmethodology. Another relevant aspect of this research is a supportingparametric investigation. The process operating parameters are variedto illustrate their influence on the system energetic, exergetic and envi-ronmental performance and to provide guidance for future research anddevelopment efforts in process design. The variation of parameters wasperformed using two methods: (1) the intuitive method, where thelevels of all parameters except one are fixed and the response is mea-sured for several values of the varied parameter, and (2) a factorial De-sign of Experiments (DOE) method. To the best of the authors'knowledge, the combination of these tools has not been considered inthe past and constitutes a key aspect of this research.
Process design and simulation
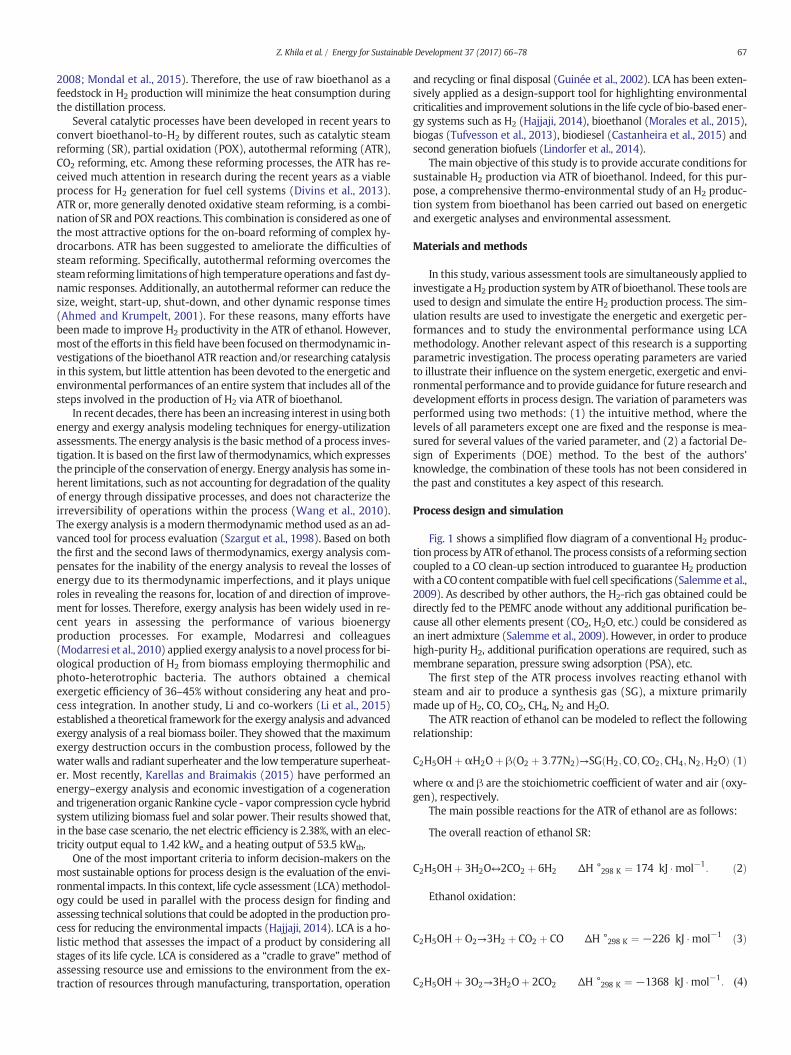
Fig. 1 shows a simplified flow diagram of a conventional H2 produc-tion process byATRof ethanol. The process consists of a reforming sectioncoupled to a CO clean-up section introduced to guarantee H2 productionwith a CO content compatiblewith fuel cell specifications (Salemmeet al.,2009). As described by other authors, the H2-rich gas obtained could bedirectly fed to the PEMFC anode without any additional purification be-cause all other elements present (CO2, H2O, etc.) could be considered asan inert admixture (Salemme et al., 2009). However, in order to producehigh-purity H2, additional purification operations are required, such asmembrane separation, pressure swing adsorption (PSA), etc.
The first step of the ATR process involves reacting ethanol withsteam and air to produce a synthesis gas (SG), a mixture primarilymade up of H2, CO, CO2, CH4, N2 and H2O.
The ATR reaction of ethanol can be modeled to reflect the followingrelationship:
C2H5OHþ αH2Oþ β O2 þ 3:77N2ð Þ→SG H2;CO;CO2;CH4;N2;H2Oð Þ ð1Þwhere α and β are the stoichiometric coefficient of water and air (oxy-gen), respectively.
The main possible reactions for the ATR of ethanol are as follows:
The overall reaction of ethanol SR:
C2H5OHþ 3H2O↔2CO2 þ 6H2 ΔH °298 K ¼ 174 kJ �mol−1: ð2Þ
Ethanol oxidation:
C2H5OHþ O2→3H2 þ CO2 þ CO ΔH °298 K ¼ −226 kJ �mol−1 ð3Þ
C2H5OHþ 3O2→3H2Oþ 2CO2 ΔH °298 K ¼ −1368 kJ �mol−1: ð4Þ(4)
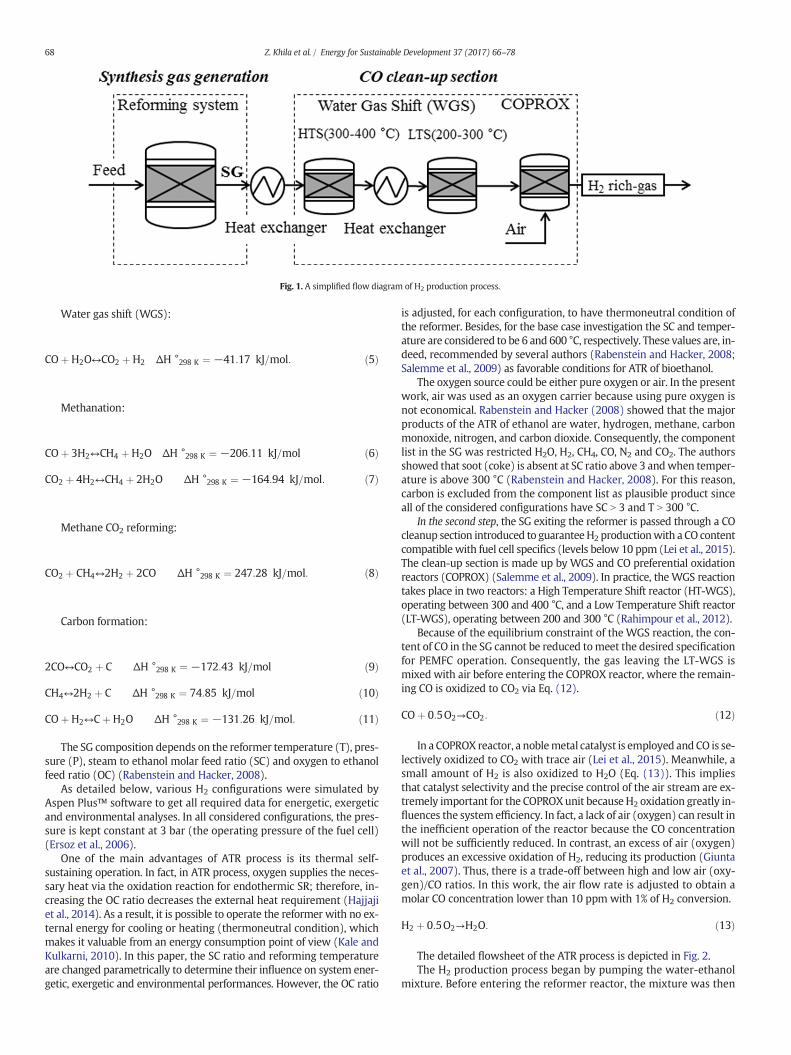
Fig. 1. A simplified flow diagram of H2 production process.
68 Z. Khila et al. / Energy for Sustainable Development 37 (2017) 66–78
Water gas shift (WGS):
COþH2O↔CO2 þH2 ΔH °298 K ¼ −41:17 kJ=mol: ð5Þ
Methanation:
COþ 3H2↔CH4 þH2O ΔH °298 K ¼ −206:11 kJ=mol ð6Þ
CO2 þ 4H2↔CH4 þ 2H2O ΔH °298 K ¼ −164:94 kJ=mol: ð7Þ
Methane CO2 reforming:
CO2 þ CH4↔2H2 þ 2CO ΔH °298 K ¼ 247:28 kJ=mol: ð8Þ
Carbon formation:
2CO↔CO2 þ C ΔH °298 K ¼ −172:43 kJ=mol ð9Þ
CH4↔2H2 þ C ΔH °298 K ¼ 74:85 kJ=mol ð10Þ
COþH2↔CþH2O ΔH °298 K ¼ −131:26 kJ=mol: ð11Þ
The SG composition depends on the reformer temperature (T), pres-sure (P), steam to ethanol molar feed ratio (SC) and oxygen to ethanolfeed ratio (OC) (Rabenstein and Hacker, 2008).
As detailed below, various H2 configurations were simulated byAspen Plus™ software to get all required data for energetic, exergeticand environmental analyses. In all considered configurations, the pres-sure is kept constant at 3 bar (the operating pressure of the fuel cell)(Ersoz et al., 2006).
One of the main advantages of ATR process is its thermal self-sustaining operation. In fact, in ATR process, oxygen supplies the neces-sary heat via the oxidation reaction for endothermic SR; therefore, in-creasing the OC ratio decreases the external heat requirement (Hajjajiet al., 2014). As a result, it is possible to operate the reformer with no ex-ternal energy for cooling or heating (thermoneutral condition), whichmakes it valuable from an energy consumption point of view (Kale andKulkarni, 2010). In this paper, the SC ratio and reforming temperatureare changed parametrically to determine their influence on system ener-getic, exergetic and environmental performances. However, the OC ratio
is adjusted, for each configuration, to have thermoneutral condition ofthe reformer. Besides, for the base case investigation the SC and temper-ature are considered to be 6 and 600 °C, respectively. These values are, in-deed, recommended by several authors (Rabenstein and Hacker, 2008;Salemme et al., 2009) as favorable conditions for ATR of bioethanol.
The oxygen source could be either pure oxygen or air. In the presentwork, air was used as an oxygen carrier because using pure oxygen isnot economical. Rabenstein and Hacker (2008) showed that the majorproducts of the ATR of ethanol are water, hydrogen, methane, carbonmonoxide, nitrogen, and carbon dioxide. Consequently, the componentlist in the SG was restricted H2O, H2, CH4, CO, N2 and CO2. The authorsshowed that soot (coke) is absent at SC ratio above 3 andwhen temper-ature is above 300 °C (Rabenstein and Hacker, 2008). For this reason,carbon is excluded from the component list as plausible product sinceall of the considered configurations have SC N 3 and T N 300 °C.
In the second step, the SG exiting the reformer is passed through a COcleanup section introduced to guaranteeH2 productionwith a CO contentcompatible with fuel cell specifics (levels below 10 ppm (Lei et al., 2015).The clean-up section is made up by WGS and CO preferential oxidationreactors (COPROX) (Salemme et al., 2009). In practice, the WGS reactiontakes place in two reactors: a High Temperature Shift reactor (HT-WGS),operating between 300 and 400 °C, and a Low Temperature Shift reactor(LT-WGS), operating between 200 and 300 °C (Rahimpour et al., 2012).
Because of the equilibrium constraint of the WGS reaction, the con-tent of CO in the SG cannot be reduced tomeet the desired specificationfor PEMFC operation. Consequently, the gas leaving the LT-WGS ismixed with air before entering the COPROX reactor, where the remain-ing CO is oxidized to CO2 via Eq. (12).
COþ 0:5O2→CO2: ð12Þ
In a COPROX reactor, a noblemetal catalyst is employed and CO is se-lectively oxidized to CO2 with trace air (Lei et al., 2015). Meanwhile, asmall amount of H2 is also oxidized to H2O (Eq. (13)). This impliesthat catalyst selectivity and the precise control of the air stream are ex-tremely important for the COPROXunit because H2 oxidation greatly in-fluences the system efficiency. In fact, a lack of air (oxygen) can result inthe inefficient operation of the reactor because the CO concentrationwill not be sufficiently reduced. In contrast, an excess of air (oxygen)produces an excessive oxidation of H2, reducing its production (Giuntaet al., 2007). Thus, there is a trade-off between high and low air (oxy-gen)/CO ratios. In this work, the air flow rate is adjusted to obtain amolar CO concentration lower than 10 ppm with 1% of H2 conversion.
H2 þ 0:5O2→H2O: ð13Þ
The detailed flowsheet of the ATR process is depicted in Fig. 2.The H2 production process began by pumping the water-ethanol
mixture. Before entering the reformer reactor, the mixture was then
69Z. Khila et al. / Energy for Sustainable Development 37 (2017) 66–78
heated (flow 2 → flow 6). The required heat was provided by a heatexchanger network (COOL-CO → COOL-LT → COOL-HT → COOL-SYNG). The SG leaving the reformer (flow 9) was cooled to 300 °C(HT-WGS inlet temperature) in a heat exchanger (COOL-SYNG).The product stream exiting the HT-WGS reactor (flow 11) is cooledto 200 °C (LT-WGS inlet temperature) in COOL-HT. The gas leavingthe LT-WGS reactor passes through a heat exchanger (COOL-LT) be-fore being fed to the COPROX reactor. The gas exiting the COPROX re-actor was finally cooled to 130 °C after passing through a heatexchanger (COOL-CO). Two compressors were used, COMPRESSOR1 for compressing the air required for reforming reaction andCOMPRESSOR 2 for air feeding COPROX reactor. It should be notedthat all of the temperature levels required in the reforming processwere achieved without an external heat supply via the integratedheat recovery systems (the exothermic reactions were exploited tomaintain the streams at the required temperature).
Before applying the energy, exergy and environment assess-ments, the reforming process was modeled in Aspen Plus™ processsimulation software developed by Aspen Tech (Aspen Plus™,1988). The simulation provided the properties of the stream (T, P,mole flow, enthalpy, entropy, etc.) at different locations as well asthe data required for LCA inventory. The reforming, the WGS (HTand LT) and COPROX reactors were modeled using the librarymodel RGibbs. The library model RGibbs reactor in the AspenPlus™ package calculates the chemical and phase equilibria by min-imizing the Gibbs free energy of all of the species expected to partic-ipate in the chemical equilibrium (Aspen Plus™, 1988). Whereas theRstoichmodel was used tomodel the furnace required to supply heatto the reformer. For all of the heat exchangers with two input andoutput streams, the Aspen Plus™ model HEATX was employed. Thecompressors and the pump were modeled as COMPR and PUMP, re-spectively. The thermodynamic properties were calculated using theSoave-Redlich-Kwong (SRK) equation of state. The SRK model is se-lected considering the chemical species present and process operat-ing conditions (temperature, pressure, etc.), following the generalthermodynamic models selection criteria, which are described byAspen Plus™ reference manual (physical property methods andmodels (Aspen Plus™, 1988)).
All of the simulations were performed under the followingassumptions:
▪ Air, water and ethanol enter the process at temperature T = 25 °Cand pressure P = 1 atm.
▪ The inlet flow temperature to the first stage of the WGS reactor(HTS) was 300 °C.
Fig. 2. Detailed flowsheet of the
▪ The inlet flow temperature to the second stage of the WGS reactor(LTS) was 200 °C.
▪ The final temperature of the hydrogen-rich gas (flow16)was 130 °C.
Materials and methods
Energy and exergy analysis and the related performance parameters
The performance of a reforming system is conventionally evaluatedby its thermal efficiency. In general, the thermal efficiency is calculatedas the energy output divided by the energy input as shown in Eq. (14)(Simpson and Lutz, 2007).
ηThermal
¼ mH2 � LHVH2
mBioethanol � LHVBioethanol þWCompressor1 þWCompressor2 þWPump
ð14Þ
where mi and LHVi are the mass flow and the lower heating value ofcomponent “i”, respectively, andWi is themechanical work of the com-ponent “i”.
Exergy analysis is performed to evaluate the energetic performanceof the system based on both the first and the second laws of thermody-namics. The exergy of a system is defined as the maximum useful workthat can be generated during a process that brings the system into ther-mal, chemical, and mechanical equilibrium with the reference environ-ment (Szargut et al., 1998).
Three forms of the exergy transfer are distinguished in this paper:with work, with the heat interaction and with the mass flow. Othercomponents of the exergy transfer are neglected, such as potentialand kinetic exergies.
The exergy associated with the work exchange is (Szargut et al.,1998):
ExW ¼ W: ð15Þ
The exergy associated with the heat interaction is given by Eq. (16)(Szargut et al., 1998):
ExQ ¼ Q 1− T0=Tð Þð Þ ð16Þ
where T0 is the reference temperature, T is the temperature atwhich theheat transfer takes place and Q is the heat transferred.
The exergy associated with the mass flow can be defined as themaximum amount of work obtainable when the stream is brought
ATR of bioethanol process.
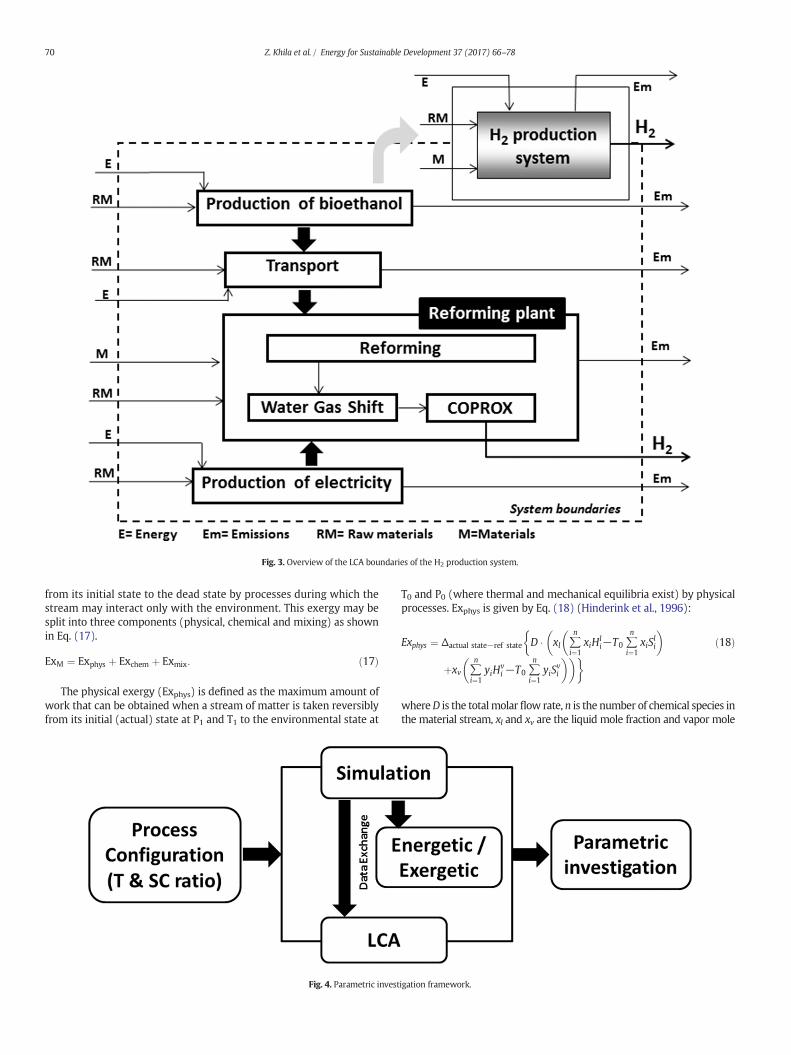
Fig. 3. Overview of the LCA boundaries of the H2 production system.
70 Z. Khila et al. / Energy for Sustainable Development 37 (2017) 66–78
from its initial state to the dead state by processes during which thestream may interact only with the environment. This exergy may besplit into three components (physical, chemical and mixing) as shownin Eq. (17).
ExM ¼ Exphys þ Exchem þ Exmix: ð17Þ
The physical exergy (Exphys) is defined as the maximum amount ofwork that can be obtained when a stream of matter is taken reversiblyfrom its initial (actual) state at P1 and T1 to the environmental state at
Fig. 4. Parametric invest
T0 and P0 (where thermal and mechanical equilibria exist) by physicalprocesses. Exphys is given by Eq. (18) (Hinderink et al., 1996):
Exphys ¼ Δactual state−ref state
�D �
�xl ∑
n
i¼1xiH
li−T0 ∑
n
i¼1xiS
li
� �
þxv ∑n
i¼1yiH
vi −T0 ∑
n
i¼1yiS
vi
� ��� ð18Þ
whereD is the totalmolarflow rate, n is the number of chemical species inthe material stream, xl and xv are the liquid mole fraction and vapor mole
igation framework.
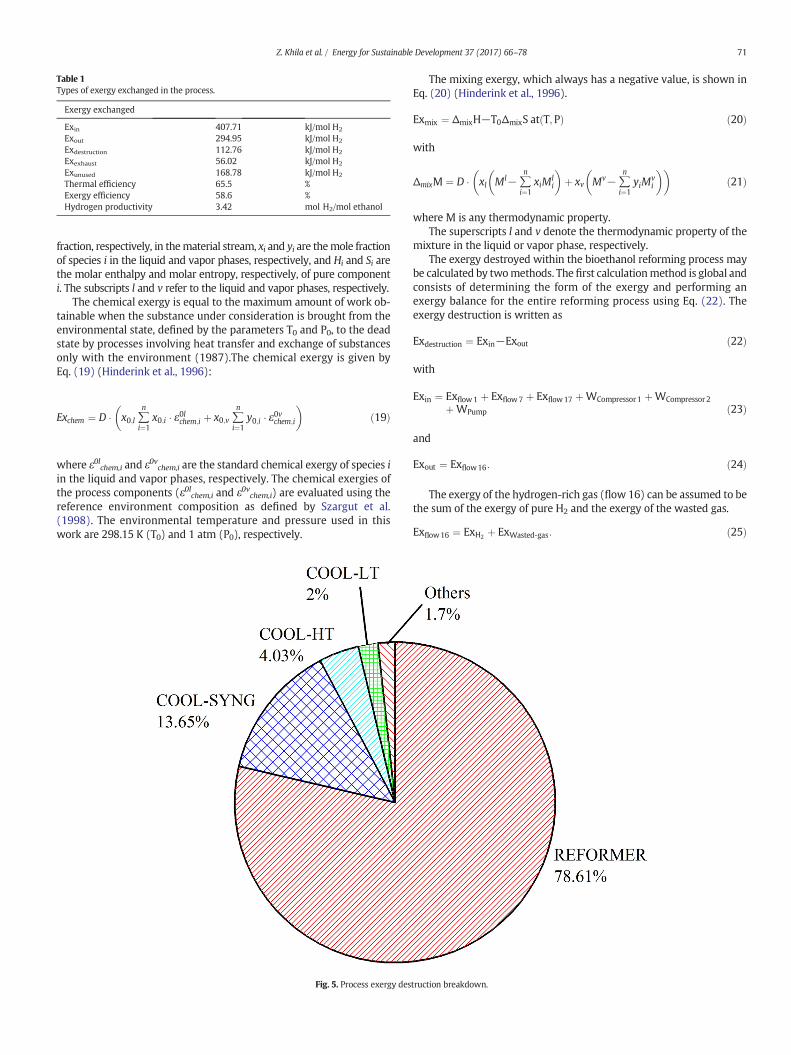
Table 1Types of exergy exchanged in the process.
Exergy exchanged
Exin 407.71 kJ/mol H2
Exout 294.95 kJ/mol H2
Exdestruction 112.76 kJ/mol H2
Exexhaust 56.02 kJ/mol H2
Exunused 168.78 kJ/mol H2
Thermal efficiency 65.5 %Exergy efficiency 58.6 %Hydrogen productivity 3.42 mol H2/mol ethanol
71Z. Khila et al. / Energy for Sustainable Development 37 (2017) 66–78
fraction, respectively, in thematerial stream, xi and yi are themole fractionof species i in the liquid and vapor phases, respectively, and Hi and Si arethe molar enthalpy and molar entropy, respectively, of pure componenti. The subscripts l and v refer to the liquid and vapor phases, respectively.
The chemical exergy is equal to the maximum amount of work ob-tainable when the substance under consideration is brought from theenvironmental state, defined by the parameters T0 and P0, to the deadstate by processes involving heat transfer and exchange of substancesonly with the environment (1987).The chemical exergy is given byEq. (19) (Hinderink et al., 1996):
Exchem ¼ D � x0;l ∑n
i¼1x0;i � ε0lchem;i þ x0;v ∑
n
i¼1y0;i � ε0vchem;i
� �ð19Þ
where ε0lchem,i and ε0vchem,i are the standard chemical exergy of species iin the liquid and vapor phases, respectively. The chemical exergies ofthe process components (ε0lchem,i and ε0vchem,i) are evaluated using thereference environment composition as defined by Szargut et al.(1998). The environmental temperature and pressure used in thiswork are 298.15 K (T0) and 1 atm (P0), respectively.
Fig. 5. Process exergy des
The mixing exergy, which always has a negative value, is shown inEq. (20) (Hinderink et al., 1996).
Exmix ¼ ΔmixH−T0ΔmixS at T;Pð Þ ð20Þ
with
ΔmixM ¼ D � xl Ml−∑n
i¼1xiM
li
� �þ xv Mv−∑
n
i¼1yiM
vi
� �� �ð21Þ
where M is any thermodynamic property.The superscripts l and v denote the thermodynamic property of the
mixture in the liquid or vapor phase, respectively.The exergy destroyed within the bioethanol reforming process may
be calculated by twomethods. The first calculationmethod is global andconsists of determining the form of the exergy and performing anexergy balance for the entire reforming process using Eq. (22). Theexergy destruction is written as
Exdestruction ¼ Exin−Exout ð22Þ
with
Exin ¼ Exflow1 þ Exflow7 þ Exflow17 þWCompressor1 þWCompressor2þWPump ð23Þ
and
Exout ¼ Exflow16: ð24Þ
The exergy of the hydrogen-rich gas (flow 16) can be assumed to bethe sum of the exergy of pure H2 and the exergy of the wasted gas.
Exflow16 ¼ ExH2 þ ExWasted‐gas: ð25Þ
truction breakdown.
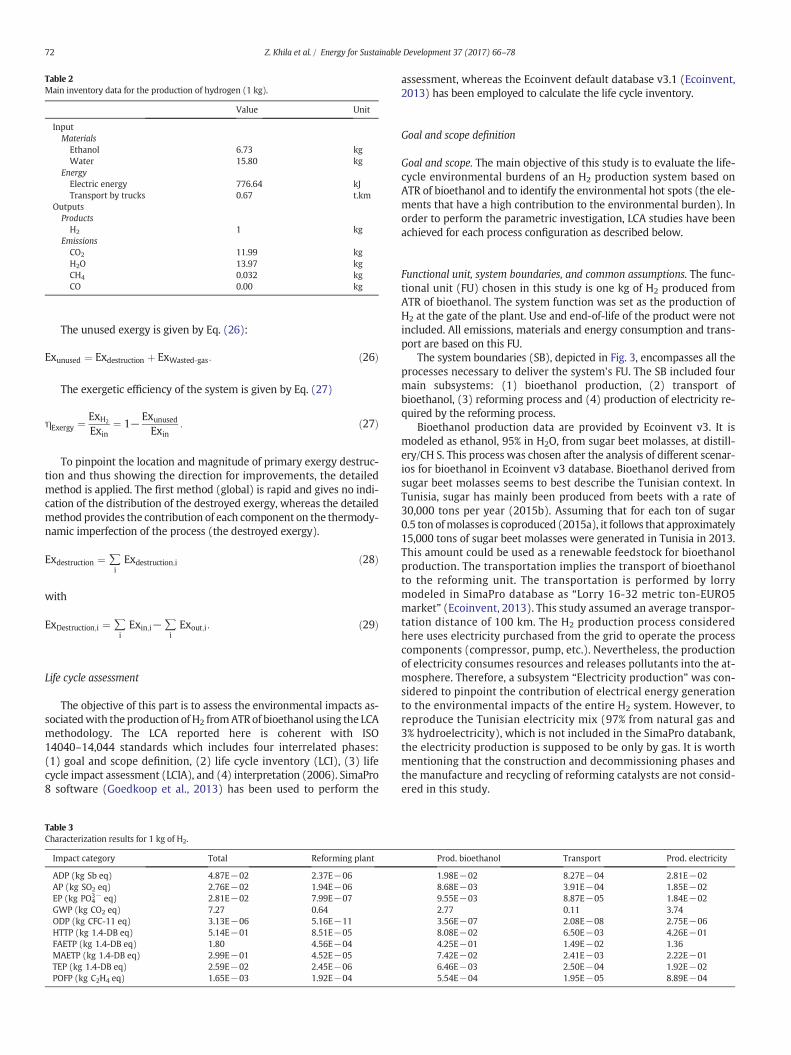
Table 2Main inventory data for the production of hydrogen (1 kg).
Value Unit
InputMaterialsEthanol 6.73 kgWater 15.80 kg
EnergyElectric energy 776.64 kJTransport by trucks 0.67 t.km
OutputsProductsH2 1 kg
EmissionsCO2 11.99 kgH2O 13.97 kgCH4 0.032 kgCO 0.00 kg
72 Z. Khila et al. / Energy for Sustainable Development 37 (2017) 66–78
The unused exergy is given by Eq. (26):
Exunused ¼ Exdestruction þ ExWasted‐gas: ð26Þ
The exergetic efficiency of the system is given by Eq. (27)
ηExergy ¼ ExH2
Exin¼ 1−
ExunusedExin
: ð27Þ
To pinpoint the location and magnitude of primary exergy destruc-tion and thus showing the direction for improvements, the detailedmethod is applied. The first method (global) is rapid and gives no indi-cation of the distribution of the destroyed exergy, whereas the detailedmethod provides the contribution of each component on the thermody-namic imperfection of the process (the destroyed exergy).
Exdestruction ¼ ∑iExdestruction;i ð28Þ
with
ExDestruction;i ¼ ∑iExin;i−∑
iExout;i: ð29Þ
Life cycle assessment
The objective of this part is to assess the environmental impacts as-sociatedwith the production of H2 fromATRof bioethanol using the LCAmethodology. The LCA reported here is coherent with ISO14040–14,044 standards which includes four interrelated phases:(1) goal and scope definition, (2) life cycle inventory (LCI), (3) lifecycle impact assessment (LCIA), and (4) interpretation (2006). SimaPro8 software (Goedkoop et al., 2013) has been used to perform the
Table 3Characterization results for 1 kg of H2.
Impact category Total Reforming plant
ADP (kg Sb eq) 4.87E−02 2.37E−06AP (kg SO2 eq) 2.76E−02 1.94E−06EP (kg PO4
3− eq) 2.81E−02 7.99E−07GWP (kg CO2 eq) 7.27 0.64ODP (kg CFC-11 eq) 3.13E−06 5.16E−11HTTP (kg 1.4-DB eq) 5.14E−01 8.51E−05FAETP (kg 1.4-DB eq) 1.80 4.56E−04MAETP (kg 1.4-DB eq) 2.99E−01 4.52E−05TEP (kg 1.4-DB eq) 2.59E−02 2.45E−06POFP (kg C2H4 eq) 1.65E−03 1.92E−04
assessment, whereas the Ecoinvent default database v3.1 (Ecoinvent,2013) has been employed to calculate the life cycle inventory.
Goal and scope definition
Goal and scope. The main objective of this study is to evaluate the life-cycle environmental burdens of an H2 production system based onATR of bioethanol and to identify the environmental hot spots (the ele-ments that have a high contribution to the environmental burden). Inorder to perform the parametric investigation, LCA studies have beenachieved for each process configuration as described below.
Functional unit, system boundaries, and common assumptions. The func-tional unit (FU) chosen in this study is one kg of H2 produced fromATR of bioethanol. The system function was set as the production ofH2 at the gate of the plant. Use and end-of-life of the product were notincluded. All emissions, materials and energy consumption and trans-port are based on this FU.
The system boundaries (SB), depicted in Fig. 3, encompasses all theprocesses necessary to deliver the system's FU. The SB included fourmain subsystems: (1) bioethanol production, (2) transport ofbioethanol, (3) reforming process and (4) production of electricity re-quired by the reforming process.
Bioethanol production data are provided by Ecoinvent v3. It ismodeled as ethanol, 95% in H2O, from sugar beet molasses, at distill-ery/CH S. This process was chosen after the analysis of different scenar-ios for bioethanol in Ecoinvent v3 database. Bioethanol derived fromsugar beet molasses seems to best describe the Tunisian context. InTunisia, sugar has mainly been produced from beets with a rate of30,000 tons per year (2015b). Assuming that for each ton of sugar0.5 ton ofmolasses is coproduced (2015a), it follows that approximately15,000 tons of sugar beet molasses were generated in Tunisia in 2013.This amount could be used as a renewable feedstock for bioethanolproduction. The transportation implies the transport of bioethanolto the reforming unit. The transportation is performed by lorrymodeled in SimaPro database as “Lorry 16-32 metric ton-EURO5market” (Ecoinvent, 2013). This study assumed an average transpor-tation distance of 100 km. The H2 production process consideredhere uses electricity purchased from the grid to operate the processcomponents (compressor, pump, etc.). Nevertheless, the productionof electricity consumes resources and releases pollutants into the at-mosphere. Therefore, a subsystem “Electricity production” was con-sidered to pinpoint the contribution of electrical energy generationto the environmental impacts of the entire H2 system. However, toreproduce the Tunisian electricity mix (97% from natural gas and3% hydroelectricity), which is not included in the SimaPro databank,the electricity production is supposed to be only by gas. It is worthmentioning that the construction and decommissioning phases andthe manufacture and recycling of reforming catalysts are not consid-ered in this study.
Prod. bioethanol Transport Prod. electricity
1.98E−02 8.27E−04 2.81E−028.68E−03 3.91E−04 1.85E−029.55E−03 8.87E−05 1.84E−022.77 0.11 3.743.56E−07 2.08E−08 2.75E−068.08E−02 6.50E−03 4.26E−014.25E−01 1.49E−02 1.367.42E−02 2.41E−03 2.22E−016.46E−03 2.50E−04 1.92E−025.54E−04 1.95E−05 8.89E−04
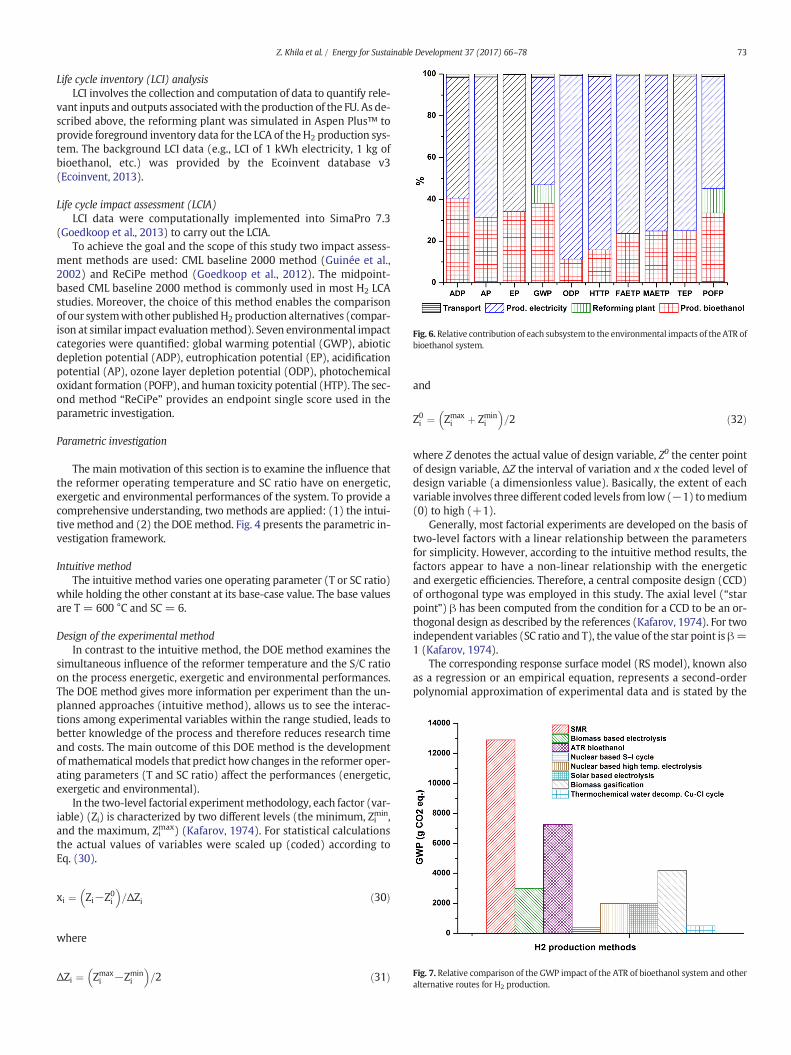
Fig. 7. Relative comparison of the GWP impact of the ATR of bioethanol system and otheralternative routes for H2 production.
Fig. 6. Relative contribution of each subsystem to the environmental impacts of the ATR ofbioethanol system.
73Z. Khila et al. / Energy for Sustainable Development 37 (2017) 66–78
Life cycle inventory (LCI) analysisLCI involves the collection and computation of data to quantify rele-
vant inputs and outputs associatedwith the production of the FU. As de-scribed above, the reforming plant was simulated in Aspen Plus™ toprovide foreground inventory data for the LCA of theH2 production sys-tem. The background LCI data (e.g., LCI of 1 kWh electricity, 1 kg ofbioethanol, etc.) was provided by the Ecoinvent database v3(Ecoinvent, 2013).
Life cycle impact assessment (LCIA)LCI data were computationally implemented into SimaPro 7.3
(Goedkoop et al., 2013) to carry out the LCIA.To achieve the goal and the scope of this study two impact assess-
ment methods are used: CML baseline 2000 method (Guinée et al.,2002) and ReCiPe method (Goedkoop et al., 2012). The midpoint-based CML baseline 2000 method is commonly used in most H2 LCAstudies. Moreover, the choice of this method enables the comparisonof our systemwithother publishedH2 production alternatives (compar-ison at similar impact evaluationmethod). Seven environmental impactcategories were quantified: global warming potential (GWP), abioticdepletion potential (ADP), eutrophication potential (EP), acidificationpotential (AP), ozone layer depletion potential (ODP), photochemicaloxidant formation (POFP), and human toxicity potential (HTP). The sec-ond method “ReCiPe” provides an endpoint single score used in theparametric investigation.
Parametric investigation
The main motivation of this section is to examine the influence thatthe reformer operating temperature and SC ratio have on energetic,exergetic and environmental performances of the system. To provide acomprehensive understanding, two methods are applied: (1) the intui-tive method and (2) the DOEmethod. Fig. 4 presents the parametric in-vestigation framework.
Intuitive methodThe intuitive method varies one operating parameter (T or SC ratio)
while holding the other constant at its base-case value. The base valuesare T = 600 °C and SC = 6.
Design of the experimental methodIn contrast to the intuitive method, the DOE method examines the
simultaneous influence of the reformer temperature and the S/C ratioon the process energetic, exergetic and environmental performances.The DOE method gives more information per experiment than the un-planned approaches (intuitive method), allows us to see the interac-tions among experimental variables within the range studied, leads tobetter knowledge of the process and therefore reduces research timeand costs. The main outcome of this DOE method is the developmentofmathematical models that predict how changes in the reformer oper-ating parameters (T and SC ratio) affect the performances (energetic,exergetic and environmental).
In the two-level factorial experimentmethodology, each factor (var-iable) (Zi) is characterized by two different levels (the minimum, Zimin,and the maximum, Zimax) (Kafarov, 1974). For statistical calculationsthe actual values of variables were scaled up (coded) according toEq. (30).
xi ¼ Zi−Z0i� �
=ΔZi ð30Þ
where
ΔZi ¼ Zmaxi −Zmin
i
� �=2 ð31Þ
and
Z0i ¼ Zmaxi þ Zmin
i
� �=2 ð32Þ
where Z denotes the actual value of design variable, Z0 the center pointof design variable, ΔZ the interval of variation and x the coded level ofdesign variable (a dimensionless value). Basically, the extent of eachvariable involves three different coded levels from low (−1) tomedium(0) to high (+1).
Generally, most factorial experiments are developed on the basis oftwo-level factors with a linear relationship between the parametersfor simplicity. However, according to the intuitive method results, thefactors appear to have a non-linear relationship with the energeticand exergetic efficiencies. Therefore, a central composite design (CCD)of orthogonal type was employed in this study. The axial level (“starpoint”) β has been computed from the condition for a CCD to be an or-thogonal design as described by the references (Kafarov, 1974). For twoindependent variables (SC ratio and T), the value of the star point is β=1 (Kafarov, 1974).
The corresponding response surface model (RS model), known alsoas a regression or an empirical equation, represents a second-orderpolynomial approximation of experimental data and is stated by the
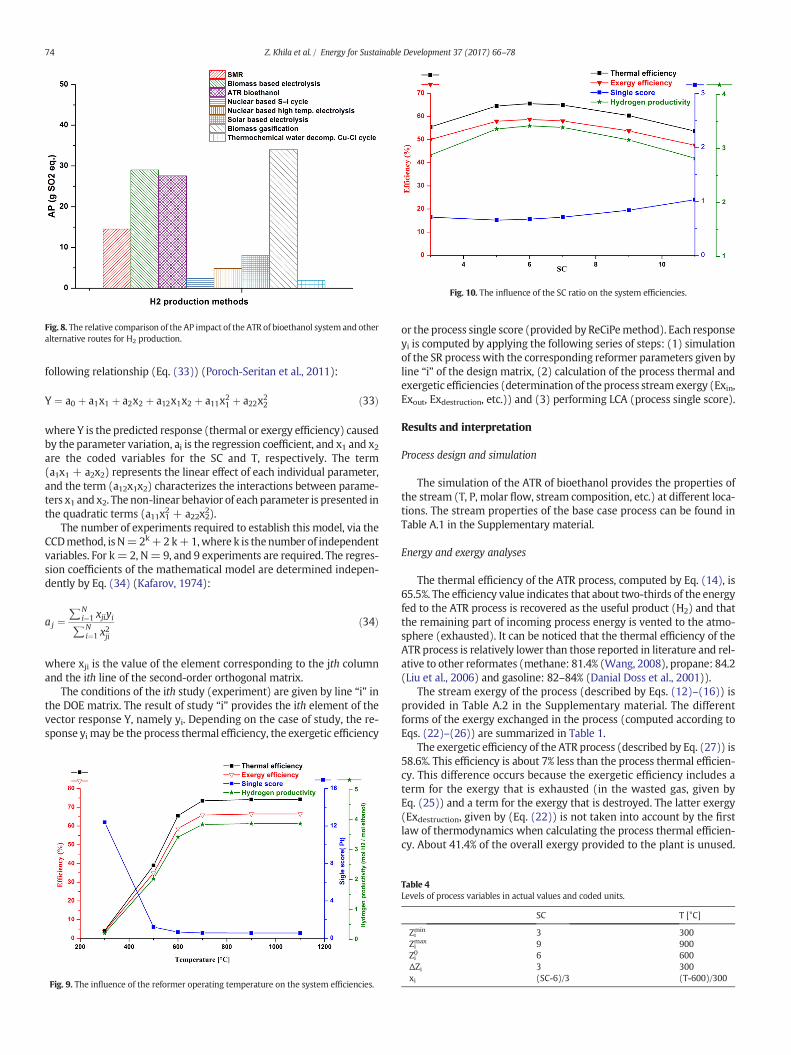
Fig. 10. The influence of the SC ratio on the system efficiencies.
Fig. 8. The relative comparison of the AP impact of the ATR of bioethanol system and otheralternative routes for H2 production.
74 Z. Khila et al. / Energy for Sustainable Development 37 (2017) 66–78
following relationship (Eq. (33)) (Poroch-Seritan et al., 2011):
Y ¼ a0 þ a1x1 þ a2x2 þ a12x1x2 þ a11x21 þ a22x22 ð33Þ
where Y is the predicted response (thermal or exergy efficiency) causedby the parameter variation, ai is the regression coefficient, and x1 and x2are the coded variables for the SC and T, respectively. The term(a1x1 + a2x2) represents the linear effect of each individual parameter,and the term (a12x1x2) characterizes the interactions between parame-ters x1 and x2. The non-linear behavior of each parameter is presented inthe quadratic terms (a11x12 + a22x22).
The number of experiments required to establish this model, via theCCDmethod, is N=2k+2k+1,where k is thenumber of independentvariables. For k= 2, N= 9, and 9 experiments are required. The regres-sion coefficients of the mathematical model are determined indepen-dently by Eq. (34) (Kafarov, 1974):
aj ¼∑N
i¼1 xjiyi∑N
i¼1 x2ji
ð34Þ
where xji is the value of the element corresponding to the jth columnand the ith line of the second-order orthogonal matrix.
The conditions of the ith study (experiment) are given by line “i” inthe DOE matrix. The result of study “i” provides the ith element of thevector response Y, namely yi. Depending on the case of study, the re-sponse yi may be the process thermal efficiency, the exergetic efficiency
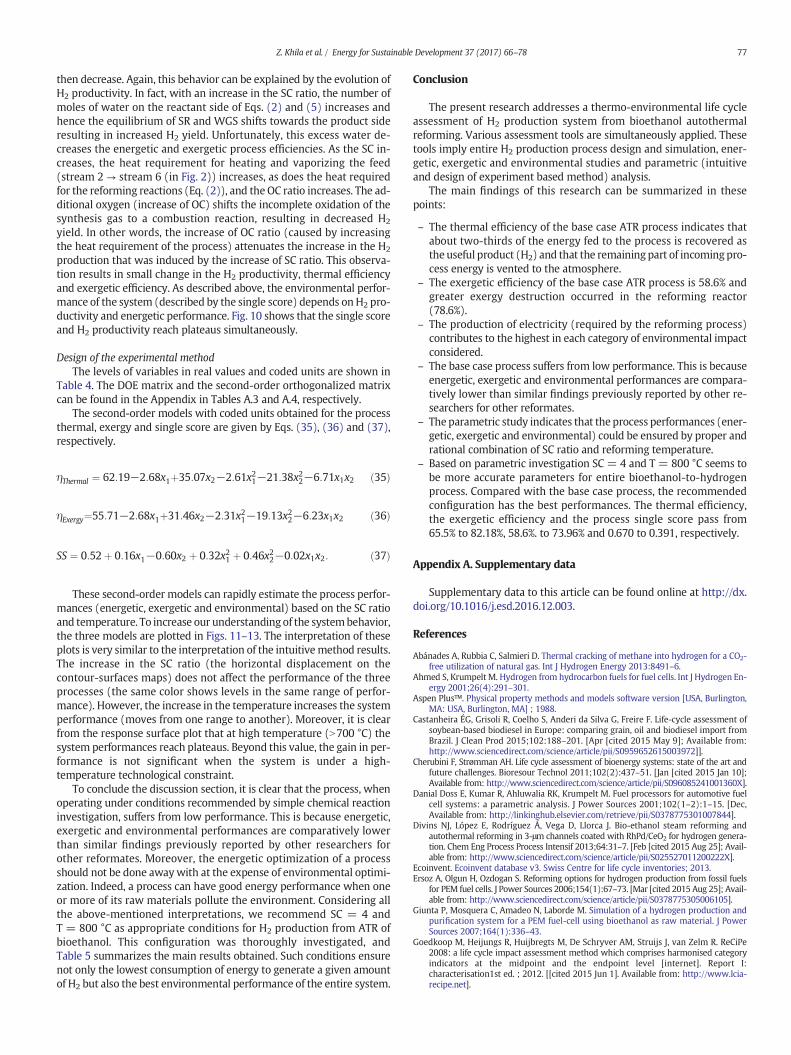
Fig. 9. The influence of the reformer operating temperature on the system efficiencies.
or the process single score (provided by ReCiPemethod). Each responseyi is computed by applying the following series of steps: (1) simulationof the SR process with the corresponding reformer parameters given byline “i” of the design matrix, (2) calculation of the process thermal andexergetic efficiencies (determination of the process streamexergy (Exin,Exout, Exdestruction, etc.)) and (3) performing LCA (process single score).
Results and interpretation
Process design and simulation
The simulation of the ATR of bioethanol provides the properties ofthe stream (T, P, molar flow, stream composition, etc.) at different loca-tions. The stream properties of the base case process can be found inTable A.1 in the Supplementary material.
Energy and exergy analyses
The thermal efficiency of the ATR process, computed by Eq. (14), is65.5%. The efficiency value indicates that about two-thirds of the energyfed to the ATR process is recovered as the useful product (H2) and thatthe remaining part of incoming process energy is vented to the atmo-sphere (exhausted). It can be noticed that the thermal efficiency of theATR process is relatively lower than those reported in literature and rel-ative to other reformates (methane: 81.4% (Wang, 2008), propane: 84.2(Liu et al., 2006) and gasoline: 82–84% (Danial Doss et al., 2001)).
The stream exergy of the process (described by Eqs. (12)–(16)) isprovided in Table A.2 in the Supplementary material. The differentforms of the exergy exchanged in the process (computed according toEqs. (22)–(26)) are summarized in Table 1.
The exergetic efficiency of the ATR process (described by Eq. (27)) is58.6%. This efficiency is about 7% less than the process thermal efficien-cy. This difference occurs because the exergetic efficiency includes aterm for the exergy that is exhausted (in the wasted gas, given byEq. (25)) and a term for the exergy that is destroyed. The latter exergy(Exdestruction, given by (Eq. (22)) is not taken into account by the firstlaw of thermodynamics when calculating the process thermal efficien-cy. About 41.4% of the overall exergy provided to the plant is unused.
Table 4Levels of process variables in actual values and coded units.
SC T [°C]
Zimin 3 300Zimax 9 900Zi0 6 600ΔZi 3 300xi (SC-6)/3 (T-600)/300
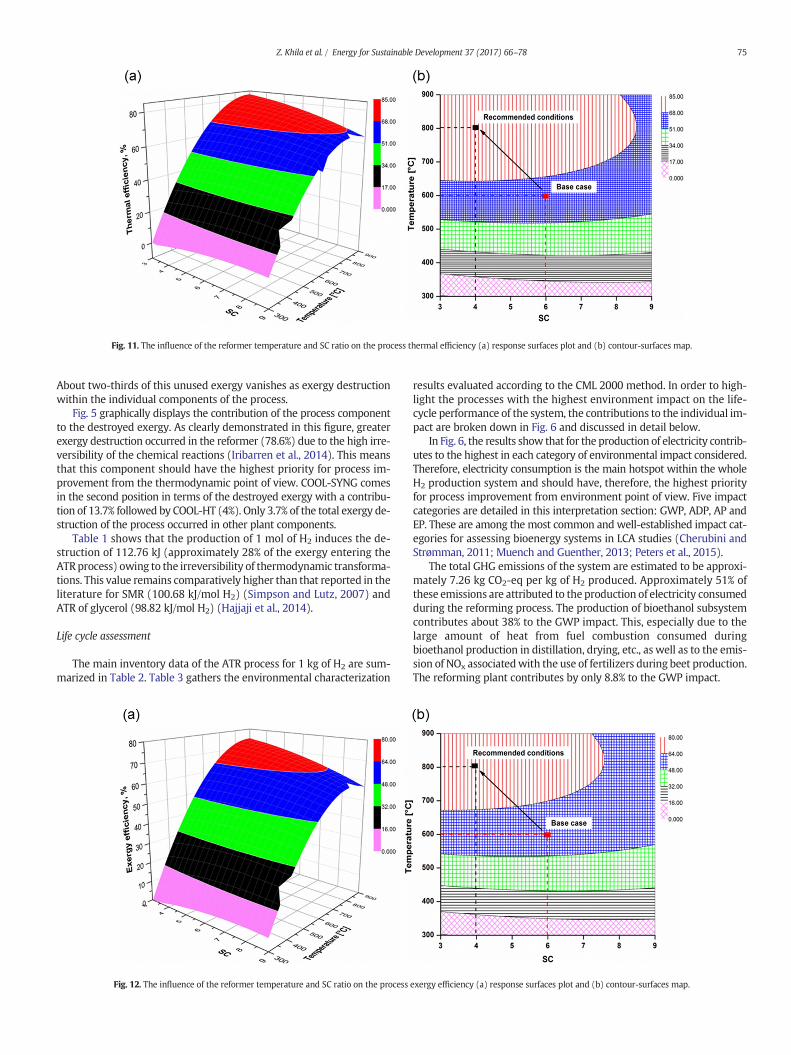
Fig. 11. The influence of the reformer temperature and SC ratio on the process thermal efficiency (a) response surfaces plot and (b) contour-surfaces map.
75Z. Khila et al. / Energy for Sustainable Development 37 (2017) 66–78
About two-thirds of this unused exergy vanishes as exergy destructionwithin the individual components of the process.
Fig. 5 graphically displays the contribution of the process componentto the destroyed exergy. As clearly demonstrated in this figure, greaterexergy destruction occurred in the reformer (78.6%) due to the high irre-versibility of the chemical reactions (Iribarren et al., 2014). This meansthat this component should have the highest priority for process im-provement from the thermodynamic point of view. COOL-SYNG comesin the second position in terms of the destroyed exergy with a contribu-tion of 13.7% followed by COOL-HT (4%). Only 3.7% of the total exergy de-struction of the process occurred in other plant components.
Table 1 shows that the production of 1 mol of H2 induces the de-struction of 112.76 kJ (approximately 28% of the exergy entering theATRprocess) owing to the irreversibility of thermodynamic transforma-tions. This value remains comparatively higher than that reported in theliterature for SMR (100.68 kJ/mol H2) (Simpson and Lutz, 2007) andATR of glycerol (98.82 kJ/mol H2) (Hajjaji et al., 2014).
Life cycle assessment
The main inventory data of the ATR process for 1 kg of H2 are sum-marized in Table 2. Table 3 gathers the environmental characterization
Fig. 12. The influence of the reformer temperature and SC ratio on the process
results evaluated according to the CML 2000 method. In order to high-light the processes with the highest environment impact on the life-cycle performance of the system, the contributions to the individual im-pact are broken down in Fig. 6 and discussed in detail below.
In Fig. 6, the results show that for the production of electricity contrib-utes to the highest in each category of environmental impact considered.Therefore, electricity consumption is the main hotspot within the wholeH2 production system and should have, therefore, the highest priorityfor process improvement from environment point of view. Five impactcategories are detailed in this interpretation section: GWP, ADP, AP andEP. These are among the most common and well-established impact cat-egories for assessing bioenergy systems in LCA studies (Cherubini andStrømman, 2011; Muench and Guenther, 2013; Peters et al., 2015).
The total GHG emissions of the system are estimated to be approxi-mately 7.26 kg CO2-eq per kg of H2 produced. Approximately 51% ofthese emissions are attributed to the production of electricity consumedduring the reforming process. The production of bioethanol subsystemcontributes about 38% to the GWP impact. This, especially due to thelarge amount of heat from fuel combustion consumed duringbioethanol production in distillation, drying, etc., as well as to the emis-sion of NOx associatedwith the use of fertilizers during beet production.The reforming plant contributes by only 8.8% to the GWP impact.
exergy efficiency (a) response surfaces plot and (b) contour-surfaces map.
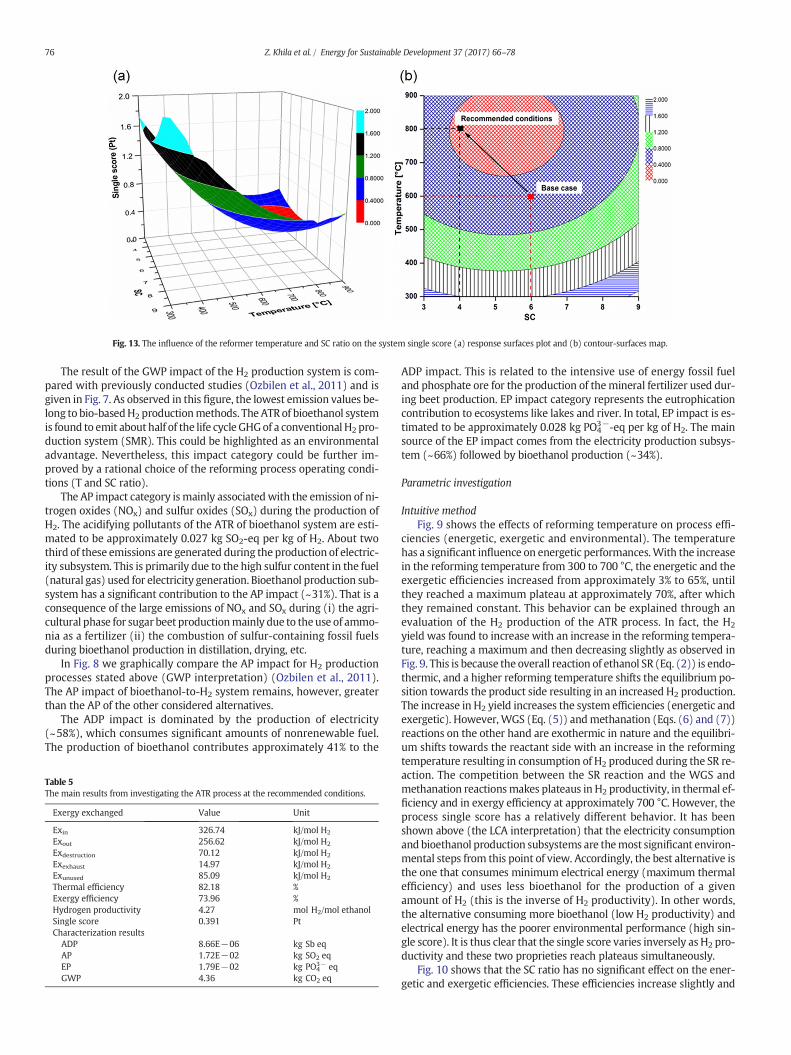
Fig. 13. The influence of the reformer temperature and SC ratio on the system single score (a) response surfaces plot and (b) contour-surfaces map.
76 Z. Khila et al. / Energy for Sustainable Development 37 (2017) 66–78
The result of the GWP impact of the H2 production system is com-pared with previously conducted studies (Ozbilen et al., 2011) and isgiven in Fig. 7. As observed in this figure, the lowest emission values be-long to bio-basedH2 productionmethods. The ATRof bioethanol systemis found to emit about half of the life cycle GHGof a conventional H2 pro-duction system (SMR). This could be highlighted as an environmentaladvantage. Nevertheless, this impact category could be further im-proved by a rational choice of the reforming process operating condi-tions (T and SC ratio).
The AP impact category is mainly associatedwith the emission of ni-trogen oxides (NOx) and sulfur oxides (SOx) during the production ofH2. The acidifying pollutants of the ATR of bioethanol system are esti-mated to be approximately 0.027 kg SO2-eq per kg of H2. About twothird of these emissions are generated during the production of electric-ity subsystem. This is primarily due to the high sulfur content in the fuel(natural gas) used for electricity generation. Bioethanol production sub-system has a significant contribution to the AP impact (~31%). That is aconsequence of the large emissions of NOx and SOx during (i) the agri-cultural phase for sugar beet productionmainly due to theuse of ammo-nia as a fertilizer (ii) the combustion of sulfur-containing fossil fuelsduring bioethanol production in distillation, drying, etc.
In Fig. 8 we graphically compare the AP impact for H2 productionprocesses stated above (GWP interpretation) (Ozbilen et al., 2011).The AP impact of bioethanol-to-H2 system remains, however, greaterthan the AP of the other considered alternatives.
The ADP impact is dominated by the production of electricity(~58%), which consumes significant amounts of nonrenewable fuel.The production of bioethanol contributes approximately 41% to the
Table 5The main results from investigating the ATR process at the recommended conditions.
Exergy exchanged Value Unit
Exin 326.74 kJ/mol H2
Exout 256.62 kJ/mol H2
Exdestruction 70.12 kJ/mol H2
Exexhaust 14.97 kJ/mol H2
Exunused 85.09 kJ/mol H2
Thermal efficiency 82.18 %Exergy efficiency 73.96 %Hydrogen productivity 4.27 mol H2/mol ethanolSingle score 0.391 PtCharacterization results
ADP 8.66E−06 kg Sb eqAP 1.72E−02 kg SO2 eqEP 1.79E−02 kg PO4
3− eqGWP 4.36 kg CO2 eq
ADP impact. This is related to the intensive use of energy fossil fueland phosphate ore for the production of themineral fertilizer used dur-ing beet production. EP impact category represents the eutrophicationcontribution to ecosystems like lakes and river. In total, EP impact is es-timated to be approximately 0.028 kg PO4
3−-eq per kg of H2. The mainsource of the EP impact comes from the electricity production subsys-tem (~66%) followed by bioethanol production (~34%).
Parametric investigation
Intuitive methodFig. 9 shows the effects of reforming temperature on process effi-
ciencies (energetic, exergetic and environmental). The temperaturehas a significant influence on energetic performances.With the increasein the reforming temperature from 300 to 700 °C, the energetic and theexergetic efficiencies increased from approximately 3% to 65%, untilthey reached a maximum plateau at approximately 70%, after whichthey remained constant. This behavior can be explained through anevaluation of the H2 production of the ATR process. In fact, the H2
yield was found to increase with an increase in the reforming tempera-ture, reaching a maximum and then decreasing slightly as observed inFig. 9. This is because the overall reaction of ethanol SR (Eq. (2)) is endo-thermic, and a higher reforming temperature shifts the equilibrium po-sition towards the product side resulting in an increased H2 production.The increase in H2 yield increases the system efficiencies (energetic andexergetic). However, WGS (Eq. (5)) andmethanation (Eqs. (6) and (7))reactions on the other hand are exothermic in nature and the equilibri-um shifts towards the reactant side with an increase in the reformingtemperature resulting in consumption of H2 produced during the SR re-action. The competition between the SR reaction and the WGS andmethanation reactionsmakes plateaus in H2 productivity, in thermal ef-ficiency and in exergy efficiency at approximately 700 °C. However, theprocess single score has a relatively different behavior. It has beenshown above (the LCA interpretation) that the electricity consumptionand bioethanol production subsystems are themost significant environ-mental steps from this point of view. Accordingly, the best alternative isthe one that consumes minimum electrical energy (maximum thermalefficiency) and uses less bioethanol for the production of a givenamount of H2 (this is the inverse of H2 productivity). In other words,the alternative consuming more bioethanol (low H2 productivity) andelectrical energy has the poorer environmental performance (high sin-gle score). It is thus clear that the single score varies inversely as H2 pro-ductivity and these two proprieties reach plateaus simultaneously.
Fig. 10 shows that the SC ratio has no significant effect on the ener-getic and exergetic efficiencies. These efficiencies increase slightly and
77Z. Khila et al. / Energy for Sustainable Development 37 (2017) 66–78
then decrease. Again, this behavior can be explained by the evolution ofH2 productivity. In fact, with an increase in the SC ratio, the number ofmoles of water on the reactant side of Eqs. (2) and (5) increases andhence the equilibrium of SR and WGS shifts towards the product sideresulting in increased H2 yield. Unfortunately, this excess water de-creases the energetic and exergetic process efficiencies. As the SC in-creases, the heat requirement for heating and vaporizing the feed(stream 2 → stream 6 (in Fig. 2)) increases, as does the heat requiredfor the reforming reactions (Eq. (2)), and the OC ratio increases. The ad-ditional oxygen (increase of OC) shifts the incomplete oxidation of thesynthesis gas to a combustion reaction, resulting in decreased H2
yield. In other words, the increase of OC ratio (caused by increasingthe heat requirement of the process) attenuates the increase in the H2
production that was induced by the increase of SC ratio. This observa-tion results in small change in the H2 productivity, thermal efficiencyand exergetic efficiency. As described above, the environmental perfor-mance of the system (described by the single score) depends onH2 pro-ductivity and energetic performance. Fig. 10 shows that the single scoreand H2 productivity reach plateaus simultaneously.
Design of the experimental methodThe levels of variables in real values and coded units are shown in
Table 4. The DOE matrix and the second-order orthogonalized matrixcan be found in the Appendix in Tables A.3 and A.4, respectively.
The second-order models with coded units obtained for the processthermal, exergy and single score are given by Eqs. (35), (36) and (37),respectively.
ηThermal ¼ 62:19−2:68x1þ35:07x2−2:61x21−21:38x22−6:71x1x2 ð35Þ
ηExergy¼55:71−2:68x1þ31:46x2−2:31x21−19:13x22−6:23x1x2 ð36Þ
SS ¼ 0:52þ 0:16x1−0:60x2 þ 0:32x21 þ 0:46x22−0:02x1x2: ð37Þ
These second-order models can rapidly estimate the process perfor-mances (energetic, exergetic and environmental) based on the SC ratioand temperature. To increase our understanding of the systembehavior,the three models are plotted in Figs. 11–13. The interpretation of theseplots is very similar to the interpretation of the intuitivemethod results.The increase in the SC ratio (the horizontal displacement on thecontour-surfaces maps) does not affect the performance of the threeprocesses (the same color shows levels in the same range of perfor-mance). However, the increase in the temperature increases the systemperformance (moves from one range to another). Moreover, it is clearfrom the response surface plot that at high temperature (N700 °C) thesystem performances reach plateaus. Beyond this value, the gain in per-formance is not significant when the system is under a high-temperature technological constraint.
To conclude the discussion section, it is clear that the process, whenoperating under conditions recommended by simple chemical reactioninvestigation, suffers from low performance. This is because energetic,exergetic and environmental performances are comparatively lowerthan similar findings previously reported by other researchers forother reformates. Moreover, the energetic optimization of a processshould not be done awaywith at the expense of environmental optimi-zation. Indeed, a process can have good energy performance when oneor more of its raw materials pollute the environment. Considering allthe above-mentioned interpretations, we recommend SC = 4 andT = 800 °C as appropriate conditions for H2 production from ATR ofbioethanol. This configuration was thoroughly investigated, andTable 5 summarizes the main results obtained. Such conditions ensurenot only the lowest consumption of energy to generate a given amountof H2 but also the best environmental performance of the entire system.
Conclusion
The present research addresses a thermo-environmental life cycleassessment of H2 production system from bioethanol autothermalreforming. Various assessment tools are simultaneously applied. Thesetools imply entire H2 production process design and simulation, ener-getic, exergetic and environmental studies and parametric (intuitiveand design of experiment based method) analysis.
The main findings of this research can be summarized in thesepoints:
– The thermal efficiency of the base case ATR process indicates thatabout two-thirds of the energy fed to the process is recovered asthe useful product (H2) and that the remaining part of incomingpro-cess energy is vented to the atmosphere.
– The exergetic efficiency of the base case ATR process is 58.6% andgreater exergy destruction occurred in the reforming reactor(78.6%).
– The production of electricity (required by the reforming process)contributes to the highest in each category of environmental impactconsidered.
– The base case process suffers from low performance. This is becauseenergetic, exergetic and environmental performances are compara-tively lower than similar findings previously reported by other re-searchers for other reformates.
– Theparametric study indicates that the process performances (ener-getic, exergetic and environmental) could be ensured by proper andrational combination of SC ratio and reforming temperature.
– Based on parametric investigation SC = 4 and T = 800 °C seems tobe more accurate parameters for entire bioethanol-to-hydrogenprocess. Compared with the base case process, the recommendedconfiguration has the best performances. The thermal efficiency,the exergetic efficiency and the process single score pass from65.5% to 82.18%, 58.6%. to 73.96% and 0.670 to 0.391, respectively.
Appendix A. Supplementary data
Supplementary data to this article can be found online at http://dx.doi.org/10.1016/j.esd.2016.12.003.
References
Abánades A, Rubbia C, Salmieri D. Thermal cracking of methane into hydrogen for a CO2-free utilization of natural gas. Int J Hydrogen Energy 2013:8491–6.
Ahmed S, Krumpelt M. Hydrogen from hydrocarbon fuels for fuel cells. Int J Hydrogen En-ergy 2001;26(4):291–301.
Aspen Plus™. Physical property methods and models software version [USA, Burlington,MA: USA, Burlington, MA] ; 1988.
Castanheira ÉG, Grisoli R, Coelho S, Anderi da Silva G, Freire F. Life-cycle assessment ofsoybean-based biodiesel in Europe: comparing grain, oil and biodiesel import fromBrazil. J Clean Prod 2015;102:188–201. [Apr [cited 2015 May 9]; Available from:http://www.sciencedirect.com/science/article/pii/S0959652615003972]].
Cherubini F, Strømman AH. Life cycle assessment of bioenergy systems: state of the art andfuture challenges. Bioresour Technol 2011;102(2):437–51. [Jan [cited 2015 Jan 10];Available from: http://www.sciencedirect.com/science/article/pii/S096085241001360X].
Danial Doss E, Kumar R, Ahluwalia RK, Krumpelt M. Fuel processors for automotive fuelcell systems: a parametric analysis. J Power Sources 2001;102(1–2):1–15. [Dec,Available from: http://linkinghub.elsevier.com/retrieve/pii/S0378775301007844].
Divins NJ, López E, Rodríguez Á, Vega D, Llorca J. Bio-ethanol steam reforming andautothermal reforming in 3-μm channels coated with RhPd/CeO2 for hydrogen genera-tion. Chem Eng Process Process Intensif 2013;64:31–7. [Feb [cited 2015 Aug 25]; Avail-able from: http://www.sciencedirect.com/science/article/pii/S025527011200222X].
Ecoinvent. Ecoinvent database v3. Swiss Centre for life cycle inventories; 2013.Ersoz A, Olgun H, Ozdogan S. Reforming options for hydrogen production from fossil fuels
for PEM fuel cells. J Power Sources 2006;154(1):67–73. [Mar [cited 2015 Aug 25]; Avail-able from: http://www.sciencedirect.com/science/article/pii/S0378775305006105].
Giunta P, Mosquera C, Amadeo N, Laborde M. Simulation of a hydrogen production andpurification system for a PEM fuel-cell using bioethanol as raw material. J PowerSources 2007;164(1):336–43.
Goedkoop M, Heijungs R, Huijbregts M, De Schryver AM, Struijs J, van Zelm R. ReCiPe2008: a life cycle impact assessment method which comprises harmonised categoryindicators at the midpoint and the endpoint level [internet]. Report I:characterisation1st ed. ; 2012. [[cited 2015 Jun 1]. Available from: http://www.lcia-recipe.net].

78 Z. Khila et al. / Energy for Sustainable Development 37 (2017) 66–78
GoedkoopM, Oele M, Leijting J, Ponsioen T, Meijer E. PRé consultants. Introduction to LCAwith SimaPro [internet]. Available from: www.pre.nl, 2013.
Guinée JB, Gorrée M, Heijungs R, Huppes G, Kleijn R, de Koning A, et al. Life cycle assess-ment. An operational guide to the ISO standards; 2002.
Hajjaji N. Thermodynamic investigation and environment impact assessment of hydro-gen production from steam reforming of poultry tallow. Energ Conver Manage2014;79:171–9. [Available from: http://www.scopus.com/inward/record.url?eid=2-s2.0-84891717713&partnerID=40&md5=b7566706e28c8bf46a3bd63193bd6ac2].
Hajjaji N, Baccar I, Pons M-N. Energy and exergy analysis as tools for optimizationof hydrogen production by glycerol autothermal reforming. Renew Energy 2014;71:368–80. [Available from: http://www.sciencedirect.com/science/article/pii/S0960148114003176].
Hinderink AP, Kerkhof FPJM, Lie ABK, De Swaan AJ, Van Der Kooi HJ. Exergy analysis witha flowsheeting simulator - I. Theory; calculating exergies of material streams. ChemEng Sci 1996;51(20):4693–700.
Hou T, Zhang S, Chen Y, Wang D, Cai W. Hydrogen production from ethanol reforming:catalysts and reaction mechanism. Renew Sustain Energy Rev 2015;44:132–48.[Apr [cited 2015 Jan 10]; Available from: http://www.sciencedirect.com/science/arti-cle/pii/S1364032114010752].
Iribarren D, Susmozas A, Petrakopoulou F, Dufour J. Environmental and exergetic evalua-tion of hydrogen production via lignocellulosic biomass gasification. J Clean Prod2014;69:165–75. [Apr, Available from: http://linkinghub.elsevier.com/retrieve/pii/S0959652614000900].
Kafarov V. Cybernetic methods and chemical technology. Mosco: Mir; 1974.Kale GR, Kulkarni BD. Thermodynamic analysis of dry autothermal reforming of glycerol.
Fuel Process Technol 2010;91(5):520–30.Karellas S, Braimakis K. Energy–exergy analysis and economic investigation of a cogene-
ration and trigeneration ORC–VCC hybrid system utilizing biomass fuel and solarpower. Energ Conver Manage 2015. [Available from: http://linkinghub.elsevier.com/retrieve/pii/S0196890415006421].
Lee JY, Kim YS. Optimization the process variables for the fractionation of Saccharina ja-ponica to enhance glucan content. J Ind Eng Chem 2013;19(3):938–43. [May [cited2015 Aug 25]; Available from: http://www.sciencedirect.com/science/article/pii/S1226086X12003796].
Lei J, Yue H, Tang H, Liang B. Heat integration and optimization of hydrogen productionfor a 1 kW low-temperature proton exchange membrane fuel cell. Chem Eng Sci2015;123:81–91. [Feb [cited 2015 Aug 25]; Available from: http://www.sciencedirect.com/science/article/pii/S0009250914006046].
Li C, Gillum C, Toupin K, Donaldson B. Biomass boiler energy conversion system analysiswith the aid of exergy-based methods. Energ Conver Manage 2015;103:665–73.[Available from: http://linkinghub.elsevier.com/retrieve/pii/S0196890415006652].
Lindorfer J, Fazeni K, Steinmüller H. Life cycle analysis and soil organic carbon balance asmethods for assessing the ecological sustainability of 2nd generation biofuel feed-stock. Sustain Energy Technol Assess 2014;5:95–105. [Mar [cited 2015 Aug 5]; Avail-able from: http://www.sciencedirect.com/science/article/pii/S2213138813000866].
Liu Z, Mao Z, Xu J, Hess-Mohr N, Schmidt VM. Operation conditions optimization of hy-drogen production by propane autothermal reforming for PEMFC application. Chin JChem Eng 2006;14(2):259–65. [Apr, Available from: http://linkinghub.elsevier.com/retrieve/pii/S1004954106600682].
Martinez-Frias J. A natural gas-assisted steam electrolyzer for high-efficiency production ofhydrogen. Int J Hydrogen Energy 2003;28(5):483–90. [May [cited 2015 Aug 27]; Avail-able from: http://www.sciencedirect.com/science/article/pii/S0360319902001350].
Modarresi A, Wukovits W, Friedl A. Application of exergy balances for evaluation of processconfigurations for biological hydrogen production. Appl Therm Eng 2010;30(1):70–6.
Mondal T, Pant KK, Dalai AK. Oxidative and non-oxidative steam reforming of crude bio-ethanol for hydrogen production over Rh promoted Ni/CeO2-ZrO2 catalyst. Appl CatalA Gen 2015;499:19–31. [Jun [cited 2015 Jul 5]; Available from: http://www.sciencedirect.com/science/article/pii/S0926860X15002379].
Morales M, Quintero J, Conejeros R, Aroca G. Life cycle assessment of lignocellulosicbioethanol: environmental impacts and energy balance. Renew Sustain Energy Rev2015;42:1349–61. [Feb [cited 2014 Nov 25]; Available from: http://www.sciencedirect.com/science/article/pii/S1364032114009228].
Muench S, Guenther E. A systematic review of bioenergy life cycle assessments. Appl En-ergy 2013;112:257–73. [Dec [cited 2015 Jan 2]; Available from: http://www.sciencedirect.com/science/article/pii/S0306261913005084].
Ni M, Leung DYC, MKH L. A review on reforming bio-ethanol for hydrogen production. IntJ Hydrogen Energy 2007;32(15):3238–47. [Oct [cited 2015 Aug 25]; Available from:http://www.sciencedirect.com/science/article/pii/S0360319907002479].
Ozbilen A, Dincer I, Rosen MA. A comparative life cycle analysis of hydrogen productionvia thermochemical water splitting using a Cu–Cl cycle. Int J Hydrogen Energy2011;36(17):11321–7. [Aug, Available from: http://linkinghub.elsevier.com/re-trieve/pii/S0360319910023773].
Peters JF, Iribarren D, Dufour J. Simulation and life cycle assessment of biofuel production viafast pyrolysis and hydroupgrading. Fuel 2015;139:441–56. [Jan [cited 2015 Jun 28];Available from: http://www.sciencedirect.com/science/article/pii/S0016236114008746].
Poroch-Seritan M, Gutt S, Gutt G, Cretescu I, Cojocaru C, Severin T. Design of experimentsfor statistical modeling and multi-response optimization of nickel electroplating pro-cess. Chem Eng Res Des 2011;89(2):136–47.
Rabenstein G, Hacker V. Hydrogen for fuel cells from ethanol by steam-reforming, partial-oxidation and combined auto-thermal reforming: a thermodynamic analysis. J PowerSources 2008;185(2):1293–304.
Rahimpour MR, Dehnavi MR, Allahgholipour F, Iranshahi D, Jokar SM. Assessment andcomparison of different catalytic coupling exothermic and endothermic reactions: areview. Appl Energy 2012;99:496–512.
Rass-Hansen J, Johansson R, Møller M, Christensen CH. Steam reforming of technicalbioethanol for hydrogen production. Int J Hydrogen Energy 2008;33(17):4547–54.[Sep [cited 2015 Jun 18]; Available from: http://www.sciencedirect.com/science/arti-cle/pii/S0360319908007337].
Salemme L, Menna L, Simeone M. Analysis of the energy efficiency of innovative ATR-based PEM fuel cell system with hydrogen membrane separation. Int J Hydrogen En-ergy 2009;34(15):6384–92. [Aug [cited 2015 Aug 25]; Available from: http://www.sciencedirect.com/science/article/pii/S0360319909008325].
Seelam PK, Liguori S, Iulianelli A, Pinacci P, Calabrò V, Huuhtanen M, et al. Hydrogen pro-duction from bio-ethanol steam reforming reaction in a Pd/PSS membrane reactor.Catal Today 2012;193(1):42–8. [Oct [cited 2015 Aug 25]; Available from: http://www.sciencedirect.com/science/article/pii/S0920586112000478].
Simpson AP, Lutz AE. Exergy analysis of hydrogen production via steammethane reforming.Int J Hydrogen Energy 2007;32(18):4811–20. [Dec [cited 2015 Aug 3]; Available from:http://www.sciencedirect.com/science/article/pii/S036031990700482X].
Szargut J, Morris DR, Steward FR. Exergy analysis of thermal and metallurgical processes.Hemisphere 1998.
Tufvesson LM, Lantz M, Börjesson P. Environmental performance of biogas produced fromindustrial residues including competition with animal feed – life-cycle calculationsaccording to different methodologies and standards. J Clean Prod 2013;53:214–23.[Aug [cited 2015 Mar 27]; Available from: http://www.sciencedirect.com/science/ar-ticle/pii/S0959652613002060].
Wang HM. Experimental studies on hydrogen generation by methane autothermalreforming over nickel-based catalyst. J Power Sources 2008;177(2):506–11. [Mar,Available from: http://linkinghub.elsevier.com/retrieve/pii/S0378775307023671].
Wang L, Li N, Zhao B. Exergy performance and thermodynamic properties of the ideal liq-uid desiccant dehumidification system. Energ Buildings 2010;42(12):2437–44. [Dec[cited 2015 Aug 25]; Available from: http://www.sciencedirect.com/science/article/pii/S0378778810002975].