thermal responses on different wheat cultivars under different...
TRANSCRIPT
MAUSAM, 69, 1 (January 2018), 81-96
632.11 : 633.11 (540.49)
(81)
Thermal responses on different wheat cultivars under different
thermal environments for Chhattisgarh plain
PANDHURANG BOBADE, S. K. CHANDRAWANSHI*, S. R. PATEL and DEEPAK KAUSIK
College of Agriculture, Indira Gandhi Krishi Vishwadhyalaya Raipur (Chhattisgarh), India
*N. M. College of Agriculture, Navsari Agricultural University, Navsari – 396 450 (Gujarat), India
(Received 9 November 2016, Accepted 28 September 2017)
*e mail : [email protected]
सार – रायपरु के इंदिरा ग धंी कृषि षिश् िषिधायय के नुुं ंधाु ाा्म ् 2009-2010 के ं्य रबी की ांय के िौराु “छत तींग क के ्ािाुम ् षिन्न ु ष् ् ीय पयाम िरक के नतंम गत ग ँ क की पािािार करुे िाये तेती ् ष् ् ीय प्रततक्रिया” ुा्क शीिम क ंे प्रस ततु श ध पर म ् जांच की गई ँ ा। षिन्न ु ष् ् ीय पयाम िरक ् ांय के ब ुे ंे येकर पकुे तक षिन्न ु क्रकस ् म के नयढ ब क रँ ि ्री ी दिुम (जी री री) के ंचंयु ् कााी न्न ु ता ँ ा। ंुजाता रर न्र की क्रकस ् म ् 25 ुिम् बर (D1) के नतंम गत नत यधधक जी री री पाई गई। नधधकांश क्रकस ् म ् 5 जुिरि (D5) क नधधकत् पी टि यक रर ढच टि यक िेते गढ। ंी िी जी रब ् यक - 273 क छ ड़कर नधधकांश क्रकस ् म ् 25 ुिम् बर,
5 दिंंबर रर 15 दिंंबर क ांय ब ुे के बाि ढच यक ई ्ाु पाढ गढ। ं्ी क्रकस ् म ् 5 जुिरि (D5) क ब ुे के बाि तुम् ु त् ढच यक ई क िेता गया। ं्ी क्रकस ् म ् 5 जुिरि क ब ुे के बाि तुम् ु त् रर यक रई क िेता गया। नधधकांश क्रकस ् म ् 25 (D1) ुिबंर के बाि नधधकत् रई पी ढ रर ्ाुम क िेता गया। 5 दिंंबर तथा 15 दिंंबर क ब ुे के ंाथ ईयर ँ ार/ ्ीटर2 प्रतत नधधकत् ंंख् या क िेता गया। 15 दिंंबर 25 दिंबंर रर 5 जुिरि क िेर ंे ांय की बरुई की नपेक्षा ांय क ब ुे की पँ यि रर िकं रि तारित (25 ुिबंर रर 5 दिंंबर) क ििर्म ईयर ँ ार (9.4 ं ्ी) िेते गढ। जी रब ् यक-273 (9.4) की क्रकस ् ् ििर्म ँ ार िेते गढ जबक्रक न्र ् छ टे (8.4) िेते गढ। बरुई की िकं रि तारित (5 दिंंबर) क ब ई गढ ांय ् नधधकत् नुाज का षत पािु 3307 क्रक. ी ा./ँ ा. ँु र ज क्रक पँ ये रर षियंब ंे ब ई गई ांयम की तयुुा ् षिशेि रूप ंे नधधक था। रंतु जी रब ् यक - 273 के बाि कंचु की क्रकस ् (3190 क्रक.गा./ ँ ाक् ट.) ् षिशेि रूप ंे नुाज का षत पािु नधधक ँु र जबक्रक न्र (2609 क्रक.गा./ ँ ाक् ट.) रर ंुजाता (2740 क्रक.गा./ ँ ाक् ट.) की क्रकस ् ढक ं्ाु ँ ते ँु ढ ्ी नुाज का षत पािु क् ँु र। चार क्रकस ् म ्, जी रब ् यक 273 ंा्ान यत: क्ष्ता िायि क्रकस ् ्ी जबक्रक नन य क्रकस ् ष् ् ीय िबाब के प्रतत ंंिेिुशीय या ांय की ब क तरि ् कुय निधध रर निरूद्ध षिकां के नयढ यँ ंं्ाषित कारक ँ ंकता ँ ा।
ABSTRACT. The present investigation entitled “Thermal responses on different wheat cultivars under different
thermal environments for Chhattisgarh plain” was carried out during Rabi season of 2009-2010, at the Research Farm of Indira Gandhi Krishi Vishwavidhyalaya, Raipur. Accumulated growing degree days (GDD) for different varieties under
different thermal environments varied considerably from sowing to maturity. Higher GDD was observed under 25
November (D1) in varieties Sujata and Amar. Highest PTU and HTU were observed in 5 January (D5) in most of the varieties. Highest HUE values were observed under 25 November, 5 December and 15 December sowing in most of the
variety except GW-273. Lowest HUE was observed under 5 January sowing (D5) in the all varieties. Lowest RUE was
observed under 5 January sowing (D5) in the all varieties. Highest IPAR values were observed under 25 November (D1) sowing in most of the varieties. Higher number of ear heads / m2 observed with 5 December and 15 December sowing.
Longer ear head (9.4 cm) was observed in first and second date of sowing (25 November and 5 December) as compared
to delayed sowing of 15 December, 25 December and 5 January. Longer ear head was observed in variety GW-273 (9.4) while minimum (8.4) was observed in Amar. Maximum grain yield 3307 kg/ha was harvested in 2nd (5 December) date of
sowing which was significantly higher as compared to before and delayed sowing. On an average significant higher grain
yield was obtained in variety Kanchan (3190 kg/ha) followed by GW-273 whereas, the lower grain yield was recorded in variety Amar (2609 kg/ha) and Sujata (2740 kg/ha) being at par to each other. Among the four varieties, GW-273 was
found to be moderately susceptible while other varieties are susceptible for thermal stress; this might be probable reason for reduction total duration and stunted crop growth.
Key words – GDD, PTU, HTU, Heat use efficiency (HUE), Radiation use efficiency (RUE), Plant Population,
Phenology and grain yield.
1. Introduction
Wheat (Triticum aestivum L) is the most widely
cultivated food grain crop of the world. It is grown
not only in temperate zones but also in tropical and
sub tropical zones. In India, wheat is the second
important staple food crop, rice being the first. It
has wide adaptability and can tolerate severe cold.
82 MAUSAM, 69, 1 (January 2018)
The best wheat are produced with cool and moist
weather during the major portion of the growing
period followed by dry warm weather during grain
filling and maturity period. Wheat (Triticum spp.) is the
major Rabi crop in India and is sensitive to various biotic
and abiotic stresses like weather and inter-seasonal
climatic variability (in terms of changes in temperature,
rainfall, radiation), soil conditions and agricultural inputs
like nitrogen, water and pesticides. Three main species
commonly grown in the world including India are the
common wheat (Triticum aestivum) the marconi or
durum wheat (Triticum durum) and the emmer
wheat (Triticum dicoccum), out of these species
maximum area is under Triticum aestivum. In India,
more than 80 per cent of the total wheat area is under
this species whereas the area under marconi and emmer
wheat, the area is only 12 per cent and 1 per cent
respectively.
In India, wheat is grown in an area of 281.93 lakh ha.
with an average productivity of 2790 kg/ha which
contributes about 25 per cent of total food grain
production of the country. The productivity of wheat in
Chhattisgarh is very low as compared to the national
average. In Chhattisgarh wheat crop is grown in 1.63 lakh
ha. with an average productivity of 1108 kg/ha. The main
reasons for low productivity are shorter winter span and
high temperature during the grain filling and maturity
stages. Seasonal temperature is important climatic factors
which have profound effects on the yield of rabi crops.
Changes in seasonal temperature affect the grain yield,
mainly through phonological development processes.
Winter crops are especially vulnerable to high temperature
during reproductive stages and differential response of
temperature change (rise) to various crops has been
noticed under different production environments. The
effect of temperature on the wheat productivity can easily
by seen in Central India because of high inter-annual
fluctuations in the productivity due to fluctuations in
seasonal temperature. The productivity of wheat is largely
dependent on the magnitude of temperature change. One
°C increase in temperature throughout the growing
seasons will have no effect or slight increase on
productivity in north India. But, an increase of 2 °C
temperature reduced potential grain yield at most of the
places (Agrawal and Sinha, 1993).
In Chhattisgarh, wheat is grown mostly under
irrigated conditions in rice based cropping system. The
sowing of wheat is often delayed due to delay in
harvesting of medium and late duration of rice varieties.
Late sown wheat crop faces high temperature during grain
filling and ripening phases which is one of the major
causes of stunted growth and low productivity of wheat in
this area. Time of sowing is one of the most important
factors which govern the crop Phenological development
and total biomass production along with efficient
conversion of biomass into economic yield. Delayed
sowing of wheat crop is exposed to sub-optimal
temperatures at establishment and supra-optimal
temperatures at reproductive phases resulting into
reduction of not only crop duration but also the yield
(Sardana et al., 1999). Temperature, being a key
component of climate, determines the seeding time and
consequently the rate and duration of growth and
productivity of any crop.
The optimum date of sowing is considered equally
important which helps in good germination and better
growth of crop plants which leads finally to better harvest.
Too much delay in sowing resulted in reduction in crop
yields. Dwarf wheat being photo-insensitive, suits in early
as well as late sowing, thus well fitted in double and
multiple cropping patterns. However, too early sowing
produces less tillers and too late sown crop produce
wrinkled seeds due to higher temperature.
The occurrence of different phenological event
during growing season of any crop and the effect of
temperature on plant growth can be inferred using
accumulated heat units or growing degree days (GDD).
The duration of each growth phase is a result of crop
response to external environmental factors. The concept of
heat units has been applied to correlate the phonological
development of different crops to predict grain yield and
phonological maturity (Swan et al., 1987).
Temperature based agro-meteorological indices such
as growing degree days (GDD) and heat use efficiency
(HUE) can be quite useful in predicting growth and yield
of crops. Growing degree days are based on the concept
that real time to attain a phonological stage is linearly
related to temperature in the range between base
temperature (Tb) and optimum temperature. Heat use
efficiency (HUE), i.e., efficiency of utilization of heat in
terms of dry matter accumulation is an important aspect,
which has great practical application. The total heat
energy available to any crop is never completely
converted to dry matter even under the most favourable
agro climatic conditions. Efficiency of conversion of heat
energy into biomass depends upon genetic factors, sowing
time and crop type (Rao et al., 1999).
2. Materials and method
2.1. Location of Experimental site
The field experiment was carried out at the Research
and Instructional farm of Indira Gandhi Krishi
Vishwavidyalaya; Raipur situated in Eastern Central part
BOBADE et al.: THERMAL RESPONSES ON DIFFERENT WHEAT CULTIVARS 83
of Chhattisgarh at latitudes of 21°.16ʹ N, longitude
81°.36ʹ E and altitude 289.5 m above mean sea level.
2.2. Experimental detail
The experiment consisting of 5 date of sowing and 4
wheat varieties were laid out in a randomized block design
with three replications.
Season : Rabi
Crop : Wheat
Date of Sowing : Five
: D1 - 25 November 2009
: D2 - 5 December 2009
: D3 - 15 December 2009
: D4 - 25 December 2009
: D5 - 5 January, 2010
Varieties : V1 _ Kanchan
: V2 _ GW-273
: V3 _ Sujata
: V4 _ Amar
Experimental design : RBD
Seed rate : 125 kg/ha
Spacing : 20 cm row to row
Plot size : 7 m × 4.4 m (30.8 m2)
Total number of plots : 60
Plot to plot distance : 0.5 m
Fertilizer doses : 100:60:40 kg/ha
N: P2O5:K2O
Irrigation : Six (One come up irrigation
and five coinciding with
critical stages)
2.3. Growing degree days
Growing Degree Days (GDD) concept assumes that
there is a direct and linear relationship between growth
and developments of plants and temperature and the
growth is dependent on the total amount of heat to which
it is subjected during its life time. The growing degree
days was computed by using following formula:
GDD = [(Tx + Tn )/2 – Base temperature]
where,
Tx = Daily maximum temperature
Tn = Daily minimum temperature
The base Temperature is defined as,
“The temperature below which no plant physiological
activity takes place” which is considered 5.0 for Rabi
crops.
2.4. Photothermal unit (PTU)
PTU is calculated by multiplying GDD with
maximum possible sunshine hours (N).
PTU = GDD × N
where,
N = maximum possible sunshine hour.
2.5. Heliothermal unit (HTU)
HTU is calculated by multiplying GDD with actual
sunshine hours (n) (Rajput, 1980).
HTU = GDD × n
where,
n = actual sunshine hour.
2.6. Heat use efficiency (HUE)
Heat Use Efficiency (HUE) for total dry matter was
obtained as under:
HUE (g/m2 /°
day) =
days°GDD
Biomass 3
m
g
2.7. Radiation use efficiency (RUE)
RUE (gMJ-1
) = Biomass (g/m-2
) / IPAR (M J-2
)
where,
IPAR is cumulative intercepted photo synthetically
active radiation.
84 MAUSAM, 69, 1 (January 2018)
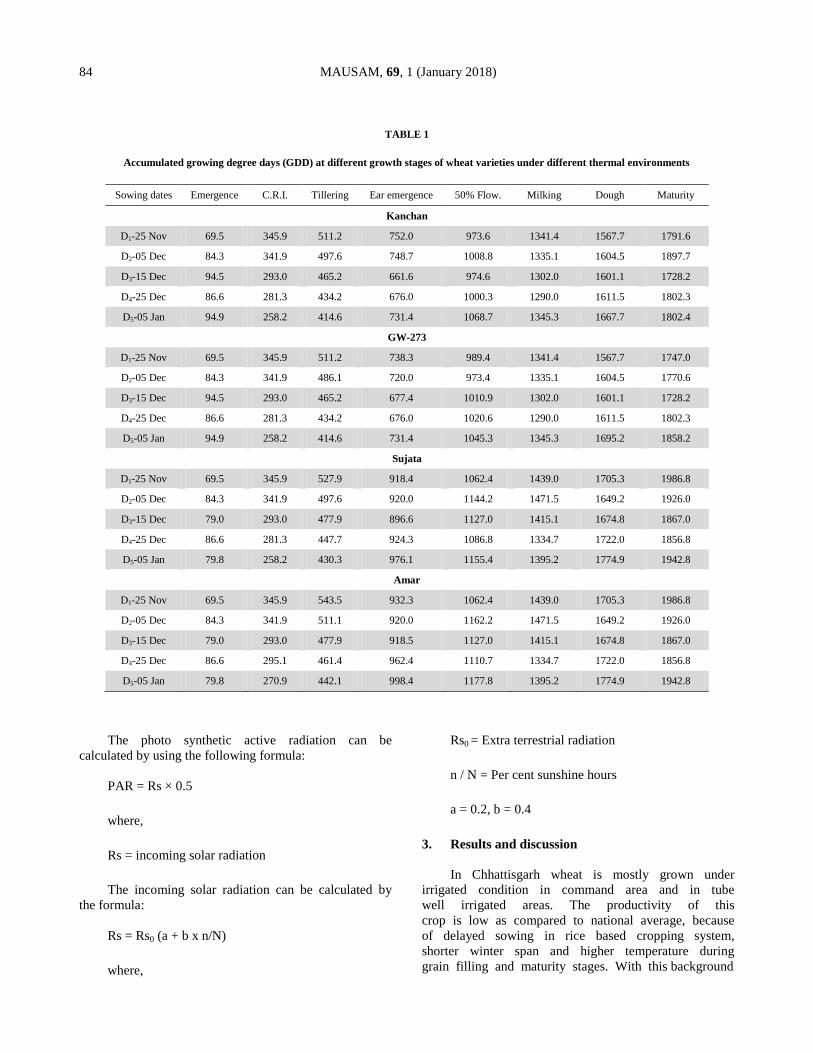
TABLE 1
Accumulated growing degree days (GDD) at different growth stages of wheat varieties under different thermal environments
Sowing dates Emergence C.R.I. Tillering Ear emergence 50% Flow. Milking Dough Maturity
Kanchan
D1-25 Nov 69.5 345.9 511.2 752.0 973.6 1341.4 1567.7 1791.6
D2-05 Dec 84.3 341.9 497.6 748.7 1008.8 1335.1 1604.5 1897.7
D3-15 Dec 94.5 293.0 465.2 661.6 974.6 1302.0 1601.1 1728.2
D4-25 Dec 86.6 281.3 434.2 676.0 1000.3 1290.0 1611.5 1802.3
D5-05 Jan 94.9 258.2 414.6 731.4 1068.7 1345.3 1667.7 1802.4
GW-273
D1-25 Nov 69.5 345.9 511.2 738.3 989.4 1341.4 1567.7 1747.0
D2-05 Dec 84.3 341.9 486.1 720.0 973.4 1335.1 1604.5 1770.6
D3-15 Dec 94.5 293.0 465.2 677.4 1010.9 1302.0 1601.1 1728.2
D4-25 Dec 86.6 281.3 434.2 676.0 1020.6 1290.0 1611.5 1802.3
D5-05 Jan 94.9 258.2 414.6 731.4 1045.3 1345.3 1695.2 1858.2
Sujata
D1-25 Nov 69.5 345.9 527.9 918.4 1062.4 1439.0 1705.3 1986.8
D2-05 Dec 84.3 341.9 497.6 920.0 1144.2 1471.5 1649.2 1926.0
D3-15 Dec 79.0 293.0 477.9 896.6 1127.0 1415.1 1674.8 1867.0
D4-25 Dec 86.6 281.3 447.7 924.3 1086.8 1334.7 1722.0 1856.8
D5-05 Jan 79.8 258.2 430.3 976.1 1155.4 1395.2 1774.9 1942.8
Amar
D1-25 Nov 69.5 345.9 543.5 932.3 1062.4 1439.0 1705.3 1986.8
D2-05 Dec 84.3 341.9 511.1 920.0 1162.2 1471.5 1649.2 1926.0
D3-15 Dec 79.0 293.0 477.9 918.5 1127.0 1415.1 1674.8 1867.0
D4-25 Dec 86.6 295.1 461.4 962.4 1110.7 1334.7 1722.0 1856.8
D5-05 Jan 79.8 270.9 442.1 998.4 1177.8 1395.2 1774.9 1942.8
The photo synthetic active radiation can be
calculated by using the following formula:
PAR = Rs × 0.5
where,
Rs = incoming solar radiation
The incoming solar radiation can be calculated by
the formula:
Rs = Rs0 (a + b x n/N)
where,
Rs0 = Extra terrestrial radiation
n / N = Per cent sunshine hours
a = 0.2, b = 0.4
3. Results and discussion
In Chhattisgarh wheat is mostly grown under
irrigated condition in command area and in tube
well irrigated areas. The productivity of this
crop is low as compared to national average, because
of delayed sowing in rice based cropping system,
shorter winter span and higher temperature during
grain filling and maturity stages. With this background
BOBADE et al.: THERMAL RESPONSES ON DIFFERENT WHEAT CULTIVARS 85
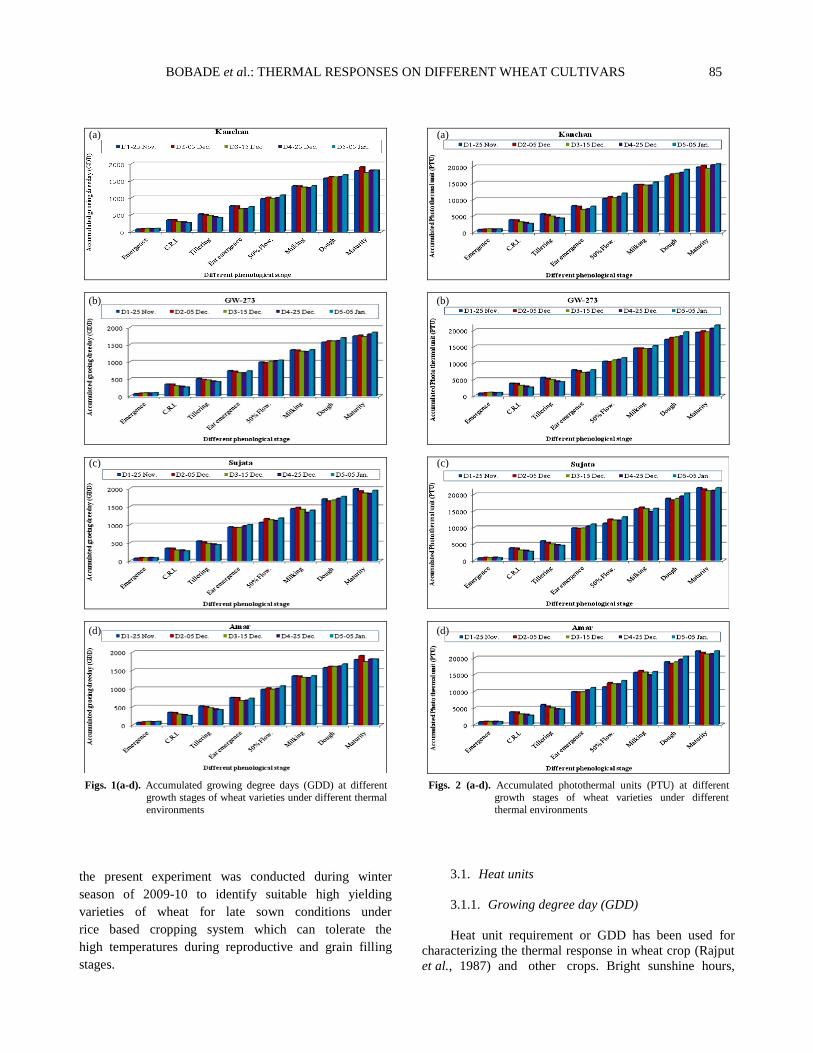
Figs. 1(a-d). Accumulated growing degree days (GDD) at different
growth stages of wheat varieties under different thermal
environments
the present experiment was conducted during winter
season of 2009-10 to identify suitable high yielding
varieties of wheat for late sown conditions under
rice based cropping system which can tolerate the
high temperatures during reproductive and grain filling
stages.
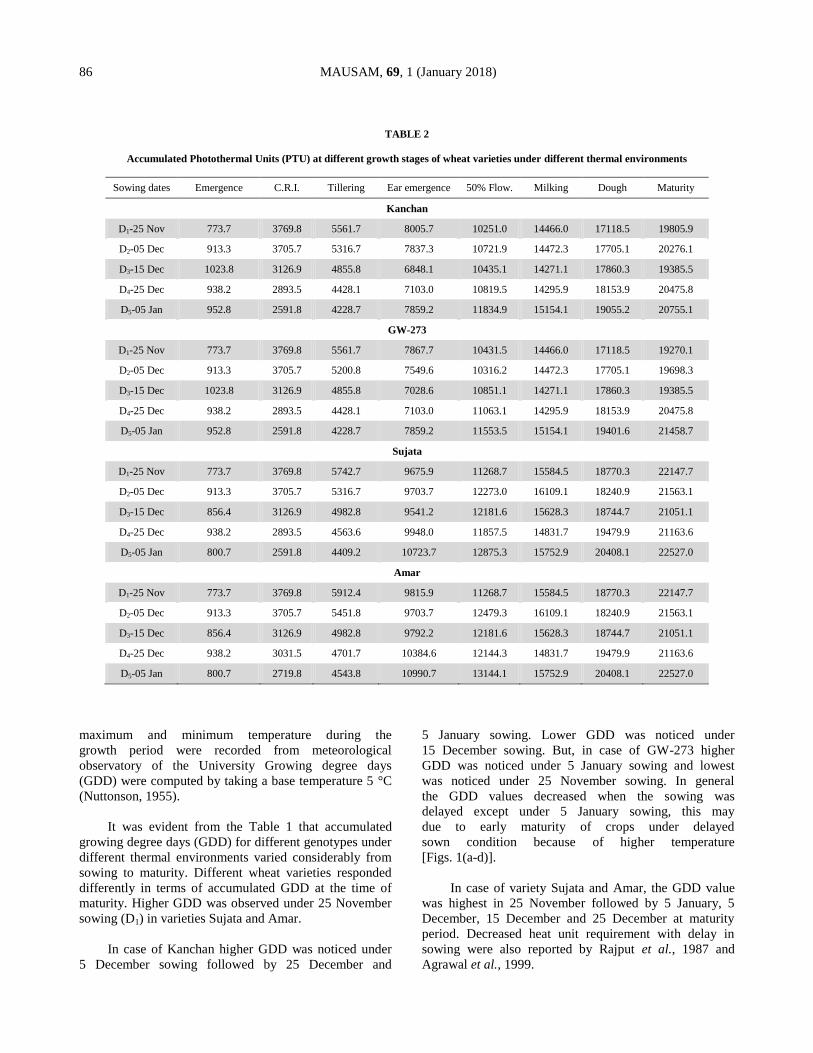
Figs. 2 (a-d). Accumulated photothermal units (PTU) at different
growth stages of wheat varieties under different
thermal environments
3.1. Heat units
3.1.1. Growing degree day (GDD)
Heat unit requirement or GDD has been used for
characterizing the thermal response in wheat crop (Rajput
et al., 1987) and other crops. Bright sunshine hours,
(a)
(b)
(c)
(d)
(a)
(b)
(c)
(d)
86 MAUSAM, 69, 1 (January 2018)
TABLE 2
Accumulated Photothermal Units (PTU) at different growth stages of wheat varieties under different thermal environments
Sowing dates Emergence C.R.I. Tillering Ear emergence 50% Flow. Milking Dough Maturity
Kanchan
D1-25 Nov 773.7 3769.8 5561.7 8005.7 10251.0 14466.0 17118.5 19805.9
D2-05 Dec 913.3 3705.7 5316.7 7837.3 10721.9 14472.3 17705.1 20276.1
D3-15 Dec 1023.8 3126.9 4855.8 6848.1 10435.1 14271.1 17860.3 19385.5
D4-25 Dec 938.2 2893.5 4428.1 7103.0 10819.5 14295.9 18153.9 20475.8
D5-05 Jan 952.8 2591.8 4228.7 7859.2 11834.9 15154.1 19055.2 20755.1
GW-273
D1-25 Nov 773.7 3769.8 5561.7 7867.7 10431.5 14466.0 17118.5 19270.1
D2-05 Dec 913.3 3705.7 5200.8 7549.6 10316.2 14472.3 17705.1 19698.3
D3-15 Dec 1023.8 3126.9 4855.8 7028.6 10851.1 14271.1 17860.3 19385.5
D4-25 Dec 938.2 2893.5 4428.1 7103.0 11063.1 14295.9 18153.9 20475.8
D5-05 Jan 952.8 2591.8 4228.7 7859.2 11553.5 15154.1 19401.6 21458.7
Sujata
D1-25 Nov 773.7 3769.8 5742.7 9675.9 11268.7 15584.5 18770.3 22147.7
D2-05 Dec 913.3 3705.7 5316.7 9703.7 12273.0 16109.1 18240.9 21563.1
D3-15 Dec 856.4 3126.9 4982.8 9541.2 12181.6 15628.3 18744.7 21051.1
D4-25 Dec 938.2 2893.5 4563.6 9948.0 11857.5 14831.7 19479.9 21163.6
D5-05 Jan 800.7 2591.8 4409.2 10723.7 12875.3 15752.9 20408.1 22527.0
Amar
D1-25 Nov 773.7 3769.8 5912.4 9815.9 11268.7 15584.5 18770.3 22147.7
D2-05 Dec 913.3 3705.7 5451.8 9703.7 12479.3 16109.1 18240.9 21563.1
D3-15 Dec 856.4 3126.9 4982.8 9792.2 12181.6 15628.3 18744.7 21051.1
D4-25 Dec 938.2 3031.5 4701.7 10384.6 12144.3 14831.7 19479.9 21163.6
D5-05 Jan 800.7 2719.8 4543.8 10990.7 13144.1 15752.9 20408.1 22527.0
maximum and minimum temperature during the
growth period were recorded from meteorological
observatory of the University Growing degree days
(GDD) were computed by taking a base temperature 5 °C
(Nuttonson, 1955).
It was evident from the Table 1 that accumulated
growing degree days (GDD) for different genotypes under
different thermal environments varied considerably from
sowing to maturity. Different wheat varieties responded
differently in terms of accumulated GDD at the time of
maturity. Higher GDD was observed under 25 November
sowing (D1) in varieties Sujata and Amar.
In case of Kanchan higher GDD was noticed under
5 December sowing followed by 25 December and
5 January sowing. Lower GDD was noticed under
15 December sowing. But, in case of GW-273 higher
GDD was noticed under 5 January sowing and lowest
was noticed under 25 November sowing. In general
the GDD values decreased when the sowing was
delayed except under 5 January sowing, this may
due to early maturity of crops under delayed
sown condition because of higher temperature
[Figs. 1(a-d)].
In case of variety Sujata and Amar, the GDD value
was highest in 25 November followed by 5 January, 5
December, 15 December and 25 December at maturity
period. Decreased heat unit requirement with delay in
sowing were also reported by Rajput et al., 1987 and
Agrawal et al., 1999.
BOBADE et al.: THERMAL RESPONSES ON DIFFERENT WHEAT CULTIVARS 87
TABLE 3
Accumulated Heliothermal Units (HTU) at different growth stages of wheat varieties under different thermal environments
Sowing dates Emergence C.R.I. Tillering Ear emergence 50% Flow. Milking Dough Maturity
Kanchan
D1-25 Nov 610.4 2667.9 3872.2 5253.5 7375.5 10464.6 12506.3 14464.3
D2-05 Dec 626.5 2457.6 3601.1 5310.8 7391.6 10415.4 12834.0 14861.5
D3-15 Dec 567.7 2057.6 3008.4 4806.1 7321.9 10519.0 13140.6 14369.1
D4-25 Dec 552.0 1800.1 3071.8 4984.3 7973.4 10595.0 13609.7 15306.3
D5-05 Jan 715.1 1733.7 3123.5 5693.8 9030.9 11427.3 14352.1 15693.6
GW-273
D1-25 Nov 610.4 2667.9 3872.2 5245.3 7375.5 10276.4 12506.3 14040.3
D2-05 Dec 626.5 2457.6 3500.6 5050.6 7168.6 10415.4 12834.0 14382.5
D3-15 Dec 567.7 2057.6 3008.4 4927.4 7645.2 10519.0 13140.6 14369.1
D4-25 Dec 552.0 1800.1 3071.8 4984.3 8176.4 10595.0 13609.7 15306.3
D5-05 Jan 715.1 1733.7 3123.5 5693.8 8787.1 11427.3 14626.6 16203.3
Sujata
D1-25 Nov 610.4 2667.9 3994.1 6782.7 7891.2 11228.8 13848.4 16323.3
D2-05 Dec 626.5 2457.6 3601.1 6684.9 8563.8 11760.9 13258.1 15848.7
D3-15 Dec 431.8 2057.6 3117.2 6696.2 8780.7 11550.4 13875.2 15523.7
D4-25 Dec 552.0 1800.1 3202.7 7182.6 8831.7 11019.1 14526.6 15851.3
D5-05 Jan 645.4 1733.7 3230.6 8106.9 9640.8 11923.8 15424.1 16991.1
Amar
D1-25 Nov 610.4 2667.9 3997.2 6883.2 7891.2 11228.8 13848.4 16323.3
D2-05 Dec 626.5 2457.6 3708.7 6684.9 8713.2 11760.9 13258.1 15848.7
D3-15 Dec 431.8 2057.6 3117.2 6893.3 8780.7 11550.4 13875.2 15523.7
D4-25 Dec 552.0 1808.3 3337.5 7580.7 9061.1 11019.1 14526.6 15851.3
D5-05 Jan 645.4 1857.4 3234.1 8327.2 9831.2 11923.8 15424.1 16991.1
3.1.2. Photo thermal unit (PTU)
Different wheat varieties responded differently in
terms of accumulated PTU at the time of maturity.
Highest PTU was observed under 5 January sowing (D5)
in the all varieties.
Photothermal unit (PTU) for different genotypes
under different thermal environment varied considerably
at maturity (Table 2). In case of variety Sujata and Amar
the highest PTU was observed under 5 January followed
by 25 November, 5 December, 25 December and 15
December. In case of GW-273 maximum PTU was
observed in 5 January followed by 25 December, 5
December, 15 December and 25 November. The highest
PTU value was observed in case of Kanchan under sow
date of 5 January which is followed by 25 December, 5
December, 25 November and 15 December. Highest PTU
was observed under 5 January sowing (D5) in the all
varieties [Figs. 2 (a-d)].
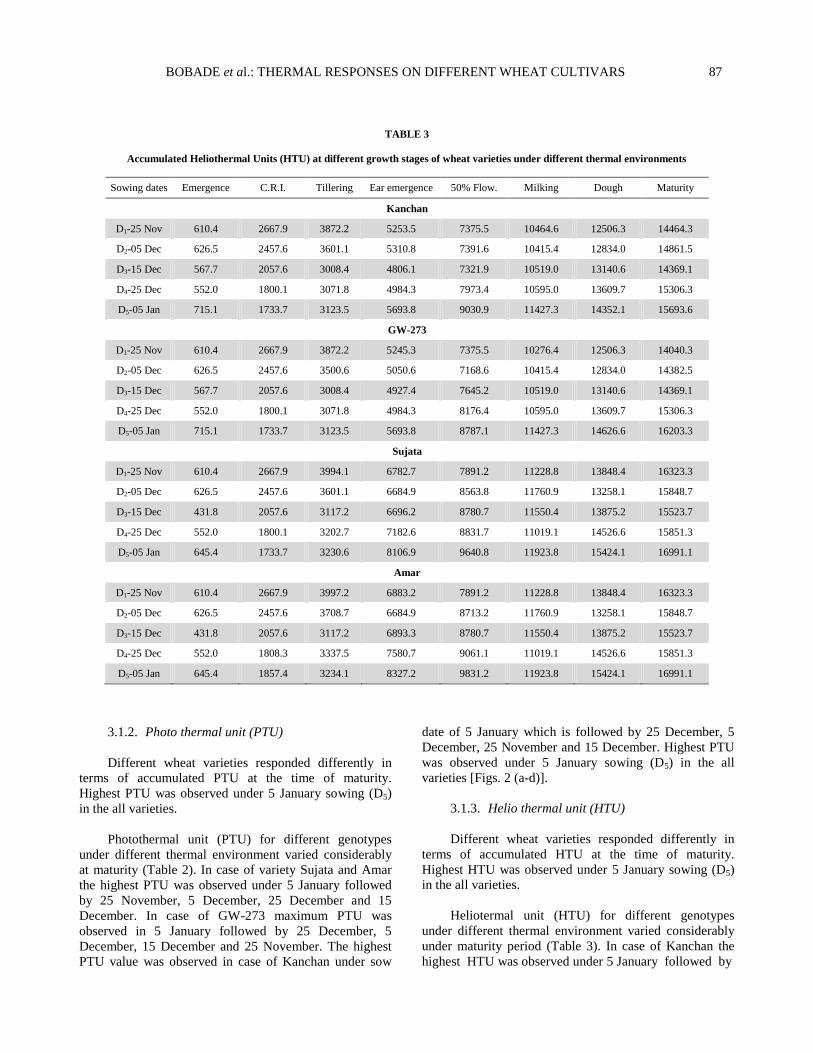
3.1.3. Helio thermal unit (HTU)
Different wheat varieties responded differently in
terms of accumulated HTU at the time of maturity.
Highest HTU was observed under 5 January sowing (D5)
in the all varieties.
Heliotermal unit (HTU) for different genotypes
under different thermal environment varied considerably
under maturity period (Table 3). In case of Kanchan the
highest HTU was observed under 5 January followed by
88 MAUSAM, 69, 1 (January 2018)
Figs. 3(a-d). Accumulated heliothermal units (HTU) at different
growth stages of wheat varieties under different thermal environments
25 December, 5 December, 25 November and 15
December. In case of GW-273 maximum HTU was
observed in 5 January followed by 25 December, 5
December, 15 December and 25 November. In variety
Sujata the highest HTU was observed in 5 January
followed by 25 November, 25 December, 5 December and
15 December. But in case of Amar highest HTU value
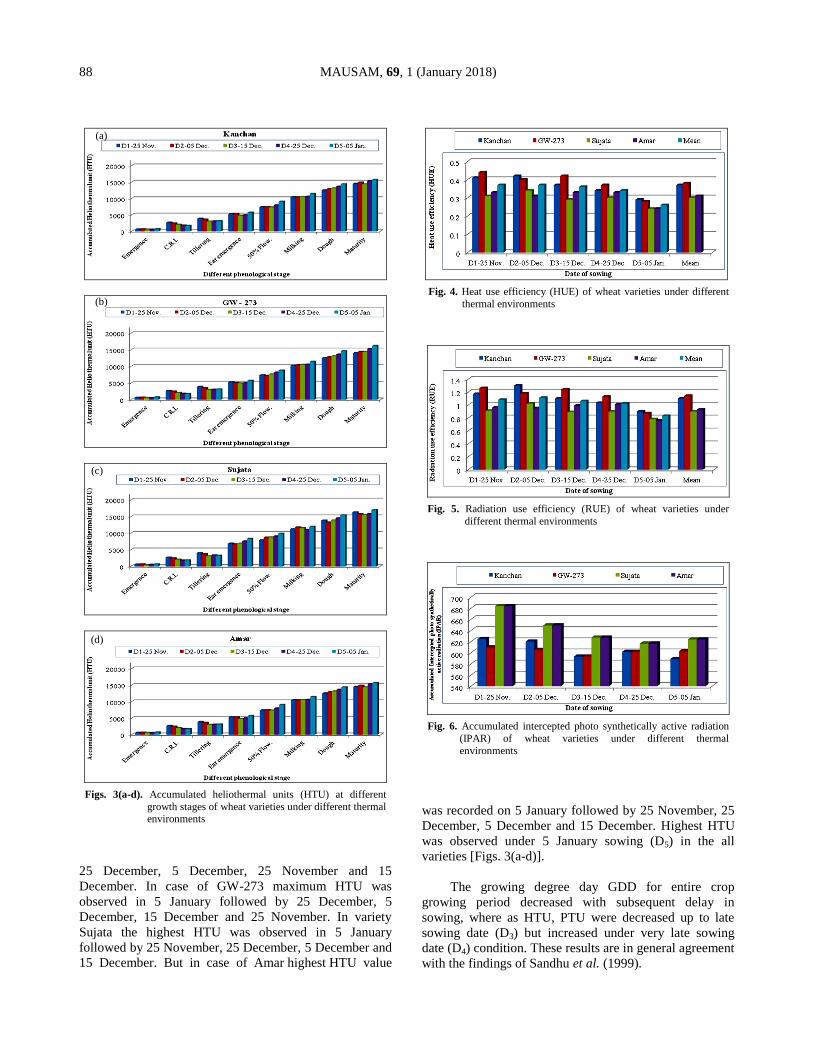
Fig. 4. Heat use efficiency (HUE) of wheat varieties under different
thermal environments
Fig. 5. Radiation use efficiency (RUE) of wheat varieties under
different thermal environments
Fig. 6. Accumulated intercepted photo synthetically active radiation
(IPAR) of wheat varieties under different thermal
environments
was recorded on 5 January followed by 25 November, 25
December, 5 December and 15 December. Highest HTU
was observed under 5 January sowing (D5) in the all
varieties [Figs. 3(a-d)].
The growing degree day GDD for entire crop
growing period decreased with subsequent delay in
sowing, where as HTU, PTU were decreased up to late
sowing date (D3) but increased under very late sowing
date (D4) condition. These results are in general agreement
with the findings of Sandhu et al. (1999).
(a)
(b)
(c)
(d)
BOBADE et al.: THERMAL RESPONSES ON DIFFERENT WHEAT CULTIVARS 89
TABLE 4
Heat use efficiency (HUE) of wheat varieties under different thermal environments
Varieties Heat use efficiency (gm/m2 deg day/m2)
D1-25 Nov D2-05 Dec D3-15 Dec D4-25 Dec D5-05 Jan Mean
Kanchan 0.41 0.42 0.37 0.34 0.29 0.37
GW-273 0.44 0.40 0.42 0.37 0.28 0.38
Sujata 0.31 0.34 0.29 0.30 0.24 0.30
Amar 0.33 0.31 0.33 0.33 0.24 0.31
Mean 0.37 0.37 0.36 0.34 0.26
TABLE 5
Radiation Use Efficiency (RUE) of wheat varieties under different thermal environments
Varieties
Radiation Use Efficiency (g MJ-1)
D1-25 Nov D2-05 Dec D3-15 Dec D4-25 Dec D5-05 Jan Mean
Kanchan 1.17 1.30 1.10 1.03 0.90 1.10
GW-273 1.26 1.18 1.24 1.13 0.87 1.14
Sujata 0.91 1.02 0.89 0.90 0.78 0.90
Amar 0.96 0.95 0.99 1.01 0.76 0.93
Mean 1.08 1.11 1.06 1.02 0.83
TABLE 6
Accumulated Intercepted photo synthetically active radiation (IPAR) of wheat varieties under different thermal environments
Varieties
Intercepted photo synthetically active radiation (MJ m-1)
D1-25 Nov D2-05 Dec D3-15 Dec D4-25 Dec D5-05 Jan
Kanchan 624.74 620.33 593.29 601.87 588.94
GW-273 609.97 605.12 593.29 601.87 602.96
Sujata 683.94 649.36 627.42 616.65 624.19
Amar 683.94 649.36 627.42 616.65 624.19
The occurrence of different Phenological events
during growing season of any crop and the effect of
temperature on plant growth can be inferred using
accumulated heat units or growing degree days (GDD).
The duration of each growth phase is a result of crop
response to external environmental factors. The concept of
heat units has been applied to correlate the Phenological
development of different crops to predict grain yield and
physiological maturity (Swan et al., 1987).
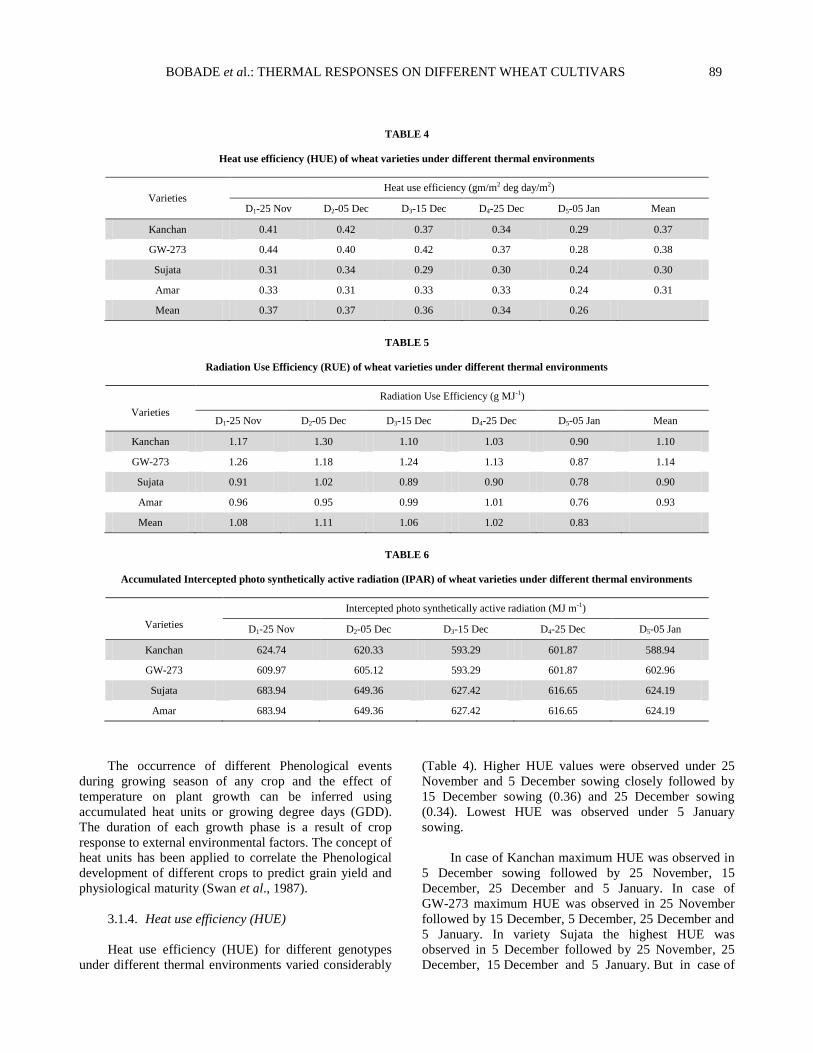
3.1.4. Heat use efficiency (HUE)
Heat use efficiency (HUE) for different genotypes
under different thermal environments varied considerably
(Table 4). Higher HUE values were observed under 25
November and 5 December sowing closely followed by
15 December sowing (0.36) and 25 December sowing
(0.34). Lowest HUE was observed under 5 January
sowing.
In case of Kanchan maximum HUE was observed in
5 December sowing followed by 25 November, 15
December, 25 December and 5 January. In case of
GW-273 maximum HUE was observed in 25 November
followed by 15 December, 5 December, 25 December and
5 January. In variety Sujata the highest HUE was
observed in 5 December followed by 25 November, 25
December, 15 December and 5 January. But in case of
90 MAUSAM, 69, 1 (January 2018)
TABLE 7
Effect of different thermal environments on phenology of wheat varieties
Sowing dates Crop growth stages
Emergence C.R.I. Tillering Ear emergence 50% Flow milking Dough maturity
Kanchan
D1-25 Nov 5 22 34 51 68 89 100 110
D2-05 Dec 5 22 34 52 69 86 98 107(3)
D3-15 Dec 6 21 33 48 66 82 95 100(10)
D4-25 Dec 6 20 32 48 65 78 91 98(12)
D5-05 Jan 7 19 30 48 64 76 88 93(17)
GW-273
D1-25 Nov 5 22 34 50 69 89 100 108
D2-05 Dec 5 22 33 50 67 86 98 105(3)
D3-15 Dec 6 21 33 49 68 82 95 100(8)
D4-25 Dec 6 20 32 48 66 78 91 98(10)
D5-05 Jan 7 19 30 48 63 76 89 95(13)
Sujata
D1-25 Nov 5 22 35 64 74 94 106 118
D2-05 Dec 5 22 34 64 76 92 100 111(7)
D3-15 Dec 5 21 34 62 74 87 98 105(13)
D4-25 Dec 6 20 33 61 69 80 95 100(18)
D5-05 Jan 6 19 31 60 68 78 92 98(20)
Amar
D1-25 Nov 5 22 36 65 74 94 106 118
D2-05 Dec 5 22 35 64 77 92 100 111(7)
D3-15 Dec 5 21 34 63 74 87 98 105(13)
D4-25 Dec 6 21 34 63 70 80 95 100(18)
D5-05 Jan 6 20 32 61 69 78 92 98(20)
Amar the HUE values were similar in 25 November, 15
December, 25 December, sowing followed by 5 December
and 5 January. Lowest HUE was observed under
5 January sowing (D5) in the all varieties. On the mean
basis higher HUE was observed with variety GW-273
followed by Kanchan. Variety Amar and Sujata were
found with lower HUE because of late duration variety
(Fig. 4).
Kumari et al. (2009) reported that the date of sowing
the timely (20 November) sown wheat crop exhibited
maximum HUE of 2.23 kg grain ha-1
deg days-1
. Timely
sowing (20 November) of wheat crop, in this (Ranchi)
region, seems to be essential for harnessing the good
impact of the prevailing weather conditions.
3.1.5. Radiation use efficiency (RUE)
Radiation Use Efficiency (RUE) for different
genotypes under different thermal environments varied
considerably (Table 5). On the mean basis higher RUE
value was observed under 5 December sowing followed
by 25 November, 15 December, 25 December and 5
January sowing. Among the varieties GW-273 showed
better in terms of RUE followed by Kanchan, Amar and
Sujata.
In case of GW-273 maximum RUE was observed in
25 November followed by 15 December, 5 December, 25
December and 5 January. In variety Sujata the
highest RUE was observed in 5 December followed by 25
BOBADE et al.: THERMAL RESPONSES ON DIFFERENT WHEAT CULTIVARS 91
TABLE 8
Plant population of wheat varieties as influenced by different thermal environments
Varieties Plant population/m2
D1 D2 D3 D4 D5 Mean
Kanchan 216 226 246 211 210 222
GW-273 210 248 215 195 191 212
Sujata 200 250 238 225 215 226
Amar 215 243 240 211 203 222
Mean 210 242 235 211 205
SEm+/- CD ( P = 0.05) CV (%)
D 3.5 9.9 5.4
V 3.1 8.9
D × V 7.0 19.9
TABLE 9
Plant height (c.m.) per plant of wheat varieties at 10 days intervals under different thermal environments
Sowing dates Days after sowing
30 40 50 60 70 80 90 Maturity
Kanchan
D1-25 Nov 35.6 47.2 64.6 77.7 79.5 82.1 83.0 84.7
D2-05 Dec 34.3 41.6 55.8 71.3 73.3 78.0 78.2 80.3
D3-15 Dec 34.0 39.4 52.1 66.2 73.4 77.7 79.6 80.0
D4-25 Dec 31.6 40.8 50.6 69.1 69.8 75.0 75.4 77.1
D5-05 Jan 24.8 38.7 46.0 57.0 67.6 68.0 69.6 74.1
GW-273
D1-25 Nov 37.4 44.2 61.3 74.3 76.7 78.0 82.8 84.6
D2-05 Dec 31.4 49.8 64.1 75.7 78.2 80.6 83.3 85.8
D3-15 Dec 31.0 40.4 53.2 68.7 72.4 76.7 80.2 82.6
D4-25 Dec 30.3 38.4 51.5 68.0 70.9 75.1 78.7 81.9
D5-05 Jan 28.2 37.1 46.4 58.7 67.2 72.4 78.5 80.5
Sujata
D1-25 Nov 30.4 52.8 60.1 78.0 90.7 94.0 95.5 98.7
D2-05 Dec 37.2 54.2 66.7 81.3 93.4 101.4 103.0 105.0
D3-15 Dec 30.4 42.0 56.7 75.8 80.6 91.6 94.5 96.4
D4-25 Dec 30.0 40.3 48.9 55.8 75.5 88.7 90.4 93.5
D5-05 Jan 28.7 35.8 37.8 51.0 66.1 86.9 88.4 91.2
Amar
D1-25 Nov 34.6 44.4 62.7 76.5 87.9 94.4 96.6 98.1
D2-05 Dec 31.9 51.6 61.9 76.7 94.3 97.4 99.1 101.0
D3-15 Dec 31.6 41.2 52.9 68.2 81.5 91.9 94.3 96.3
D4-25 Dec 30.0 40.5 51.4 59.7 78.4 88.4 92.0 94.4
D5-05 Jan 28.3 33.9 37.4 51.6 63.8 86.3 89.7 92.3
92 MAUSAM, 69, 1 (January 2018)
November, 25 December, 15 December and 5 January.
But in case of Amar highest RUE value was recorded
on 25 December followed by 15 December, 25 November,
5 December and 5 January. Lowest RUE was
observed under 5 January sowing (D5) in the all varieties
(Fig. 5).
The mean HUE in kg ha-1
deg day-1
varied from
2.21 for normal date (1st
week of December) of sowing
to 1.27 for vary late sowing (1st week of January)
Patra and Sahu (2007). Similar findings were also reported
by Rao et al. (1999). The results revealed that under
normal sowing condition the crop accumulated higher
amount of heat unit than late sown condition. The RUE
and HUE were also higher for earlier sowings than later
sowings.
3.1.6. Intercepted photo synthetically active
radiation (IPAR)
Intercepted photo synthetically active radiation
(IPAR) for different genotypes under different thermal
environments varied considerably from sowing to
maturity (Table 6). Highest IPAR values were observed
under 25 November (D1) sowing in most of the all
varieties.
Intercepted photo synthetically active radiation
(IPAR) for different genotypes under different thermal
environments varied considerably under maturity period
(Table 6). In case of Kanchan the highest IPAR was
observed under 25 November followed by 5 December, 25
December, 15 December and 5 January. In case of
GW-273 maximum IPAR was observed in 25 November
followed by 5 December, 25 December, 15 December and
5 January. In variety Sujata the highest IPAR was
observed in 25 November followed by 5 December, 15
December, 5 January and 25 December. But in case of
Amar highest IPAR value was recorded on 25 November
followed by 5 December, 15 December, 5 January and
25 December. Lowest IPAR was observed under 5
January sowing (D5) in the varieties Kanchan and
GW-273 (Fig. 6).
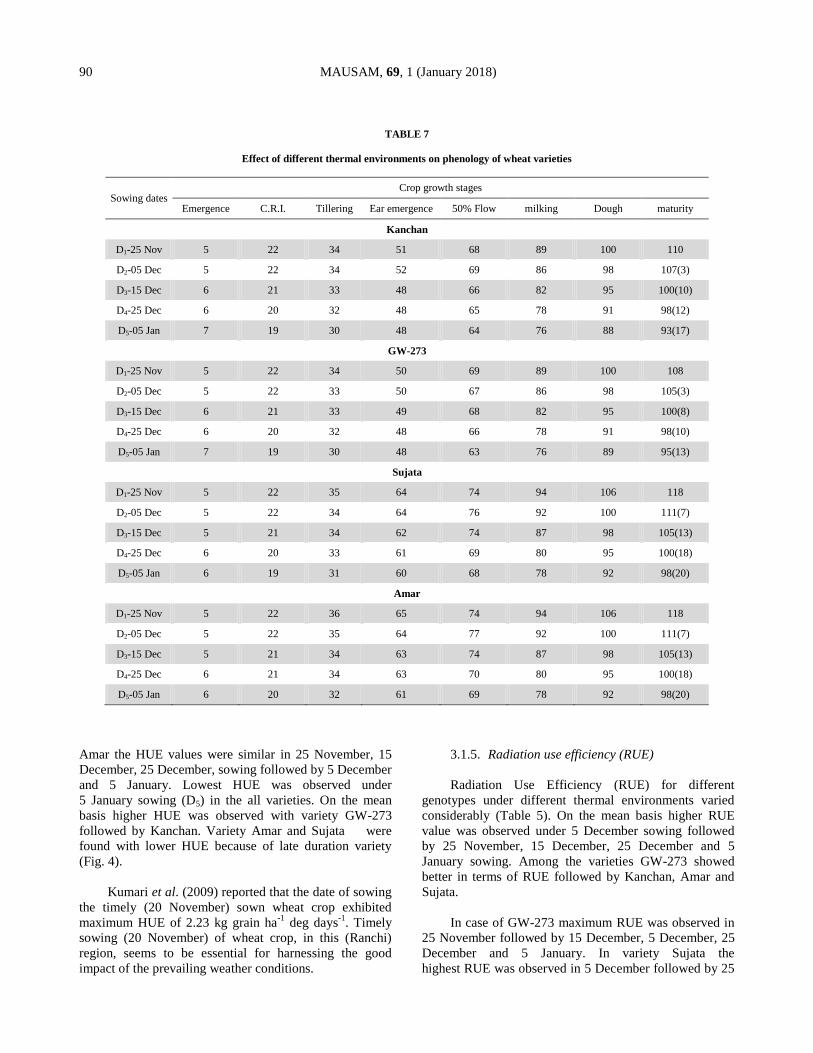
3.1.7. Phenological studies
The days taken from sowing to emergence, CRI,
tillering, ear head emergence, 50% flowering, milking,
dough and maturity of wheat varieties under different
thermal environments are given in Table 7.
The result reveals that days taken for emergence
increased gradually from 5 days to 7 days when the
sowing was delayed from 25 November to 5 January at
10 days interval. However, in general 5 to 6 days is
required for emergence. Delayed sown crop took more
number of days for emergence due to low temperature
at the time of sowing on 25 December and 5 January. The
mean temperature was below 20.0°C at the time of sowing
on 25 November, 25 December and 5 January whereas the
mean temperature was above 20.0°C on 5 and 15
December sowing.
Different varieties did not showed remarkable
variation in days taken for emergence under different
respective thermal environments. The occurrence of
phenological events in wheat crop was affected due to
different thermal environments (Table 7) the duration for
emergence was delayed by 2 days in different varieties
when sowing was delayed from 25 November to 5
January. The Phenological events such as CRI, tillering,
ear emergence 50 per cent flowering, milking, dough and
maturity decreased appreciably with delay in sowing.
However days for these phenological events varied from
variety to variety due to their response to different
environments.
It can be seen that the highest effect of thermal
stress on phonological stages was observed in cv. Sujata
and Amar followed by Kanchan. The least effect of
thermal stress was observed in case of GW-273 (13 days).
The variety GW-273 was not affected much due to
thermal stress and the duration decreased only by 10 and
13 days respectively under 25 December and 5 January
sowing.
The least difference in days taken for sowing to
maturity was only 13 days in GW-273, while the decrease
in duration from sowing to maturity was maximum of 20
days in case of Sujata and Amar Similarly duration of
other phenological events decreased to a considerable
extent in delayed sowing of 5 January as compare to
sowing on 25 November.
In central India, the winter span is shorter
as compared to North India. The mean temperature
was 26.6 °C at maturity under early sowing of
25 November. Whereas, it was 29.5 °C in late sown crop
of 5 January. Adverse effect of higher temperature on
wheat crop had also been reported by Agrawal et al.
(1999). It has been well documented that thermal stress is
immediately expressed by any plant through phenological
stages.
The results of phenology of wheat crop under five
dates of sowing showed that the duration of different
phenological events started decreasing right from CRI and
continued in all the stages as the sowing was delayed after
25 November. The decrease in duration at these stages
varied differently for different varieties.
BOBADE et al.: THERMAL RESPONSES ON DIFFERENT WHEAT CULTIVARS 93
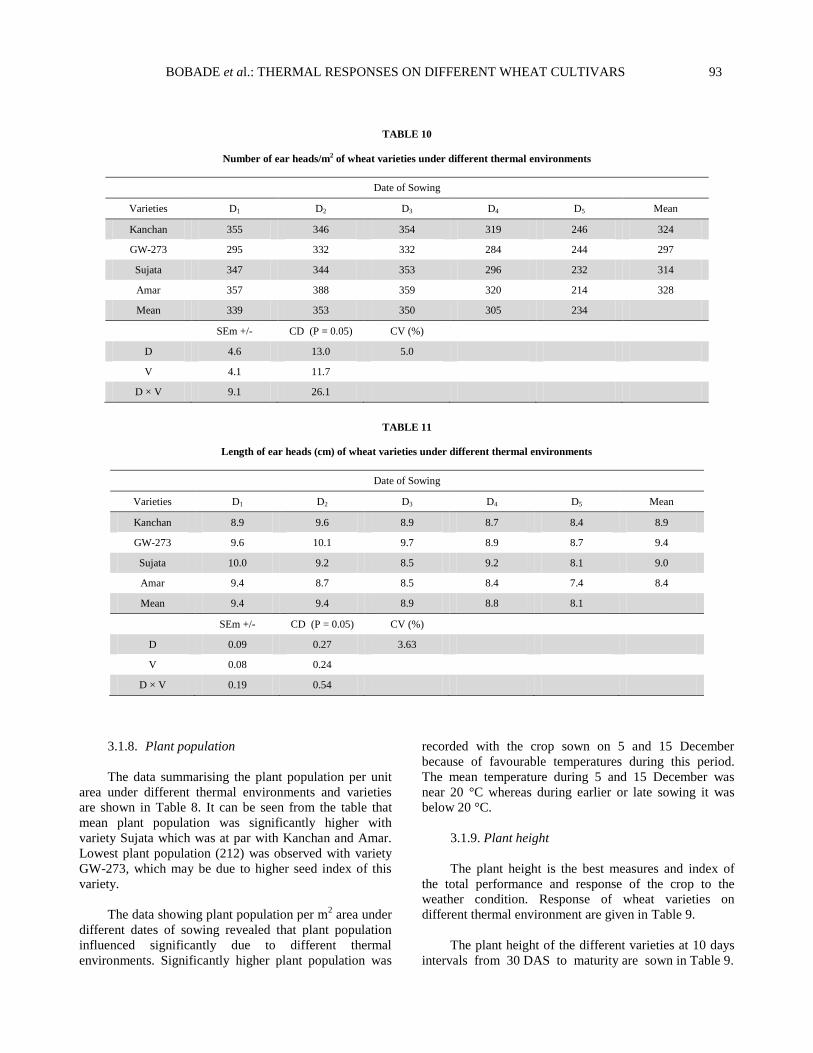
TABLE 10
Number of ear heads/m2 of wheat varieties under different thermal environments
Date of Sowing
Varieties D1 D2 D3 D4 D5 Mean
Kanchan 355 346 354 319 246 324
GW-273 295 332 332 284 244 297
Sujata 347 344 353 296 232 314
Amar 357 388 359 320 214 328
Mean 339 353 350 305 234
SEm +/- CD (P = 0.05) CV (%)
D 4.6 13.0 5.0
V 4.1 11.7
D × V 9.1 26.1
TABLE 11
Length of ear heads (cm) of wheat varieties under different thermal environments
Date of Sowing
Varieties D1 D2 D3 D4 D5 Mean
Kanchan 8.9 9.6 8.9 8.7 8.4 8.9
GW-273 9.6 10.1 9.7 8.9 8.7 9.4
Sujata 10.0 9.2 8.5 9.2 8.1 9.0
Amar 9.4 8.7 8.5 8.4 7.4 8.4
Mean 9.4 9.4 8.9 8.8 8.1
SEm +/- CD (P = 0.05) CV (%)
D 0.09 0.27 3.63
V 0.08 0.24
D × V 0.19 0.54
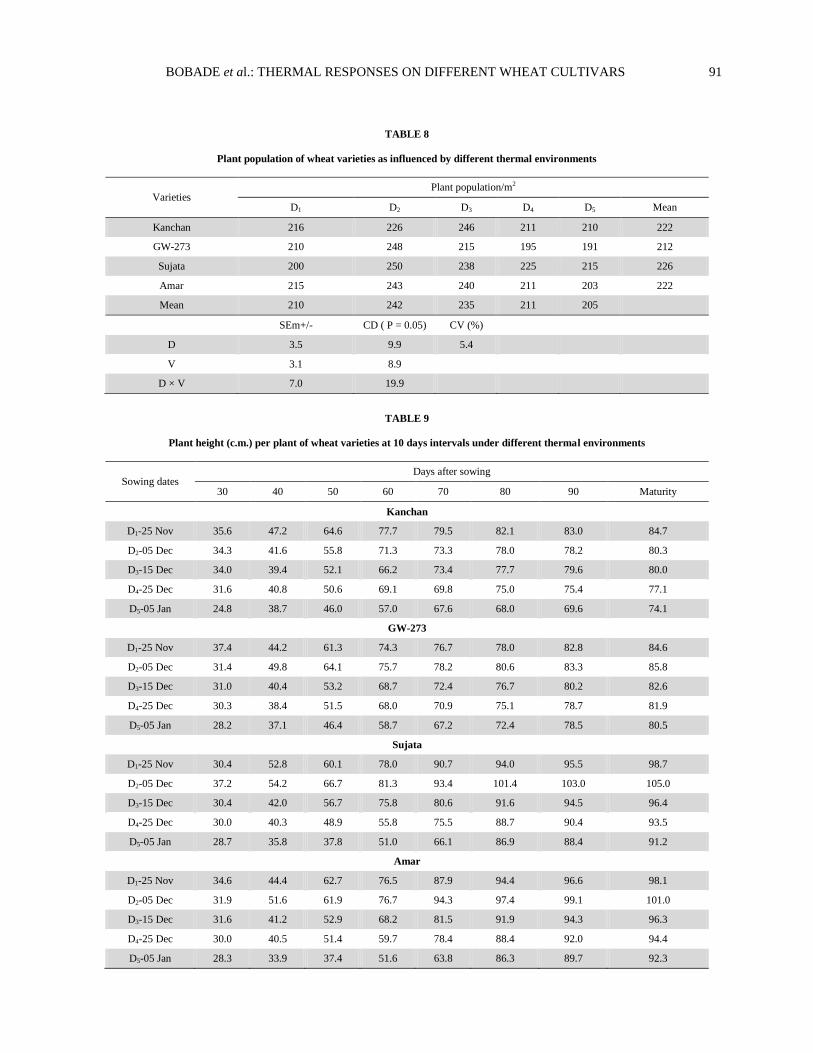
3.1.8. Plant population
The data summarising the plant population per unit
area under different thermal environments and varieties
are shown in Table 8. It can be seen from the table that
mean plant population was significantly higher with
variety Sujata which was at par with Kanchan and Amar.
Lowest plant population (212) was observed with variety
GW-273, which may be due to higher seed index of this
variety.
The data showing plant population per m2 area under
different dates of sowing revealed that plant population
influenced significantly due to different thermal
environments. Significantly higher plant population was
recorded with the crop sown on 5 and 15 December
because of favourable temperatures during this period.
The mean temperature during 5 and 15 December was
near 20 °C whereas during earlier or late sowing it was
below 20 °C.
3.1.9. Plant height
The plant height is the best measures and index of
the total performance and response of the crop to the
weather condition. Response of wheat varieties on
different thermal environment are given in Table 9.
The plant height of the different varieties at 10 days
intervals from 30 DAS to maturity are sown in Table 9.
94 MAUSAM, 69, 1 (January 2018)
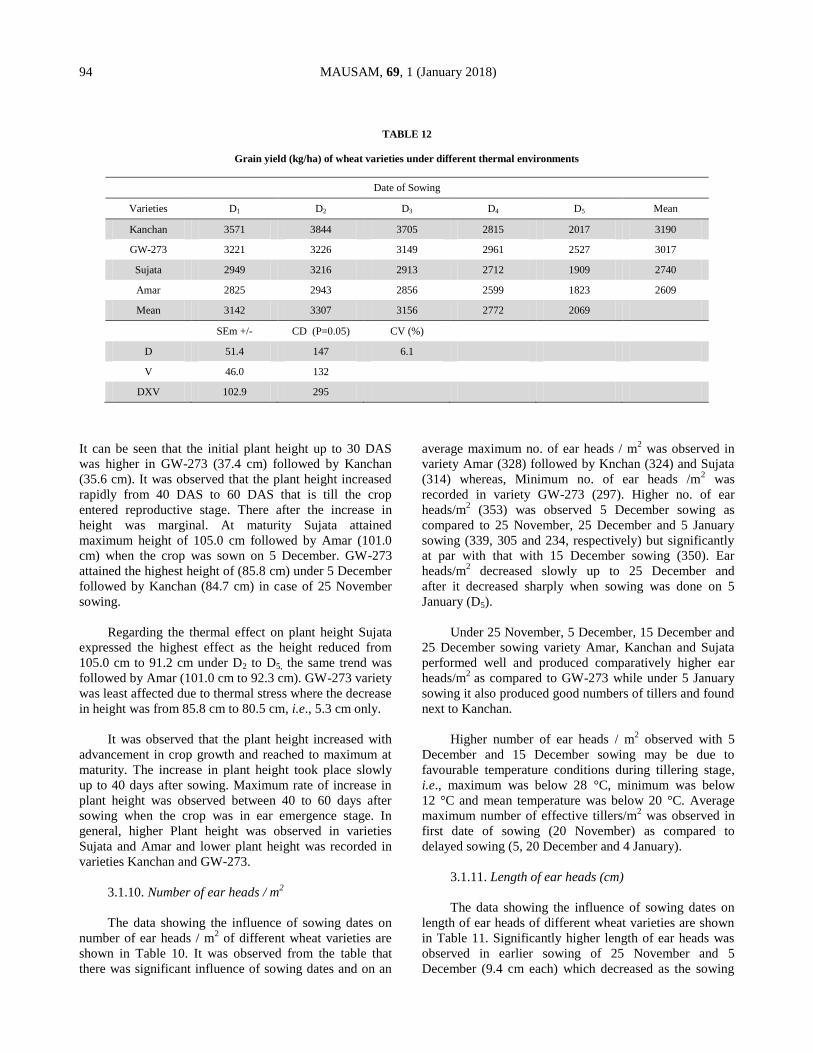
TABLE 12
Grain yield (kg/ha) of wheat varieties under different thermal environments
Date of Sowing
Varieties D1 D2 D3 D4 D5 Mean
Kanchan 3571 3844 3705 2815 2017 3190
GW-273 3221 3226 3149 2961 2527 3017
Sujata 2949 3216 2913 2712 1909 2740
Amar 2825 2943 2856 2599 1823 2609
Mean 3142 3307 3156 2772 2069
SEm +/- CD (P=0.05) CV (%)
D 51.4 147 6.1
V 46.0 132
DXV 102.9 295
It can be seen that the initial plant height up to 30 DAS
was higher in GW-273 (37.4 cm) followed by Kanchan
(35.6 cm). It was observed that the plant height increased
rapidly from 40 DAS to 60 DAS that is till the crop
entered reproductive stage. There after the increase in
height was marginal. At maturity Sujata attained
maximum height of 105.0 cm followed by Amar (101.0
cm) when the crop was sown on 5 December. GW-273
attained the highest height of (85.8 cm) under 5 December
followed by Kanchan (84.7 cm) in case of 25 November
sowing.
Regarding the thermal effect on plant height Sujata
expressed the highest effect as the height reduced from
105.0 cm to 91.2 cm under D2 to D5, the same trend was
followed by Amar (101.0 cm to 92.3 cm). GW-273 variety
was least affected due to thermal stress where the decrease
in height was from 85.8 cm to 80.5 cm, i.e., 5.3 cm only.
It was observed that the plant height increased with
advancement in crop growth and reached to maximum at
maturity. The increase in plant height took place slowly
up to 40 days after sowing. Maximum rate of increase in
plant height was observed between 40 to 60 days after
sowing when the crop was in ear emergence stage. In
general, higher Plant height was observed in varieties
Sujata and Amar and lower plant height was recorded in
varieties Kanchan and GW-273.
3.1.10. Number of ear heads / m2
The data showing the influence of sowing dates on
number of ear heads / m2 of different wheat varieties are
shown in Table 10. It was observed from the table that
there was significant influence of sowing dates and on an
average maximum no. of ear heads / m2 was observed in
variety Amar (328) followed by Knchan (324) and Sujata
(314) whereas, Minimum no. of ear heads /m2 was
recorded in variety GW-273 (297). Higher no. of ear
heads/m2 (353) was observed 5 December sowing as
compared to 25 November, 25 December and 5 January
sowing (339, 305 and 234, respectively) but significantly
at par with that with 15 December sowing (350). Ear
heads/m2 decreased slowly up to 25 December and
after it decreased sharply when sowing was done on 5
January (D5).
Under 25 November, 5 December, 15 December and
25 December sowing variety Amar, Kanchan and Sujata
performed well and produced comparatively higher ear
heads/m2
as compared to GW-273 while under 5 January
sowing it also produced good numbers of tillers and found
next to Kanchan.
Higher number of ear heads / m2 observed with 5
December and 15 December sowing may be due to
favourable temperature conditions during tillering stage,
i.e., maximum was below 28 °C, minimum was below
12 °C and mean temperature was below 20 °C. Average
maximum number of effective tillers/m2 was observed in
first date of sowing (20 November) as compared to
delayed sowing (5, 20 December and 4 January).
3.1.11. Length of ear heads (cm)
The data showing the influence of sowing dates on
length of ear heads of different wheat varieties are shown
in Table 11. Significantly higher length of ear heads was
observed in earlier sowing of 25 November and 5
December (9.4 cm each) which decreased as the sowing
BOBADE et al.: THERMAL RESPONSES ON DIFFERENT WHEAT CULTIVARS 95
was delayed from 5 December to 15, 25 December and 5
January. It was observed from the table that on an average
the highest length of ear heads was observed in varieties
GW-273 (9.4) which was significant superior over other
varieties whereas the lowest length of ear head was
observed in variety Amar (8.4). Wheat variety Kanchan
and Sujata were found at par to each other with respect to
length of ear heads.
Length of ear heads of different wheat varieties was
influenced due to temperature and shifting thermal
environment. Longer ear head (9.4 cm) was observed in
first and second date of sowing (25 November and 5
December) as compared to delayed sowing of 15
December, 25 December and 5 January. Longer ear head
was observed in variety GW-273 (9.4) while minimum
(8.4) was observed in Amar. Longer ear heads was
observed in variety GW-273 (9.4) while minimum
(8.4 cm) was observed in Amar. This may be due to
different genetic constituents of these wheat varieties.
3.1.12. Grain yield (kg/ha)
The data pertaining to influence of different thermal
environments on grain yield of different wheat varieties
are given in Table 12. It was observed from the table that
maximum grain yield 3307 kg/ha was harvested in 2nd
date of sowing which was significantly higher as
compared to before and delayed sowing. Sowing of wheat
on 25 November and 15 December being at par to each
other produced significant higher grain yield as compared
to 25 December and 5 January sowing which were
differed significant among them significant lowest grain
yield was recorded with sowing of wheat on 5 January. On
an average significant higher grain yield was obtained in
variety Kanchan (3190 kg/ha) followed by GW-273
whereas, the lower grain yield was recorded in variety
Amar (2609 kg/ha) and Sujata (2740 kg/ha) being at
par to each other. Interaction effect of sowing dates and
varieties was found significant and it was found that
under 25 November, 5 and 15 December sowing
variety Kanchan produced comparatively higher yield, but
under delayed sown condition GW-273 produced higher
yield.
4. Conclusions
It was found that the first date of sowing (25
November) took more number of days from sowing to
maturity as compared to delayed sowings. Maximum
duration to attained maturity was found in wheat cultivar
Sujata (118 days) and Amar (118 day) followed by
Kanchan (110 days), GW-273 (108 days). In general the
duration of all varieties shortened due to delayed sowing.
Delayed sown crop took more number of days for
emergence due to low temperature at the time of sowing
on 25 December and 5 January.
It can be seen that the highest effect of thermal stress
on phonological stages was observed in cv. Sujata and
Amar followed by Kanchan. The least effect of thermal
stress was observed in case of GW-273 (13 days). The
variety GW-273 was not affected much due to thermal
stress and the duration decreased only by 10 and 13 days
respectively under 25 December and 5 January sowing.
Significantly higher plant population was recorded with
the crop sown on 5 and 15 December because of
favourable temperatures during this period.
The increase in plant height took place slowly up to
40 days after sowing. Maximum rate of increase in plant
height was observed between 40 to 60 days after sowing
when the crop was in ear emergence stage. In general,
higher plant height was observed in varieties Sujata and
Amar and lower plant height was recorded in varieties
Kanchan and GW-273.
Higher number of ear head /m2 (353) was observed
5 December sowing as compared to 25 November, 25
December and 5 January sowing but significantly at par
with that with 15 December sowing (350). Ear heads/m2
decreased slowly up to 25 December and after it decreased
sharply when sowing was done on 5 January (D5).
Length of ear of different wheat varieties was
influenced due to temperature and shifting thermal
environment. Longer ear head (9.4 cm) was observed in
first and second date of sowing (25 November and 5
December) as compared to delayed sowing of 15
December, 25 December and 5 January. Longer ear head
was observed in variety GW-273 (9.4) while minimum
(8.4) was observed in Amar. Number of grain/ear head
with 5 December sowing was found next that of 25
November sowing but significant superior over 15 and 25
December sowing. Significantly lower number of
grains/ear head was observed with 5 January sowing.
Among different variety GW-273 produced significantly
higher number of grains/ear head closely followed
by Kanchan being at par to each other (50 and
48, respectively) Sujata and Amar produced lower number
of grains/ear head and were found statistically similar
to each other.
The accumulated growing degree days (GDD) for
different genotypes under different thermal environments
varied considerably during different growth stages.
Different wheat varieties responded differently in terms of
accumulated GDD at the time of maturity. Higher GDD
was observed under 25 November sowing (D1) in varieties
Sujata and Amar. Highest PTU and HTU was observed
96 MAUSAM, 69, 1 (January 2018)
under 5 January sowing (D5) in the all varieties. Highest
HUE values were observed under 25 November, 5
December and 15 December sowing in most of the
variety. Lowest HUE was observed under 5 January
sowing (D5) in the all varieties. Radiation Use Efficiency
(RUE) for different genotypes under different thermal
environments varied considerably. Lowest RUE was
observed under 5 January sowing (D5) in the all varieties.
Highest IPAR values were observed under 25 November
(D1) sowing in most of the all varieties.
Disclaimer : The contents and views expressed in this
research paper/article are the views of the authors and do
not necessarily reflect the views of the organizations they
belong to.
References
Agrawal, P. K. and Sinha, S. K., 1993, “Effect of increase in carbon
dioxide and temperature on wheat yield in India”, Journal of
Agrometeorology, 48, 811-814.
Agrawal, K. K., Sanker, U., Upadhyay, A. P. and Gupta, V. K., 1999,
“Accumulated heat unit requirements for different phenophases
of wheat (Triticum aestivum) cultivars as influenced by sowing dates at Jabalpur”, Journal of Agro meteorology, 1, 2, 173-176.
Kumari, P., Wadood, A., Singh, R. S. S. and Kumar, R., 2009,
“Response of wheat crop to different thermal regimes under the
agroclimatic conditions of Jharkhand”, Journal of
Agrometeorology, 11, 1, 85-88.
Nuttonson, M. Y., 1955, “Wheat climatic relationship and use of
phenology in ascertaining the thermal and photo thermal
requirements of wheat”, Am. Inst .Crop Ecol. Washington D.C.
Patra, B. K. and Sahu, D. D., 2007, “Use of agrometeorological indices
for suitable sowing time of wheat under south saurashtra
agroclimatic zone of Gujarat”, Journal of Agrometeorology, 9, 1, 74-80.
Rajput, R. P., 1980, “Response of soybean crop to climatic and soil
environment”, Ph. D. Thesis, IARI, New Delhi.
Rajput, R. P., Deshmukh, M. R. and Paradker, V. K., 1987,
“Accumulated heat units and phenology relationship in wheat as
influenced by planting dates under late sown conditions”,
Journal of Agronomy Crop Science, 159, 345-349.
Rao, V. U. M., Singh, Diwan and Singh, Raj, 1999, “Heat use efficiency
of winter crops in Haryana”, Journal of Agrometeorology, 1, 2, 143-148.
Sandhu, I. S., Sharma, A. R. and Sur, H. S., 1999, “Yield
performance and heat unit requirement of wheat (Triticum aestivum) varieties as affected by sowing dates under rainfed
condition”, Indian Journal of Agricultural Science”, 69, 3,
175-179.
Swan, J. B., Schneider, E. C., Moncrief, J. E., Paulson, W. H. and
Peterson, A. E., 1987, “Estimating crop growth yields and grain
moisture from air growing degree-days and residue cover”, Journal of Agronomy, 79, 53-60.
Sardana, V., Sharma, S. K. and Randhawa, A. S., 1999, “Performance of wheat cultivars under different sowing dates and levels of
nitrogen under rainfed condition”, Annals of Agricultural
Research, 20, 1, 60-63.