thermal infrared remote sensing of hydrocarbon …consistency of the landsat 8 oli and etm imagery...
TRANSCRIPT
33
THERMAL INFRARED REMOTE SENSING OF HYDROCARBON IN LAGOS- SOUTHERN NIGERIA: APPLICATION OF THE
THERMOGRAPHIC MODEL
*Moses E. Emetere1, Samuel E. Sanni3, Jennifer M. Emetere2, and Uno E. Uno2
1Department of Physics, Covenant University, Canaan land, P.M.B 1023, Ota-Nigeria 22Department of Physics, Federal University of Technology, Minna-Nigeria 3Department of Chemical Engineering, Covenant University, Ota-Nigeria
Received: 22 Aug. 2016, Revised: 7 Oct. 2016, Accepted: 20 June 2017
ABSTRACT: The paper presents a technique for investigating remote sensing imagery to explore hydrocarbon sites, oil traps and spills. This research adopts a model approach to oil exploration against conventional or traditional methods. The model used here is the Environmental Thermographic Model (ETM). Key parameters such as surface emissivity, surface temperature, long wave radiation and geological mapping which constitute the model were used alongside data generated from the Moderate Resolution Imaging Spectro-radiometer (MODIS) in order to identify the location of prospective oil or gas reservoir in Lagos-Southern Nigeria. MODIS data generated over a period of ten years was analyzed. The ETM model and a temperature polynomial expansion scheme (TPES) were used to validate the remote sensing data by using calculated surface emissivity and long wave technique. Two thermal infrared sources were deployed to aid oil field investigations. The consistency of the Landsat 8 OLI and ETM imagery further confirms the reliability of the method in determining the characteristics of the hydrocarbon habitat, as well as the lineaments. Keywords: Emissivity, Environmental thermographic model, Remote sensing, Oil exploration 1. INTRODUCTION
Recently, two exploration companies (Lekoil and Afren PLC), on mounting a joint drilling operation discovered significant reserves of oil off the coast of Lagos State, southwest Nigeria [1]. The specification of the oil reserve was given as 66 m of oil bearing sediment beds over a 160 m section of deposits to 3600m depth between Cretaceous and Early Paleocene sandstones. The lateral situation or compositions of the oil bearing deposits is not yet clear because these findings are based on particular a position of a single well. The application of remote sensing to discover hydrocarbon sources is far cheaper than the traditional subsurface analysis (SA) of sedimentary basin. The subsurface analysis is a very challenging process because it is error prone. For example, an error made in the map construction may cause ripple effect on other processes like acquiring physical measurements and developing conceptual numerical subsurface model. Another challenge of subsurface analysis is its high cost and the intense rigours of embarking on the subsurface analysis of a large land mass. For instance, it takes time to analyse the lateral spread or containment of crude oil in this region of Lagos state despite the iterative processes involved in subsurface analysis. In principle, RS is less encompassing and involving relative to SA however, the main advantage of remote sensing (RS) of oil fields is its wider field of view (WFV) and the ability of the sensor to spread its visibility over a wide range or area. Furthermore, RS saves time, effort and cost in terms of understanding the earth science of a particular area. In this paper, the use of RS is discussed, especially on its use as a tool which has the capacity to cover or capture likely extensions of any hydrocarbon habitat.
Remote Sensing entails the use of satellite sensors to sense visible and infrared rays (IR) from
the earth's surface and atmosphere. The IR channel senses infrared energy at many wavelengths. The IR senses heat in the range of IR wavelengths of 10.2 to 11.2μm. Wavelengths within 8 - 12μm [10] is referred to as thermal infrared rays (TIR). TIR may likely have some interference because its infrared channel is an integration of radiation emitted by the earth's surface, the atmosphere and cloud tops. However, its ratio depends on the location of the globe. The Landsat technology was the first remote sensing method adopted in the analysis of hydrocarbons however, with improvements in technology, the microwave technology became a more preferred remote sensing method. Active microwave sensors like Synthetic Aperture Radars (SAR) capture two-dimensional images of oils [18-19]. Prior studies reveal that ultraviolet (UV) ranges of the spectrum have shown a wider geological application [20-22], although its major challenge lies in the intense absorption of UV radiation by the atmosphere i.e. a high absorption of radiation of both long and short waves in the atmosphere. Short Wave Infrared (SWI) interval of the electromagnetic spectrum is also applied as a remote sensing technique for detecting hydrocarbons. Ana et al. [36] determined the features of assemblages and chemical changes in areas affected by hydrocarbon micro-seepages using remote sensing technique and geothermal tools. Mapping of surface features of altered and unaltered Wingate Sandstone outcrops in Lisbon Valley, Utah was carried out. The Spectral angle method was applied on hy-map hyperspectral data to classify the extent of altered and unaltered outcrops, as well as to map the changes in mineral content within the outcrops in the area. Lithological changes were identified by the aid of the spectral feature fitting method. Freed et al. [37] reviewed the advantages of multispectral RS and its advantages to geologists in carrying out qualitative assessments
International Journal of GEOMATE, Nov., 2017, Vol.13, Issue 39, pp.33-45 Geotec., Const. Mat. & Env., ISSN:2186-2990, Japan, DOI: https://doi.org/10.21660/2017.39.41553
International Journal of GEOMATE, Nov., 2017, Vol.13, Issue 39, pp.33-45
34
of surface compositions. The authors highlighted the usefulness of Hyperspectral remote sensing for mapping surface mineralogy. Hence, RS can be used to reveal proxies to P-T trajectories and fluid pathways in alteration systems.
Metternict and Zinck [38], highlighted ways of using several sensors such as aerial photographs, satellite-airborne multispectral sensors, microwave sensors, video imagery, airborne geophysics sensors, hyperspectral sensors, and electromagnetic induction meters for remote identification and mapping of salt-affected areas. Khakim et al [39] carried out the application of geomechanical inversion to surface uplift data obtained from a differential interferometric synthetic aperture radar (InSAR) stacking technique in the estimation of the change in oil volume distribution in an oil-sand reservoir undergoing steam injection or steam assisted gravity drainage. A two-step inversion algorithm was adopted; one for the estimation of reservoir depths and to model reservoir deformation, and another which employs the least-squares inversion with a penalty function alongside a smoothing factor to effectively invert the distribution of reservoir deformation and volume change from surface uplift data. They proposed a model / inversion technique for accurate estimation of reservoir deformation using InSAR-derived ground surface deformations.
According to Saif et al [40], an Interferometric technique using Synthetic Aperture Radar data was applied to studying infinitesimal changes in topographic elevations. The study confirms the significance of the RS technique to study sub-surface geological structures, which can influence the integrity of the reservoir seal leading to migration of hydrocarbons to other formation zones. Trieschmann et al., [23] suggested that SAR application to oil fields can be used to spot oil spills. Other technologies such as the Infrared/ultraviolet (IR/UV) scanning is applied to quantify the area covered by the oil film; microwave radiometer (MWR) is used to estimate the thickness of oil films while the Laser-Fluoro-Sensor (LFS) is used for oil type classifications. Although these methods complement one another, the need for improved thermal satellite technology [24] is paramount if a higher level of accuracy is desired.
The combined frequency response of its sensor determines the total effective bandwidth. The effective bandwidth determines both the quantum and net transmission efficiency of the Satellite. This feature of the thermal infrared enables it to be applied for lineament analysis. Thermal Infrared radiation (TIR) remote sensing allows for the retrieval of emissions and thermal recovery at specific bands. Previous studies have shown that the use of TIR for environmental monitoring, oil spill investigation, slick thickness evaluation, and classification of oil type [30]. Based on mapping results of TIR images, thick oil appears hot, intermediate thicknesses of oil appears cool while thin oil or sheens are not detectable because there is no spectral structure [31]. Hence, the limitation of the technology includes its inability to uncover emulsions in the images captured. In addition, the probability of the overpass and the clear skies occurring at the same time alters TIR results, the
properties of oil surface on water in the TIR region and multiple reflections from water surface [32].
When TIR penetrates through oil, the emissivity of the oil becomes lower emissivity than that of water and this can further be enhanced by monitoring the long wave signatures therein [3]. The limitations of TIR can be monitored in order to ascertain the kind of heat flux expected using the thermographic model which depends on the geological features of the region. Lineament analysis of remotely sensed data can give very important information on tectonic structures. It can also be used to determine potential oil and gas reservoirs. Recently, oil related firms such as Woods Hood Research Center, United State Geological Survey, Imstrat, MAP GAC have adopted the Geomatica software from PCI Geomatics and satellite sensors for preliminary estimation of the field dip and sites of prospective hydrocarbon reservoirs. In this paper, we introduce a new technique for discovering hydrocarbon reservoirs using the Environmental Thermographic Model were recently reported [3].
The basic concept of the ETM is that the earth acts as a photographic plate to determine activities within and outside the earth. The fundamental parameter i.e. the ground temperature was used ab-initio for in-situ experiments. However, the ground temperature can be substituted with other parameters such as sensible heat, emissivity, heat flux and long-wave radiation. In this research, emissivity was selected as the fundamental parameter. The ground temperature or emissivity can be determined using RS and ground measurements [4-9]. Emissivity varies for different media and is dependent on wavelength. For instance, the emissivity of water bodies is almost uniform while that of land varies with vegetation, geology and surface moisture. Thermal infrared emissivity occurs via hemispheric integration of middle infrared directional emissivities and temperature, independent of the spectral indices of the emission [10]. In this paper, we examined the geological features of Lagos state by determining the thermal properties of the oil bearing sites at that location using the TIR and ETM with good predictions showing that the ETM approach complements the limitation of the TIR for explorative processes. The advantage of this study over the convectional techniques discussed above is its economic preference and technical accuracy.
2. LOCATION OF STUDY AREA
The study area is on a narrow coastal plain of the Bight of Benin, south west of Nigeria. It lies approximately on longitudes 2.48’E and 3.26’E and between latitudes 6.24’N and 6.25’N as shown in figure 1 below. The dominant vegetation in this area is swampy forest consisting of fresh water and mangrove swamp. It has two climatic seasons; the dry season which subsists from November-March and the wet season that covers April-October. The coastal areas in south western Nigeria are characterized by an annual average daily global irradiation of about 4200Wh/m2/day. The mean daily sunshine duration in the coastal plain is given as 4.6 hours per day [11]. The study area is
International Journal of GEOMATE, Nov., 2017, Vol.13, Issue 39, pp.33-45
35
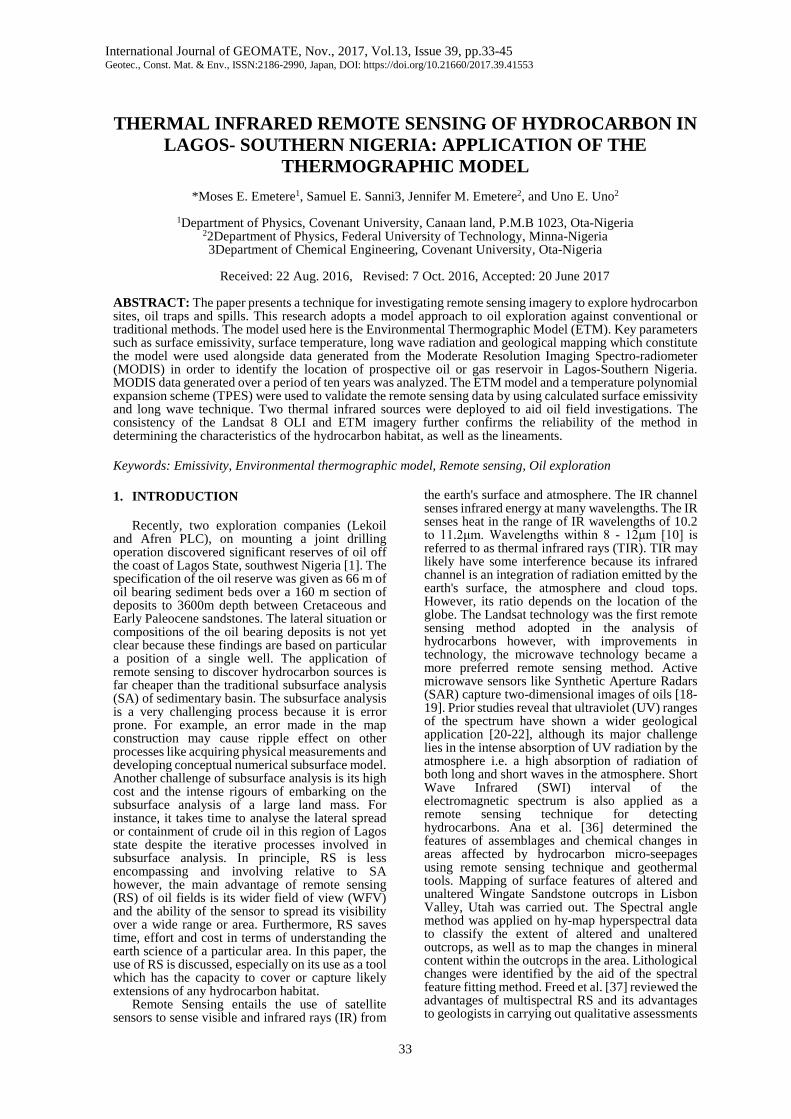
underlain by a crystalline basement in the geological map of the water ways as shown in Figure 1b and that of the earth surface, as in Figure 1c. The area consists of alluvial deposits which consist of coarse unsorted sand with clay lenses, unconsolidated sands and occasional pebble beds.
Figure 1a: Geographical map Nigeria showing Lagos
state; Figure 1b: Seismic survey of West Africa (Ref 1) ; Figure 3: The geology of Lagos State (Ref 2)
The location of the 'hydrocarbon habitat'
reported by the company is located at CPL 310 (see the blue arrow in figure 1b). The location detected by RS-using the ETM is shown in the red box in Figure 1b. The red arrow shows the extension of the
fractured zone inland Lagos state. Figure [1c] shows the geological extension of the coastline to the earth surface and the hydrocarbon sites. 3. METHODOLOGY: APPLICATION OF ENVIRONMENTAL THERMOGRAPHIC MODEL
A thirteen years thermal infrared dataset [2] used for this research was obtained from the Moderate Resolution Imaging Spectroradiometer (MODIS). MODIS instrument have 36 spectral bands at three different spatial resolutions. However, there is little information on how each band could be effective in detecting hydrocarbon via seepage, oil spillage or oil & gas reservoir. Though MODIS has been applied to solve several oil field challenges [25,26], its accuracy in measuring some parameters e.g. emissivity could be essential for hydrocarbon detection. In this research, seven bands of the TERRA MODIS were used for emissivity and land surface temperature (LST) estimation. The Landsat imagery from the Landsat 8, ETM and Pan Mosaic were used to access the geological expression of the location. About 450,000 ground datasets was obtained from the Davis automatic weather station.
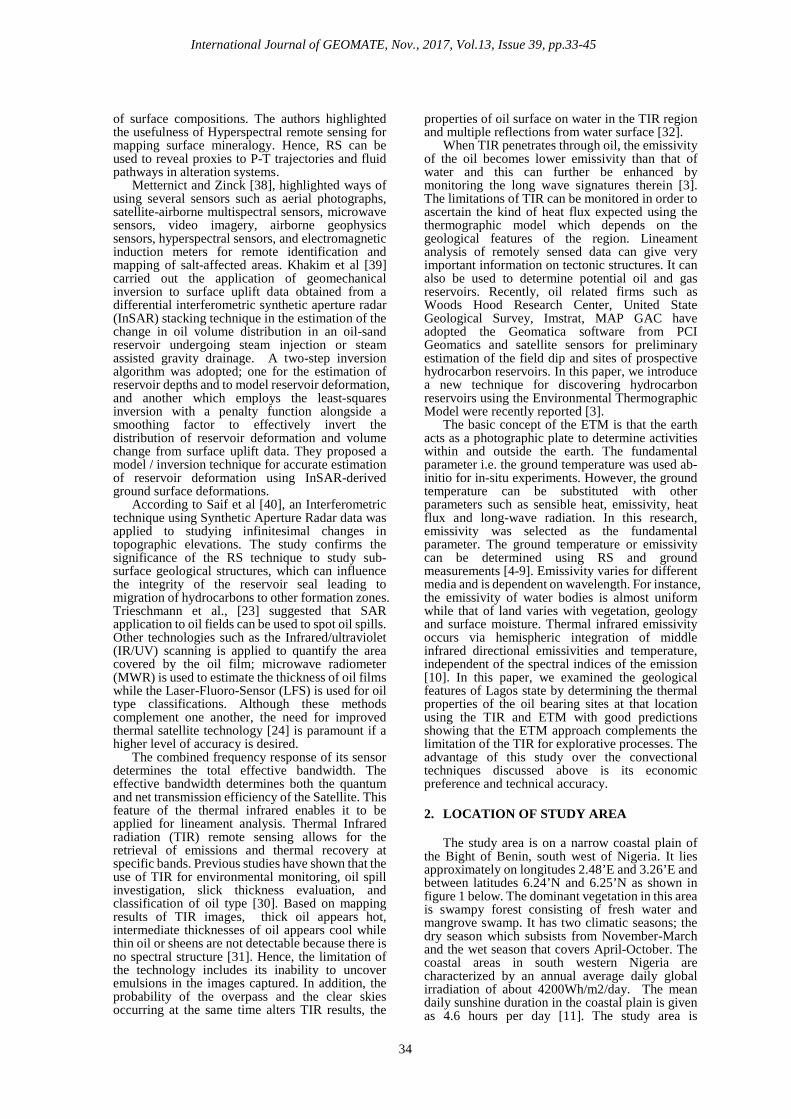
The ETM is a surface investigative technique like geothermal prospecting method. ETM works on some salient assumption proposed for oil field exploration. The oil or gas reservoir/rocks are assumed to be permeable [12]. This makes hydrocarbons escaping at a particular rate from the reservoir become visible by the aid of satellite imagery. The geological formations of the area are used to determine the thermal signatures of the hydrocarbon compounds trapped in the soil or water bodies. This trapped compounds are displayed through an information provider where permeable rocks within the earth’s crust are localized at a particular layer of the top soil and may remain as part of the soil composition due to human activities on the ground surface, see the pictorial model in Figures [2a & 2c].
From the ETM concept, the earth or ocean basin is the thermographic film that registers events below the earth crust as shown in Figure [2c]. For example, the thermograph shows different emissions based on its emission potential (emissivity) and due to the presence of underlying compounds below the earth’s crust. As soon as some radio waves are sent through a sub-surface, the reflections and refractions bring about the formation of the images recorded on the automated unit. The emissivity recorded is a measure of the ability of a material in the earth’s surface or sub-surface to radiate and absorb the projected radiation energy. Essentially, the thermographic model used
a
b
International Journal of GEOMATE, Nov., 2017, Vol.13, Issue 39, pp.33-45
36
here examines the emissivity of the hydrocarbon signatures in Lagos-Nigeria. The emissivity from the trapped hydrocarbons and water bodies is expected to be dissimilar (Figure 2c) which is expected to influence the satellite imagery.
Figure 2a: Transferred hydrocarbon from source
to traps in a reservoir; Figure 2b: hydrocarbon sites below ground level; Figure 2c: Emission patterns of oil/water
4. THEORETICAL IMPLICATION OF THE REMOTE SENSING TECHNIQUES
Number The mathematical analysis for estimation of the emissivity of the spotted hydrocarbon trap was adopted from Palluconi et al.,[13]. Equation 1 gives the mathematical expression: 𝑳𝑳𝑳𝑳𝒋𝒋 = �𝜺𝜺𝒋𝒋𝑳𝑳𝒋𝒋𝑩𝑩𝑩𝑩(𝑻𝑻) + �𝟏𝟏 − 𝜺𝜺𝒋𝒋�𝑳𝑳𝒋𝒋
𝒔𝒔𝒔𝒔𝒔𝒔�𝝉𝝉𝒋𝒋 + 𝑳𝑳𝒋𝒋𝒂𝒂𝒂𝒂𝒂𝒂 [1]
where 𝑳𝑳𝑳𝑳𝒋𝒋 is the spectral radiance observed by the sensor, 𝑳𝑳𝒋𝒋𝑩𝑩𝑩𝑩 is the spectral radiance from a blackbody at surface temperature T, 𝑳𝑳𝒋𝒋
𝒔𝒔𝒔𝒔𝒔𝒔 is the spectral radiance incident upon the surface from the atmosphere, 𝑳𝑳𝒋𝒋𝒂𝒂𝒂𝒂𝒂𝒂 is the spectral radiance emitted by the atmosphere, 𝜺𝜺𝒋𝒋 is the surface emissivity at a specific wavelength, 𝝉𝝉𝒋𝒋 is the spectral atmospheric transmission. Due to some anomalies reported for emissivity estimations by some researchers [10, 14, 15], surface emissivity is influenced by local climatic conditions, land cover, seasons e.t.c. We assume that the 𝑳𝑳𝒋𝒋
𝒔𝒔𝒔𝒔𝒔𝒔 ≈ 𝑳𝑳𝒋𝒋𝒂𝒂𝒂𝒂𝒂𝒂 so as to accommodate the anomalies majorly influenced via 𝑳𝑳𝒋𝒋
𝒔𝒔𝒔𝒔𝒔𝒔. Equation 2 is a model for estimating 𝑳𝑳𝒋𝒋
𝒔𝒔𝒔𝒔𝒔𝒔 𝑳𝑳𝑳𝑳𝒋𝒋 = 𝜺𝜺𝒋𝒋𝝉𝝉𝒋𝒋𝑳𝑳𝒋𝒋𝑩𝑩𝑩𝑩(𝑻𝑻) + (𝟏𝟏 + 𝝉𝝉𝒋𝒋 − 𝜺𝜺𝒋𝒋𝝉𝝉𝒋𝒋)𝑳𝑳𝒋𝒋𝒂𝒂𝒂𝒂𝒂𝒂
[2] Based on Emetere [16], we assume that the parameter does not strictly depend on the angular displacement of the sensor. Therefore, spectral radiance from a blackbody at surface temperature is reduced to
𝑳𝑳𝑳𝑳𝒋𝒋 =𝑹𝑹𝛀𝛀𝑨𝑨𝝅𝝅
� 𝜺𝜺𝒋𝒋𝝉𝝉𝒋𝒋𝒈𝒈𝒋𝒋𝑳𝑳𝒋𝒋𝑩𝑩𝑩𝑩(𝝀𝝀,𝑻𝑻)
𝝀𝝀𝟐𝟐
𝝀𝝀𝟏𝟏
[3] Combining equations [2] & [3] gives
�𝑹𝑹𝛀𝛀𝑨𝑨𝝅𝝅
� 𝒈𝒈𝒋𝒋𝑳𝑳𝒋𝒋𝑩𝑩𝑩𝑩(𝝀𝝀,𝑻𝑻)
𝝀𝝀𝟐𝟐
𝝀𝝀𝟏𝟏
� − 𝑳𝑳𝒋𝒋𝑩𝑩𝑩𝑩(𝑻𝑻)
=(𝟏𝟏 + 𝝉𝝉𝒋𝒋 − 𝜺𝜺𝒋𝒋𝝉𝝉𝒋𝒋)
𝜺𝜺𝒋𝒋𝝉𝝉𝒋𝒋𝑳𝑳𝒋𝒋𝒂𝒂𝒂𝒂𝒂𝒂
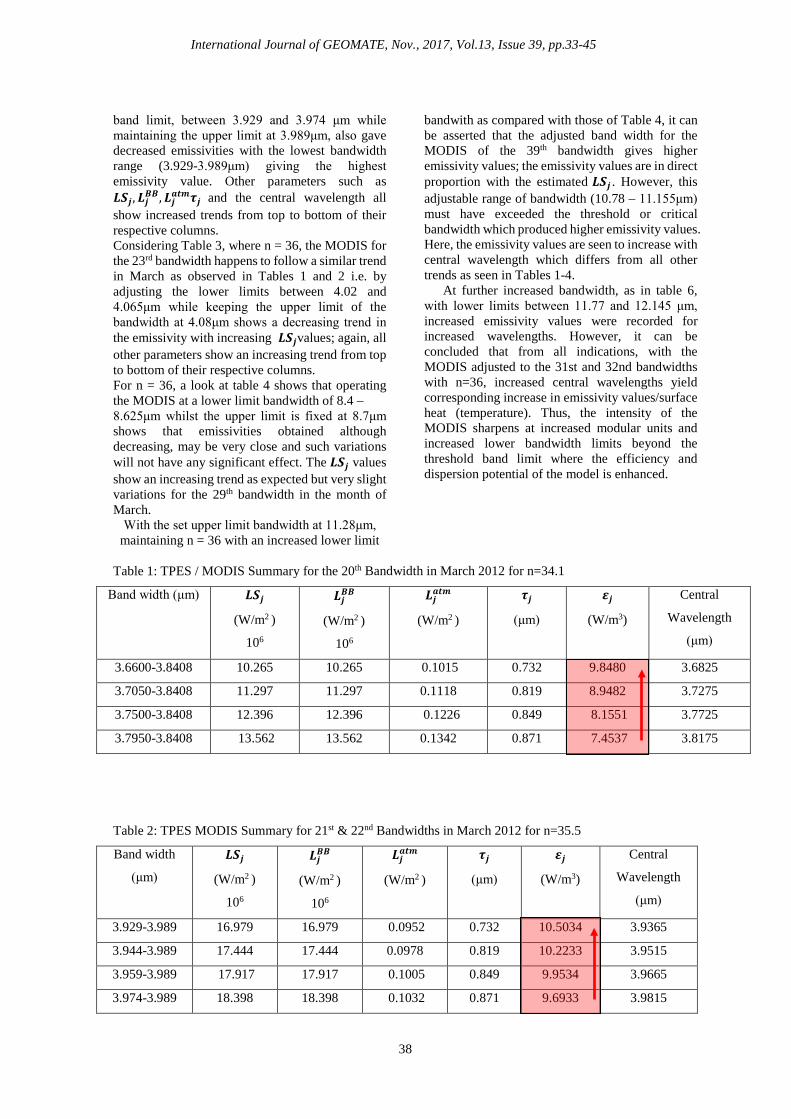
[4] Here 𝑹𝑹𝛀𝛀 is the impedance of satellite sensor (>𝟏𝟏𝟏𝟏𝑴𝑴𝛀𝛀), 𝑨𝑨 is the area on the sample which is sensed by the sensor, 𝒈𝒈𝒋𝒋 is the responsivity of the sensor at different wavelengths (preferably 0.62μm) [17]. The application of equation [4] is tested in seven bands of the MODIS ( i.e. 20, 21, 22, 23, 29, 31 and 32) as shown in Tables 1- 7.
International Journal of GEOMATE, Nov., 2017, Vol.13, Issue 39, pp.33-45
37
𝑳𝑳𝒋𝒋𝑩𝑩𝑩𝑩(𝑻𝑻) = 𝑪𝑪𝟏𝟏𝝀𝝀𝒋𝒋𝟓𝟓𝝅𝝅[𝐞𝐞𝐞𝐞𝐞𝐞� 𝑪𝑪𝟐𝟐𝝀𝝀𝟐𝟐𝑻𝑻
�−𝟏𝟏] [5]
𝑪𝑪𝟏𝟏 = First radiation constant = 3.74151 X 10⁻¹⁶ (Wm2), 𝑪𝑪𝟐𝟐= Second radiation constant = 0.0143879 (mK). The relationship between 𝑳𝑳𝑳𝑳𝒋𝒋 and 𝑳𝑳𝒋𝒋𝒂𝒂𝒂𝒂𝒂𝒂, Equation 6, was adopted for the estimation of 𝑳𝑳𝒋𝒋𝒂𝒂𝒂𝒂𝒂𝒂 in Uno et al.,[9] and is otherwise known as the temperature polynomial expansion scheme (TPES) for earth radiation given as 𝑳𝑳𝒋𝒋𝒂𝒂𝒂𝒂𝒂𝒂 = �𝟐𝟐
𝟑𝟑�𝒏𝒏𝑳𝑳𝑳𝑳𝒋𝒋 [6]
5. RESULTS AND DISCUSSION
Liang’s [33] algorithm, sourced from a new
empirical equation, was developed to handle the imagery retrieval. The algorithm is a mathematical technique for stabilizing final solutions. The nature of solution is important because it can either be precise or show deviations from the actual when applied within or outside its limits of accuracy respectively. Although, the results show more than 70.2% deviation from the actual LST, the solution presented therein could be considered accurate because the results indicated, could inversely mimic or give good percent deviation of the LST and emissivity patterns.
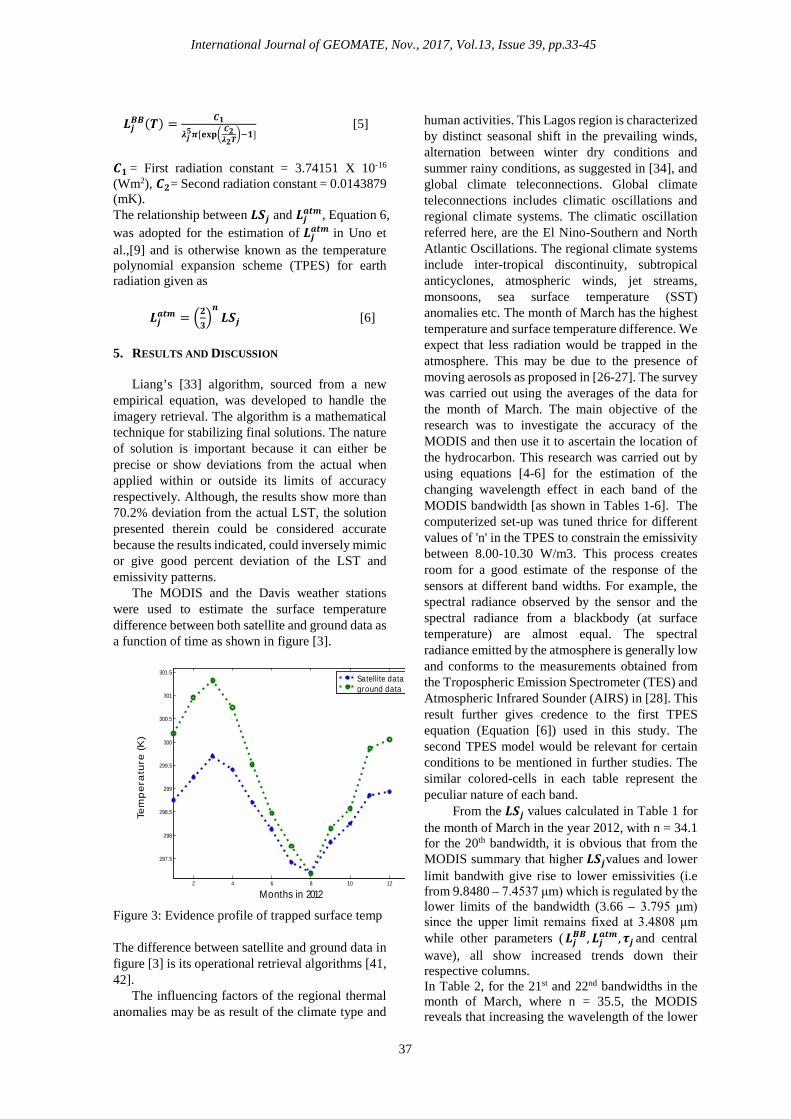
The MODIS and the Davis weather stations were used to estimate the surface temperature difference between both satellite and ground data as a function of time as shown in figure [3].
Figure 3: Evidence profile of trapped surface temp
The difference between satellite and ground data in figure [3] is its operational retrieval algorithms [41, 42].
The influencing factors of the regional thermal anomalies may be as result of the climate type and
human activities. This Lagos region is characterized by distinct seasonal shift in the prevailing winds, alternation between winter dry conditions and summer rainy conditions, as suggested in [34], and global climate teleconnections. Global climate teleconnections includes climatic oscillations and regional climate systems. The climatic oscillation referred here, are the El Nino-Southern and North Atlantic Oscillations. The regional climate systems include inter-tropical discontinuity, subtropical anticyclones, atmospheric winds, jet streams, monsoons, sea surface temperature (SST) anomalies etc. The month of March has the highest temperature and surface temperature difference. We expect that less radiation would be trapped in the atmosphere. This may be due to the presence of moving aerosols as proposed in [26-27]. The survey was carried out using the averages of the data for the month of March. The main objective of the research was to investigate the accuracy of the MODIS and then use it to ascertain the location of the hydrocarbon. This research was carried out by using equations [4-6] for the estimation of the changing wavelength effect in each band of the MODIS bandwidth [as shown in Tables 1-6]. The computerized set-up was tuned thrice for different values of 'n' in the TPES to constrain the emissivity between 8.00-10.30 W/m3. This process creates room for a good estimate of the response of the sensors at different band widths. For example, the spectral radiance observed by the sensor and the spectral radiance from a blackbody (at surface temperature) are almost equal. The spectral radiance emitted by the atmosphere is generally low and conforms to the measurements obtained from the Tropospheric Emission Spectrometer (TES) and Atmospheric Infrared Sounder (AIRS) in [28]. This result further gives credence to the first TPES equation (Equation [6]) used in this study. The second TPES model would be relevant for certain conditions to be mentioned in further studies. The similar colored-cells in each table represent the peculiar nature of each band.
From the 𝑳𝑳𝑳𝑳𝒋𝒋 values calculated in Table 1 for the month of March in the year 2012, with n = 34.1 for the 20th bandwidth, it is obvious that from the MODIS summary that higher 𝑳𝑳𝑳𝑳𝒋𝒋values and lower limit bandwith give rise to lower emissivities (i.e from 9.8480 – 7.4537 μm) which is regulated by the lower limits of the bandwidth (3.66 – 3.795 μm) since the upper limit remains fixed at 3.4808 μm while other parameters (𝑳𝑳𝒋𝒋𝑩𝑩𝑩𝑩,𝑳𝑳𝒋𝒋𝒂𝒂𝒂𝒂𝒂𝒂 , 𝝉𝝉𝒋𝒋 and central wave), all show increased trends down their respective columns. In Table 2, for the 21st and 22nd bandwidths in the month of March, where n = 35.5, the MODIS reveals that increasing the wavelength of the lower
2 4 6 8 10 12
297.5
298
298.5
299
299.5
300
300.5
301
301.5
Months in 2012
Tem
per
atu
re (K
)
Satellite dataground data
International Journal of GEOMATE, Nov., 2017, Vol.13, Issue 39, pp.33-45
38
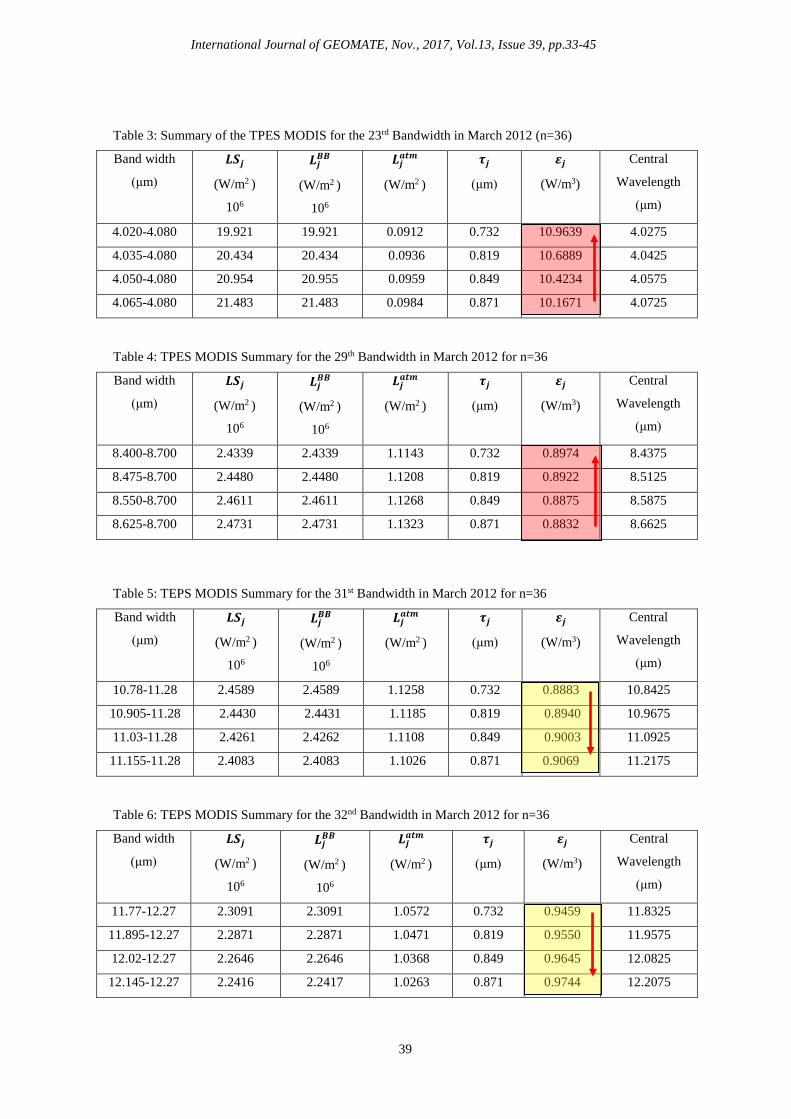
band limit, between 3.929 and 3.974 μm while maintaining the upper limit at 3.989μm, also gave decreased emissivities with the lowest bandwidth range (3.929-3.989μm) giving the highest emissivity value. Other parameters such as 𝑳𝑳𝑳𝑳𝒋𝒋,𝑳𝑳𝒋𝒋𝑩𝑩𝑩𝑩,𝑳𝑳𝒋𝒋𝒂𝒂𝒂𝒂𝒂𝒂𝝉𝝉𝒋𝒋 and the central wavelength all show increased trends from top to bottom of their respective columns. Considering Table 3, where n = 36, the MODIS for the 23rd bandwidth happens to follow a similar trend in March as observed in Tables 1 and 2 i.e. by adjusting the lower limits between 4.02 and 4.065μm while keeping the upper limit of the bandwidth at 4.08μm shows a decreasing trend in the emissivity with increasing 𝑳𝑳𝑳𝑳𝒋𝒋values; again, all other parameters show an increasing trend from top to bottom of their respective columns. For n = 36, a look at table 4 shows that operating the MODIS at a lower limit bandwidth of 8.4 – 8.625μm whilst the upper limit is fixed at 8.7μm shows that emissivities obtained although decreasing, may be very close and such variations will not have any significant effect. The 𝑳𝑳𝑳𝑳𝒋𝒋 values show an increasing trend as expected but very slight variations for the 29th bandwidth in the month of March.
With the set upper limit bandwidth at 11.28μm, maintaining n = 36 with an increased lower limit
bandwith as compared with those of Table 4, it can be asserted that the adjusted band width for the MODIS of the 39th bandwidth gives higher emissivity values; the emissivity values are in direct proportion with the estimated 𝑳𝑳𝑳𝑳𝒋𝒋 . However, this adjustable range of bandwidth (10.78 – 11.155μm) must have exceeded the threshold or critical bandwidth which produced higher emissivity values. Here, the emissivity values are seen to increase with central wavelength which differs from all other trends as seen in Tables 1-4.
At further increased bandwidth, as in table 6, with lower limits between 11.77 and 12.145 μm, increased emissivity values were recorded for increased wavelengths. However, it can be concluded that from all indications, with the MODIS adjusted to the 31st and 32nd bandwidths with n=36, increased central wavelengths yield corresponding increase in emissivity values/surface heat (temperature). Thus, the intensity of the MODIS sharpens at increased modular units and increased lower bandwidth limits beyond the threshold band limit where the efficiency and dispersion potential of the model is enhanced.
Table 1: TPES / MODIS Summary for the 20th Bandwidth in March 2012 for n=34.1
Band width (μm) 𝑳𝑳𝑳𝑳𝒋𝒋
(W/m2 )
106
𝑳𝑳𝒋𝒋𝑩𝑩𝑩𝑩
(W/m2 )
106
𝑳𝑳𝒋𝒋𝒂𝒂𝒂𝒂𝒂𝒂
(W/m2 )
𝝉𝝉𝒋𝒋
(μm)
𝜺𝜺𝒋𝒋
(W/m3)
Central
Wavelength
(μm)
3.6600-3.8408 10.265 10.265 0.1015 0.732 9.8480 3.6825
3.7050-3.8408 11.297 11.297 0.1118 0.819 8.9482 3.7275
3.7500-3.8408 12.396 12.396 0.1226 0.849 8.1551 3.7725
3.7950-3.8408 13.562 13.562 0.1342 0.871 7.4537 3.8175
Table 2: TPES MODIS Summary for 21st & 22nd Bandwidths in March 2012 for n=35.5
Band width
(μm)
𝑳𝑳𝑳𝑳𝒋𝒋
(W/m2 )
106
𝑳𝑳𝒋𝒋𝑩𝑩𝑩𝑩
(W/m2 )
106
𝑳𝑳𝒋𝒋𝒂𝒂𝒂𝒂𝒂𝒂
(W/m2 )
𝝉𝝉𝒋𝒋
(μm)
𝜺𝜺𝒋𝒋
(W/m3)
Central
Wavelength
(μm)
3.929-3.989 16.979 16.979 0.0952 0.732 10.5034 3.9365
3.944-3.989 17.444 17.444 0.0978 0.819 10.2233 3.9515
3.959-3.989 17.917 17.917 0.1005 0.849 9.9534 3.9665
3.974-3.989 18.398 18.398 0.1032 0.871 9.6933 3.9815
International Journal of GEOMATE, Nov., 2017, Vol.13, Issue 39, pp.33-45
39
Table 3: Summary of the TPES MODIS for the 23rd Bandwidth in March 2012 (n=36)
Band width
(μm)
𝑳𝑳𝑳𝑳𝒋𝒋
(W/m2 )
106
𝑳𝑳𝒋𝒋𝑩𝑩𝑩𝑩
(W/m2 )
106
𝑳𝑳𝒋𝒋𝒂𝒂𝒂𝒂𝒂𝒂
(W/m2 )
𝝉𝝉𝒋𝒋
(μm)
𝜺𝜺𝒋𝒋
(W/m3)
Central
Wavelength
(μm)
4.020-4.080 19.921 19.921 0.0912 0.732 10.9639 4.0275
4.035-4.080 20.434 20.434 0.0936 0.819 10.6889 4.0425
4.050-4.080 20.954 20.955 0.0959 0.849 10.4234 4.0575
4.065-4.080 21.483 21.483 0.0984 0.871 10.1671 4.0725
Table 4: TPES MODIS Summary for the 29th Bandwidth in March 2012 for n=36
Band width
(μm)
𝑳𝑳𝑳𝑳𝒋𝒋
(W/m2 )
106
𝑳𝑳𝒋𝒋𝑩𝑩𝑩𝑩
(W/m2 )
106
𝑳𝑳𝒋𝒋𝒂𝒂𝒂𝒂𝒂𝒂
(W/m2 )
𝝉𝝉𝒋𝒋
(μm)
𝜺𝜺𝒋𝒋
(W/m3)
Central
Wavelength
(μm)
8.400-8.700 2.4339 2.4339 1.1143 0.732 0.8974 8.4375
8.475-8.700 2.4480 2.4480 1.1208 0.819 0.8922 8.5125
8.550-8.700 2.4611 2.4611 1.1268 0.849 0.8875 8.5875
8.625-8.700 2.4731 2.4731 1.1323 0.871 0.8832 8.6625
Table 5: TEPS MODIS Summary for the 31st Bandwidth in March 2012 for n=36
Band width
(μm)
𝑳𝑳𝑳𝑳𝒋𝒋
(W/m2 )
106
𝑳𝑳𝒋𝒋𝑩𝑩𝑩𝑩
(W/m2 )
106
𝑳𝑳𝒋𝒋𝒂𝒂𝒂𝒂𝒂𝒂
(W/m2 )
𝝉𝝉𝒋𝒋
(μm)
𝜺𝜺𝒋𝒋
(W/m3)
Central
Wavelength
(μm)
10.78-11.28 2.4589 2.4589 1.1258 0.732 0.8883 10.8425
10.905-11.28 2.4430 2.4431 1.1185 0.819 0.8940 10.9675
11.03-11.28 2.4261 2.4262 1.1108 0.849 0.9003 11.0925
11.155-11.28 2.4083 2.4083 1.1026 0.871 0.9069 11.2175
Table 6: TEPS MODIS Summary for the 32nd Bandwidth in March 2012 for n=36
Band width
(μm)
𝑳𝑳𝑳𝑳𝒋𝒋
(W/m2 )
106
𝑳𝑳𝒋𝒋𝑩𝑩𝑩𝑩
(W/m2 )
106
𝑳𝑳𝒋𝒋𝒂𝒂𝒂𝒂𝒂𝒂
(W/m2 )
𝝉𝝉𝒋𝒋
(μm)
𝜺𝜺𝒋𝒋
(W/m3)
Central
Wavelength
(μm)
11.77-12.27 2.3091 2.3091 1.0572 0.732 0.9459 11.8325
11.895-12.27 2.2871 2.2871 1.0471 0.819 0.9550 11.9575
12.02-12.27 2.2646 2.2646 1.0368 0.849 0.9645 12.0825
12.145-12.27 2.2416 2.2417 1.0263 0.871 0.9744 12.2075
International Journal of GEOMATE, Nov., 2017, Vol.13, Issue 39, pp.33-45
40
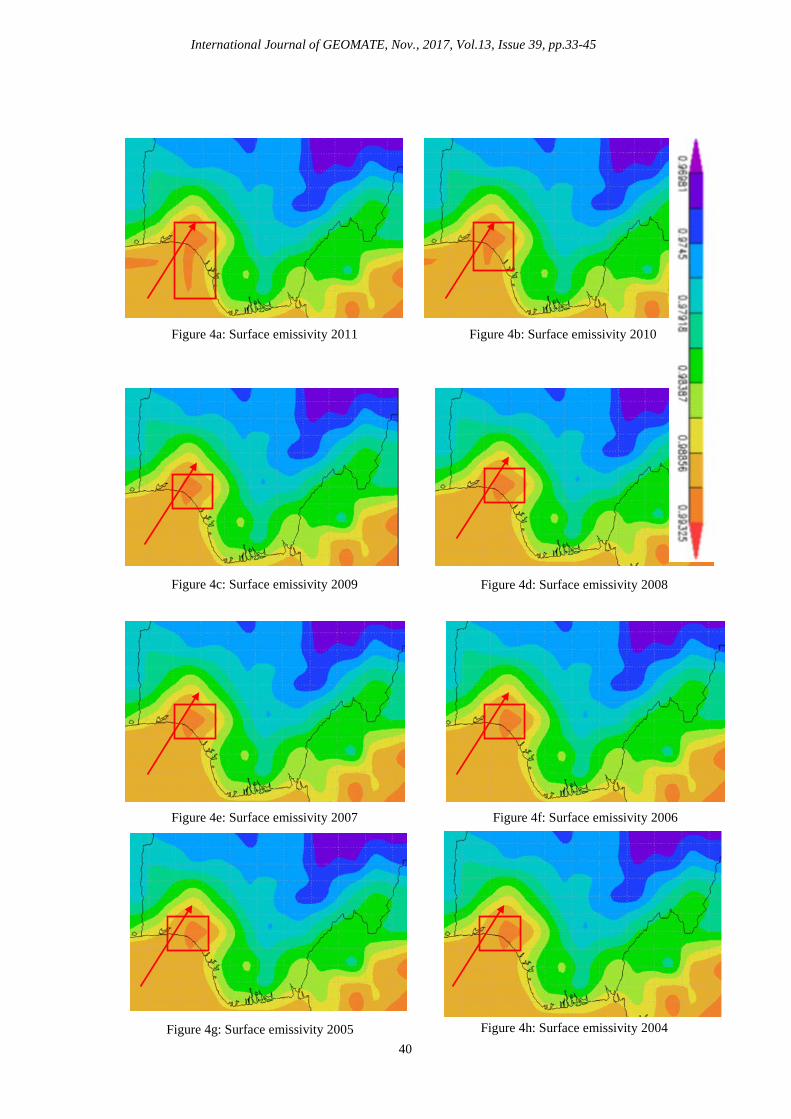
Figure 4e: Surface emissivity 2007
Figure 4f: Surface emissivity 2006
Figure 4c: Surface emissivity 2009
Figure 4d: Surface emissivity 2008
Figure 4a: Surface emissivity 2011
Figure 4b: Surface emissivity 2010
Figure 4g: Surface emissivity 2005
Figure 4h: Surface emissivity 2004
International Journal of GEOMATE, Nov., 2017, Vol.13, Issue 39, pp.33-45
41
The emissivity values for the 20-29th
bandwidths decreased with wavelength; see red cells in tables 1-4. Emissivity values for the 31st and 32nd bandwidths increased with wavelength (see yellow cells in Tables 5&6). This suggests that the quantum efficiency of the MODIS sensors could be affected at low radiations as shown in Tables 5&6. Also, the wavelength variation within each bandwidth gives insight to the likely forces inhibiting or enforcing the spectral radiance emitted by the atmosphere. Also, we propose the application of the TPES model within the 20-29th bandwidth limits (i.e. group A) of the thermal infrared spectrum for use in determining the potential for oil seepage and spill. However, bandwidths 31and 32 (i.e. group A) may be used for surface lineaments. The reliability of the combination of data generated for both groups A & B may be seen to be consistent over years. We observed the surface emissivity for Lagos State, southern –Nigeria from 2004 to 2011 with emphasis on Figures 4 a-h. As explained earlier, the ETM depends on the water ways seismic survey map (figure 1b) and the geological map for the land mass areas of Lagos (see Figures 1c). The surface emissivity (see red cells in Tables 1-4) obtained from 2004-2009 are very consistent and lie between 0.93-0.99 W/m3 as shown in Figures 4a to 4g. This suggests that the 32nd bandwidth is actively involved in the image-capture within the box, thus signifying the presence of surface lineaments. This is an indication of the presence of hydrocarbon in the region.
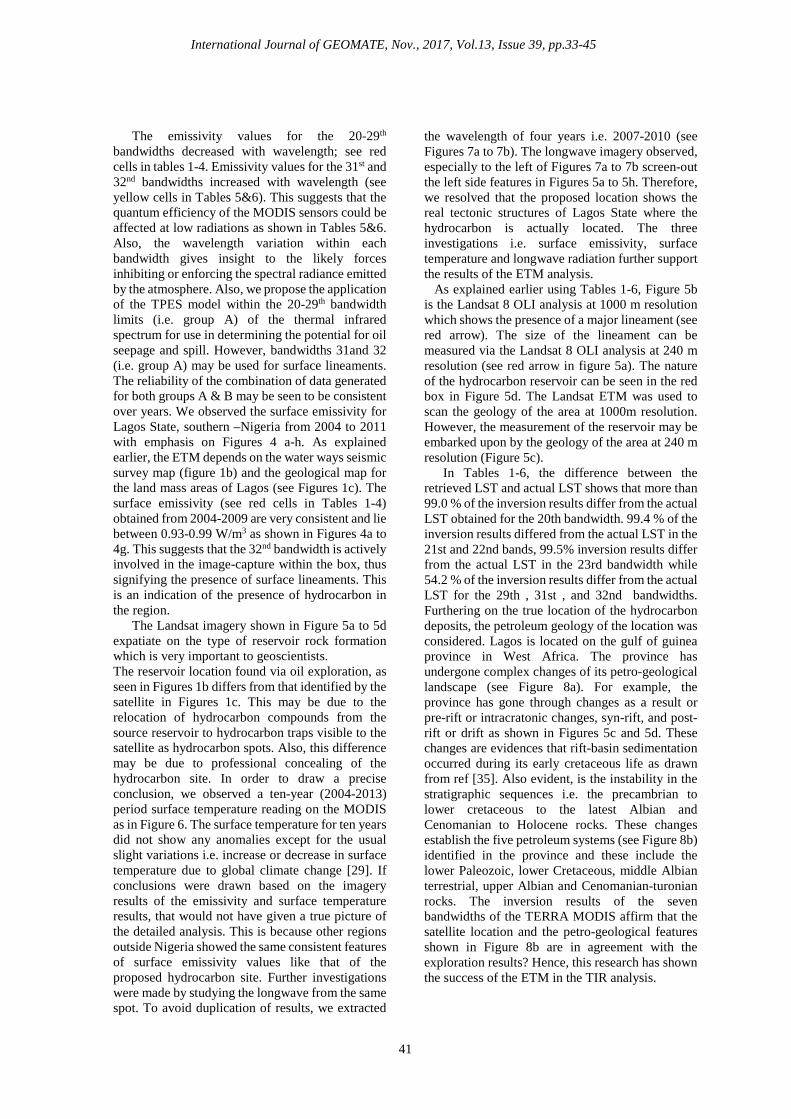
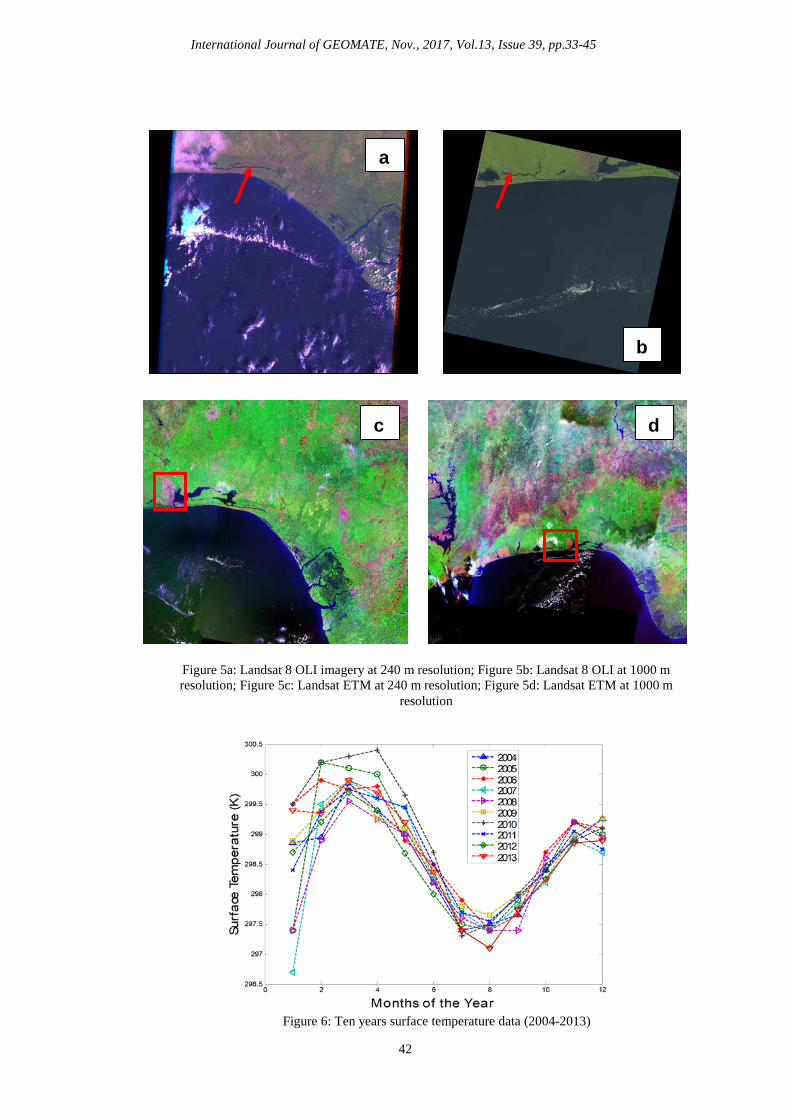
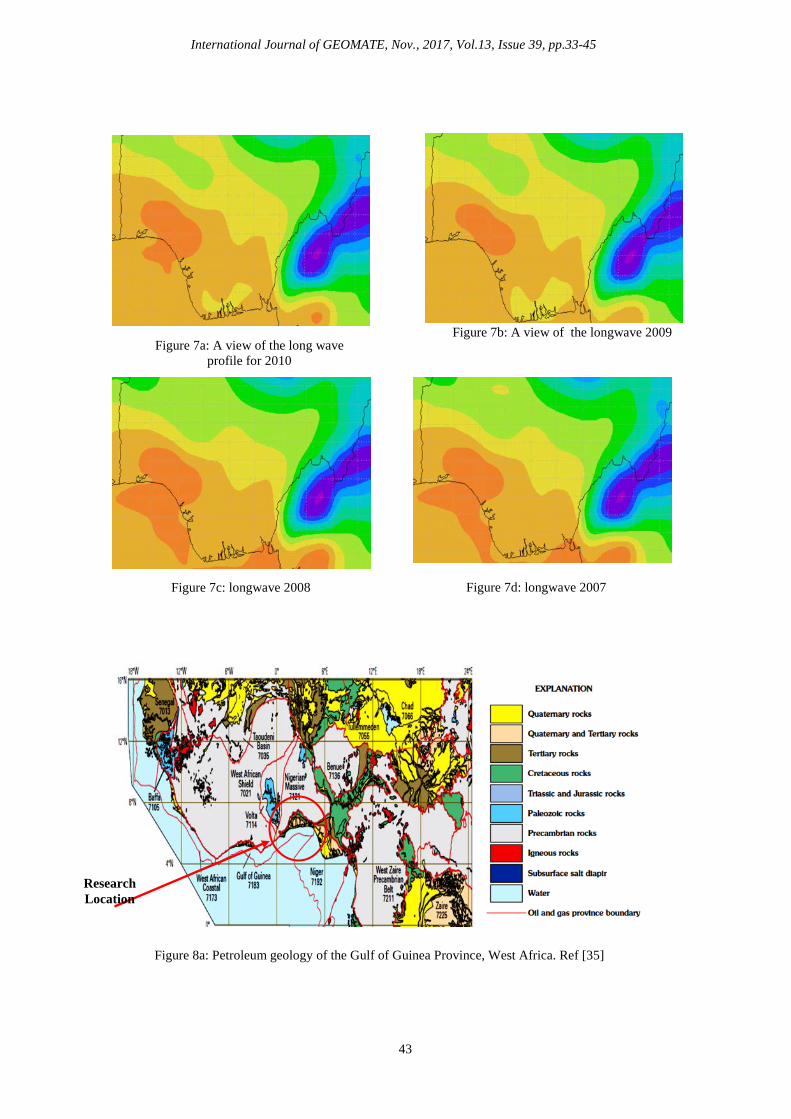
The Landsat imagery shown in Figure 5a to 5d expatiate on the type of reservoir rock formation which is very important to geoscientists. The reservoir location found via oil exploration, as seen in Figures 1b differs from that identified by the satellite in Figures 1c. This may be due to the relocation of hydrocarbon compounds from the source reservoir to hydrocarbon traps visible to the satellite as hydrocarbon spots. Also, this difference may be due to professional concealing of the hydrocarbon site. In order to draw a precise conclusion, we observed a ten-year (2004-2013) period surface temperature reading on the MODIS as in Figure 6. The surface temperature for ten years did not show any anomalies except for the usual slight variations i.e. increase or decrease in surface temperature due to global climate change [29]. If conclusions were drawn based on the imagery results of the emissivity and surface temperature results, that would not have given a true picture of the detailed analysis. This is because other regions outside Nigeria showed the same consistent features of surface emissivity values like that of the proposed hydrocarbon site. Further investigations were made by studying the longwave from the same spot. To avoid duplication of results, we extracted
the wavelength of four years i.e. 2007-2010 (see Figures 7a to 7b). The longwave imagery observed, especially to the left of Figures 7a to 7b screen-out the left side features in Figures 5a to 5h. Therefore, we resolved that the proposed location shows the real tectonic structures of Lagos State where the hydrocarbon is actually located. The three investigations i.e. surface emissivity, surface temperature and longwave radiation further support the results of the ETM analysis. As explained earlier using Tables 1-6, Figure 5b is the Landsat 8 OLI analysis at 1000 m resolution which shows the presence of a major lineament (see red arrow). The size of the lineament can be measured via the Landsat 8 OLI analysis at 240 m resolution (see red arrow in figure 5a). The nature of the hydrocarbon reservoir can be seen in the red box in Figure 5d. The Landsat ETM was used to scan the geology of the area at 1000m resolution. However, the measurement of the reservoir may be embarked upon by the geology of the area at 240 m resolution (Figure 5c).
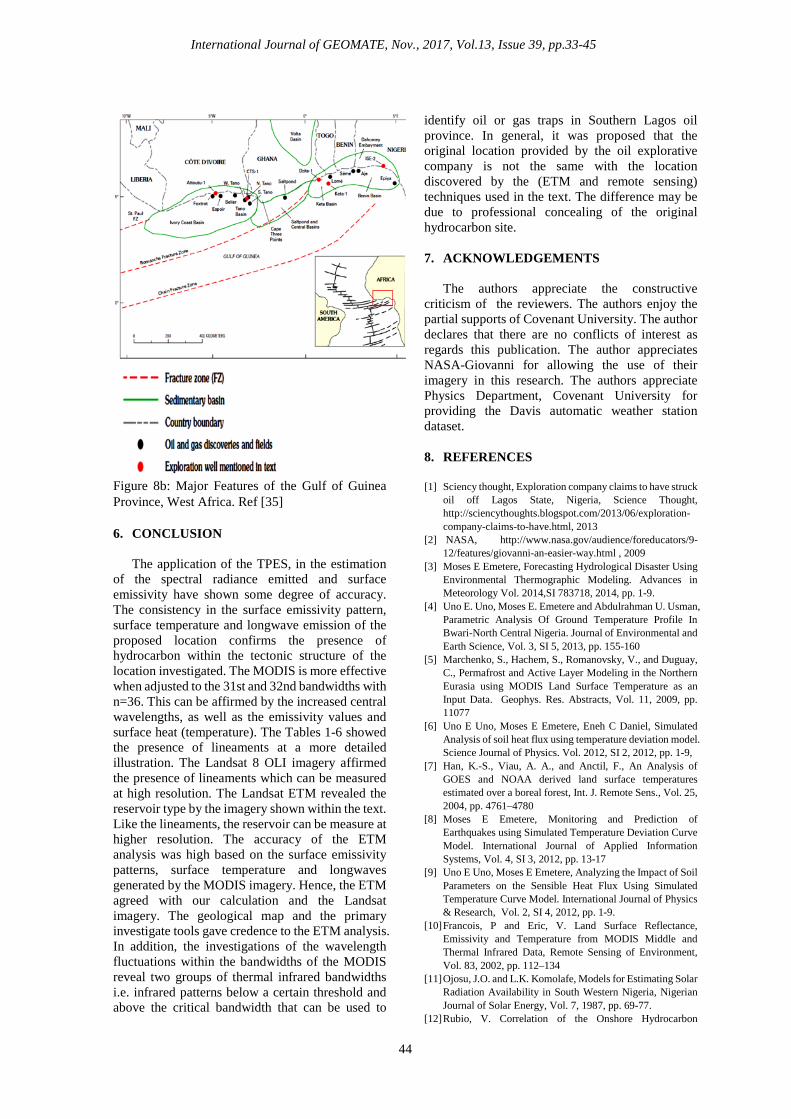
In Tables 1-6, the difference between the retrieved LST and actual LST shows that more than 99.0 % of the inversion results differ from the actual LST obtained for the 20th bandwidth. 99.4 % of the inversion results differed from the actual LST in the 21st and 22nd bands, 99.5% inversion results differ from the actual LST in the 23rd bandwidth while 54.2 % of the inversion results differ from the actual LST for the 29th , 31st , and 32nd bandwidths. Furthering on the true location of the hydrocarbon deposits, the petroleum geology of the location was considered. Lagos is located on the gulf of guinea province in West Africa. The province has undergone complex changes of its petro-geological landscape (see Figure 8a). For example, the province has gone through changes as a result or pre-rift or intracratonic changes, syn-rift, and post-rift or drift as shown in Figures 5c and 5d. These changes are evidences that rift-basin sedimentation occurred during its early cretaceous life as drawn from ref [35]. Also evident, is the instability in the stratigraphic sequences i.e. the precambrian to lower cretaceous to the latest Albian and Cenomanian to Holocene rocks. These changes establish the five petroleum systems (see Figure 8b) identified in the province and these include the lower Paleozoic, lower Cretaceous, middle Albian terrestrial, upper Albian and Cenomanian-turonian rocks. The inversion results of the seven bandwidths of the TERRA MODIS affirm that the satellite location and the petro-geological features shown in Figure 8b are in agreement with the exploration results? Hence, this research has shown the success of the ETM in the TIR analysis.
International Journal of GEOMATE, Nov., 2017, Vol.13, Issue 39, pp.33-45
42
Figure 5a: Landsat 8 OLI imagery at 240 m resolution; Figure 5b: Landsat 8 OLI at 1000 m resolution; Figure 5c: Landsat ETM at 240 m resolution; Figure 5d: Landsat ETM at 1000 m
resolution
a
b
c d
Figure 6: Ten years surface temperature data (2004-2013)
International Journal of GEOMATE, Nov., 2017, Vol.13, Issue 39, pp.33-45
43
Figure 7b: A view of the longwave 2009
Figure 7a: A view of the long wave profile for 2010
Figure 7d: longwave 2007
Figure 7c: longwave 2008
Figure 8a: Petroleum geology of the Gulf of Guinea Province, West Africa. Ref [35]
Research Location
International Journal of GEOMATE, Nov., 2017, Vol.13, Issue 39, pp.33-45
44
Figure 8b: Major Features of the Gulf of Guinea Province, West Africa. Ref [35] 6. CONCLUSION
The application of the TPES, in the estimation of the spectral radiance emitted and surface emissivity have shown some degree of accuracy. The consistency in the surface emissivity pattern, surface temperature and longwave emission of the proposed location confirms the presence of hydrocarbon within the tectonic structure of the location investigated. The MODIS is more effective when adjusted to the 31st and 32nd bandwidths with n=36. This can be affirmed by the increased central wavelengths, as well as the emissivity values and surface heat (temperature). The Tables 1-6 showed the presence of lineaments at a more detailed illustration. The Landsat 8 OLI imagery affirmed the presence of lineaments which can be measured at high resolution. The Landsat ETM revealed the reservoir type by the imagery shown within the text. Like the lineaments, the reservoir can be measure at higher resolution. The accuracy of the ETM analysis was high based on the surface emissivity patterns, surface temperature and longwaves generated by the MODIS imagery. Hence, the ETM agreed with our calculation and the Landsat imagery. The geological map and the primary investigate tools gave credence to the ETM analysis. In addition, the investigations of the wavelength fluctuations within the bandwidths of the MODIS reveal two groups of thermal infrared bandwidths i.e. infrared patterns below a certain threshold and above the critical bandwidth that can be used to
identify oil or gas traps in Southern Lagos oil province. In general, it was proposed that the original location provided by the oil explorative company is not the same with the location discovered by the (ETM and remote sensing) techniques used in the text. The difference may be due to professional concealing of the original hydrocarbon site.
7. ACKNOWLEDGEMENTS
The authors appreciate the constructive criticism of the reviewers. The authors enjoy the partial supports of Covenant University. The author declares that there are no conflicts of interest as regards this publication. The author appreciates NASA-Giovanni for allowing the use of their imagery in this research. The authors appreciate Physics Department, Covenant University for providing the Davis automatic weather station dataset. 8. REFERENCES
[1] Sciency thought, Exploration company claims to have struck
oil off Lagos State, Nigeria, Science Thought, http://sciencythoughts.blogspot.com/2013/06/exploration-company-claims-to-have.html, 2013
[2] NASA, http://www.nasa.gov/audience/foreducators/9-12/features/giovanni-an-easier-way.html , 2009
[3] Moses E Emetere, Forecasting Hydrological Disaster Using Environmental Thermographic Modeling. Advances in Meteorology Vol. 2014,SI 783718, 2014, pp. 1-9.
[4] Uno E. Uno, Moses E. Emetere and Abdulrahman U. Usman, Parametric Analysis Of Ground Temperature Profile In Bwari-North Central Nigeria. Journal of Environmental and Earth Science, Vol. 3, SI 5, 2013, pp. 155-160
[5] Marchenko, S., Hachem, S., Romanovsky, V., and Duguay, C., Permafrost and Active Layer Modeling in the Northern Eurasia using MODIS Land Surface Temperature as an Input Data. Geophys. Res. Abstracts, Vol. 11, 2009, pp. 11077
[6] Uno E Uno, Moses E Emetere, Eneh C Daniel, Simulated Analysis of soil heat flux using temperature deviation model. Science Journal of Physics. Vol. 2012, SI 2, 2012, pp. 1-9,
[7] Han, K.-S., Viau, A. A., and Anctil, F., An Analysis of GOES and NOAA derived land surface temperatures estimated over a boreal forest, Int. J. Remote Sens., Vol. 25, 2004, pp. 4761–4780
[8] Moses E Emetere, Monitoring and Prediction of Earthquakes using Simulated Temperature Deviation Curve Model. International Journal of Applied Information Systems, Vol. 4, SI 3, 2012, pp. 13-17
[9] Uno E Uno, Moses E Emetere, Analyzing the Impact of Soil Parameters on the Sensible Heat Flux Using Simulated Temperature Curve Model. International Journal of Physics & Research, Vol. 2, SI 4, 2012, pp. 1-9.
[10] Francois, P and Eric, V. Land Surface Reflectance, Emissivity and Temperature from MODIS Middle and Thermal Infrared Data, Remote Sensing of Environment, Vol. 83, 2002, pp. 112–134
[11] Ojosu, J.O. and L.K. Komolafe, Models for Estimating Solar Radiation Availability in South Western Nigeria, Nigerian Journal of Solar Energy, Vol. 7, 1987, pp. 69-77.
[12] Rubio, V. Correlation of the Onshore Hydrocarbon
International Journal of GEOMATE, Nov., 2017, Vol.13, Issue 39, pp.33-45
45
Seepages with the Geo-structural Characterization in the Venura Basin, Santa Barbara area, California, ITC, 2002
[13] Palluconi, F. D., and Meeks, G. R., Thermal Infrared Multispectral Scanner (TIMS): an Investigator’s Guide to TIMS Data, Jet Propulsion Laboratory publication, 85–32, 1985
[14] Morgan, J.A, Bayesian Estimation for Land Surface Temperature Retrieval: the Nuisance of Emissivities, IEEE Transactions on Geoscience and Remote Sensing, Vol. 43, SI 6, 2005, pp. 1279-1288
[15] Srivastava, P. K., Majumdar, T. J. and A. K Bhattacharya, Study of Land Surface Temperature and Spectral Emissivity using Multi-Sensor Satellite Data, J. Earth Syst. Sci., Vol. 119, SI 1, 2010, pp. 67–74
[16] Moses E Emetere. Profiling Laser Induced Temperature Fields for Superconducting Materials Using Mathematical Experimentation. Journal of Thermophysics and Heat Transfer, Vol. 28, SI 4, 2014, pp. 700-707
[17] John J. Qu-Wei G, Menas K, Robert E. Murphy, Vincent V. Salomonson, Earth Science Satellite Remote Sensing: Data, Computational Processing and Tools, Vol. 2, ISBN 107-302-12855-3, Springer, Pg 114.
[18] Pavlakis, P., Sieber, A., & Alexandry, S. Monitoring oil-spill pollution in the Mediterranean with ERS SAR. ESA Earth Observation Quarterly-June, 52, 1996.
[19] Fingas, M. F and Brown, C. E., Review of Oil Spill Remote Sensing. Spill Science and Technology Bulletin, Vol. 4, 1997, pp.199– 208
[20] B. Hörig, F. Kühn, F. Oschütz & F. Lehmann, HyMap Hyperspectral Remote Sensing to Detect Hydrocarbons, International Journal of Remote Sensing, Vol. 22, SI8, 2001, pp. 1413-422, (2001)
[21] Camagni, P., Colombo, G., Koechler, C., Pedrini, A., Omenetto, N., and Rossi, G., Diagnostics of Oil Pollution by Laser-Induced Fluorescence, IEEE Trans. Geosci. Remote Sens. Vol 26, 1988, pp.22-26
[22] Maurer, A., and Edgerton, A. T., Flight evaluation of U. S. Coast Guard airborne oil surveillance system, Mar. Technol. Soc. J. Vol. 10, 1976, pp. 38-52
[23] Trieschmann, O., Hunsnger, T., Tufte, L., & Barjenbruch, U., Data Assimilation of an Airborne Multiple Remote Sensor System and of satellite Images for the North and Baltic sea. Proceedings of the SPIE 10th Int. Symposium on Remote Sensing, Conference Bremote sensing of the Ocean and Sea Ice 2003Q , 2003, pp. 51–60
[24] Chen Hui, Zhao Chaofang. A Study for Detecting Marine Oil Spills By using MODIS Multi-Spectral Data [J]. Transactions of Oceanology and Limnology, Vol. 3, 2009, pp. 46-52
[25] Ren Rui-zhi, Guo Shu-xu, GU Ling-jia. Fast Bowtie Effect Elimination for MODIS L1B Data. The Journal of China Universities of Posts and Telecommunications , Vol. 17, SI 1, 2010, pp. 120-126
[26] Moses E Emetere and M.L Akinyemi, Modeling Of Generic Air Pollution Dispersion Analysis From Cement Factory. Analele Universitatii din Oradea–Seria Geografie Vol. 231123-628, 2013, pp. 181-189
[27] Moses E Emetere. Modeling Of Particulate Radionuclide Dispersion And Deposition From A Cement Factory. Annals of Environmental Science, Vol. 7, SI 6, 2013, pp. 71-77
[28] Mark W., Shephard, H. M., Worden, K.E., Cady P., Michael L., Mingzhao L., Kevin W. B., Edwin S., Reinhard B., David M. R., David C. T., Henry E. R., Brendan M. F., Denis T., Shepard A. C., Gregory B. O and Michael Gunson. Tropospheric Emission Spectrometer Nadir Spectral Radiance Comparisons, Journal Of Geophysical Research, Vol. 113, SI D15S05, 2008, pp. 1-12
[29] Keles S, Bilgen S., Renewable Energy sources in Turkey for Climate Change Mitigation and Energy Sustainability. Renewable and Sustainable Energy Reviews, Vol. 16, 2012, pp. 5199–5206
[30] Gianinetto, M., Maianti, P., Tortini, R., Rota Nodari F., Lechi, G., Evaluation of MODIS data for mapping oil slicks - the deepwater horizon oil spill case. In Calado, H. and Gil, A. (Eds.), Geographic Technologies applied to Marine Spatial Planning and Integrated Coastal Zone Management. Universidade Dos Açores (Ponta Delgada, Portugal), pp. 166 2010. ISBN: 978-972-8612-64-1
[31] M.N. Jha, J. Levy, and Y. Gao, Advances in Remote Sensing for Oil spill Disaster Management: State-of-the-Art Sensors Technology for Oil Spill Surveillance, Sensors, Vol. 8, 2008, pp. 236-255
[32] J.W. Salisbury, D.M. D'Aria, and F.F. Sabins, Thermal Infrared Remote Sensing of Crude Oil Slicks", Remote Sensing of Environment, Vol. 45, SI 2, 1993, pp. 225-231
[33] Shunlin Liang, An Optimization Algorithm for Separating Land Surface Temperature and Emissivity from Multispectral Thermal Infrared Imagery, IEEE Transactions On Geoscience and Remote Sensing, Vol. 39, SI 2, 2001, pp. 264-274
[34] Janicot, S., Caniaux, G. F., Chauvin, G. D., Fontaine B., Hall, N., Kiladis, G. Intraseasonal Variability of the West African Monsoon Atmospheric Science Letters, 12, 58–66. 2011.
[35] Brownfield, M.E., and Charpentier, R.R., Geology and total petroleum systems of the Gulf of Guinea Province of west Africa: U.S Geological Survey Bulletin Vol. 2207-C, SI 32, 2006, pp. 4-32
[36] Ana, P., Shubab, D.K and Allison, K.T. Integrated Hyperspectral Remote Sensing, Geochemical and Isotopic Studies for Understanding Hydrocarbon-induced Rock Alterations. Journal of Marine and Petroleum Geology. Vol. 35, SI 1, 2012, pp. 292-308.
[37] Freed, K.M., Herald, M.A., Frank, J.A., Chris, A.H., Wimm, H.B., Mark, M., John, E. M., Boudewijn, J.S and Tsehaie, W. Multi- and hyperspectral geologic remote sensing: A review. International Journal of Applied Earth Observation and Geoinformation. Vol. 14, SI 1, 2012, pp. 112 – 128.
[38] Metternict, G.I and Zinck, J.A. Remote sensing of soil salinity: potentials and constraints. Remote Sensing Environment. Vol. 85, SI 1, 2003, pp. 1-20.
[39] Yusup N., Takeshi T and Toshifumi, M. Geomechanical modeling for InSAR-derived surface deformation at steam-injection oil sand fields. Journal of Petroleum Science and Engineering. Vol. 96, 2012, pp.152-161.
[40] Saif, U.D., Ahmad, A., Abdulnabi, A and Mio, A. Use of interferometric techniques for detecting subsidence in the oil fields of Kuwait using Synthetic Aperture Radar Data. Journal of Petroleum Science and Engineering, Vol. 50, 2006, pp. 1 – 10
[41] Emetere, Moses Eterigho, (2016) Statistical examination of the aerosols loading over Mubi-Nigeria: the satellite observation Analysis, Geographica Panonica,Vol. 20, SI1, pp. 42-50
[42] Mohammed A. El-Shirbeny, Bassam Abdellatif, Abd-Elraouf M. Ali, Nasser H. Saleh, evaluation of hargreaves based on remote sensing method to estimate potential crop evapotranspiration, International Journal of GEOMATE, Vol. 11, SI 23, pp. 2143-2149
Copyright © Int. J. of GEOMATE. All rights reserved, including the making of copies unless permission is obtained from the copyright proprietors.