thermal comfort performance - field investigation of a residential
TRANSCRIPT
William D. Rittelmann, P.E. is a Senior Research Engineer, IBACOS, Inc., Pittsburgh, PA.
Thermal Comfort Performance – Field Investigation of a Residential Forced-Air Heating and Cooling System with High Sidewall Supply Air Outlets ABSTRACT Forced-air systems with high sidewall supply air outlets are often used in energy-efficient homes built in Cold climates, yet industry design guidelines do not exist. This paper reports the results of a field investigation of two unoccupied side-by-side homes, each equipped with two separate forced-air systems (high sidewall and floor registers). Thermal comfort performance results are presented relative to supply air outlet temperatures and system airflow. To characterize the performance of each system, the following criteria were used: 1) the whole-house Thermal Comfort Performance Index (TCPI), 2) degree of head-to-toe stratification, and 3) floor-to-floor stratification. The thermal comfort impact of an additional fan control sequence, using the temperature differences between the warmest and coolest rooms in the house, was also evaluated. Using these criteria, we have found that high sidewall supply air outlets provide better thermal comfort than a system incorporating floor diffusers for both heating and cooling operation, even though every test case for each system provided satisfactory thermal comfort in terms of ASHRAE thermal comfort criteria. INTRODUCTION Forced-air systems with high sidewall supply air outlets are generally accepted as a comfortable way to provide cooling in a single-family home, but when heating supply air temperature of the central equipment is too high or the horizontal placement of the diffusers is poor, heating performance can often be less than desirable. At the same time, more houses in Cold and Mixed climates are built with both forced-air heating and A/C using floor diffusers, which is not the optimum choice for providing cooling comfort. Other issues concerning floor diffusers are that they tend to get obstructed by furniture and they do not inherently provide good horizontal mixing of room air. Guidelines for the selection and placement of supply air diffusers can be found in ASHRAE (2005), but these guidelines are based on commercial cooling applications and testing with isothermal supply air. Thermal comfort performance over time within each room of a house is also an important issue addressed in this paper. Performance standards such as ASHRAE (1990), ASHRAE (2004), and ISO (1994) are useful in defining thermal comfort for a group of people in a single room, but they are not intended to address the ability of a mechanical system to maintain consistent thermal comfort conditions in multiple spaces in a given building. ACCA (2004) states that residential forced-air systems should be designed to maintain room-to-room temperatures within 2.0°F (1.1°C) with a maximum of 4.0°F (2.2°C), but no protocol is suggested to define how and when these measurements should be taken. ASHRAE (1990) specifies the test procedure to determine the Air Diffusion Performance Index (ADPI) for a given room, but the index is loosely connected to thermal comfort and cannot be used to evaluate the systemic performance of a multi-room system. ASHRAE (2004) provides guidelines for the
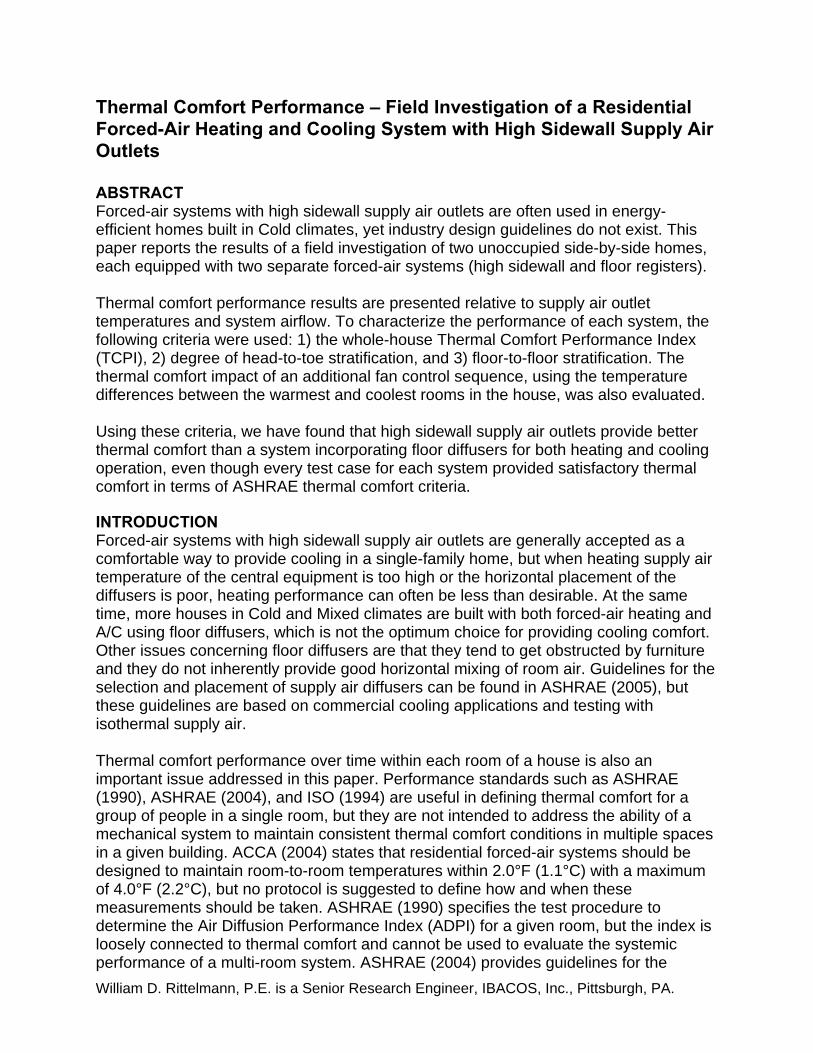
placement and specification of sensors, but does not define criteria for acceptable thermal comfort variations between rooms. By definition, the thermal comfort zone is intended to satisfy 80% of individuals in a group. If a house has rooms with thermal comfort conditions near the upper and lower boundaries of the thermal comfort zone, meeting the comfort criteria within each room only ensures that 60% of occupants would find whole-house thermal comfort performance acceptable. This is because the 20% Predicted Percent Dissatisfied (PPD) at the lower end of the thermal comfort range are not the same individuals in the 20% PPD at the upper end of the thermal comfort range. Without a method to equitably gauge the thermal comfort performance of various HVAC system types and configurations, decisions concerning the ability of a system to provide comfort are often based upon random, casual observations. Many builders, designers, and homeowners are unaware of the magnitude of temperature differences that occur within a house and the causes of these differences. Manufacturers of HVAC equipment promote systems that provide comfort, but because there are no standards to define this aspect of system performance, the performance of an installed system cannot be adequately measured, meaning that there is no real feedback for designers, installers, or manufacturers. In this paper a Thermal Comfort Performance Index (TCPI) will be used to describe comfort over time by using multiple measurements compared to predetermined comfort criteria. The TCPI represents the percentage of measurements within the test period that meet the comfort criteria. DESIGN OF EXPERIMENT Houses The houses for this research were constructed by a major glazing manufacturer for the original purpose of researching the thermal comfort and energy impacts of window products. The houses, located in Fort Wayne, IN, are typical two-story production houses with full basements and forced-air HVAC systems incorporating floor diffusers. Construction was completed in the summer of 2004 and data measurements began in August of that year. The houses are identical except for the window glass, which can be changed in a matter of hours to facilitate different fenestration studies. Two of the houses face east and the other two homes face north ( Figure 1). IBACOS became involved after the first year of testing and expanded the testing to include variations on the HVAC systems in two of the houses.
Figure 1. View of houses from the north The houses were built specifically for research purposes and construction was closely supervised to ensure that both houses were as identical as possible.
Exterior walls. Exterior walls consist of 13 mm (0.50 in.) foil-faced RSI 0.58 (R-3.3) polyisocyanurate rigid foam sheathing and 2x4 wood frame construction with 19 mm (0.75 in.) closed-cell polyurethane spray foam insulation and RSI 1.94 (R-11) fiberglass batts in the wall cavity. But, due to compression of the fiberglass batt, the R-value is reduced by 24% (R-13.6 nominal). Building corners are sheathed with 13 mm (0.50 in.) structural fiberboard wall sheathing with a thermal resistance of RSI 0.23 (R-1.3). The overall thermal resistance of the exterior wall with a 20% framing factor is RSI 3.06 (R-17.4) at mid-wall locations and RSI 2.85 (R-16.2) at the corners. The house/garage wall has an overall thermal resistance of RSI 2.38 (R-13.5). Basement walls. Basement walls consist of 0.20 m (8 in.) of poured concrete insulated with unfaced RSI 1.94 (R-11) fiberglass batts in an interior frame wall covered with a polyethylene sheet on the inside surface of the insulation. Basement ceiling. The basement ceiling is insulated with RSI 3.35 (R-19) fiberglass batts to enable the basement heating and cooling loads and energy use to be isolated from the rest of the house. Attic insulation. Attic insulation consists of RSI 6.7 (R-38) blown-in cellulose insulation. Roofs have asphalt shingles and the attic is vented. Floors over unconditioned spaces. Floors over unconditioned spaces such as the garage are insulated with unfaced RSI 3.3 (R-19) fiberglass batt insulation. Measured airtightness. Measured airtightness for each house was very similar. Blower Door™ results were 385 ±8 l/s @ 50 Pa (815 ± 16 cfm @ 0.20 in. W.C.). Detailed results can be found in the Infiltration.xls summary file listed in the Appendix.
Fenestration. Three different glazing products were used for the field investigations. The different glass types are referenced on various figures in this paper.
• Clear: U= 2.51 W/m²•K (0.442 Btu/h•ft²•F) and SHGC=0.590 • Low Solar Gain Low-E (LSLE): U= 1.71 W/m²•K (0.302 Btu/h•ft²•F) and
SHGC=0.342 • High Solar Gain Low-E (HSLE): U= 1.77 W/m²•K (0.312 Btu/h•ft²•F) and
SHGC=0.484 HVAC Systems In March of 2006 the single-stage, gas-fired furnaces in each house were replaced with two-stage furnaces and two-stage A/C. This change was made to facilitate the investigation of multi-speed operation on thermal comfort and energy. Two of the houses were also outfitted with a completely redundant forced-air system, utilizing a central electric fancoil, ductwork suspended within the living space, and high sidewall diffusers. In addition to the manufacturer’s default airflow settings, the maximum total airflow of the fancoil could also be overridden to 577 L/s. Heating was controlled in three 5-kW stages, so that three different supply air temperatures at the same airflow could be evaluated. A default airflow of approximately half the maximum
airflow enabled the same supply air temperature to be evaluated at two different airflows.
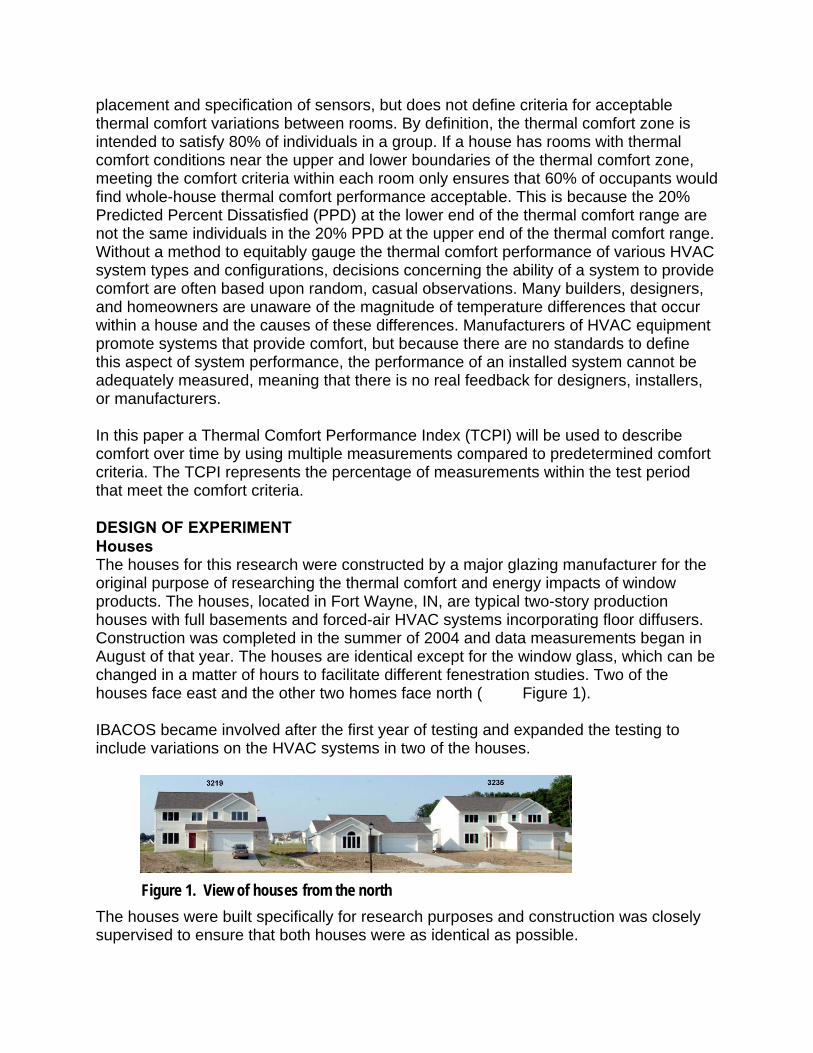
Table 1. Steady-State Heating Supply Air Temperatures @ 21.0°C return air temperature
Heating Capacity System Total Airflow (L/s) Stage 1 (5 kW) Stage 2 (10 kW) Stage 3 (15 kW) 577 28.6ºC2 35.5ºC2 42.2ºC3 399 31.9ºC3 N/A N/A 278 35.7ºC3 N/A N/A Fancoil1
295 N/A 50.2ºC3 N/A 235 46.3ºC N/A N/A Furnace 321 N/A 49.2ºC3 N/A
1.) For instances throughout the remainder of this paper, an airflow of 577 L/s is inferred for all heating capacity stages unless otherwise noted. 2.) Measured steady-state supply air temperature 3.) Calculated steady-state supply air temperature
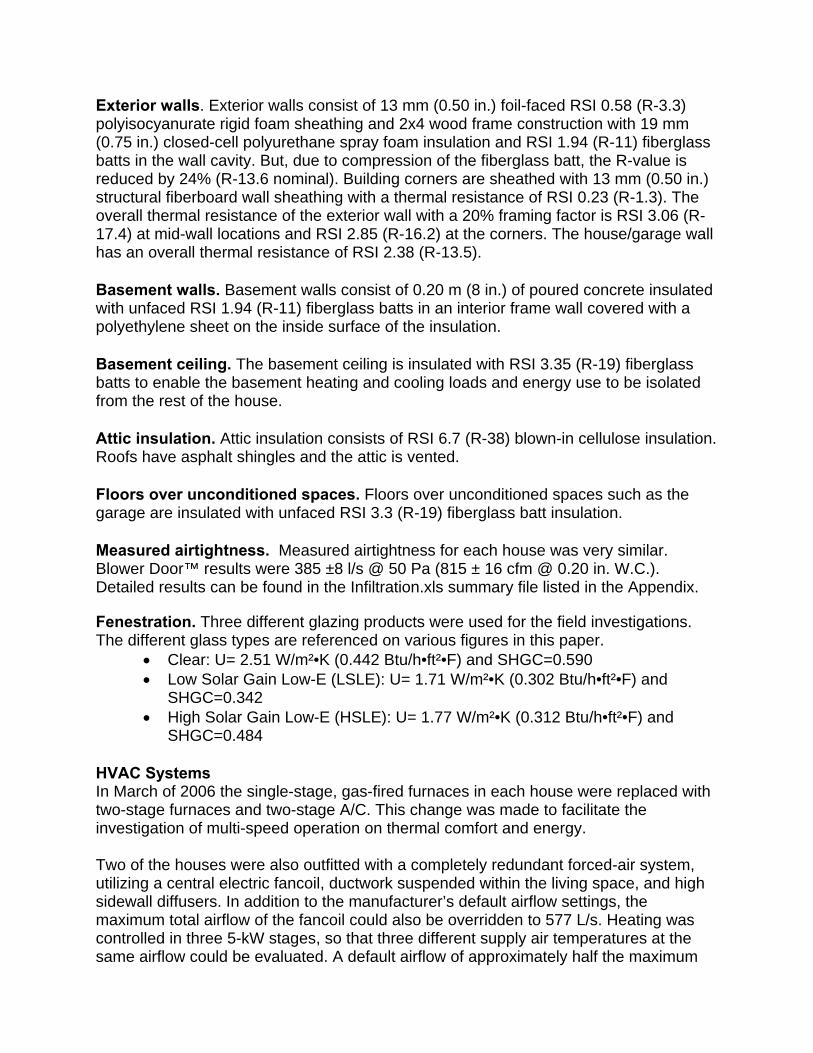
Figure 2. Redundant Central Forced-Air System with Ductwork Inside Conditioned Space
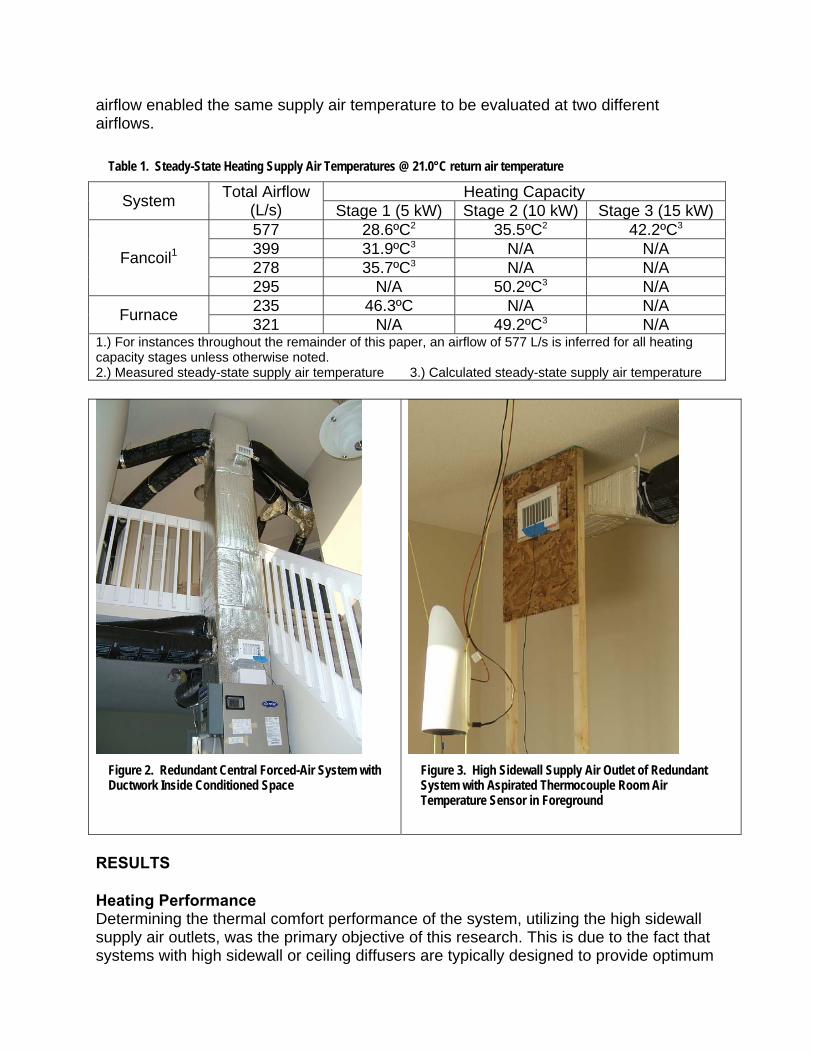
Figure 3. High Sidewall Supply Air Outlet of Redundant System with Aspirated Thermocouple Room Air Temperature Sensor in Foreground
RESULTS Heating Performance Determining the thermal comfort performance of the system, utilizing the high sidewall supply air outlets, was the primary objective of this research. This is due to the fact that systems with high sidewall or ceiling diffusers are typically designed to provide optimum
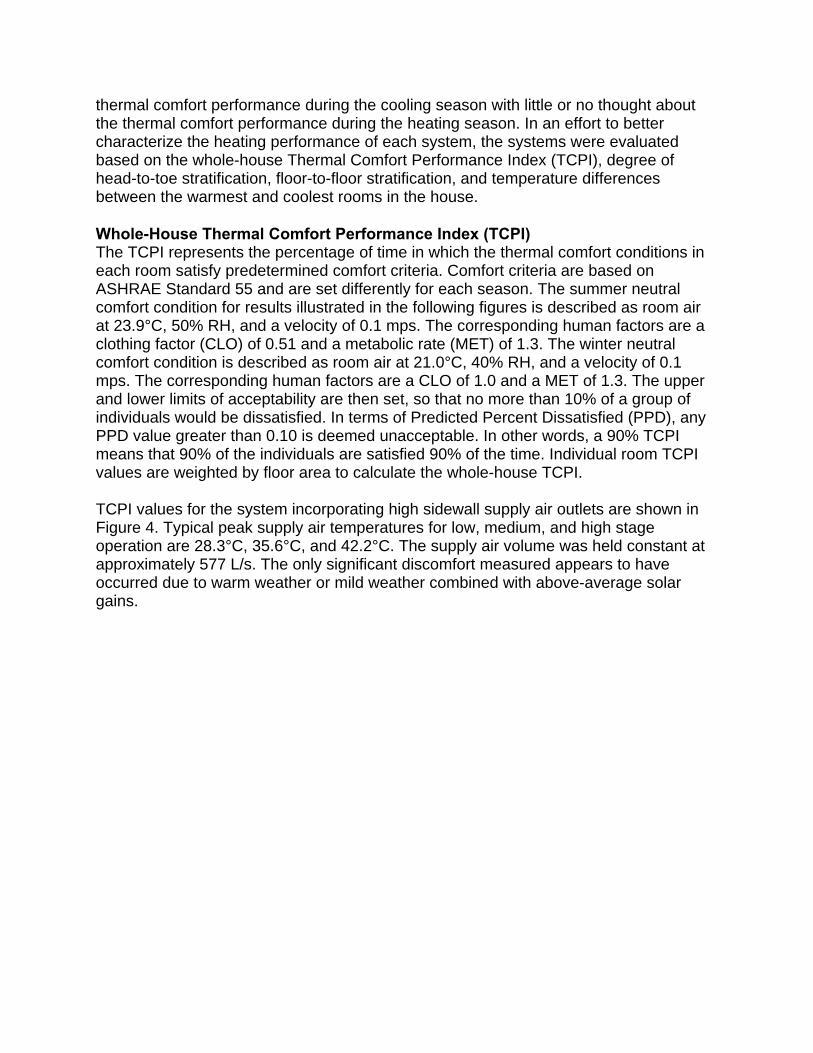
thermal comfort performance during the cooling season with little or no thought about the thermal comfort performance during the heating season. In an effort to better characterize the heating performance of each system, the systems were evaluated based on the whole-house Thermal Comfort Performance Index (TCPI), degree of head-to-toe stratification, floor-to-floor stratification, and temperature differences between the warmest and coolest rooms in the house. Whole-House Thermal Comfort Performance Index (TCPI) The TCPI represents the percentage of time in which the thermal comfort conditions in each room satisfy predetermined comfort criteria. Comfort criteria are based on ASHRAE Standard 55 and are set differently for each season. The summer neutral comfort condition for results illustrated in the following figures is described as room air at 23.9°C, 50% RH, and a velocity of 0.1 mps. The corresponding human factors are a clothing factor (CLO) of 0.51 and a metabolic rate (MET) of 1.3. The winter neutral comfort condition is described as room air at 21.0°C, 40% RH, and a velocity of 0.1 mps. The corresponding human factors are a CLO of 1.0 and a MET of 1.3. The upper and lower limits of acceptability are then set, so that no more than 10% of a group of individuals would be dissatisfied. In terms of Predicted Percent Dissatisfied (PPD), any PPD value greater than 0.10 is deemed unacceptable. In other words, a 90% TCPI means that 90% of the individuals are satisfied 90% of the time. Individual room TCPI values are weighted by floor area to calculate the whole-house TCPI. TCPI values for the system incorporating high sidewall supply air outlets are shown in Figure 4. Typical peak supply air temperatures for low, medium, and high stage operation are 28.3°C, 35.6°C, and 42.2°C. The supply air volume was held constant at approximately 577 L/s. The only significant discomfort measured appears to have occurred due to warm weather or mild weather combined with above-average solar gains.
-20
-15
-10
-5
0
5
10
15
20
25
0% 20% 40% 60% 80% 100%
Outdoor Temperature -(ºC)
TCPI
Low Stage - 5 kW
Medium Stage - 10 kW
High Stage - (15 kW)
Unacceptable thermal comfort performance due to warm weather or mild weather combined with above-average solar gains
Excellent TCPI is maintained as heating
load increases.
Figure 4. Average Daily Whole-House TCPI, Heating Season, Fancoil with High Sidewall Diffusers
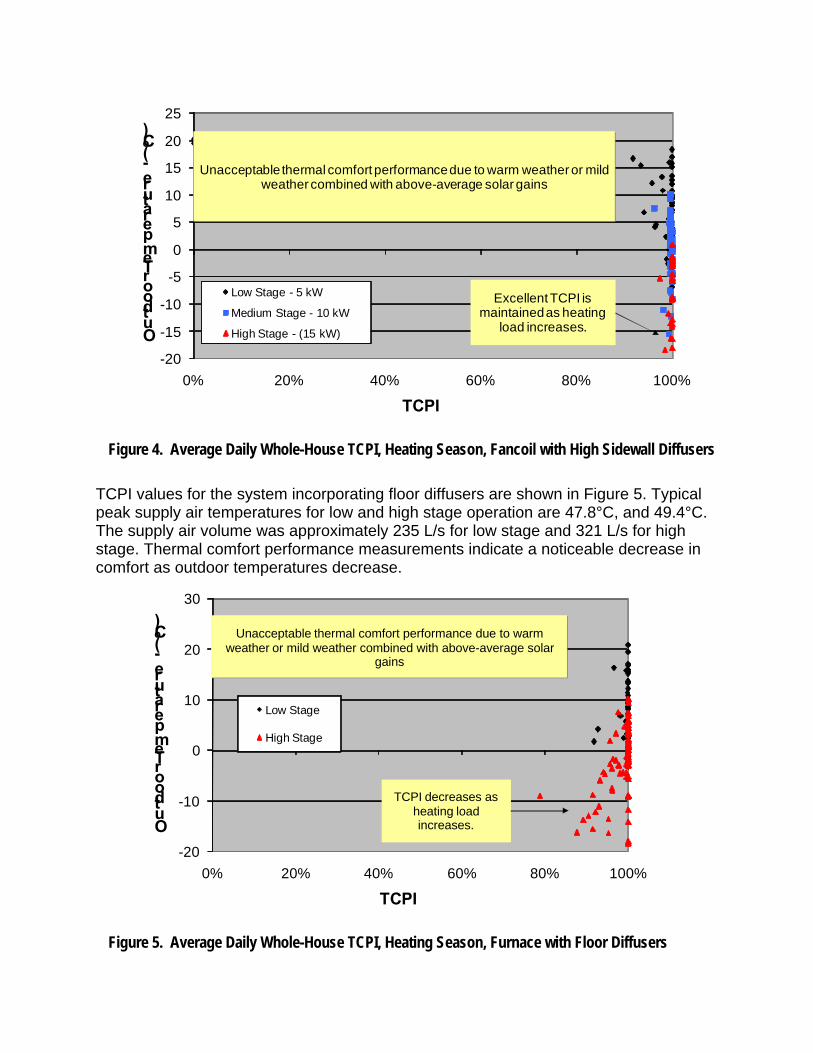
TCPI values for the system incorporating floor diffusers are shown in Figure 5. Typical peak supply air temperatures for low and high stage operation are 47.8°C, and 49.4°C. The supply air volume was approximately 235 L/s for low stage and 321 L/s for high stage. Thermal comfort performance measurements indicate a noticeable decrease in comfort as outdoor temperatures decrease.
-20
-10
0
10
20
30
0% 20% 40% 60% 80% 100%
Outdoor Temperature -(ºC)
TCPI
Low Stage
High Stage
TCPI decreases as heating load increases.
Unacceptable thermal comfort performance due to warm weather or mild weather combined with above-average solar
gains
Figure 5. Average Daily Whole-House TCPI, Heating Season, Furnace with Floor Diffusers
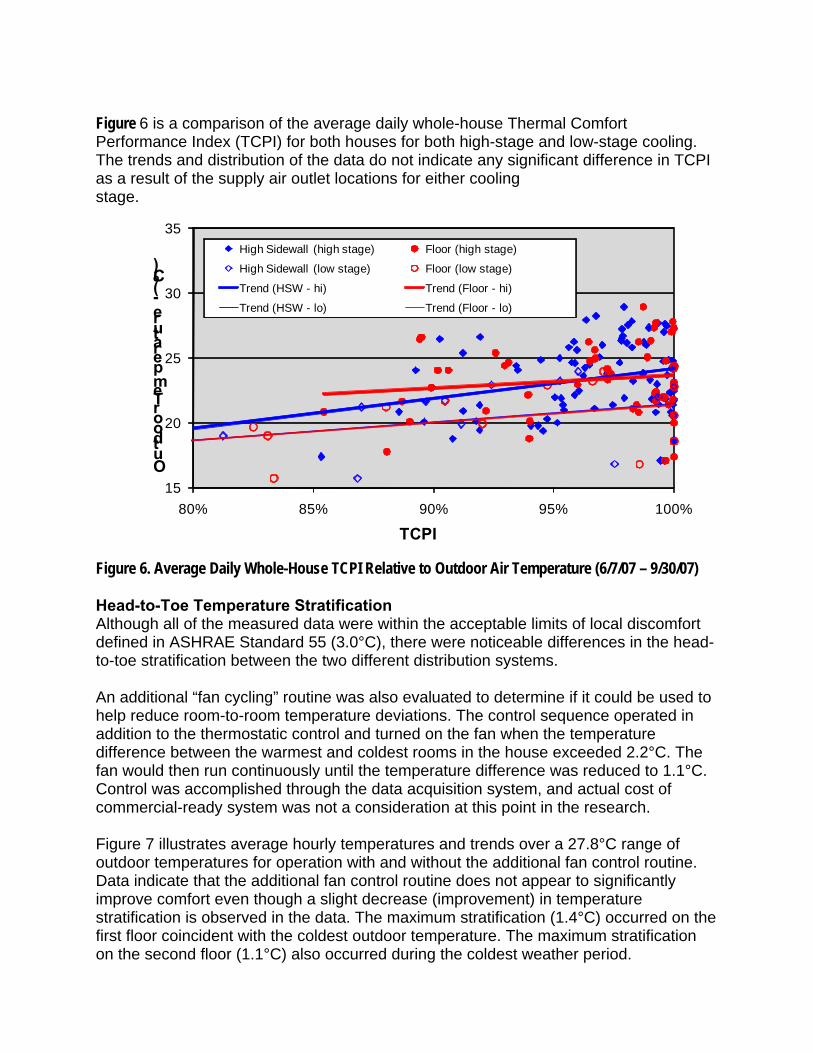
Figure 6 is a comparison of the average daily whole-house Thermal Comfort Performance Index (TCPI) for both houses for both high-stage and low-stage cooling. The trends and distribution of the data do not indicate any significant difference in TCPI as a result of the supply air outlet locations for either cooling stage.
15
20
25
30
35
80% 85% 90% 95% 100%
Outdoor Temperature -(ºC)
TCPI
High Sidewall (high stage) Floor (high stage)
High Sidewall (low stage) Floor (low stage)
Trend (HSW - hi) Trend (Floor - hi)
Trend (HSW - lo) Trend (Floor - lo)
Figure 6. Average Daily Whole-House TCPI Relative to Outdoor Air Temperature (6/7/07 – 9/30/07) Head-to-Toe Temperature Stratification Although all of the measured data were within the acceptable limits of local discomfort defined in ASHRAE Standard 55 (3.0°C), there were noticeable differences in the head-to-toe stratification between the two different distribution systems. An additional “fan cycling” routine was also evaluated to determine if it could be used to help reduce room-to-room temperature deviations. The control sequence operated in addition to the thermostatic control and turned on the fan when the temperature difference between the warmest and coldest rooms in the house exceeded 2.2°C. The fan would then run continuously until the temperature difference was reduced to 1.1°C. Control was accomplished through the data acquisition system, and actual cost of commercial-ready system was not a consideration at this point in the research. Figure 7 illustrates average hourly temperatures and trends over a 27.8°C range of outdoor temperatures for operation with and without the additional fan control routine. Data indicate that the additional fan control routine does not appear to significantly improve comfort even though a slight decrease (improvement) in temperature stratification is observed in the data. The maximum stratification (1.4°C) occurred on the first floor coincident with the coldest outdoor temperature. The maximum stratification on the second floor (1.1°C) also occurred during the coldest weather period.
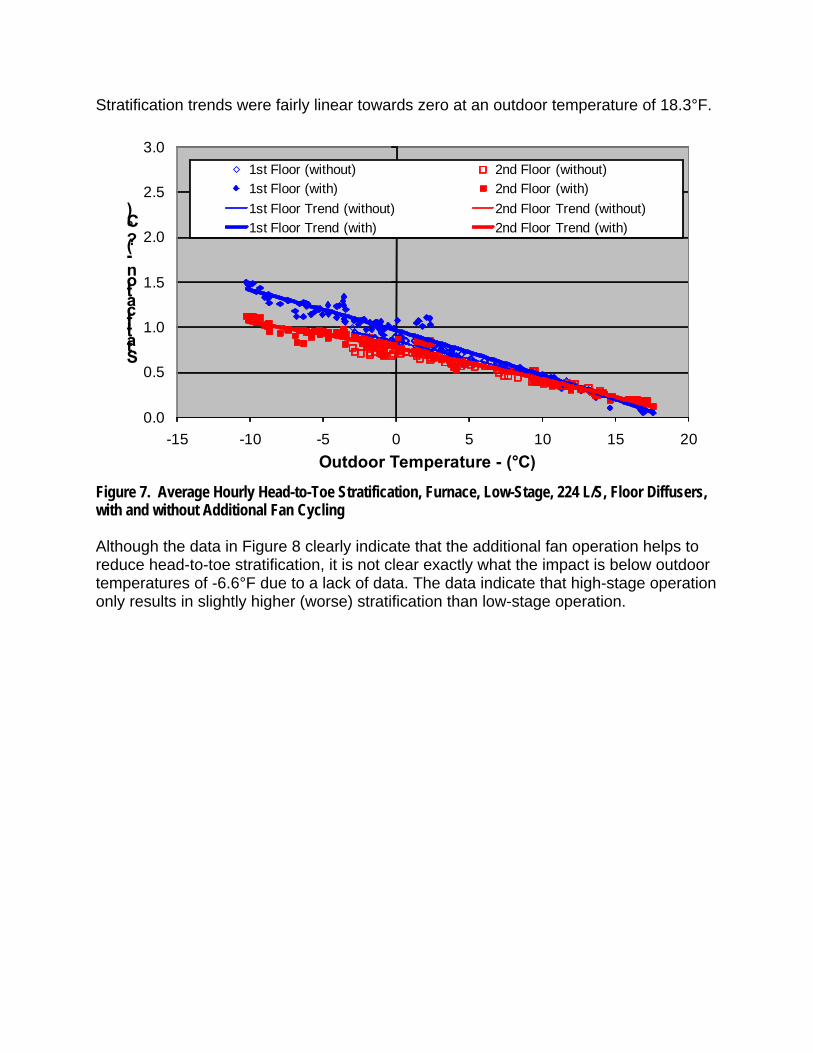
Stratification trends were fairly linear towards zero at an outdoor temperature of 18.3°F.
0.0
0.5
1.0
1.5
2.0
2.5
3.0
-15 -10 -5 0 5 10 15 20
Statification -(?°C)
Outdoor Temperature - (°C)
1st Floor (without) 2nd Floor (without)1st Floor (with) 2nd Floor (with)1st Floor Trend (without) 2nd Floor Trend (without)1st Floor Trend (with) 2nd Floor Trend (with)
Figure 7. Average Hourly Head-to-Toe Stratification, Furnace, Low-Stage, 224 L/S, Floor Diffusers, with and without Additional Fan Cycling Although the data in Figure 8 clearly indicate that the additional fan operation helps to reduce head-to-toe stratification, it is not clear exactly what the impact is below outdoor temperatures of -6.6°F due to a lack of data. The data indicate that high-stage operation only results in slightly higher (worse) stratification than low-stage operation.
0.0
0.5
1.0
1.5
2.0
2.5
3.0
-25 -15 -5 5 15
Statification -(?°C)
Outdoor Temperature - (°C)
1st Floor (without) 2nd Floor (without)1st Floor (with) 2nd Floor (with)1st Floor Trend (without) 2nd Floor Trend (without)1st Floor Trend (with) 2nd Floor Trend (with)
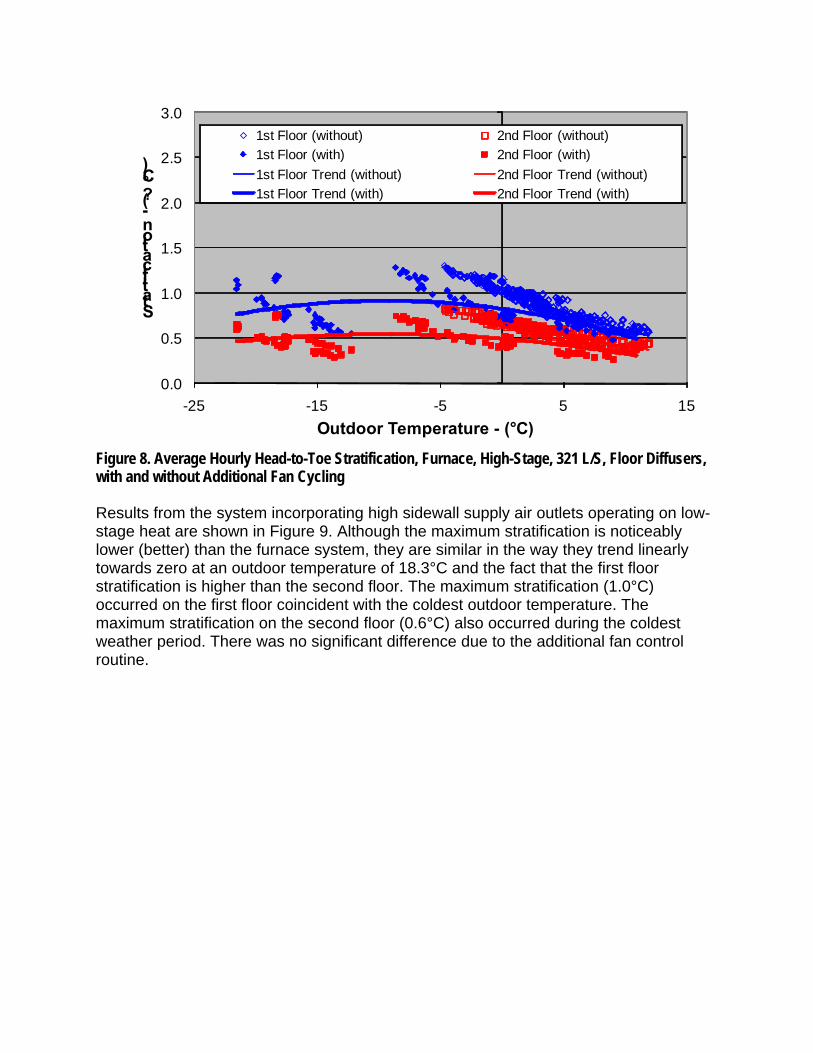
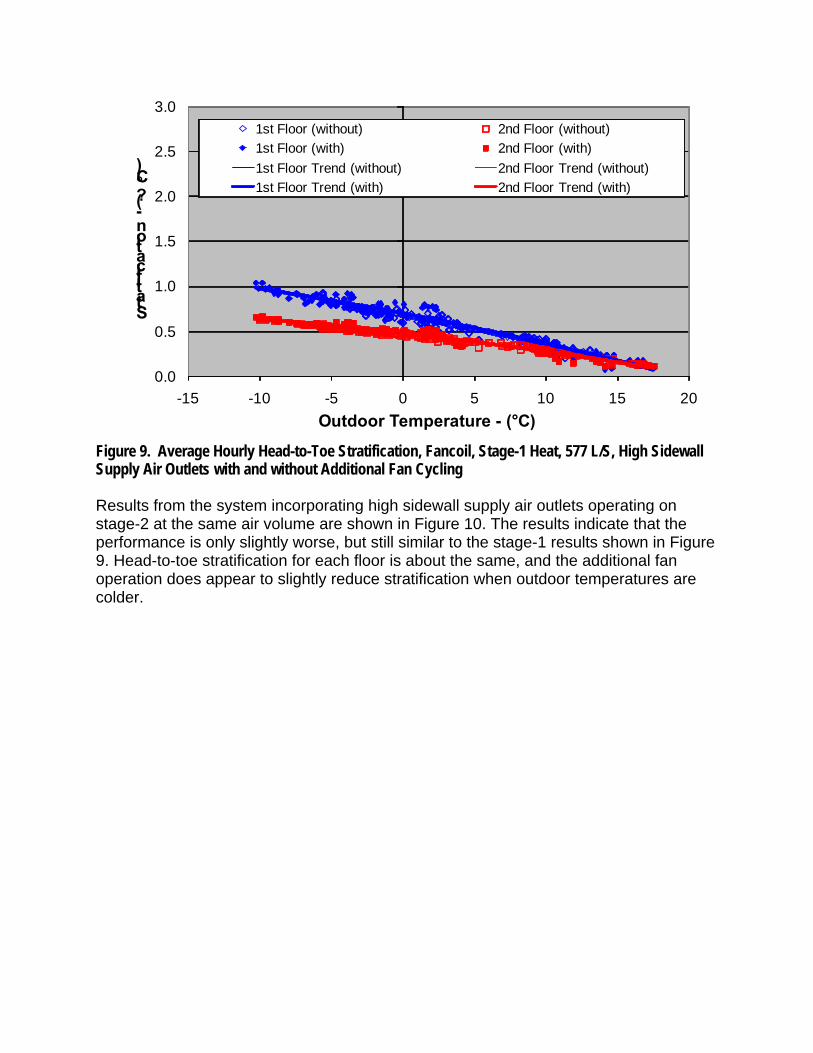
Figure 8. Average Hourly Head-to-Toe Stratification, Furnace, High-Stage, 321 L/S, Floor Diffusers, with and without Additional Fan Cycling Results from the system incorporating high sidewall supply air outlets operating on low-stage heat are shown in Figure 9. Although the maximum stratification is noticeably lower (better) than the furnace system, they are similar in the way they trend linearly towards zero at an outdoor temperature of 18.3°C and the fact that the first floor stratification is higher than the second floor. The maximum stratification (1.0°C) occurred on the first floor coincident with the coldest outdoor temperature. The maximum stratification on the second floor (0.6°C) also occurred during the coldest weather period. There was no significant difference due to the additional fan control routine.
0.0
0.5
1.0
1.5
2.0
2.5
3.0
-15 -10 -5 0 5 10 15 20
Statification -(?°C)
Outdoor Temperature - (°C)
1st Floor (without) 2nd Floor (without)1st Floor (with) 2nd Floor (with)1st Floor Trend (without) 2nd Floor Trend (without)1st Floor Trend (with) 2nd Floor Trend (with)
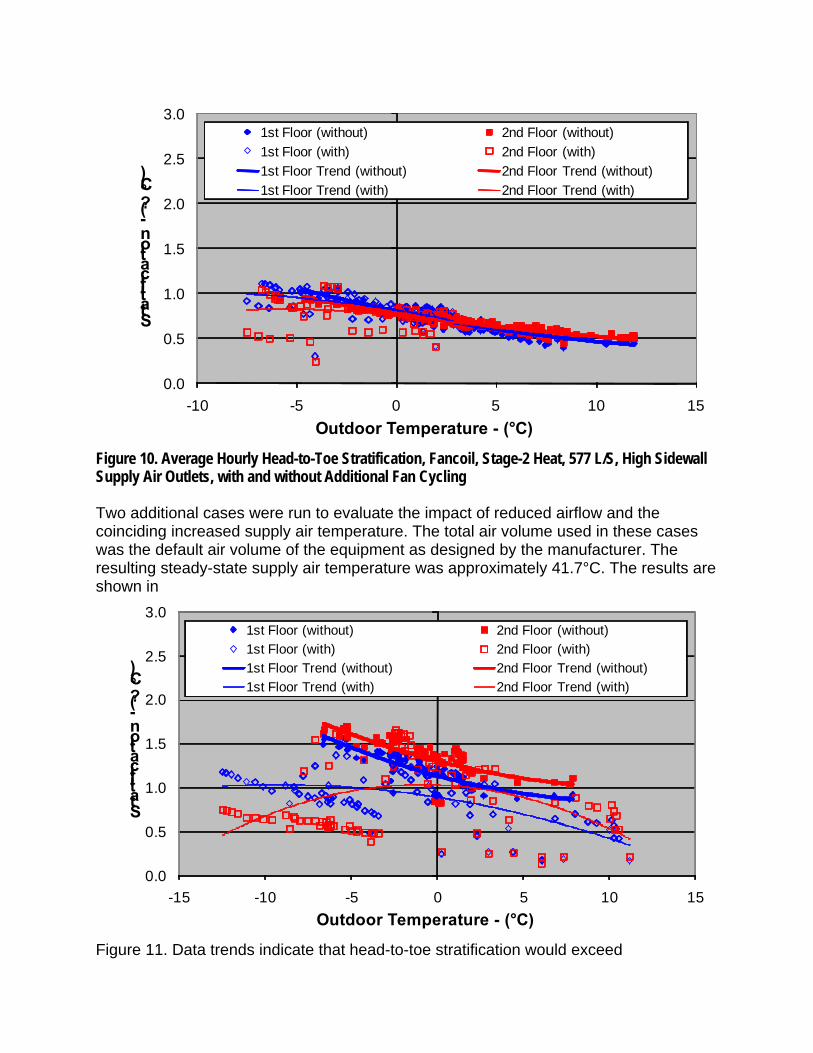
Figure 9. Average Hourly Head-to-Toe Stratification, Fancoil, Stage-1 Heat, 577 L/S, High Sidewall Supply Air Outlets with and without Additional Fan Cycling Results from the system incorporating high sidewall supply air outlets operating on stage-2 at the same air volume are shown in Figure 10. The results indicate that the performance is only slightly worse, but still similar to the stage-1 results shown in Figure 9. Head-to-toe stratification for each floor is about the same, and the additional fan operation does appear to slightly reduce stratification when outdoor temperatures are colder.
0.0
0.5
1.0
1.5
2.0
2.5
3.0
-10 -5 0 5 10 15
Statification -(?°C)
Outdoor Temperature - (°C)
1st Floor (without) 2nd Floor (without)1st Floor (with) 2nd Floor (with)1st Floor Trend (without) 2nd Floor Trend (without)1st Floor Trend (with) 2nd Floor Trend (with)
Figure 10. Average Hourly Head-to-Toe Stratification, Fancoil, Stage-2 Heat, 577 L/S, High Sidewall Supply Air Outlets, with and without Additional Fan Cycling Two additional cases were run to evaluate the impact of reduced airflow and the coinciding increased supply air temperature. The total air volume used in these cases was the default air volume of the equipment as designed by the manufacturer. The resulting steady-state supply air temperature was approximately 41.7°C. The results are shown in
0.0
0.5
1.0
1.5
2.0
2.5
3.0
-15 -10 -5 0 5 10 15
Statification -(?°C)
Outdoor Temperature - (°C)
1st Floor (without) 2nd Floor (without)1st Floor (with) 2nd Floor (with)1st Floor Trend (without) 2nd Floor Trend (without)1st Floor Trend (with) 2nd Floor Trend (with)
Figure 11. Data trends indicate that head-to-toe stratification would exceed
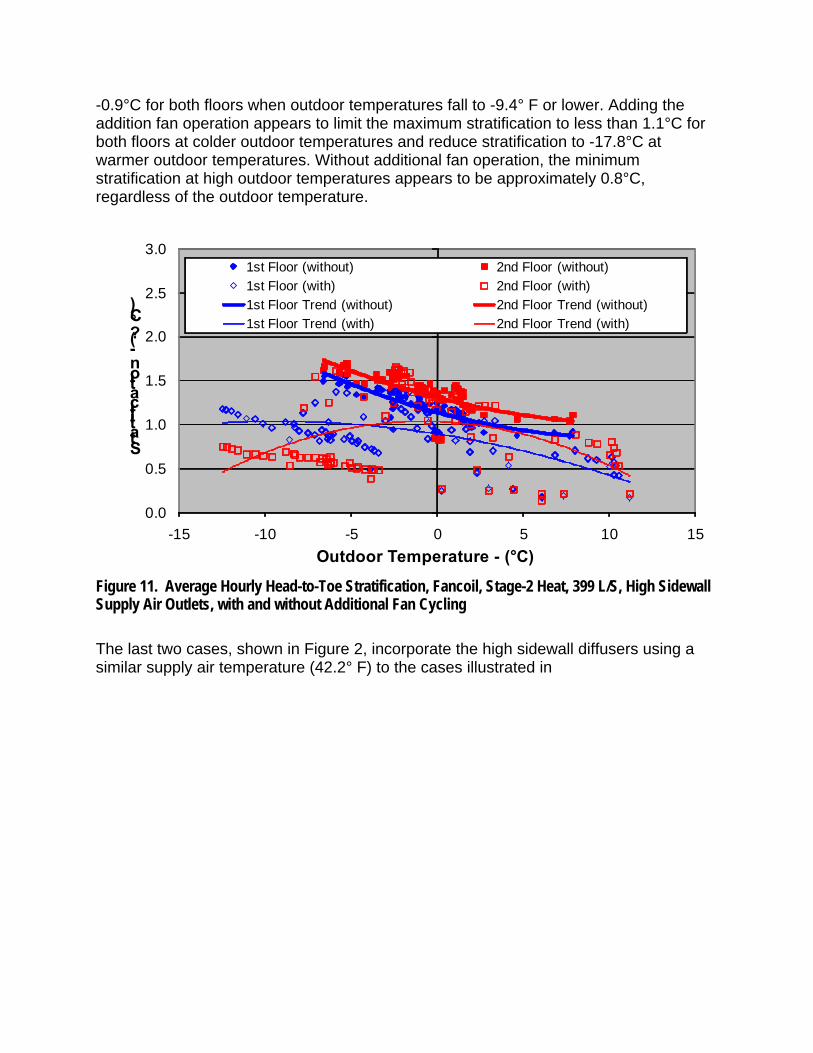
-0.9°C for both floors when outdoor temperatures fall to -9.4° F or lower. Adding the addition fan operation appears to limit the maximum stratification to less than 1.1°C for both floors at colder outdoor temperatures and reduce stratification to -17.8°C at warmer outdoor temperatures. Without additional fan operation, the minimum stratification at high outdoor temperatures appears to be approximately 0.8°C, regardless of the outdoor temperature.
0.0
0.5
1.0
1.5
2.0
2.5
3.0
-15 -10 -5 0 5 10 15
Statification -(?°C)
Outdoor Temperature - (°C)
1st Floor (without) 2nd Floor (without)1st Floor (with) 2nd Floor (with)1st Floor Trend (without) 2nd Floor Trend (without)1st Floor Trend (with) 2nd Floor Trend (with)
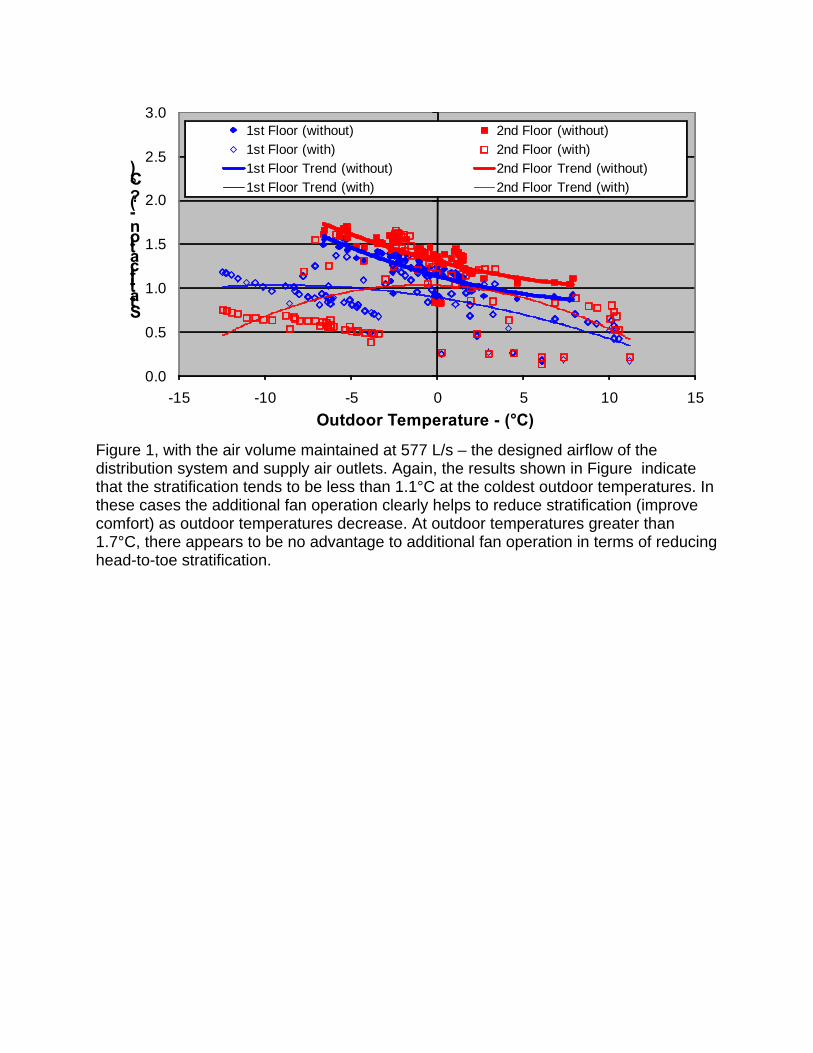
Figure 11. Average Hourly Head-to-Toe Stratification, Fancoil, Stage-2 Heat, 399 L/S, High Sidewall Supply Air Outlets, with and without Additional Fan Cycling The last two cases, shown in Figure 2, incorporate the high sidewall diffusers using a similar supply air temperature (42.2° F) to the cases illustrated in
0.0
0.5
1.0
1.5
2.0
2.5
3.0
-15 -10 -5 0 5 10 15
Statification -(?°C)
Outdoor Temperature - (°C)
1st Floor (without) 2nd Floor (without)1st Floor (with) 2nd Floor (with)1st Floor Trend (without) 2nd Floor Trend (without)1st Floor Trend (with) 2nd Floor Trend (with)
Figure 1, with the air volume maintained at 577 L/s – the designed airflow of the distribution system and supply air outlets. Again, the results shown in Figure indicate that the stratification tends to be less than 1.1°C at the coldest outdoor temperatures. In these cases the additional fan operation clearly helps to reduce stratification (improve comfort) as outdoor temperatures decrease. At outdoor temperatures greater than 1.7°C, there appears to be no advantage to additional fan operation in terms of reducing head-to-toe stratification.
0.0
0.5
1.0
1.5
2.0
2.5
3.0
-25 -20 -15 -10 -5 0 5 10 15
Statification -(?°C)
Outdoor Temperature - (°C)
1st Floor (without) 2nd Floor (without)1st Floor (with) 2nd Floor (with)1st Floor Trend (without) 2nd Floor Trend (without)1st Floor Trend (with) 2nd Floor Trend (with)
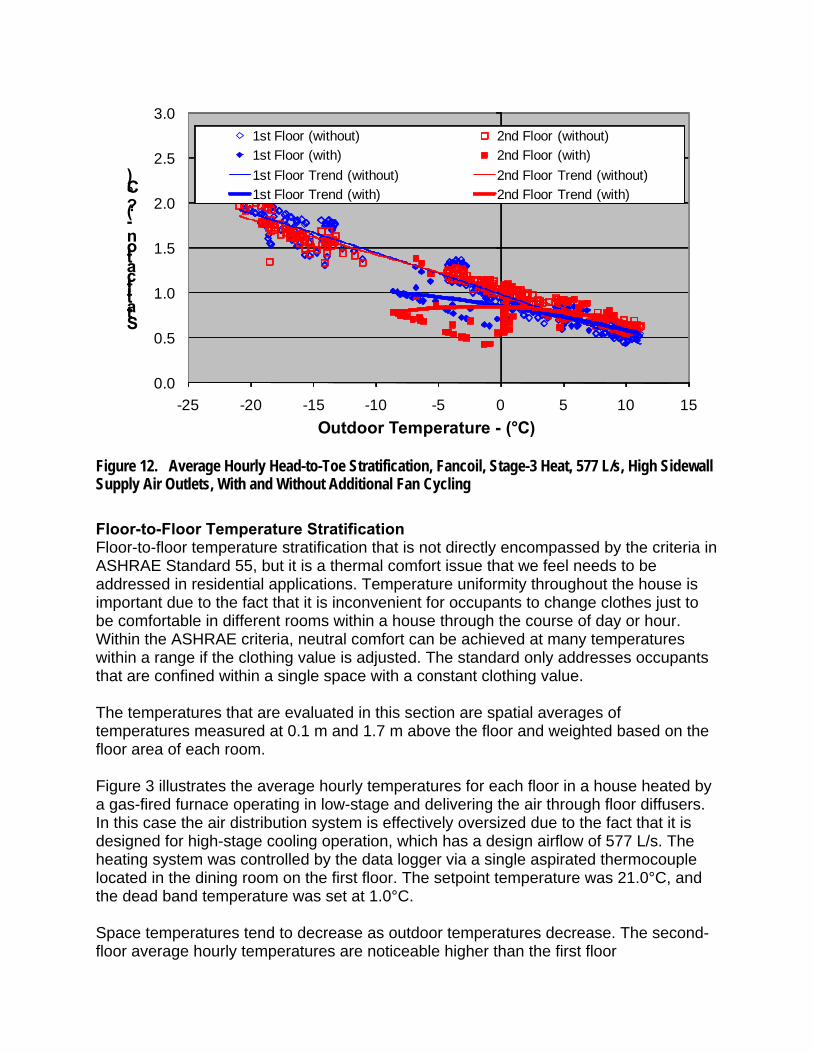
Figure 12. Average Hourly Head-to-Toe Stratification, Fancoil, Stage-3 Heat, 577 L/s, High Sidewall Supply Air Outlets, With and Without Additional Fan Cycling Floor-to-Floor Temperature Stratification Floor-to-floor temperature stratification that is not directly encompassed by the criteria in ASHRAE Standard 55, but it is a thermal comfort issue that we feel needs to be addressed in residential applications. Temperature uniformity throughout the house is important due to the fact that it is inconvenient for occupants to change clothes just to be comfortable in different rooms within a house through the course of day or hour. Within the ASHRAE criteria, neutral comfort can be achieved at many temperatures within a range if the clothing value is adjusted. The standard only addresses occupants that are confined within a single space with a constant clothing value. The temperatures that are evaluated in this section are spatial averages of temperatures measured at 0.1 m and 1.7 m above the floor and weighted based on the floor area of each room. Figure 3 illustrates the average hourly temperatures for each floor in a house heated by a gas-fired furnace operating in low-stage and delivering the air through floor diffusers. In this case the air distribution system is effectively oversized due to the fact that it is designed for high-stage cooling operation, which has a design airflow of 577 L/s. The heating system was controlled by the data logger via a single aspirated thermocouple located in the dining room on the first floor. The setpoint temperature was 21.0°C, and the dead band temperature was set at 1.0°C. Space temperatures tend to decrease as outdoor temperatures decrease. The second-floor average hourly temperatures are noticeable higher than the first floor
temperatures. This is similar to all the cases involving the fancoil and high sidewall supply air outlets; however, it is opposite of the high-stage furnace case illustrated in Figure 4.
20.0
20.5
21.0
21.5
22.0
22.5
23.0
23.5
24.0
-15 -10 -5 0 5 10 15 20
Indoor Temperature -(°C)
Outdoor Temperature - (°C)
1st Floor (without) 2nd Floor (without)1st Floor (with) 2nd Floor (with)1st Floor Trend (without) 2nd Floor Trend (without)1st Floor Trend (with) 2nd Floor Trend (with)
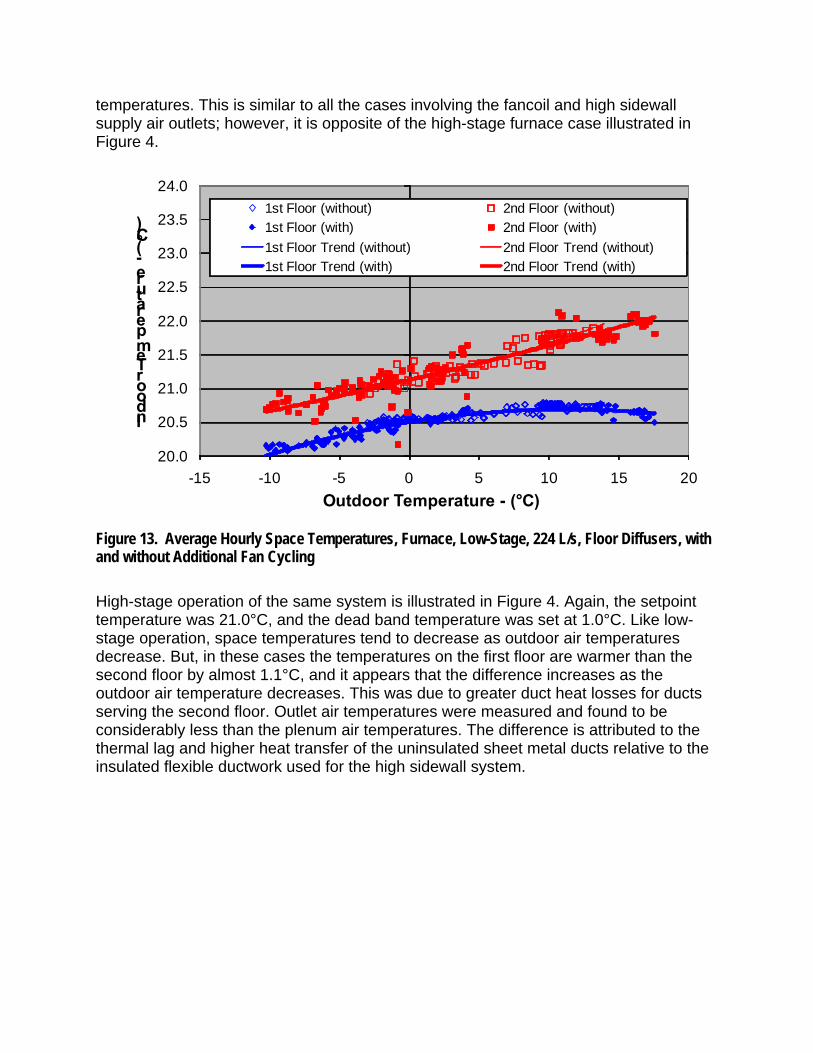
Figure 13. Average Hourly Space Temperatures, Furnace, Low-Stage, 224 L/s, Floor Diffusers, with and without Additional Fan Cycling High-stage operation of the same system is illustrated in Figure 4. Again, the setpoint temperature was 21.0°C, and the dead band temperature was set at 1.0°C. Like low-stage operation, space temperatures tend to decrease as outdoor air temperatures decrease. But, in these cases the temperatures on the first floor are warmer than the second floor by almost 1.1°C, and it appears that the difference increases as the outdoor air temperature decreases. This was due to greater duct heat losses for ducts serving the second floor. Outlet air temperatures were measured and found to be considerably less than the plenum air temperatures. The difference is attributed to the thermal lag and higher heat transfer of the uninsulated sheet metal ducts relative to the insulated flexible ductwork used for the high sidewall system.
18.0
18.5
19.0
19.5
20.0
20.5
21.0
21.5
22.0
-10 -5 0 5 10 15
Indoor Temperatures -(°C)
Outdoor Temperature - (°C)
1st Floor (without) 2nd Floor (without)1st Floor (with) 2nd Floor (with)1st Floor Trend (without) 2nd Floor Trend (without)1st Floor Trend (with) 2nd Floor Trend (with)
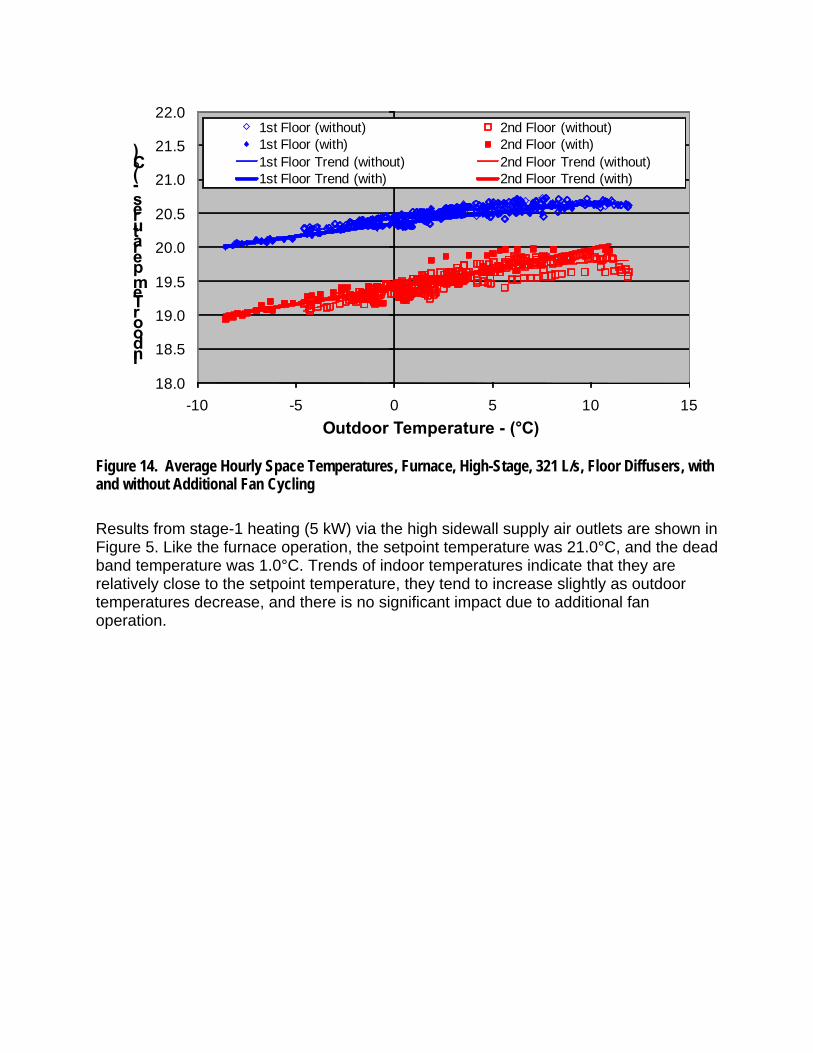
Figure 14. Average Hourly Space Temperatures, Furnace, High-Stage, 321 L/s, Floor Diffusers, with and without Additional Fan Cycling Results from stage-1 heating (5 kW) via the high sidewall supply air outlets are shown in Figure 5. Like the furnace operation, the setpoint temperature was 21.0°C, and the dead band temperature was 1.0°C. Trends of indoor temperatures indicate that they are relatively close to the setpoint temperature, they tend to increase slightly as outdoor temperatures decrease, and there is no significant impact due to additional fan operation.
20
21
22
23
24
25
-15 -10 -5 0 5 10 15 20
Indoor Temperature -(°C)
Outdoor Temperature - (°C)
1st Floor (without) 2nd Floor (without)1st Floor (with) 2nd Floor (with)1st Floor Trend (without) 2nd Floor Trend (without)1st Floor Trend (with) 2nd Floor Trend (with)
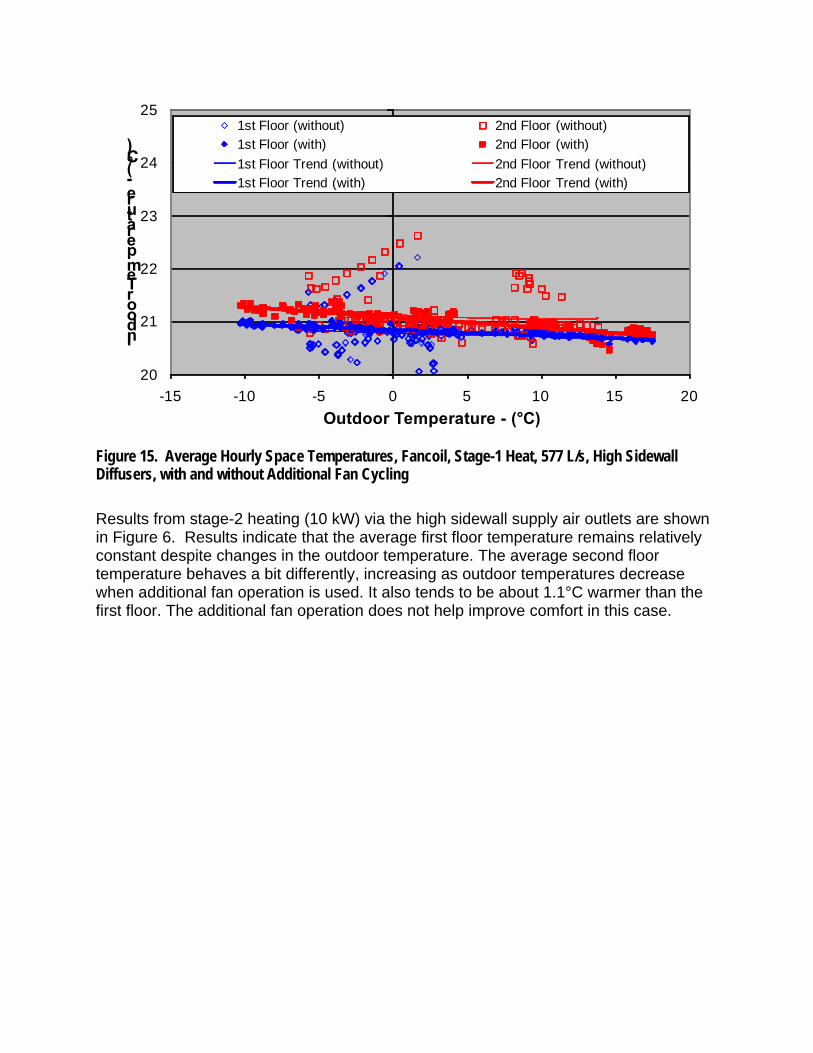
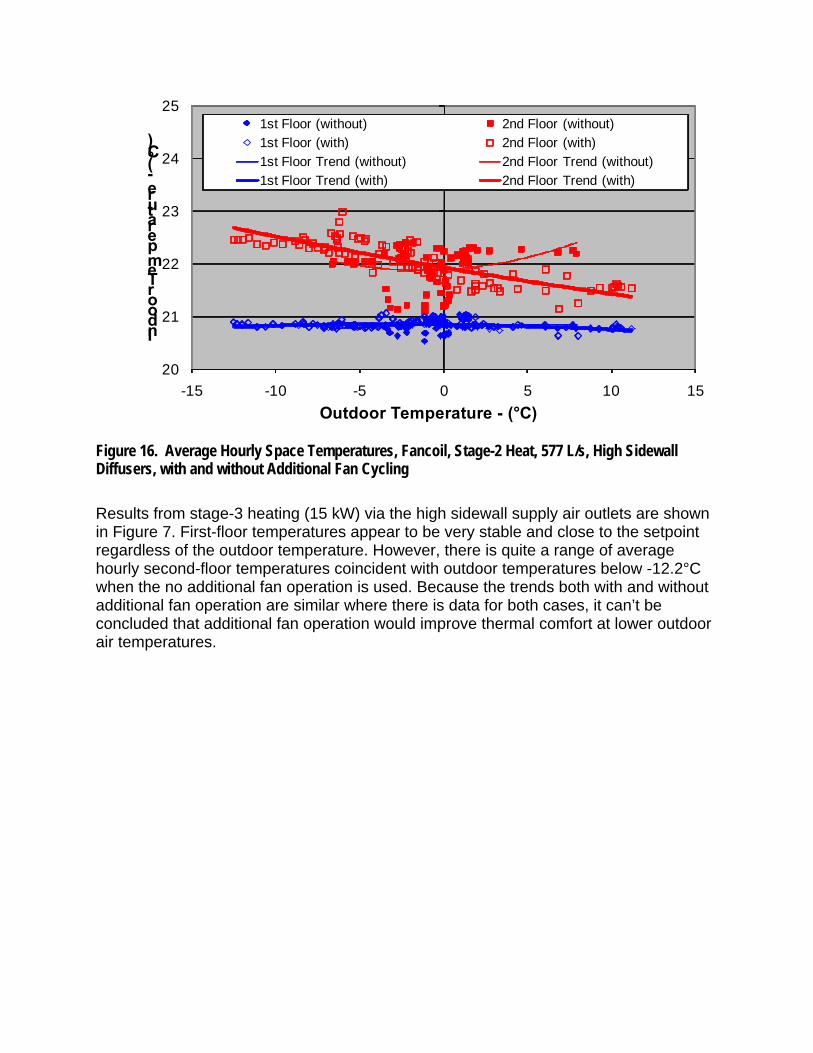
Figure 15. Average Hourly Space Temperatures, Fancoil, Stage-1 Heat, 577 L/s, High Sidewall Diffusers, with and without Additional Fan Cycling Results from stage-2 heating (10 kW) via the high sidewall supply air outlets are shown in Figure 6. Results indicate that the average first floor temperature remains relatively constant despite changes in the outdoor temperature. The average second floor temperature behaves a bit differently, increasing as outdoor temperatures decrease when additional fan operation is used. It also tends to be about 1.1°C warmer than the first floor. The additional fan operation does not help improve comfort in this case.
20
21
22
23
24
25
-15 -10 -5 0 5 10 15
Indoor Temperature -(°C)
Outdoor Temperature - (°C)
1st Floor (without) 2nd Floor (without)1st Floor (with) 2nd Floor (with)1st Floor Trend (without) 2nd Floor Trend (without)1st Floor Trend (with) 2nd Floor Trend (with)
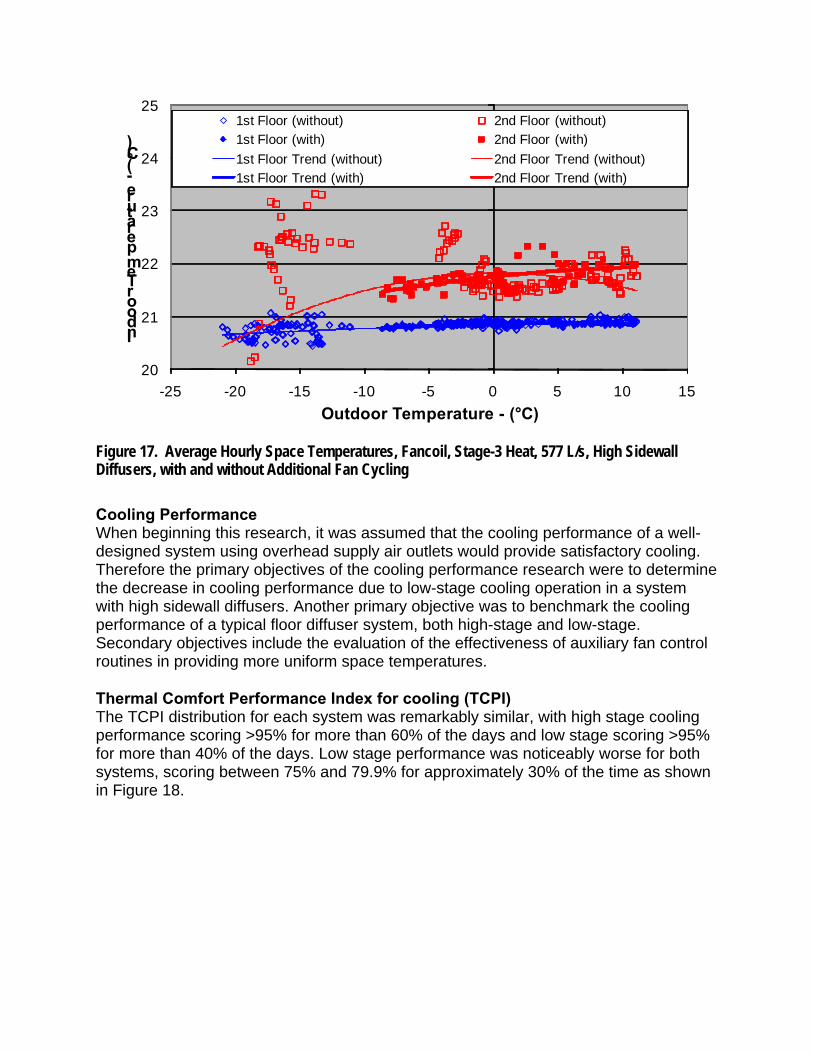
Figure 16. Average Hourly Space Temperatures, Fancoil, Stage-2 Heat, 577 L/s, High Sidewall Diffusers, with and without Additional Fan Cycling Results from stage-3 heating (15 kW) via the high sidewall supply air outlets are shown in Figure 7. First-floor temperatures appear to be very stable and close to the setpoint regardless of the outdoor temperature. However, there is quite a range of average hourly second-floor temperatures coincident with outdoor temperatures below -12.2°C when the no additional fan operation is used. Because the trends both with and without additional fan operation are similar where there is data for both cases, it can’t be concluded that additional fan operation would improve thermal comfort at lower outdoor air temperatures.
20
21
22
23
24
25
-25 -20 -15 -10 -5 0 5 10 15
Indoor Temperature -(°C)
Outdoor Temperature - (°C)
1st Floor (without) 2nd Floor (without)1st Floor (with) 2nd Floor (with)1st Floor Trend (without) 2nd Floor Trend (without)1st Floor Trend (with) 2nd Floor Trend (with)
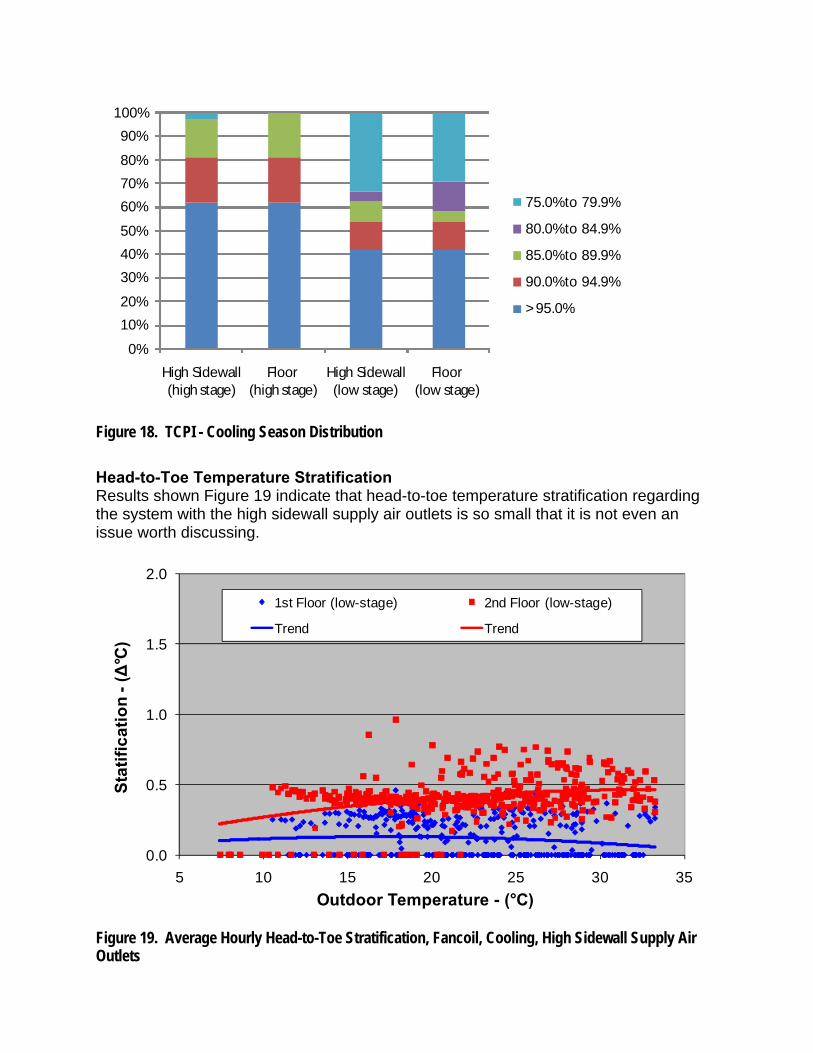
Figure 17. Average Hourly Space Temperatures, Fancoil, Stage-3 Heat, 577 L/s, High Sidewall Diffusers, with and without Additional Fan Cycling Cooling Performance When beginning this research, it was assumed that the cooling performance of a well-designed system using overhead supply air outlets would provide satisfactory cooling. Therefore the primary objectives of the cooling performance research were to determine the decrease in cooling performance due to low-stage cooling operation in a system with high sidewall diffusers. Another primary objective was to benchmark the cooling performance of a typical floor diffuser system, both high-stage and low-stage. Secondary objectives include the evaluation of the effectiveness of auxiliary fan control routines in providing more uniform space temperatures. Thermal Comfort Performance Index for cooling (TCPI) The TCPI distribution for each system was remarkably similar, with high stage cooling performance scoring >95% for more than 60% of the days and low stage scoring >95% for more than 40% of the days. Low stage performance was noticeably worse for both systems, scoring between 75% and 79.9% for approximately 30% of the time as shown in Figure 18.
0%
10%20%
30%40%50%
60%70%80%
90%100%
High Sidewall(high stage)
Floor(high stage)
High Sidewall(low stage)
Floor(low stage)
75.0% to 79.9%
80.0% to 84.9%
85.0% to 89.9%
90.0% to 94.9%
> 95.0%
Figure 18. TCPI - Cooling Season Distribution Head-to-Toe Temperature Stratification Results shown Figure 19 indicate that head-to-toe temperature stratification regarding the system with the high sidewall supply air outlets is so small that it is not even an issue worth discussing.
0.0
0.5
1.0
1.5
2.0
5 10 15 20 25 30 35
Stat
ifica
tion
-(Δ
°C)
Outdoor Temperature - (°C)
1st Floor (low-stage) 2nd Floor (low-stage)
Trend Trend
Figure 19. Average Hourly Head-to-Toe Stratification, Fancoil, Cooling, High Sidewall Supply Air Outlets
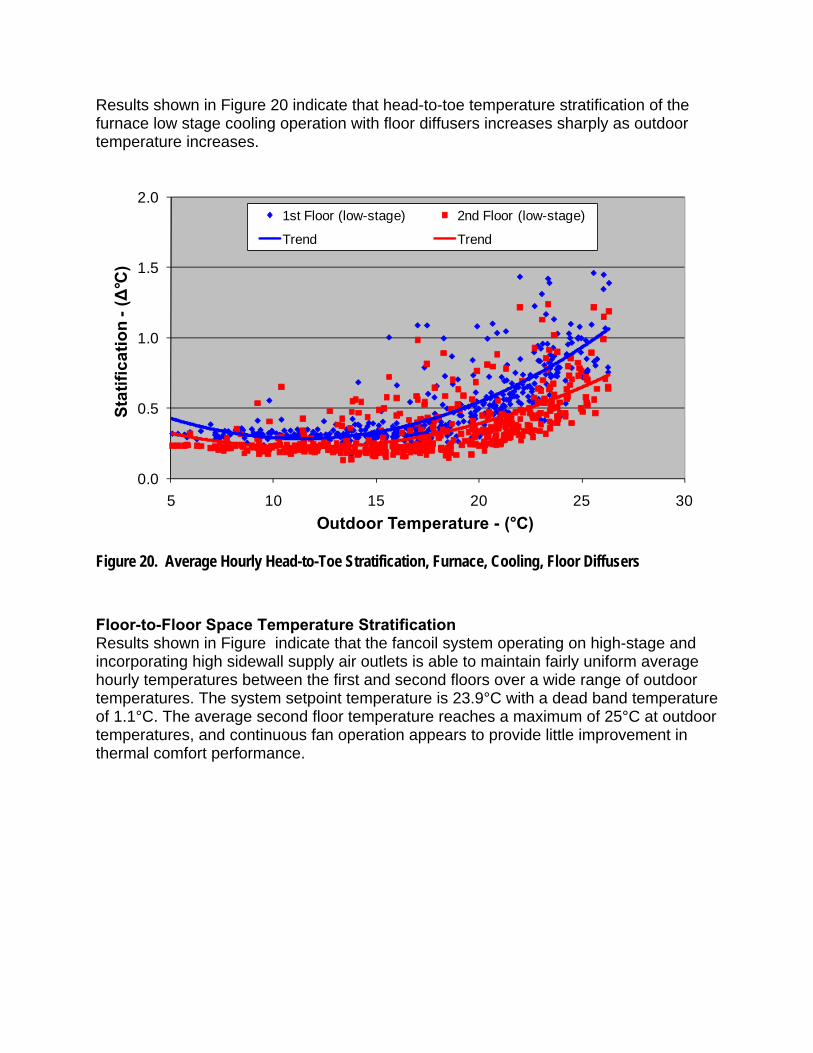
Results shown in Figure 20 indicate that head-to-toe temperature stratification of the furnace low stage cooling operation with floor diffusers increases sharply as outdoor temperature increases.
0.0
0.5
1.0
1.5
2.0
5 10 15 20 25 30
Stat
ifica
tion
-(Δ
°C)
Outdoor Temperature - (°C)
1st Floor (low-stage) 2nd Floor (low-stage)
Trend Trend
Figure 20. Average Hourly Head-to-Toe Stratification, Furnace, Cooling, Floor Diffusers
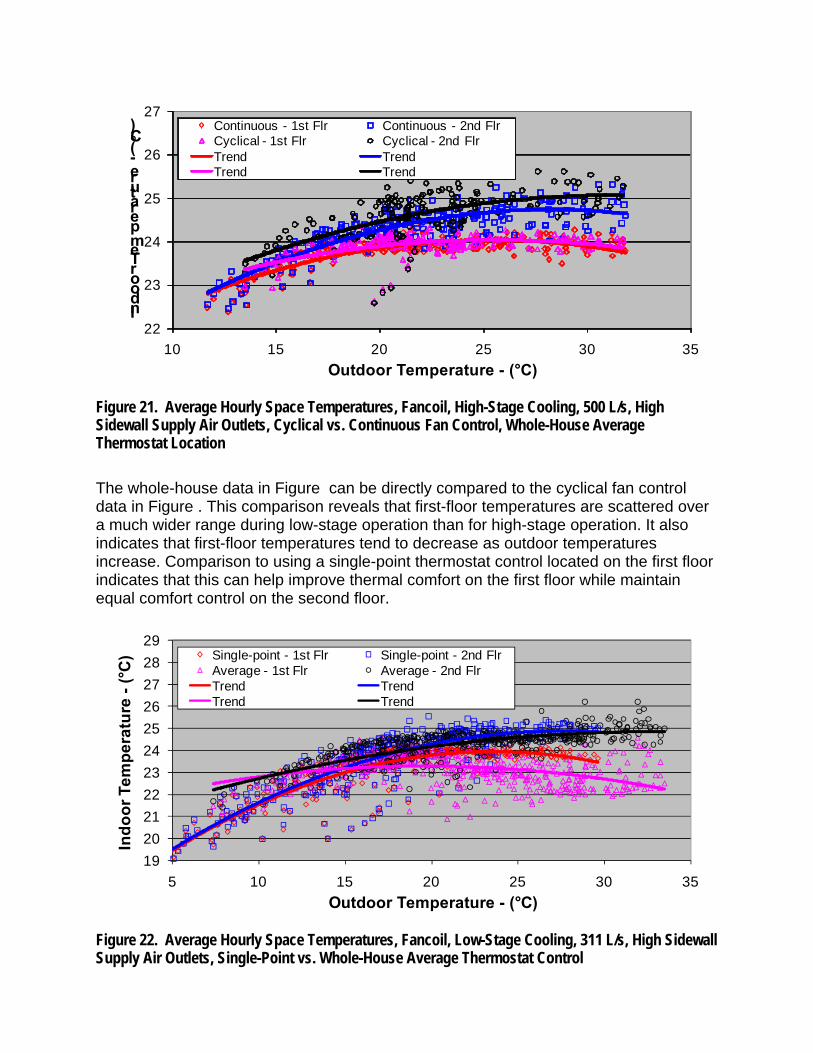
Floor-to-Floor Space Temperature Stratification Results shown in Figure indicate that the fancoil system operating on high-stage and incorporating high sidewall supply air outlets is able to maintain fairly uniform average hourly temperatures between the first and second floors over a wide range of outdoor temperatures. The system setpoint temperature is 23.9°C with a dead band temperature of 1.1°C. The average second floor temperature reaches a maximum of 25°C at outdoor temperatures, and continuous fan operation appears to provide little improvement in thermal comfort performance.
22
23
24
25
26
27
10 15 20 25 30 35
Indoor Temperature -(°C)
Outdoor Temperature - (°C)
Continuous - 1st Flr Continuous - 2nd FlrCyclical - 1st Flr Cyclical - 2nd FlrTrend TrendTrend Trend
Figure 21. Average Hourly Space Temperatures, Fancoil, High-Stage Cooling, 500 L/s, High Sidewall Supply Air Outlets, Cyclical vs. Continuous Fan Control, Whole-House Average Thermostat Location The whole-house data in Figure can be directly compared to the cyclical fan control data in Figure . This comparison reveals that first-floor temperatures are scattered over a much wider range during low-stage operation than for high-stage operation. It also indicates that first-floor temperatures tend to decrease as outdoor temperatures increase. Comparison to using a single-point thermostat control located on the first floor indicates that this can help improve thermal comfort on the first floor while maintain equal comfort control on the second floor.
1920212223242526272829
5 10 15 20 25 30 35
Indo
or T
empe
ratu
re -
(°C
)
Outdoor Temperature - (°C)
Single-point - 1st Flr Single-point - 2nd FlrAverage - 1st Flr Average - 2nd FlrTrend TrendTrend Trend
Figure 22. Average Hourly Space Temperatures, Fancoil, Low-Stage Cooling, 311 L/s, High Sidewall Supply Air Outlets, Single-Point vs. Whole-House Average Thermostat Control
Conclusions High sidewall supply air outlets provide slightly better thermal comfort performance than a system incorporating floor diffusers for both heating and cooling operation. This is due to the reduced head-to-toe temperature stratification and more uniform room-to-room temperatures achieved by the high sidewall system. While ASHRAE thermal comfort criteria were met more than 98% of the time for all stages of both heating systems, the performance of the floor diffuser system was noticeably worse at extremely cold outdoor temperatures. High stage cooling performance for both systems met the thermal comfort criteria approximately 95% of the time, while low stage operation only met the criteria only 82% of the time. Although head-to-toe temperature stratification is noticeably better (lower) in the high sidewall system, stratification for both systems is well within the acceptable ASHRAE limit of 3.0°C. Additional fan operation proved to help maintain better (lower) levels of head-to-toe temperature stratification for the high stage heating modes of both systems, as well as the medium stage heating of the high sidewall system. Additional fan operation made virtually no difference in either system in low stage heating. The low stage cooling performance of the floor diffuser system resulted in slightly worse (higher) levels of stratification—especially as outdoor air temperatures increased, but again, stratification for both systems was well within acceptable limits. Continuous fan operation during the high stage cooling mode of the high sidewall system was found to provide only slightly better whole-house temperature uniformity than cyclical thermostatic control. The impact of thermostat “location” on whole-house thermal comfort was also evaluated. An average of multiple sensor locations was compared to a conventional single-point thermostat location. As expected, the whole-house average approach resulted in better temperature uniformity throughout the house for both systems, both modes, and all stages. For brievity, not all results were shown. Acknowledgments IBACOS wishes to acknowledge the U.S. DOE Building America program, the National Renewable Energy Laboratory (NREL), the Cardinal Glass Corporation, and Carrier Corporation for funding, technical assistance, facilities, and equipment that made this research possible. Bibliography
ACCA. 1995. Manual D, Residential Duct Systems. Arlington, VA: Air Conditioning Contractors of America. ASHRAE. 1990. ANSI/ASHRAE Standard 113-1990, Method of Testing for Room Air Diffusion. Atlanta: American Society of Heating, Refrigerating and Air-Conditioning Engineers, Inc. ASHRAE. 2004. ASHRAE Standard 55-2005, Thermal Environmental Conditions for Human Occupancy. Atlanta: American Society of Heating, Refrigerating and Air Conditioning Engineers, Inc.
ISO 7730:1994. Moderate Thermal Environments - Determination of the PMV and PPD Indices and Specification of the Conditions for Thermal Comfort.