thermal and mass spectral characterization of novel azo dyes of p
TRANSCRIPT

1 23
Journal of Thermal Analysis andCalorimetryAn International Forum for ThermalStudies ISSN 1388-6150Volume 107Number 2 J Therm Anal Calorim (2012)107:763-776DOI 10.1007/s10973-011-1515-8
Thermal and mass spectralcharacterization of novel azo dyes of p-acetoamidophenol in comparison withHammett substituent effects and molecularorbital calculationsM. A. Zayed, Gehad G. Mohamed &M. A. Fahmey

1 23
Your article is protected by copyright and
all rights are held exclusively by Akadémiai
Kiadó, Budapest, Hungary. This e-offprint is
for personal use only and shall not be self-
archived in electronic repositories. If you
wish to self-archive your work, please use the
accepted author’s version for posting to your
own website or your institution’s repository.
You may further deposit the accepted author’s
version on a funder’s repository at a funder’s
request, provided it is not made publicly
available until 12 months after publication.

Thermal and mass spectral characterization of novel azo dyesof p-acetoamidophenol in comparison with Hammettsubstituent effects and molecular orbital calculations
M. A. Zayed • Gehad G. Mohamed •
M. A. Fahmey
Received: 25 January 2011 / Accepted: 17 March 2011 / Published online: 11 April 2011
� Akademiai Kiado, Budapest, Hungary 2011
Abstract Four novel azo compounds were synthesized:
o-phenylazo-(C14H13N3O2) (I), p-bromo-o-phenylazo-(C14H13
BrN3O2) (II), p-methoxy-o-phenylazo-(C15H16N3O3) (III),
and p-nitro-o-phenylazo-p-acetamidophenol (C14H13N4O4)
(IV). These compounds were carefully investigated using
elemental analyses, IR, and thermal analyses (TA) in
comparison with electron ionization (EI) mass spectral
(MS) fragmentation at 70 eV. Semi-empirical MO calcu-
lation, PM3 procedure, has been carried out on the four azo
dyes (I–IV), both as neutral molecules and the corre-
sponding positively charged molecular ions. These inclu-
ded molecular geometries (bond length, bond order, and
charge distribution, heats of formation, and ionization
energies). The mass spectral fragmentation pathways and
thermal decomposition mechanisms were reported and
interpreted on the basis of molecular orbital (MO) calcu-
lations. They are found to be highly correlated to each
other. Also, the Hammett’s effects of p-methoxy, p-bromo,
and p-nitro-substituents of phenyl azo groups on the ther-
mal stability of these dyes (I–IV) are studied by experi-
mental (TA and MS) in comparison with MO calculations,
and the data obtained are discussed. This research aimed
chiefly to throw more light on the structures of the four
prepared azo derivatives of acetoamidophenol (p-cetamol).
The data refering to the thermal stability of these dyes can
be used in industry for effective dyeing purposes under
different thermal conditions.
Keywords Acetamidophenol azodyes � Hammett effect �FT-IR � Mass spectrometry � Thermal analyses �MO-calculations
Introduction
Azo dyes are the most versatile class of dyes [1], and
thermal analysis plays an important role in studying their
structures [2]. The applicability of the dyes for special uses
and determining thermal stabilities of them are also very
important [2]. The resistance to heat at elevated tempera-
tures is one of the main properties required from dyes used
in high temperature processes such as dyeing, printing, and
photo-copying and in high technology areas such as lasers,
electro-optical devices etc. [3]. Most of the previous
studies on the physical and chemical properties studies of
mono-azo dyes were carried out in solution. Very few
studies in the literature have reported showing the rela-
tionship between thermal stabilities and structures of azo
dyes [4]. The research available in the literature reporting
on azo dyes containing sterically hindered groups such as
tert-butyl, sec-butyl, and isopropyl is also scarce [5]. Only
the thermal behavior of some azo dyes containing sterically
hindered and water-soluble group have been previously
reported [6].
Mass spectrometry plays pivotal role in the structural
characterization of organic molecules [7]. The technique is
important because it provides a lot of structural information
of the sample with a low cost. Also, this technique offers
comparative advantages in terms of speed and productivity
for organic analysis [8]. On the other hand, thermal anal-
ysis technique delivers extremely sensitive measurements
of heat change which can be applied on a broad scale with
M. A. Zayed (&) � G. G. Mohamed
Chemistry Department, Faculty of Science, Cairo University,
Giza 12613, Egypt
e-mail: [email protected]
M. A. Fahmey
Nuclear Physics Department, N.R.C., Atomic Energy Authority,
Cairo 13759, Egypt
123
J Therm Anal Calorim (2012) 107:763–776
DOI 10.1007/s10973-011-1515-8
Author's personal copy

organic development. These methods provide unique
information related to thermodynamic data of the system
studied [9]. The increasing use of these techniques com-
bined with TA will be able to provide more specific
information, and thus facilitate more rapid interpretation of
the obtained curves [9].
In electron ionization (EI) mass spectrometry, the
fragmentation consists of competitive and consecutive uni-
molecular fragmentation [10]. The fragmentation of ion-
ized molecule depends mainly on its internal energy [11].
The thermo-gravimetric TG/DTG analysis was used for
providing quantitative information on weight losses due to
decomposition and/or evaporation of low molecular mate-
rials as a function of time and temperature. In conjunction
with mass spectrometric analysis [12–19], the nature of the
released volatilized material may be deduced, thus greatly
facilitating the interpretation of thermal stability and/or
degradation processes. On the other hand, computational
quantum chemistry provides additional information about
the atoms and bonds, which can be used successfully in an
interpretation of experimental results [20]. This helps in the
description and prediction of primary fragmentation site of
cleavage and subsequent one [16–19].
The aim of this study is to carry out experimental and
theoretical investigation of the four azo compounds of the
biologically active p-cetamol drug using thermal analyses
(TA) measurements and EI mass spectral (MS) fragmen-
tation at 70 eV. Also, molecular orbital (MO) calculations
are performed using PM3 procedure, on the neutral mole-
cule and charged molecular ion to investigate bond length,
bond order, heats of formation, ionization energy, and
charge distribution. These calculations are correlated with
the experimental results (TA and MS) to obtain indication
about the stability of the studied compounds and prediction
of the site of primary fragmentation step and subsequent
ones. Also, the results of the analyses are used to discuss
the effect of Hammet values of substituents on experi-
mental and computational results.
Experimental
Preparation of the p-acetoamidophenol-azodyes (I–IV)
and characterization
The p-acetoamidophenol-derivatives (I–IV) were prepared
by coupling p-acetoamidophenol with phenyl, bromo-,
methoxy-, and nitro diazonium chloride, in an ice bath, in
the presence of sodium hydroxide [20]. The precipitates
were left in refrigerator overnight, filtered and crystallized
from acetic acid (yield 86–89%). Their elemental analy-
ses (for C, H, and N) were performed in Microana-
lytical Center, Cairo University. Their structures were
investigated by elemental analyses, IR, electron ionization
mass spectra (EI-MS), and Thermal analyses (TGA, DTG,
and DTA).
Elemental analyses, FT-IR, EI-MS, and thermal
analyses
Elemental microanalyses of the separated solid dyes for C,
H, N, and S were performed in the Microanalytical Center,
Cairo University, using CHNS-932 (LECO) Vario Ele-
mental Analyzers. Infrared spectra were recorded on a
Perkin-Elmer FT-IR type 1650 spectrophotometer in the
wave number region of 4000–400 cm-1. The spectra were
recorded as KBr pellets.
The EI-MS of the studied dyes (I–IV) were obtained
using Shimadzu GC-MS-Qp 1000 PX quadruple mass
spectrometer with electron multiplier detector equipped
with GC-MS data system. EI-MS were obtained at ionizing
energy value of 70 eV, ionization current of 60 lA, and in
vacuum better than 10-6 torr.
The thermal analyses of the studied dyes (I–IV) were
made using conventional thermal analyzer (Shimadzu
system of DTA-50 and 30 series TGA-50). The mass losses
of 5 mg sample and heat reopens of the change of the
sample were measured from room temperature up to
500 �C. The heating rate, in an inert argon atmosphere, was
10 �C min-1. These instruments were calibrated using
indium metal as a thermal stable material. The reproduc-
ibility of the instrument reading was determined by
repeating each experiment more than twice.
Molecular orbital calculations
The MO-calculations were performed using the parametric
method (PM3) described by Stewart [21]. The default cri-
teria for terminating all optimizations were increased by a
factor of 100 (keyword PRECISE). Vibrational frequencies
were computed for the studied structures (keyword
FORCE) so as to check whether the newly designed
geometries are local minima. All the MO calculations were
carried out at the restricted Hartree–Fock level (RHF) for
the neutral molecular compounds (used in TA); while the
unrestricted Hartree–Fock level (UHF) were carried out for
there positively charged ions (utilized in MS) using PM-3
method followed by full optimization of all geometrical
variables (bond lengths, bond angles, and dihedral angles),
without any symmetry constraint. All structures were
optimized to a gradient normalization of 0.01–0.05, using
the eigenvector following (EF) routine [22]. All the semi-
empirical MO calculations were performed with the
MOPAC2000 software package [23] implemented on an
Intel Pentium IV 3.0 GHz computer.
764 M. A. Zayed et al.
123
Author's personal copy

Results and discussion
Structure elucidation of prepared dyes by elemental
analyses and FT-IR
The elemental analyses of the prepared dyes referred to the
general formulae of o-phenylazo-(C14H13N3O2) (I) (Found
C = 57.98%, H = 4.35%, and N = 7.54%, and Calcd.
C = 66.14%, H = 4.72%, and N = 16.53%), p-bromo-o-
phenylazo-(C14H13BrN3O2) (II) (Found C = 42.2%, H =
2.95%, Br = %, and N = 7.53%, and Calcd C = 50.31%,
H = 3.89%, Br = 23.92%, and N = 12.57%), p-methoxy-
o-phenylazo-(C15H16N3O3) (III) (Found C = 60.30%,
H = 5.29%, and N = 7.05%, and Calcd. C = 63.15%,
H = 5.61%, and N = 14.73%) and p-nitro-o-phenylazo-p-
acetoamidophenol (C14H13N4O4) (IV) (Found C =
54.34%, H = 3.89%, and N = 14.05%, and Calcd. C =
56.00%, H = 4.33%, and N = 18.66%) compounds,
respectively. The given structural formulae of these dyes
are confirmed by FT-IR (Table 1).
OH
N
COHN CH3
N X
X = H, Br, O-CH3, and NO2
For dyes I-IV
Structural formulae of dyes I–IV
The data (Table 1) refer to assignment of main bands of
the active groups in the moiety of these dyes, such as
510–618, 1173–1310, 1419–1595, 1657, 3028–3056, and
3284–3560 cm-1 for mC–N amide, C–O amide, mCH3
amide, mN=N azo, mCO amide, mOH phenolic, and mNH
amide in dye I, respectively. The positions of these bands
are varied from one dye to another because of the variation
of donating power effect of p-substituents of phenyl azo
group. Extra bands appeared at 515–585 cm-1 for mC–Br
TG%
100.00
100.00 200.00 300.00 400.00 500.00
mass loss
mass loss
mass loss
mass loss
–0.035 mg
–0.357 mg
–0.239 mg
–0.233 mg–14.113%
–14.476%
–21.623%
–2.120%
50.00
0.00
0.00
100.00 200.00 300.00 400.00 500.00
–5.00
–10.00
Temperature/°C
Temperature/°C
DTA
0.52uV
66.44C
0.98uV
132.50C–0.88uV
305.27C
uV
a
b
Fig. 1 a TG of dye I, (b) DTA
of dye I
Thermal and mass spectral characterization of novel azo dyes 765
123
Author's personal copy

in case of dye II, and at 1560–1490 and 1360–1310 cm-1
of mNO2 in case of dye IV.
Knowledge of thermal decomposition mechanism of the
dye is very important to understand the chemical processes.
It is difficult to establish the exact major fragmentation
pathway in EI using conventional MS. However, combi-
nation of the experimental techniques (TA and MS) and
MO calculation is very important to understand the fol-
lowing topics:
1. Primary site fragmentation process and its major
fragmentation pathway in both techniques.
2. Stability of the studied compounds as neutral mole-
cules in solid-state phase and molecular ions in gas
phase.
3. Selection of the most probable decomposition path-
ways in vitro system using both TA and MS.
4. Substituent effect of p-methoxy, p-bromo, and p-nitro
o-phenylazo groups on experimental and computa-
tional results.
Thermal decomposition interpretation
The description of thermal decomposition of azo dyes (I–
IV) under investigation is given in Table 2 and Figs. 1, 2,
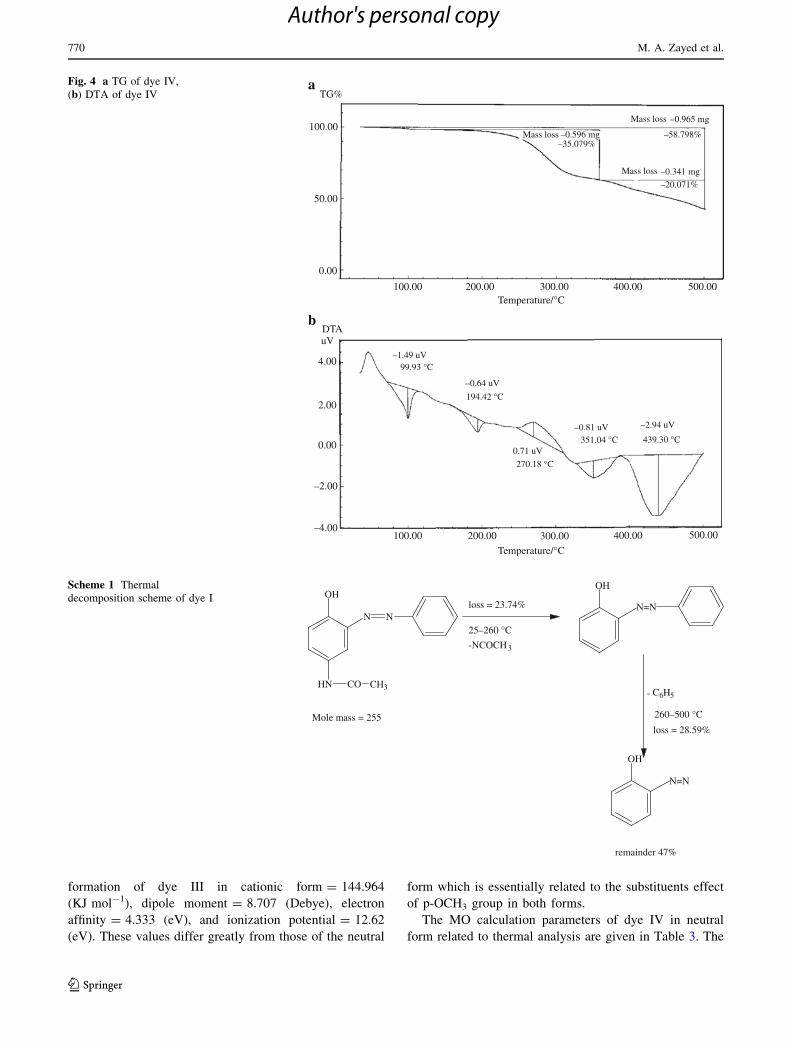
3, 4. From the data obtained for dye I (Fig. 1), it is clear
that o-phenylazo-p-actamidophenol (I) decomposed in two
main steps, the first step (at 25–260 �C) is due to the loss of
NOCH3 group (Pract. % = 23.7, Calcd. = 23.35%), the
second step (at 260–500 �C) is due to the loss of C6H5
radical (Pract. = 29.59% and Calcd. = 30.20%). The
remaining part containing azo group is present up to tem-
perature more than 500 �C. These losses appeared in DTG
(Fig. 1a) at 275 and 377 �C. The DTA (Fig. 1c) data in
respect of several exo- and endothermic peaks may be
assigned to a series of physical and chemical changes
(Scheme 1) occurring during thermal heating of the dye (I).
The dye II TG, DTG, and DTA (Table 2; Fig. 2) show two
steps (Fig. 2a): the first at temperature ranges 25–300 �C,
and the second at 300–500 �C with practical mass losses of
27.17% (Calcd. = 28.0%) and Pract. = 18.02% (Calcd. =
17.91%), respectively. These mass losses are observed as
two peaks in DTG (Fig. 2b) at 282.9 and 448.3 �C and in
DTA (Fig. 2c) as endothermic peaks at 282.1 and
242.45 �C, respectively. The remainder part still keeps the
azo group up to temperature [500 �C.
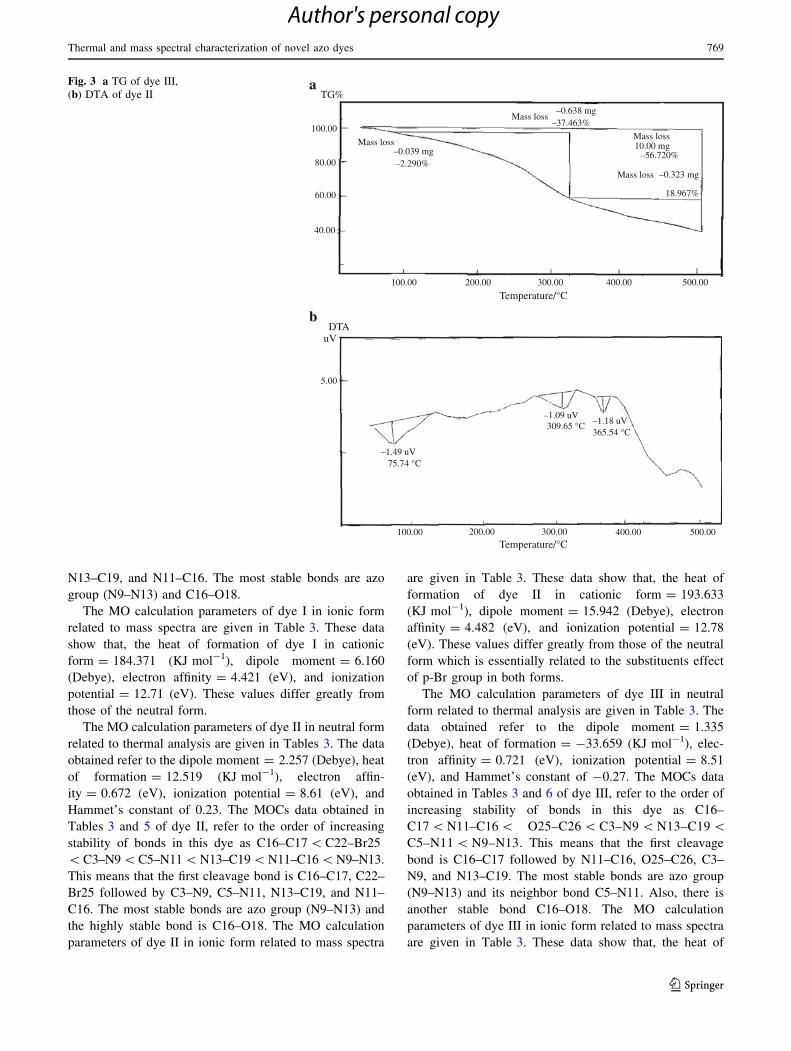
The dye III TG (Fig. 3a), DTG (Fig. 3b), and DTA
(Fig. 3c) refer to the thermal decomposition of this dye in
two steps. The first occurs at 25–310 �C due to the loss
p-methoxyphenyl radical (Pract. Loss = 37.46% and
Calcd. = 37.76%) and the second one occurs at 310–
500 �C due to the loss of CO ? N2 gases (Pract
loss = 20.95% and Calcd. = 20.0%). These losses appear
at 274.16 and 475.55 �C in DTG (Fig. 3b) and at 265.54
and 455.95 �C in DTA (Fig. 3c) as endothermic peaks,
respectively. The appearance of some endo- and exother-
mic peaks may be attributed to weight losses and chemical
recombination to give the gases in the second step. This
means that azo group of this compound decomposed at
temperature range 300–500 �C.
The TG/DTA the dye IV (Fig. 4) were displayed within
the temperature range 25–500 �C. It is clear from the
thermal survey of this compound, that it has two main steps
of mass losses in TGA (Fig. 4a). The first one appeared at
the temperature range 25–360 �C with practical mass loss
% = 35.08. This loss may be attributed to the decompo-
sition of NO2 as a gaseous molecule together with an acetic
acid molecule (Calcd. = 35.21%). The second mass loss
appeared at the temperature range 360–500 �C with mass
loss % = 25.07. The second loss may be attributed to the
decomposition of C6H5 radical (Calcd. Loss = 25.24%).
These mass losses observed at two main peaks in DTG at
287.83 and 387.0 �C (Fig. 4b) and confirmed by the
appearance of a series of exothermic and endothermic
Table 1 The FT-IR spectral data description of p-acetoamidophenol
azo derivatives/I–IV
Compound Wave number/cm-1 Description
I 510–618 dC–N amid, C–O amid
1173–1310 mCH3 amide
1419–1595 mN=N azo
1657 mCO amide
3028–3056 mOH phenolic
3284–3560 mNH amide
II 515–585 mC–Br, mC–O amid
1007–1068 mCH3 amide
1420–1664 mN=N
1663 mCO amide
3087 mOH phenolic
3284–3684 mNH amide
III 511–585 dC–N amide, mC–O
1105–1203 mCH3 amide
1426–1666 mN=N
1666 mCO amide
3108 mOH phenolic
3321–3648 mNH amide
IV 522–640 mC–O amid, mN–O
1490–1560, 1310–1360 mNO2, dNO2
1176–1293 mCH3 amide
1660 mCO amide
1439–1660 mN=N
2835–3069 mOH phenolic
3291–3600 mNH amide
I: o-phenylazo-pacetoamidophenol, II: p-bromo-o-phenylazo-p-acet-
oamidophenol, III: p-methoxy-o-phenylazo-p-acetoamidophenol, IV:
p-nitro-o-phenylazo-p-acetoamidophenol
766 M. A. Zayed et al.
123
Author's personal copy

peaks in DTA (Fig. 4c). The remainder part still keeps azo
group up to temperature [500 �C.
Therefore, it is generally concluded that thermal sta-
bility of these azodyes as a function of starting decompo-
sition temperature and remaining of azo group till high
temperature range; may be ordered as: dye III \ dye
I \ dye II \ dye IV depending on the Hammett’s substit-
uents values of -0.27, 0.01, 0.23 and 0.78, respectively
(Table 3).
Mass spectral fragmentation and Hammett’s
substituents effects
The EI-MS of the four dyes (I–IV) at 70 eV are represented
in Figs. 5, 6, 7, 8. The signal appeared in the mass spectra
of dyes I, II, III, and IV at m/z = 255, 333, 286, and 300
are due to the formation of molecular ions, (C14H13N3O2?,
RI = 25%), (C14H13N3O2Br?, RI = 23.8%), (C15H16
N3O3?, RI = 20%), and (C14H13N4O4
?, RI = 15.3%) for
these dyes, respectively. The appearance of these molecu-
lar ions confirms their proposed general formula and agrees
well with their elemental analyses. In case of dye I (Fig. 5)
mass spectra refer to the appearance of mole fragments in
three pathways. The signals appeared at m/z = 58 (RI =
50%) due to fragment ion COOCH2, 77 (RI = 100%, base
peak) due to fragment ion C6H5?, the fragment ions
containing azo group appeared at m/z = 105 (RI = 60%)
due to C6H6–N2?, and at 165 (RI = 60%) due to CH3CO–
C6H4 (OH)–N = NH. The appearance of the fragment ions
containing azo group of high RI of 60% refer to the sta-
bility of azo dye I even at high energy ionization source of
70 eV. In case of dye II (Fig. 6), its mass spectrum shows
fragmentation of this dye in three parallel pathways. It
shows in path I, fragment ions at m/z = 253 (RI = 1%)
after the loss of HBr from the molecular ion; at m/z = 211
(RI = 16%) due fragment ion containing azo group; at
m/z = 291 (RI = 29.8%) in path containing also azo group;
and at m/z = 150 (RI = 100% base peak) containing no azo
group. The low RI values of fragment ions containing azo
group may refer to the low stability of p-bromoazodye II on
its ionization with the high energy electron beam of 70 eV.
In case of p-methoxy azo dye III its mass fragmentation
occurs in three pathways which are given by Fig. 7. It
shows three fragment ions containing azo group of m/
z = 245 (RI = 30%) and m/z = 105 (RI = 23%), and m/
z = 226 (25%). The middle values of RI % of these frag-
ment ions containing azo group may refer to the middle
stability of p-methoxyazo dye III. It is finally decomposed
to give the fragment ion of m/z = 151 (RI = 60%) of
p-acetoamidophenol parent compound and m/z = 77
(RI = 100%) as a base peak of C6H5? stable fragment ion.
The EI-MS of p-nitroazodye IV are represented in Fig. 8. It
Table 2 Thermal analyses description of acetoamidophenol-azodyes/I-IV
Compound and
mole mass
TG temperature
range/oC
DTG peak
temperature/oC
Wt loss Found
%/Calcd.%
Wt loss
description
DTA
temperature
range/oC
DTA peak
temperature/oC
DTA
description
Dye I, 254 100–260 42.39 23.74/22.44 –NCOCH3 40–70 66.44 Broad exo peak
260–360 162.6 80–140 132.5 Broad exo peak
360–480 275.1 260–320 305.2 Endo therm. peak
377 28.59/29.92 –C6H4 380–460 440.4 Exo therm. peak
Dye II, 333.9 25–90 36.8 27.12/28.42 HBr ? 1/2 N2 25–70 40.16 Endo therm. peak
90–290 282.9 70–120 93.55 Endo therm. Peak
290–500 448.3 18.18/17.96 –CH3COOH 140–180 183.18 Endo therm. Peak
205–265 242.45 Endo therm. Peak
Dye III, 285 25–90 73.21 37.46/37.89 –C6H5OCH3 25–140 75.74 Endo therm. peak
90–320 274.16 280–330 309.65 Endo therm. Peak
320–500 475.55 20.95/19.64 –CO ? N2 360–380 365.54 Sharp endo peak
420–480 455.95 Endo therm. peak
Dye IV, 300 25–350 95.29 35.08/35.33 –NO2 ? CH3COOH 60–100 99.93 Sharp endo peak
350–500 287.83 160–200 194.42 Sharp endo peak
387.07 240–300 270.18 Sharp exo peak
475.50 25.07/24.66 –C6H4 320–380 351.04 Sharp endo peak
380–500 439.90 Broad endo peak
I: o-phenylazo-p-acetoamidophenol, II: p-bromo-o-phenylazo-p-acetoamidophenol, III: p-methoxy-o-phenylazo-p-acetamidophenol, IV: p-nitro-
o-phenylazo-p-acetoamidophenol
Thermal and mass spectral characterization of novel azo dyes 767
123
Author's personal copy

shows three fragment ions containing azo groups. These are
at m/z = 254 (RI = 1%), at m/z = 212 (RI = 28%), and at
m/z = 258 (RI = 12.5%). The last one fragment ion is the
only one containing p-nitro-azogroup. The lower RI% val-
ues may refer to the instability of p-nitro-azodye IV in a
similar way like p-bromoazodye II. This means that the
electron withdrawing substituents are weakening the azo-
dye stability. Therefore, the stability of these dye during
ionization with 70 eV electron beam may be ordered as dye
I [ dye III [ dye II [ dye IV. This agrees well with the
Hammett’s values in relation to some MOCs parameters
such as heat of formation, dipole-moment, electron affinity,
and ionization potential (Table 3).
MO calculations and Hammett’s substitution effects
The MO calculations give valuable information about the
structure and the reactivity of a molecule and its molecular
ions. Computational data can be used to support the
experimental data. The much import parameters calculated
using MO calculation are geometries, bond order, bond
strain, charge distribution, heat of formation and ionization
energy.
Investigation of the molecular structure of dyes I–IV is
of interest in this study aiming to help in the illumination of
experimental data (i.e., prediction of the weakest bond
cleavage and the stability of the neutral molecule as well as
molecular ion).
Figure 9 shows the numbering system of four dyes
skeleton that helps in ordering the calculated bond order
and charge distribution (different atoms) of both neutral
and charged species. The calculated geometrical parame-
ters are shown in Tables 3, 4, 5, 6, 7. The values of com-
puted ionization energies, heats of formation dipole
moment values in comparison with Hammet’s constant
values are given in Table 4.
The molecular orbital calculation parameters of dye I in
neutral form related to thermal analysis are given in
Tables 3 and 4. The data obtained in Table 3 refer to the
dipole moment = 2.435 (Debye), heat of forma-
tion = 4.683 (KJ mol-1), electron affinity = 0.43 (eV),
ionization potential = 8.53 (eV), and Hammet’s constant
of 0.01. The data obtained in Table 4 refer to the order of
increasing stability of bonds as C16–C17 \ C3–N9 \ C5–
N11 \ N11–C16 \ N13–C19 \ N9–N13. This means that
the first cleavage bond is C16–C17 followed by C3–N9,
TG%a
bDTA
uV
100.00
50.00
0.00
0.00
–5.00
–10.00
0.00 100.00 200.00 300.00 400.00 500.00
Mass loss
Mass loss
Mass loss
–0.441 mg
–3.77 uV443.10 °C
–0.319–18.177%
–25.128%
–0.036 mg–1.994%
Temperature/°C
0.00 100.00 200.00 300.00 400.00 500.00
Temperature/°C
Fig. 2 a TG of dye II, (b) DTA
of dye II
768 M. A. Zayed et al.
123
Author's personal copy
N13–C19, and N11–C16. The most stable bonds are azo
group (N9–N13) and C16–O18.
The MO calculation parameters of dye I in ionic form
related to mass spectra are given in Table 3. These data
show that, the heat of formation of dye I in cationic
form = 184.371 (KJ mol-1), dipole moment = 6.160
(Debye), electron affinity = 4.421 (eV), and ionization
potential = 12.71 (eV). These values differ greatly from
those of the neutral form.
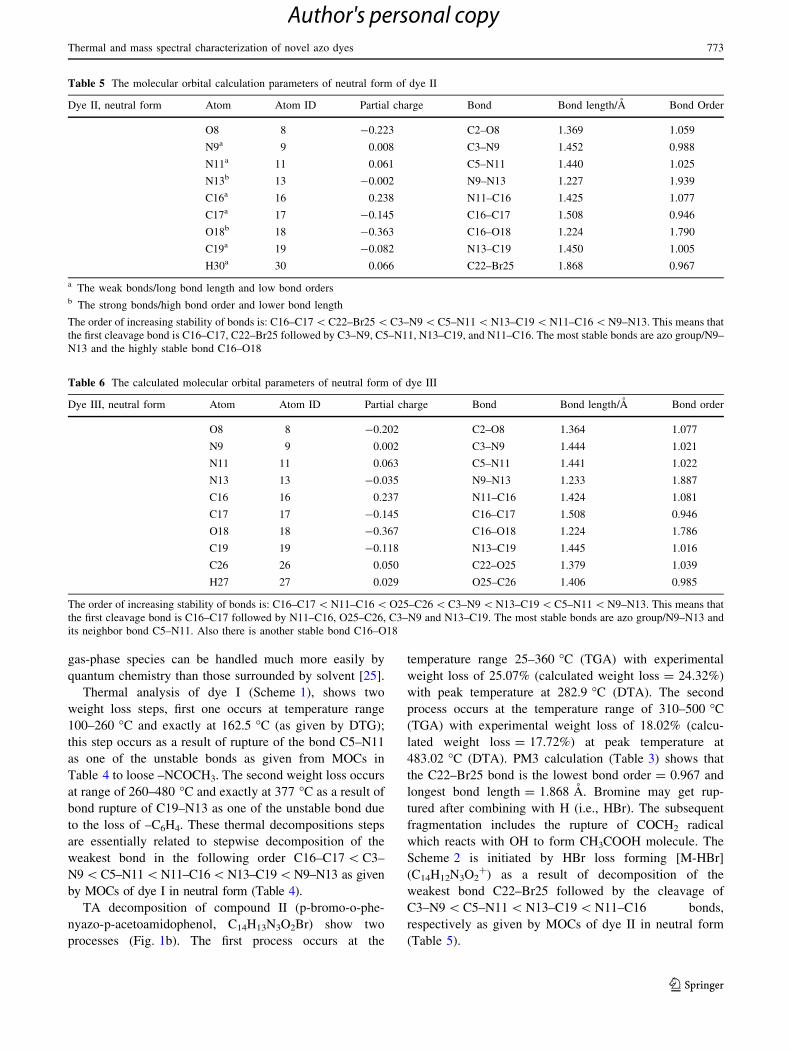
The MO calculation parameters of dye II in neutral form
related to thermal analysis are given in Tables 3. The data
obtained refer to the dipole moment = 2.257 (Debye), heat
of formation = 12.519 (KJ mol-1), electron affin-
ity = 0.672 (eV), ionization potential = 8.61 (eV), and
Hammet’s constant of 0.23. The MOCs data obtained in
Tables 3 and 5 of dye II, refer to the order of increasing
stability of bonds in this dye as C16–C17 \ C22–Br25
\ C3–N9 \ C5–N11 \ N13–C19\ N11–C16 \ N9–N13.
This means that the first cleavage bond is C16–C17, C22–
Br25 followed by C3–N9, C5–N11, N13–C19, and N11–
C16. The most stable bonds are azo group (N9–N13) and
the highly stable bond is C16–O18. The MO calculation
parameters of dye II in ionic form related to mass spectra
are given in Table 3. These data show that, the heat of
formation of dye II in cationic form = 193.633
(KJ mol-1), dipole moment = 15.942 (Debye), electron
affinity = 4.482 (eV), and ionization potential = 12.78
(eV). These values differ greatly from those of the neutral
form which is essentially related to the substituents effect
of p-Br group in both forms.
The MO calculation parameters of dye III in neutral
form related to thermal analysis are given in Table 3. The
data obtained refer to the dipole moment = 1.335
(Debye), heat of formation = -33.659 (KJ mol-1), elec-
tron affinity = 0.721 (eV), ionization potential = 8.51
(eV), and Hammet’s constant of -0.27. The MOCs data
obtained in Tables 3 and 6 of dye III, refer to the order of
increasing stability of bonds in this dye as C16–
C17 \ N11–C16 \ O25–C26 \ C3–N9 \ N13–C19 \C5–N11 \ N9–N13. This means that the first cleavage
bond is C16–C17 followed by N11–C16, O25–C26, C3–
N9, and N13–C19. The most stable bonds are azo group
(N9–N13) and its neighbor bond C5–N11. Also, there is
another stable bond C16–O18. The MO calculation
parameters of dye III in ionic form related to mass spectra
are given in Table 3. These data show that, the heat of
TG%
DTAuV
100.00
Mass loss
Mass loss
Mass loss
Mass loss
–0.638 mg
10.00 mg–56.720%
–0.323 mg
–1.49 uV
–1.09 uV–1.18 uV
75.74 °C
309.65 °C365.54 °C
18.967%
–37.463%
–0.039 mg–2.290%80.00
60.00
40.00
5.00
100.00 200.00 300.00 400.00 500.00
100.00 200.00 300.00 400.00 500.00
a
b
Temperature/°C
Temperature/°C
Fig. 3 a TG of dye III,
(b) DTA of dye II
Thermal and mass spectral characterization of novel azo dyes 769
123
Author's personal copy
formation of dye III in cationic form = 144.964
(KJ mol-1), dipole moment = 8.707 (Debye), electron
affinity = 4.333 (eV), and ionization potential = 12.62
(eV). These values differ greatly from those of the neutral
form which is essentially related to the substituents effect
of p-OCH3 group in both forms.
The MO calculation parameters of dye IV in neutral
form related to thermal analysis are given in Table 3. The
N N
OH
HN CO CH3
loss = 23.74%
25–260 °C
-NCOCH3
OH
N=N
C6H5-
260–500 °C
loss = 28.59%
OH
N=N
remainder 47%
Mole mass = 255
Scheme 1 Thermal
decomposition scheme of dye I
TG%
DTAuV
4.00
2.00
0.00
–2.00
–4.00
100.00
50.00
0.00
100.00 200.00 300.00 400.00 500.00
100.00 200.00 300.00 400.00 500.00
Mass loss
Mass loss
–1.49 uV99.93 °C
194.42 °C
351.04 °C
270.18 °C
439.30 °C
–0.64 uV
–0.81 uV
0.71 uV
–2.94 uV
Mass loss
–0.965 mg
–58.798%
–0.341 mg
–20.071%
–0.596 mg–35.079%
a
b
Temperature/°C
Temperature/°C
Fig. 4 a TG of dye IV,
(b) DTA of dye IV
770 M. A. Zayed et al.
123
Author's personal copy

data obtained refer to the dipole moment = 6.094 (Debye),
heat of formation = -4.497 (KJ mol-1), electron affin-
ity = 1.608 (eV), ionization potential = 9.04 (eV), and
Hammet’s constant of 0.78. The MOCs data obtained
in Tables 3 and 7 of dye IV, refer to the order of increas-
ing stability of bonds in this dye as C22–N25 \ N11–
Table 3 Thermal decomposition DTG temperatures of dyes I–IV neutral molecules in comparison with molecular orbital calculations
parameters
The dye no.
and state
Heat of formationb/
kJ mol-1Dipole moment/
DebyebElectron
affinity/eVbIonization
potential/eVbDTG temperature
of mass loss/oC
Hammett’sa
constant values
I, p–H
a-Neutral state 4.683 2.435 0.433 8.53 275.12, 0.01
377.0
b- cationic state 184.371 6.160 4.421 12.71
II, p-Br
a-Neutral state 12.519 2.257 0.672 8.61 282.93, 0.23
483.03
b-Cationic state 193.633 15.942 4.482 12.78
III, p-OCH3
a- Neutral state -33.659 1.335 0.721 8.51 274.16, -0.27
475.55
b-Cationic state 144.964 8.707 4.333 12.62
IV, p-NO2
a-Neutral state -4.497 6.094 1.608 9.04 277.83, 0.78
490.0
b-Cationic state 181.990 17.920 4.705 13.03
a Reference [20]b Molecular Orbital Calculation data using PM3 program
RI%100%
75%
50%
25%
0.00
50
5758
77 92105
150
128166
167,168
228 255
100 150m/z
200 250
Fig. 5 EI-MS of dye I
RI%100%
75%
50%
25%
0.00%
100%
75%
50%
25%
0.00%
220 240 260 280 300 320 340
50
52
245
65 7780 91 105
134150
162183
70 90 110 130 150 170 190
m/z
*4
291
333
Fig. 6 EI-MS of dye II
Thermal and mass spectral characterization of novel azo dyes 771
123
Author's personal copy

C16 \ C16–C17 \ C3–N9 \ N13–C19 \ N9–N13. This
means that the first cleavage bond is C22–N25 followed by
N11–C16, C16–C17, C3–N9, and N13–C19. The most
stable bonds are azo group (N9–N13) and its neighbor bond
C5–N11. Also there are other stable bonds C16–O18, N25–
O38, and N25–O37 of nitro group. The MO calculation
parameters of dye IV in ionic form related to mass spectra
are given in Table 3. These data show that, the heat of
formation of dye IV in cationic form = 181.990
(KJ mol-1), dipole moment = 17.920 (Debye), electron
affinity = 4.705 (eV), and ionization potential = 13.03
(eV). These values differ greatly from those of the neutral
form which is essentially related to the substituents effect
of p-NO2 group in both forms.
Comparison between TA and MO-calculations
The scope of this investigation is restricted to a search or
prediction and discerns features of initial bond ruptures
during the course of fragmentation of dyes (I–IV) mole-
cules. Empirical observations indicate that the course of
subsequent fragmentation is determined to large extent by
the initial bond ruptures of the molecular ion in MS [24]. It
is quite reasonable to say that the computational quantum
chemistry can provide additional data which can be used
successfully to interpret both TA and MS experimental
results. These theoretical data will, particularly, be
valuable for mass spectrometry scientists; in which the
RI%100%
75%
50%
25%
0.00%
51 7792
105109
128
151
167 168
185226 286
245166
50 70 90 110 130 150 170 190 210 230 250 270 290m/z
Fig. 7 EI-MS of dye III
100%
53 108
77
150 258 300
RI%
75%
50%
25%
0.00%
50 100 150 200 250 300 350m/z
Fig. 8 EI-MS of dye IV
14
8 36
1321
6
7
12
185
11
16
1530
32
31
24 35
22232019
934
1033
21
34
25
Fig. 9 Numbering system of dyes I–IV
Table 4 The molecular orbital calculation parameters of neutral form of dye I
Dye I neutral Atom Atom ID Partial charge Bond Bond length/A Bond order
O8 8 -0.222 C2–O8 1.369 1.059
N9 9 0.002 C3–N9 1.453 0.988
N11 11 0.062 C5–N11 1.440 1.025
N13 13 0.001 N9–N13 1.227 1.937
C16 16 0.237 N11–C16 1.425 1.079
C17 17 -0.145 C16–C17 1.508 0.946
O18 18 -0.364 C16–O18 1.224 1.789
C19 19 -0.089 N13–C19 1.449 1.006
The order of increasing stability of bonds is: C16–C17 \ C3–N9 \ C5–N11 \ N11–C16 \ N13–C19 \ N9–N13. This means that the first
cleavage bond is C16–C17 followed by C3–N9, N13–C19 and N11–C16. The most stable bonds are azo group (N9–N13) and C16–O18
772 M. A. Zayed et al.
123
Author's personal copy
gas-phase species can be handled much more easily by
quantum chemistry than those surrounded by solvent [25].
Thermal analysis of dye I (Scheme 1), shows two
weight loss steps, first one occurs at temperature range
100–260 �C and exactly at 162.5 �C (as given by DTG);
this step occurs as a result of rupture of the bond C5–N11
as one of the unstable bonds as given from MOCs in
Table 4 to loose –NCOCH3. The second weight loss occurs
at range of 260–480 �C and exactly at 377 �C as a result of
bond rupture of C19–N13 as one of the unstable bond due
to the loss of –C6H4. These thermal decompositions steps
are essentially related to stepwise decomposition of the
weakest bond in the following order C16–C17 \ C3–
N9\C5–N11\N11–C16\N13–C19\N9–N13 as given
by MOCs of dye I in neutral form (Table 4).
TA decomposition of compound II (p-bromo-o-phe-
nyazo-p-acetoamidophenol, C14H13N3O2Br) show two
processes (Fig. 1b). The first process occurs at the
temperature range 25–360 �C (TGA) with experimental
weight loss of 25.07% (calculated weight loss = 24.32%)
with peak temperature at 282.9 �C (DTA). The second
process occurs at the temperature range of 310–500 �C
(TGA) with experimental weight loss of 18.02% (calcu-
lated weight loss = 17.72%) at peak temperature at
483.02 �C (DTA). PM3 calculation (Table 3) shows that
the C22–Br25 bond is the lowest bond order = 0.967 and
longest bond length = 1.868 A. Bromine may get rup-
tured after combining with H (i.e., HBr). The subsequent
fragmentation includes the rupture of COCH2 radical
which reacts with OH to form CH3COOH molecule. The
Scheme 2 is initiated by HBr loss forming [M-HBr]
(C14H12N3O2?) as a result of decomposition of the
weakest bond C22–Br25 followed by the cleavage of
C3–N9 \ C5–N11 \ N13–C19 \ N11–C16 bonds,
respectively as given by MOCs of dye II in neutral form
(Table 5).
Table 5 The molecular orbital calculation parameters of neutral form of dye II
Dye II, neutral form Atom Atom ID Partial charge Bond Bond length/A Bond Order
O8 8 -0.223 C2–O8 1.369 1.059
N9a 9 0.008 C3–N9 1.452 0.988
N11a 11 0.061 C5–N11 1.440 1.025
N13b 13 -0.002 N9–N13 1.227 1.939
C16a 16 0.238 N11–C16 1.425 1.077
C17a 17 -0.145 C16–C17 1.508 0.946
O18b 18 -0.363 C16–O18 1.224 1.790
C19a 19 -0.082 N13–C19 1.450 1.005
H30a 30 0.066 C22–Br25 1.868 0.967
a The weak bonds/long bond length and low bond ordersb The strong bonds/high bond order and lower bond length
The order of increasing stability of bonds is: C16–C17 \ C22–Br25 \ C3–N9 \ C5–N11 \ N13–C19 \ N11–C16 \ N9–N13. This means that
the first cleavage bond is C16–C17, C22–Br25 followed by C3–N9, C5–N11, N13–C19, and N11–C16. The most stable bonds are azo group/N9–
N13 and the highly stable bond C16–O18
Table 6 The calculated molecular orbital parameters of neutral form of dye III
Dye III, neutral form Atom Atom ID Partial charge Bond Bond length/A Bond order
O8 8 -0.202 C2–O8 1.364 1.077
N9 9 0.002 C3–N9 1.444 1.021
N11 11 0.063 C5–N11 1.441 1.022
N13 13 -0.035 N9–N13 1.233 1.887
C16 16 0.237 N11–C16 1.424 1.081
C17 17 -0.145 C16–C17 1.508 0.946
O18 18 -0.367 C16–O18 1.224 1.786
C19 19 -0.118 N13–C19 1.445 1.016
C26 26 0.050 C22–O25 1.379 1.039
H27 27 0.029 O25–C26 1.406 0.985
The order of increasing stability of bonds is: C16–C17 \ N11–C16 \ O25–C26 \ C3–N9 \ N13–C19 \ C5–N11 \ N9–N13. This means that
the first cleavage bond is C16–C17 followed by N11–C16, O25–C26, C3–N9 and N13–C19. The most stable bonds are azo group/N9–N13 and
its neighbor bond C5–N11. Also there is another stable bond C16–O18
Thermal and mass spectral characterization of novel azo dyes 773
123
Author's personal copy
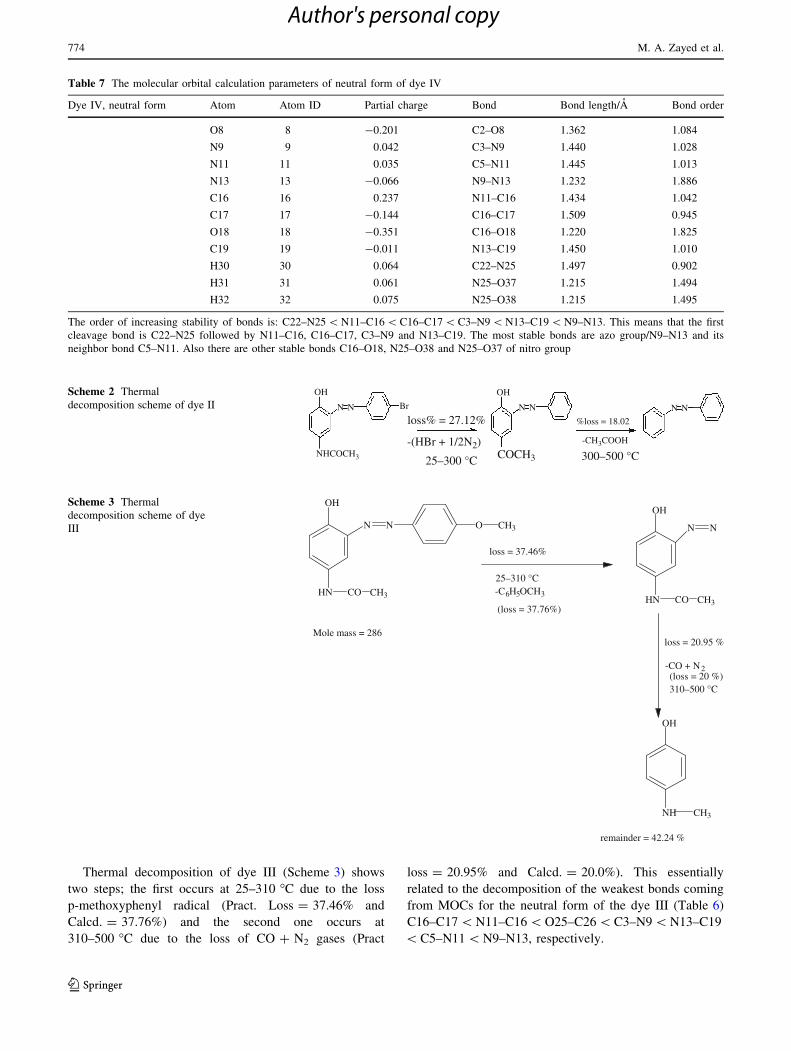
Thermal decomposition of dye III (Scheme 3) shows
two steps; the first occurs at 25–310 �C due to the loss
p-methoxyphenyl radical (Pract. Loss = 37.46% and
Calcd. = 37.76%) and the second one occurs at
310–500 �C due to the loss of CO ? N2 gases (Pract
loss = 20.95% and Calcd. = 20.0%). This essentially
related to the decomposition of the weakest bonds coming
from MOCs for the neutral form of the dye III (Table 6)
C16–C17 \ N11–C16 \ O25–C26 \ C3–N9 \ N13–C19
\ C5–N11 \ N9–N13, respectively.
Table 7 The molecular orbital calculation parameters of neutral form of dye IV
Dye IV, neutral form Atom Atom ID Partial charge Bond Bond length/A Bond order
O8 8 -0.201 C2–O8 1.362 1.084
N9 9 0.042 C3–N9 1.440 1.028
N11 11 0.035 C5–N11 1.445 1.013
N13 13 -0.066 N9–N13 1.232 1.886
C16 16 0.237 N11–C16 1.434 1.042
C17 17 -0.144 C16–C17 1.509 0.945
O18 18 -0.351 C16–O18 1.220 1.825
C19 19 -0.011 N13–C19 1.450 1.010
H30 30 0.064 C22–N25 1.497 0.902
H31 31 0.061 N25–O37 1.215 1.494
H32 32 0.075 N25–O38 1.215 1.495
The order of increasing stability of bonds is: C22–N25 \ N11–C16 \ C16–C17 \ C3–N9 \ N13–C19 \ N9–N13. This means that the first
cleavage bond is C22–N25 followed by N11–C16, C16–C17, C3–N9 and N13–C19. The most stable bonds are azo group/N9–N13 and its
neighbor bond C5–N11. Also there are other stable bonds C16–O18, N25–O38 and N25–O37 of nitro group
N N
OH OH
N N N N
NHCOCH3
Br
loss% = 27.12% %loss = 18.02
-CH3COOH-(HBr + 1/2N2)
25–300 °C 300–500 °CCOCH3
Scheme 2 Thermal
decomposition scheme of dye II
OH
N N O CH3
HN CO CH3
loss = 37.46%
25–310 °C-C6H5OCH3
(loss = 37.76%)
OH
N N
HN CO CH3
Mole mass = 286loss = 20.95 %
-CO + N2(loss = 20 %)310–500 °C
NH
OH
remainder = 42.24 %
CH3
Scheme 3 Thermal
decomposition scheme of dye
III
774 M. A. Zayed et al.
123
Author's personal copy

Thermal decomposition process of the dye IV (p-nitro-
o-phenylazo-p-acetoamidophenol; C14H13N4O4) show two
processes (Fig. 1a). The first process occurs at temperature
range 25–360 �C with experimental weight loss of 35.08%
(calculated weigh loss % at 35.0) with peak temperature at
287.03 �C (DTGA). The second process occurs at tem-
perature range 360–500 �C with experimental weight loss
of 25.07% (calculated mass loss % = 25.3) and peak
temperature at 480.0 �C. Semi-empirical MO-calculation
(PM3 procedure) shows from Table 2 that C22–N25 bond
is the first site of bond rupture (lowest bond order = 0.902,
longer bond length = 1.497 A) leading to the NO2 gas
loss. Subsequent fragmentation includes rupture of COCH2
radical. This radical reacts with OH to form CH3COOH
molecule. Therefore, the proposed thermal decomposition
of the compound IV may be given by the following
Scheme 4 as a result of decomposition of weakest bonds in
the following order C22–N25 \ N11–C16 \ C16–
C17 \ C3–N9 \ N13–C19 \ N9–N13, respectively as
given by MOCs results in Table 7.
Conclusions
The data obtained by mass and MOCs confirm each other
and support the thermal decomposition schemes of these
dyes by declaring the weak bonds and its sequence of bond
rupture. It is generally concluded that thermal stability of
these azodyes as a function of starting decomposition
temperature and remaining of azo group till high-temper-
ature range can be ordered as dye III \ dye I \ dye
II \ dye IV depending upon the Hammet’s substituents
values of -0.27, 0.01, 0.23, and 0.78, respectively
(Table 3). The DTG values of the first fragmentation
temperatures for dye III \ dye I \ dye II \ dye IV are
274.16, 275, 282.9, and 287.83 �C, respectively. It is
concluded that the primary fragmentation of compound III
occurs exactly at 274.16 �C (from DTG) because of the
loss of p-methoxyphenyl radical. Dye I also occurs exactly
at 275 �C due to the loss of NOCH3 group. Dye II starts at
25–300 �C (DTG, 282.9 �C) by the loss of HBr followed
by CH3COOH in two processes contrary to the behavior of
compound I in which the two ruptures occur in one process.
In case of dye IV, the first one appears exactly at 287.83
with practical mass loss % = 35.08. This loss may be
attributed to the decomposition of NO2 as a gaseous mol-
ecule together with an acetic acid molecule. These results
agree well with Hammet’s values and the given thermal
stability ordering. The final weight losses of these dyes also
occur in the same order of DTG values 475.55 �C (dye III),
377 �C (dye I), 448.3 �C (dye II), and 387.0 �C (dye IV),
respectively. These values refer to the order of stability of
the remainder parts keeping azo groups at elevated tem-
peratures and decomposed in the second step. This also
provides an important knowledge about the effect of tem-
perature and thermal treatment of these dyes and conse-
quently the temperature range of its thermal stability before
going to decomposition. It also reveals the consequent
fragments essentially obtained during fragmentation. These
data can be used in industrial applications of these dyes in
mordant dying processes.
References
1. Grayson M. Kirk-Othmer concise encyclopedia of chemical
technology. Abridged version, 3rd ed. New York: Wiley; 1985.
2. Vlase T, Vlase G, Modra D, Doca N. Thermal behaviour of some
industrial and food dyes. J Therm Anal Calorim. 2007;88(2):
389–93.
3. Suprabha T, Haizel GR, Jesty T, Praveenkumar K, Suresh M.
Microwave assisted synthesis of titania nanocubes, nanospheres
and nanorods for photocatalytic dye degradation. Nanoscale Res
Lett. 2009;4:144–52.
4. Wojciechowski K, Szadowski J. Thermal analysis of amide
derivatives of N,N-dialkylaminoazobenzene. J Therm Anal Cal-
orim. 1985;31(2):297–303.
5. Pinggui T, Yongjun F, Dianqing L. Improved thermal and
photostability of an anthraquinone dye by intercalation in a zinc–
aluminum layered double hydroxides host. Dyes Pigments. 2011;
90(3):253–8.
6. Kocaokutgen H, Gumrukcuoglu IE. Thermal characterization of
some azo dyes containing interamolecular hydrogen bonds and
non-bonds. J Therm Anal Calorim. 2003;71:675–9.
7. Larson BS, Meewen CN. Mass spectrometry of biological
materials. New York: Marcel Dakker, Inc; 1998.
8. Euigyung J, Harold SF, Larry DC. Synthesis and characterization
of selected 4,40-diaminoalkoxyazobenzenes. Dyes Pigments.
2010;87(2):100–8.
9. Austin CA. To dissociate or decompose: investigating gas phase
rearrangement of simple to complex compounds using mass
spectrometry and thermal analysis. Ohio link Digital Resource
(DRC); 2008.
10. Levsen K. Fundamental aspects of organic mass spectrometry.
Weinheim: Verlag Chemie; 1978.
11. Bourcier S, Hoppilliard Y. Fragmentation mechanisms of pro-
tonated benzylamines. Electrospray ionisation-tandem mass
spectrometry study and ab initio molecular orbital calculations.
Eur J Mass Spectrom. 2003;9:351–60.
12. Fahmy MA, Zayed MA, Keshk YH. Comparative study on the
fragmentation of some simple phenolic compounds using mass
OHN N N N NHN
NHCOCH3
NO2%loss = 35.08 %loss = 25.07
-C6 H4-NO2-CH3COOH25–350 °C
350–500 °C
Scheme 4 Thermal
decomposition scheme of dye
IV
Thermal and mass spectral characterization of novel azo dyes 775
123
Author's personal copy
spectrometry and thermal analyses. Thermochem Acta.
2001;366:183–8.
13. Fahmey MA, Zayed MA, El-shobaky HG. Study of some phe-
nolic-iodine redox polymeric products by thermal analyses and
mass spectrometry. J Therm Anal Calorim. 2005;82:137–42.
14. Mayer I, Gomory A. Semiempirical quantum chemical method
for predicting mass spectrometric fragmentations. J Mol Struct.
1994;311:331–41.
15. Zayed MA, Fahmey MA, Hawash MF. Investigation of malo-
mananilide and its dinitro-isomers using thermal analyses, mass
spectrometry and semi-empirical MO calculations. Egypt J
Chem. 2005;48(1):43–57.
16. Zayed MA, Fahmey MA, Hawash MF. Investigation of diazepam
drug using thermal analyses, mass spectra and semi-empirical
MO calculations. Spectrochim Acta A. 2005;61:799–805.
17. Zayed MA, Hawash MF, Fahmey MA. Structure investigation of
codeine drug using mass spectra, thermal analyses and semi-
empirical MO calculations. Spectrochim Acta A. 2005;64:
363–71.
18. Zayed MA, Fahmey MA, Hawash MF, El-Habeeb AA. Mass
spectrometric investigation of buspirone drug in comparison with
thermal analyses and molecular orbital calculations. Spectrochim
Acta A. 2007;67:522–30.
19. Zayed MA, Nour El-Dien FA, Hawash MF, Fahmey MA. Mass
spectra of gliclazide drug at various ion sources temperature. Its
thermal behavior and molecular orbital calculations. J Therm
Anal Calorim. 2010;102:305–12.
20. Hansch C, Leo A. Substituent constants for correlation analysis in
chemistry and biology. NY: Wiley-Interscience; 1979.
21. Stewart JJP. Optimization of parameters for semiempirical
methods. III Extension of PM3 to Be, Mg, Zn, Ga, Ge, As, Se,
Cd, In, Sn, Sb, Te, Hg, Tl, Pb, and Bi. J Comput Chem.
1991;12:12320–341.
22. Baker J. An algorithm for the location of transition states.
J Comput Chem. 2004;7(4):385–95.
23. Stewart JJP. MOPAC 2000. Tokyo, Japan: Fujitsu Limited; 1999.
24. Loew G, Chadwick M, Smith D. Applications of molecular
orbital theory to the interpretation of mass spectra. Prediction of
primary fragmentation sites in organic molecules. Org Mass
Spectrom. 1973;7:1241–51.
25. Somogyi A, Wysocki VH, Mayer I. The effect of protonation site
on bond strengths in simple peptides: application of ab initio and
modified neglect of differential overlap bond orders and modified
neglect of differential overlap energy partitioning. J Am Soc
Mass Spectrom. 1994;5:704–17.
776 M. A. Zayed et al.
123
Author's personal copy