the world’s 500 largest asset managers...•u.s. managers (13) in the top 20 increased their share...
TRANSCRIPT
Results as of year end 2016
The World’s 500 Largest Asset Managers
© 2017 Willis Towers Watson. All rights reserved.
The P&I/Willis Towers Watson global 500 ranking is prepared
using joint research by Pensions & Investments and Willis
Towers Watson
Published October 2017
2
CONTENTS
SUMMARY Executive summary
3
ANALYSIS Section 1
Trends in total value of assets 6
Section 2
Analysis of the largest 20 asset managers14
Section 3
Passive management 21
Section 4
Manager insights on the industry 25
CONTACT Contact details and limitations of reliance
27
APPENDIX Complete ranking28
Definitions and footnotes39
© 2017 Willis Towers Watson. All rights reserved. Proprietary and Confidential. For Willis Towers Watson and Willis Towers Watson client use only.
© 2017 Willis Towers Watson. All rights reserved. Proprietary and Confidential. For Willis Towers Watson and Willis Towers Watson client use only.
Executive summary
3
Executive summary
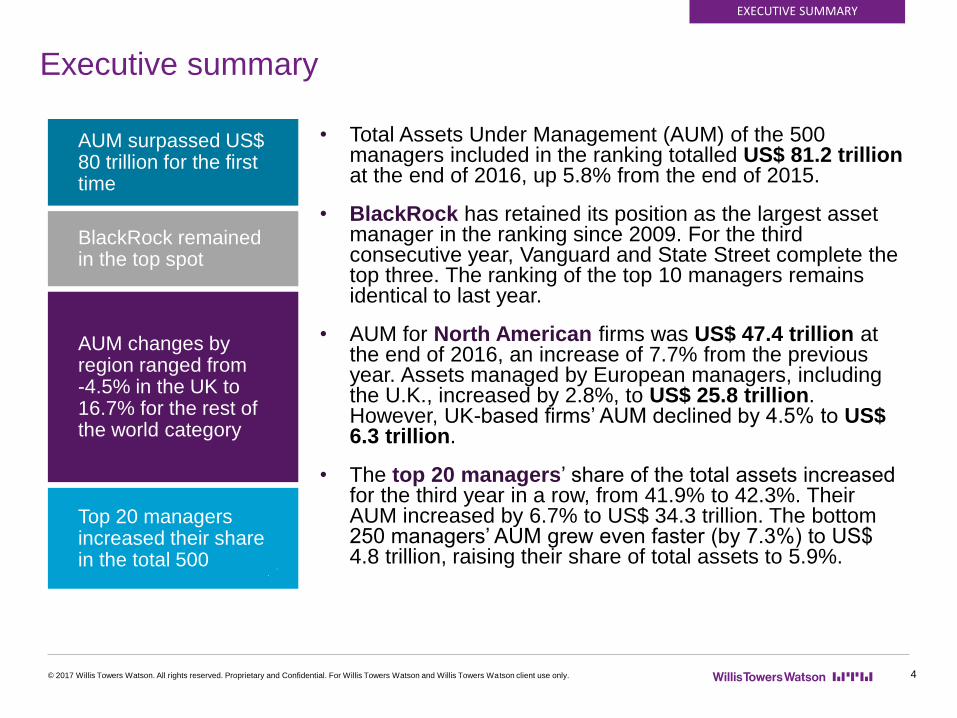
• Total Assets Under Management (AUM) of the 500 managers included in the ranking totalled US$ 81.2 trillion at the end of 2016, up 5.8% from the end of 2015.
• BlackRock has retained its position as the largest asset manager in the ranking since 2009. For the third consecutive year, Vanguard and State Street complete the top three. The ranking of the top 10 managers remains identical to last year.
• AUM for North American firms was US$ 47.4 trillion at the end of 2016, an increase of 7.7% from the previous year. Assets managed by European managers, including the U.K., increased by 2.8%, to US$ 25.8 trillion. However, UK-based firms’ AUM declined by 4.5% to US$ 6.3 trillion.
• The top 20 managers’ share of the total assets increased for the third year in a row, from 41.9% to 42.3%. Their AUM increased by 6.7% to US$ 34.3 trillion. The bottom 250 managers’ AUM grew even faster (by 7.3%) to US$ 4.8 trillion, raising their share of total assets to 5.9%.
© 2017 Willis Towers Watson. All rights reserved. Proprietary and Confidential. For Willis Towers Watson and Willis Towers Watson client use only.
EXECUTIVE SUMMARY
AUM changes by region ranged from -4.5% in the UK to 16.7% for the rest of the world category
Top 20 managers increased their share in the total 500
BlackRock remained in the top spot
AUM surpassed US$ 80 trillion for the first time
4
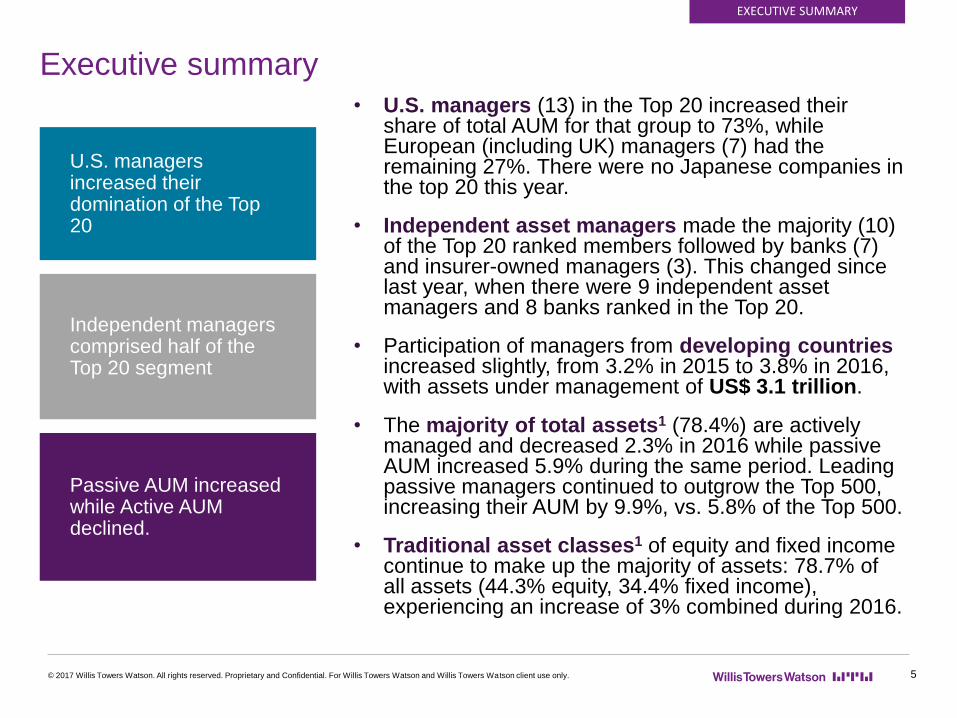
• U.S. managers (13) in the Top 20 increased their share of total AUM for that group to 73%, while European (including UK) managers (7) had the remaining 27%. There were no Japanese companies in the top 20 this year.
• Independent asset managers made the majority (10) of the Top 20 ranked members followed by banks (7) and insurer-owned managers (3). This changed since last year, when there were 9 independent asset managers and 8 banks ranked in the Top 20.
• Participation of managers from developing countries increased slightly, from 3.2% in 2015 to 3.8% in 2016, with assets under management of US$ 3.1 trillion.
• The majority of total assets1 (78.4%) are actively managed and decreased 2.3% in 2016 while passive AUM increased 5.9% during the same period. Leading passive managers continued to outgrow the Top 500, increasing their AUM by 9.9%, vs. 5.8% of the Top 500.
• Traditional asset classes1 of equity and fixed income continue to make up the majority of assets: 78.7% of all assets (44.3% equity, 34.4% fixed income), experiencing an increase of 3% combined during 2016.
© 2017 Willis Towers Watson. All rights reserved. Proprietary and Confidential. For Willis Towers Watson and Willis Towers Watson client use only.
EXECUTIVE SUMMARY
Independent managers comprised half of the Top 20 segment
U.S. managers increased their domination of the Top 20
Passive AUM increased while Active AUM declined.
Executive summary
5

© 2017 Willis Towers Watson. All rights reserved. Proprietary and Confidential. For Willis Towers Watson and Willis Towers Watson client use only.
Section 1: Trends in total value of assets
Analysis
6
© 2017 Willis Towers Watson. All rights reserved. Proprietary and Confidential. For Willis Towers Watson and Willis Towers Watson client use only.
SECTION 1
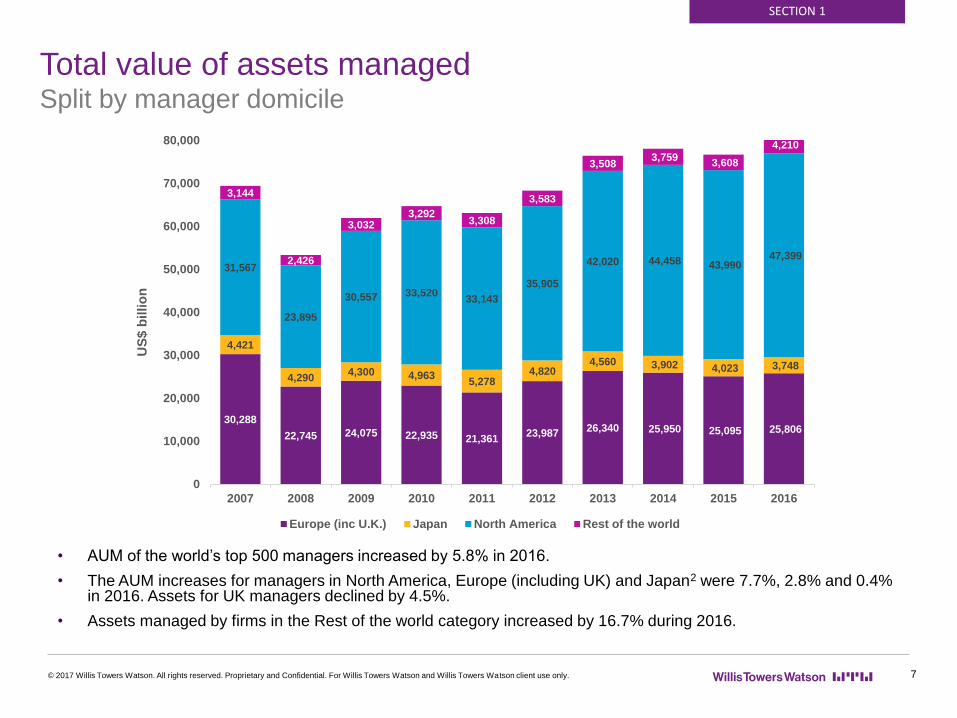
Total value of assets managedSplit by manager domicile
• AUM of the world’s top 500 managers increased by 5.8% in 2016.
• The AUM increases for managers in North America, Europe (including UK) and Japan2 were 7.7%, 2.8% and 0.4% in 2016. Assets for UK managers declined by 4.5%.
• Assets managed by firms in the Rest of the world category increased by 16.7% during 2016.
7
30,288
22,745 24,075 22,935 21,36123,987
26,340 25,950 25,095 25,806
4,421
4,2904,300 4,963
5,2784,820
4,560 3,902 4,023 3,748
31,567
23,895
30,557 33,52033,143
35,905
42,020 44,458 43,990 47,399
3,144
2,426
3,0323,292
3,308
3,583
3,5083,759
3,608
4,210
0
10,000
20,000
30,000
40,000
50,000
60,000
70,000
80,000
2007 2008 2009 2010 2011 2012 2013 2014 2015 2016
US
$ b
illio
n
Europe (inc U.K.) Japan North America Rest of the world
© 2017 Willis Towers Watson. All rights reserved. Proprietary and Confidential. For Willis Towers Watson and Willis Towers Watson client use only.
SECTION 1
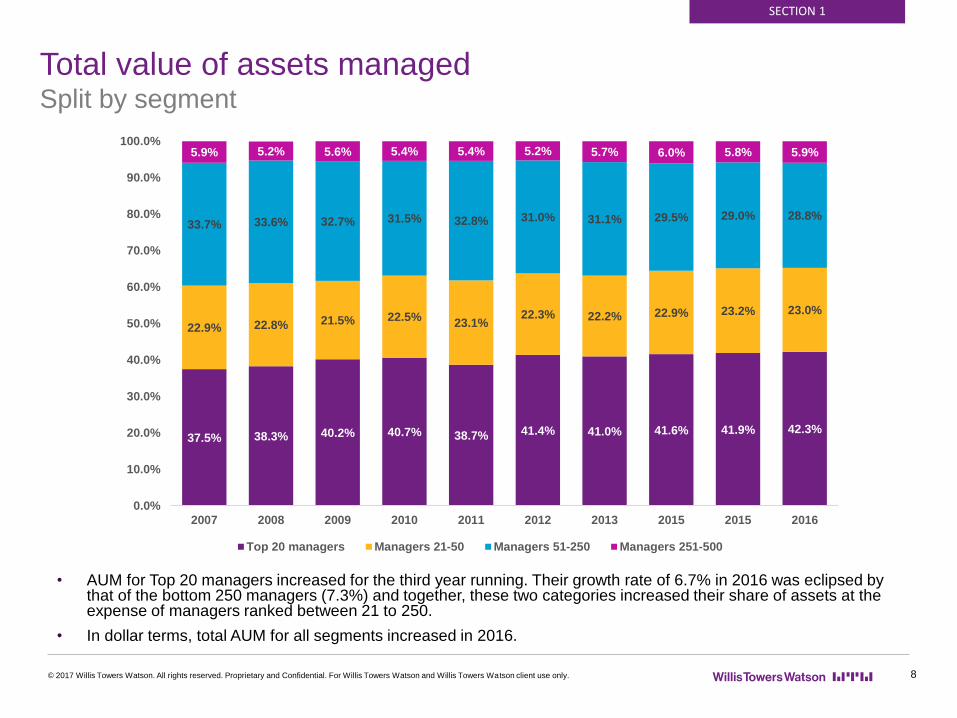
Total value of assets managedSplit by segment
• AUM for Top 20 managers increased for the third year running. Their growth rate of 6.7% in 2016 was eclipsed by that of the bottom 250 managers (7.3%) and together, these two categories increased their share of assets at the expense of managers ranked between 21 to 250.
• In dollar terms, total AUM for all segments increased in 2016.
8
37.5% 38.3% 40.2% 40.7% 38.7% 41.4% 41.0% 41.6% 41.9% 42.3%
22.9% 22.8% 21.5% 22.5%23.1%
22.3% 22.2% 22.9% 23.2% 23.0%
33.7% 33.6% 32.7% 31.5% 32.8% 31.0% 31.1% 29.5% 29.0% 28.8%
5.9% 5.2% 5.6% 5.4% 5.4% 5.2% 5.7% 6.0% 5.8% 5.9%
0.0%
10.0%
20.0%
30.0%
40.0%
50.0%
60.0%
70.0%
80.0%
90.0%
100.0%
2007 2008 2009 2010 2011 2012 2013 2015 2015 2016
Top 20 managers Managers 21-50 Managers 51-250 Managers 251-500
1.00% 1.76% 0.65%3.89%
0.35%
7.99% 7.75%2.63%
6.37%0.79%
3.46% 1.32% 1.40% 0.53%5.36%
11.32%
41.59%
1.85%
1.39% 0.25% 0.90%4.93%
1.31%7.21% 6.04%
1.74% 4.62%0.84% 2.37% 0.42% 0.71% 0.54%
3.96%7.81%
53.47%
1.51%
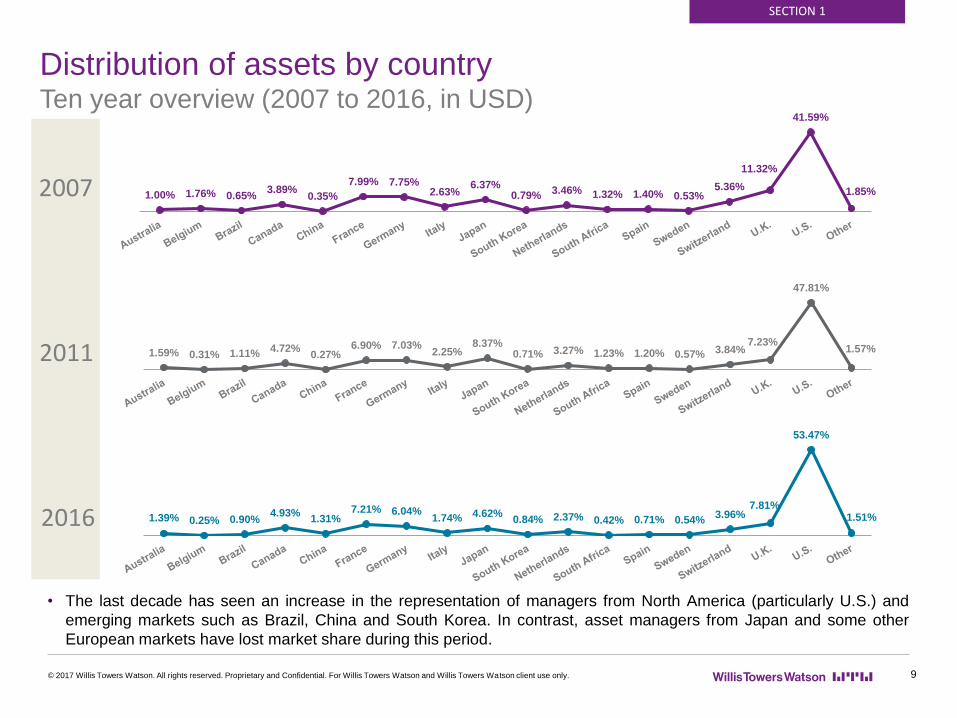
• The last decade has seen an increase in the representation of managers from North America (particularly U.S.) and
emerging markets such as Brazil, China and South Korea. In contrast, asset managers from Japan and some other
European markets have lost market share during this period.
© 2017 Willis Towers Watson. All rights reserved. Proprietary and Confidential. For Willis Towers Watson and Willis Towers Watson client use only.
2007
2011
2016
SECTION 1
Distribution of assets by countryTen year overview (2007 to 2016, in USD)
9
1.59% 0.31% 1.11%4.72%
0.27%6.90% 7.03%
2.25%8.37%
0.71% 3.27% 1.23% 1.20% 0.57% 3.84%7.23%
47.81%
1.57%

-15.2%
-8.5%
-6.6%
0.7%
2.3%
2.4%
4.2%
4.9%
5.8%
6.1%
6.8%
7.5%
8.7%
13.6%
43.9%
-6.0%
-1.6%
1.4%
12.5%
9.5%
6.8%
10.1%
9.3%
7.5%
12.1%
11.8%
7.5%
9.5%
18.8%
46.5%
-17% -12% -7% -2% 3% 8% 13% 18% 23% 28% 33% 38% 43% 48%
South Africa
Norway
Japan
Brazil
Australia
Euro countries
Sweden
Denmark
Switzerland
Canada
UK
US
South Korea
India
China
5 year CAGR to 2016 in LC
5 year CAGR to 2016 in USD
Growth of AUM by country over 5 yearsLocal currency (LC) and USD
• The increasing strength of the USD has generally had a dampening affect on the growth rate in assets recorded by asset managers in the survey. This is particularly evident in Australia, Canada, the Eurozone, Japan and emerging markets such as Brazil, India and South Africa.
© 2017 Willis Towers Watson. All rights reserved. Proprietary and Confidential. For Willis Towers Watson and Willis Towers Watson client use only.
SECTION 1
10
© 2017 Willis Towers Watson. All rights reserved. Proprietary and Confidential. For Willis Towers Watson and Willis Towers Watson client use only. 11
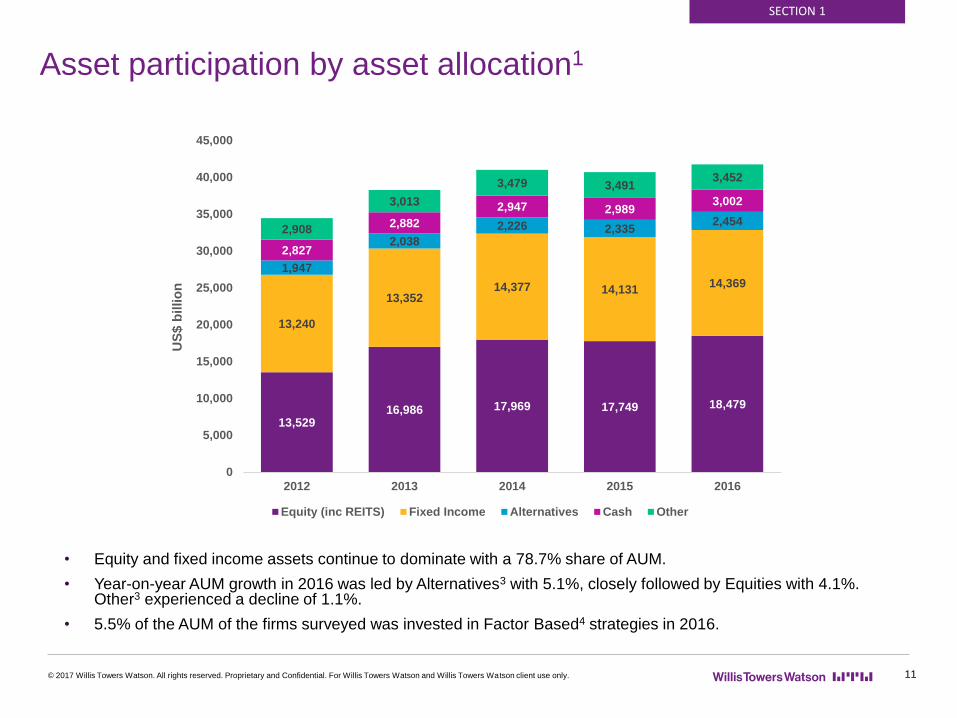
Asset participation by asset allocation1
SECTION 1
• Equity and fixed income assets continue to dominate with a 78.7% share of AUM.
• Year-on-year AUM growth in 2016 was led by Alternatives3 with 5.1%, closely followed by Equities with 4.1%. Other3 experienced a decline of 1.1%.
• 5.5% of the AUM of the firms surveyed was invested in Factor Based4 strategies in 2016.
13,52916,986 17,969 17,749 18,479
13,240
13,35214,377 14,131
14,369
1,947
2,038
2,226 2,3352,454
2,827
2,882
2,947 2,9893,002
2,908
3,013
3,479 3,4913,452
0
5,000
10,000
15,000
20,000
25,000
30,000
35,000
40,000
45,000
2012 2013 2014 2015 2016
US
$ b
illio
n
Equity (inc REITS) Fixed Income Alternatives Cash Other
© 2017 Willis Towers Watson. All rights reserved. Proprietary and Confidential. For Willis Towers Watson and Willis Towers Watson client use only. 12
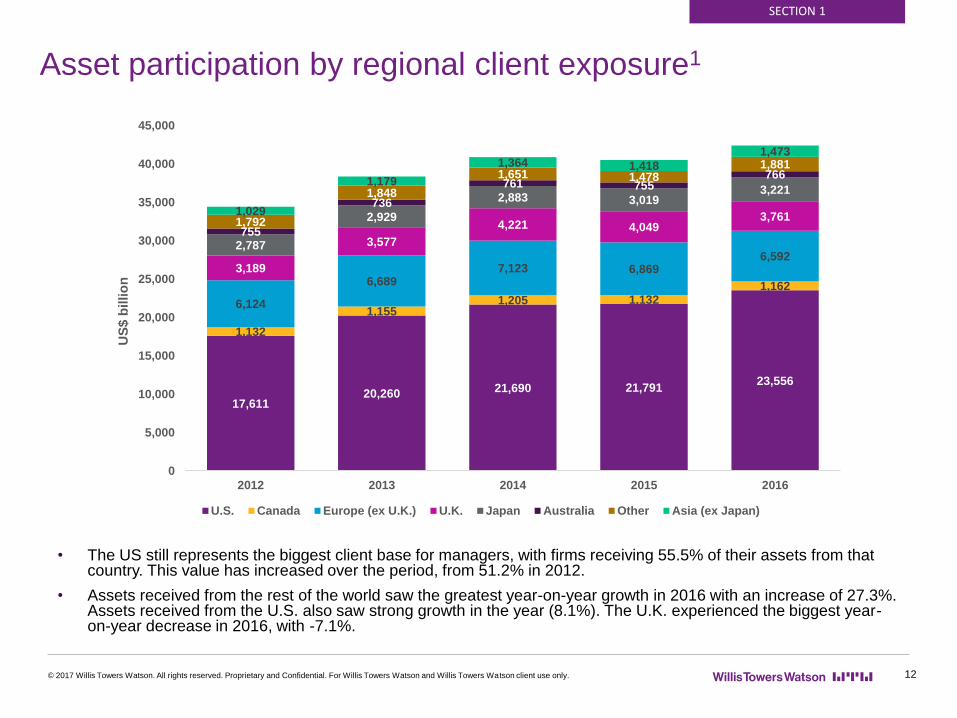
Asset participation by regional client exposure1
SECTION 1
• The US still represents the biggest client base for managers, with firms receiving 55.5% of their assets from that country. This value has increased over the period, from 51.2% in 2012.
• Assets received from the rest of the world saw the greatest year-on-year growth in 2016 with an increase of 27.3%. Assets received from the U.S. also saw strong growth in the year (8.1%). The U.K. experienced the biggest year-on-year decrease in 2016, with -7.1%.
17,61120,260 21,690 21,791
23,556
1,132
1,1551,205 1,132
1,162
6,124
6,6897,123 6,869
6,5923,189
3,577
4,221 4,0493,761
2,787
2,929
2,883 3,0193,221
755
736
761 755766
1,792
1,848
1,651 1,4781,881
1,029
1,179
1,364 1,418
1,473
0
5,000
10,000
15,000
20,000
25,000
30,000
35,000
40,000
45,000
2012 2013 2014 2015 2016
US
$ b
illio
n
U.S. Canada Europe (ex U.K.) U.K. Japan Australia Other Asia (ex Japan)
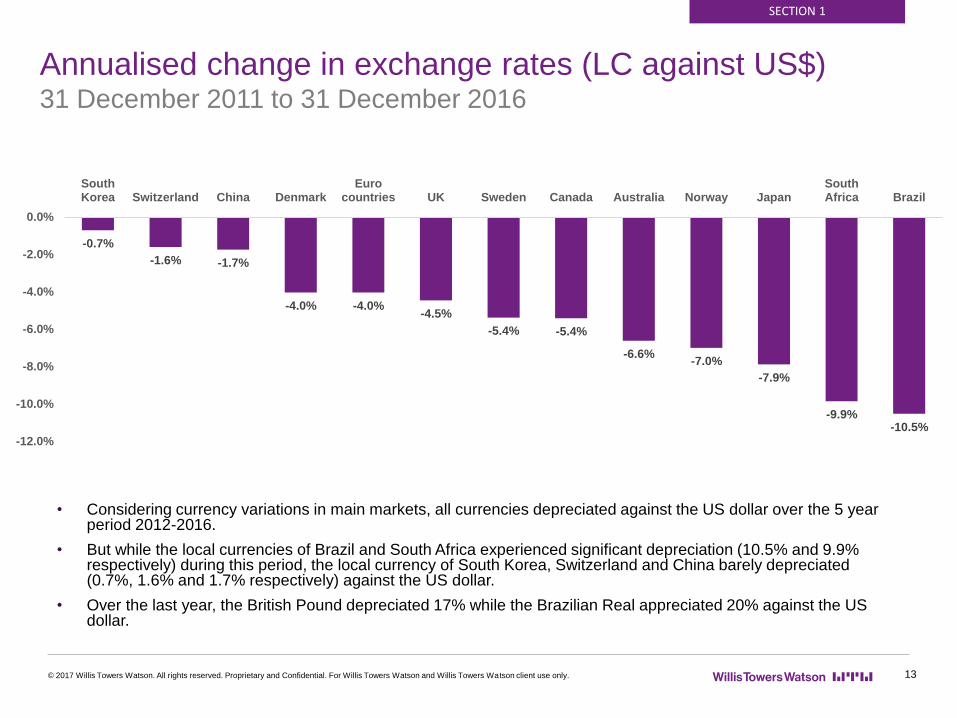
Annualised change in exchange rates (LC against US$)31 December 2011 to 31 December 2016
• Considering currency variations in main markets, all currencies depreciated against the US dollar over the 5 year period 2012-2016.
• But while the local currencies of Brazil and South Africa experienced significant depreciation (10.5% and 9.9% respectively) during this period, the local currency of South Korea, Switzerland and China barely depreciated (0.7%, 1.6% and 1.7% respectively) against the US dollar.
• Over the last year, the British Pound depreciated 17% while the Brazilian Real appreciated 20% against the US dollar.
© 2017 Willis Towers Watson. All rights reserved. Proprietary and Confidential. For Willis Towers Watson and Willis Towers Watson client use only.
SECTION 1
13
-0.7%
-1.6% -1.7%
-4.0% -4.0%-4.5%
-5.4% -5.4%
-6.6%-7.0%
-7.9%
-9.9%-10.5%
-12.0%
-10.0%
-8.0%
-6.0%
-4.0%
-2.0%
0.0%
SouthKorea Switzerland China Denmark
Eurocountries UK Sweden Canada Australia Norway Japan
SouthAfrica Brazil
© 2017 Willis Towers Watson. All rights reserved. Proprietary and Confidential. For Willis Towers Watson and Willis Towers Watson client use only.
Section 2: Analysis of the largest asset managers
Analysis
14
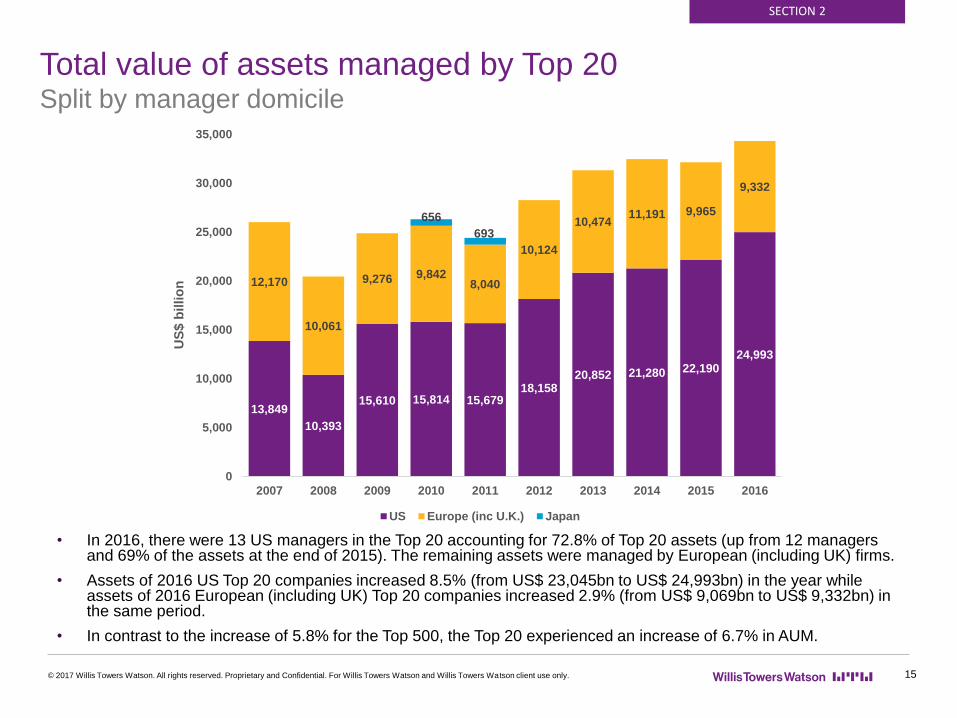
Total value of assets managed by Top 20Split by manager domicile
• In 2016, there were 13 US managers in the Top 20 accounting for 72.8% of Top 20 assets (up from 12 managers and 69% of the assets at the end of 2015). The remaining assets were managed by European (including UK) firms.
• Assets of 2016 US Top 20 companies increased 8.5% (from US$ 23,045bn to US$ 24,993bn) in the year while assets of 2016 European (including UK) Top 20 companies increased 2.9% (from US$ 9,069bn to US$ 9,332bn) in the same period.
• In contrast to the increase of 5.8% for the Top 500, the Top 20 experienced an increase of 6.7% in AUM.
© 2017 Willis Towers Watson. All rights reserved. Proprietary and Confidential. For Willis Towers Watson and Willis Towers Watson client use only.
SECTION 2
15
13,849
10,393
15,610 15,814 15,67918,158
20,852 21,280 22,19024,993
12,170
10,061
9,276 9,8428,040
10,124
10,47411,191 9,965
9,332
656
693
0
5,000
10,000
15,000
20,000
25,000
30,000
35,000
2007 2008 2009 2010 2011 2012 2013 2014 2015 2016
US
$ b
illio
n
US Europe (inc U.K.) Japan
8.9%
-23.1%
16.1%
4.4%-2.1%
8.3%
11.9%
2.1%
-1.7%
5.8%
5.6%
-21.4%
21.7%
5.7%
-7.2%
15.9%
10.8%
3.7%
-1.0%
6.7%
2007 2008 2009 2010 2011 2012 2013 2014 2015 2016
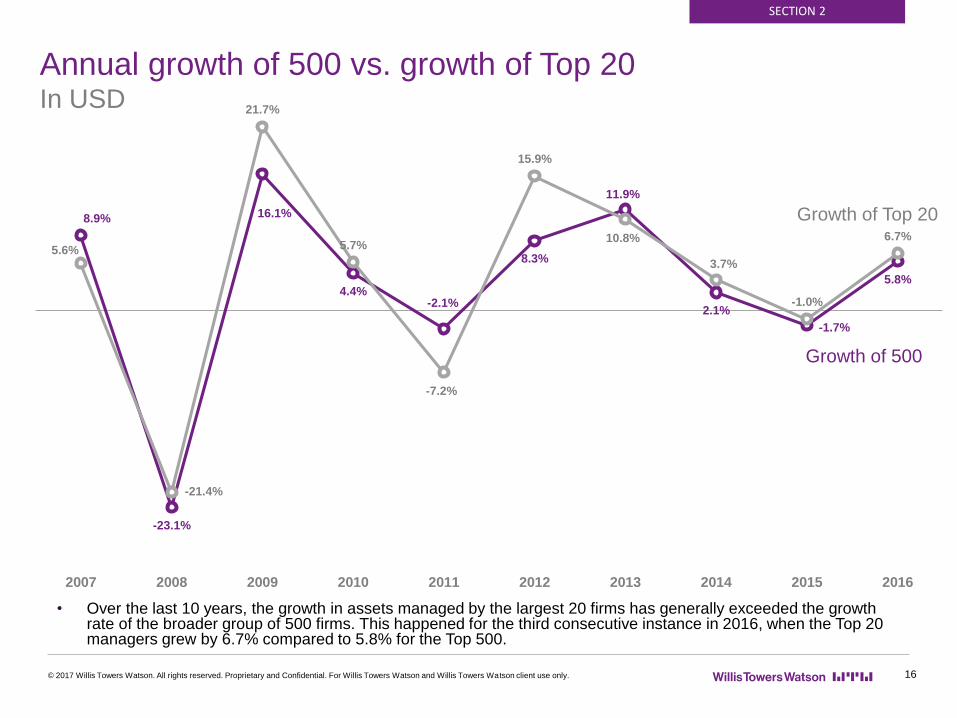
Annual growth of 500 vs. growth of Top 20In USD
• Over the last 10 years, the growth in assets managed by the largest 20 firms has generally exceeded the growth rate of the broader group of 500 firms. This happened for the third consecutive instance in 2016, when the Top 20 managers grew by 6.7% compared to 5.8% for the Top 500.
© 2017 Willis Towers Watson. All rights reserved. Proprietary and Confidential. For Willis Towers Watson and Willis Towers Watson client use only.
Growth of 500
Growth of Top 20
SECTION 2
16
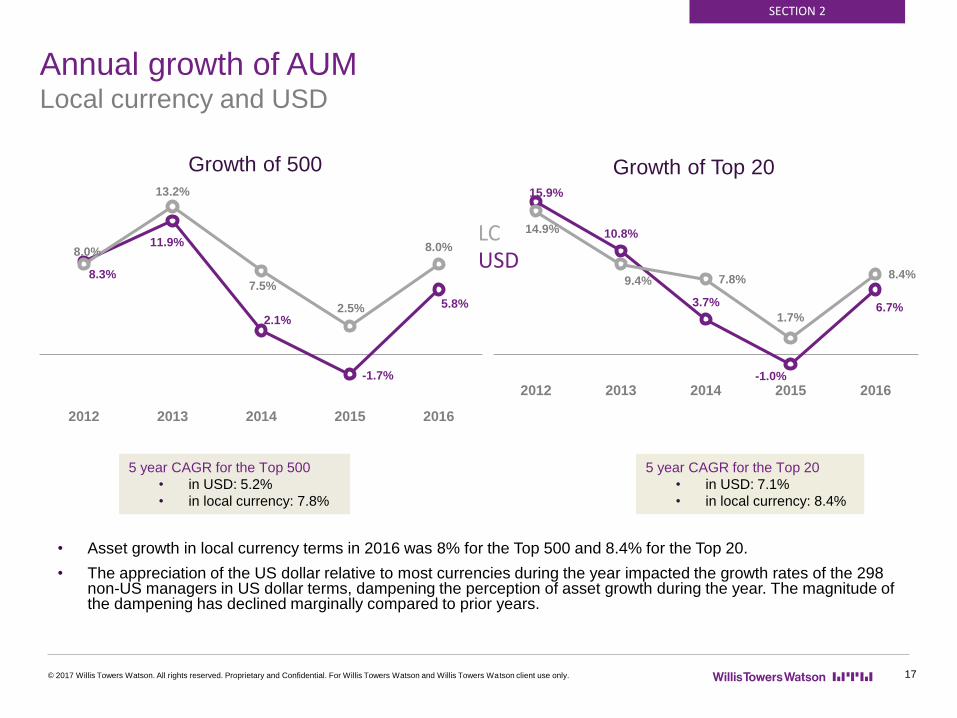
Annual growth of AUMLocal currency and USD
• Asset growth in local currency terms in 2016 was 8% for the Top 500 and 8.4% for the Top 20.
• The appreciation of the US dollar relative to most currencies during the year impacted the growth rates of the 298 non-US managers in US dollar terms, dampening the perception of asset growth during the year. The magnitude of the dampening has declined marginally compared to prior years.
© 2017 Willis Towers Watson. All rights reserved. Proprietary and Confidential. For Willis Towers Watson and Willis Towers Watson client use only.
5 year CAGR for the Top 500
• in USD: 5.2%
• in local currency: 7.8%
5 year CAGR for the Top 20
• in USD: 7.1%
• in local currency: 8.4%
Growth of Top 20Growth of 500
LCUSD
SECTION 2
17
8.3%
11.9%
2.1%
-1.7%
5.8%
8.0%
13.2%
7.5%
2.5%
8.0%
2012 2013 2014 2015 2016
15.9%
10.8%
3.7%
-1.0%
6.7%
14.9%
9.4% 7.8%
1.7%
8.4%
2012 2013 2014 2015 2016
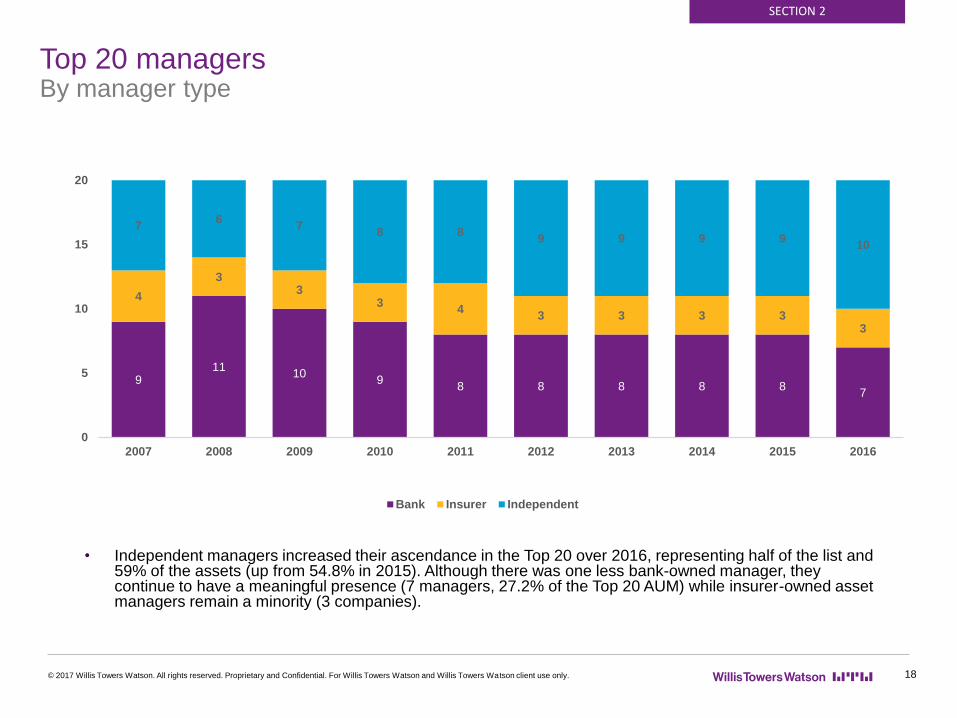
Top 20 managersBy manager type
• Independent managers increased their ascendance in the Top 20 over 2016, representing half of the list and 59% of the assets (up from 54.8% in 2015). Although there was one less bank-owned manager, they continue to have a meaningful presence (7 managers, 27.2% of the Top 20 AUM) while insurer-owned asset managers remain a minority (3 companies).
© 2017 Willis Towers Watson. All rights reserved. Proprietary and Confidential. For Willis Towers Watson and Willis Towers Watson client use only.
SECTION 2
18
911
109
8 8 8 8 8 7
4
33
34
3 3 3 3 3
76
78 8
9 9 9 9 10
0
5
10
15
20
2007 2008 2009 2010 2011 2012 2013 2014 2015 2016
Bank Insurer Independent
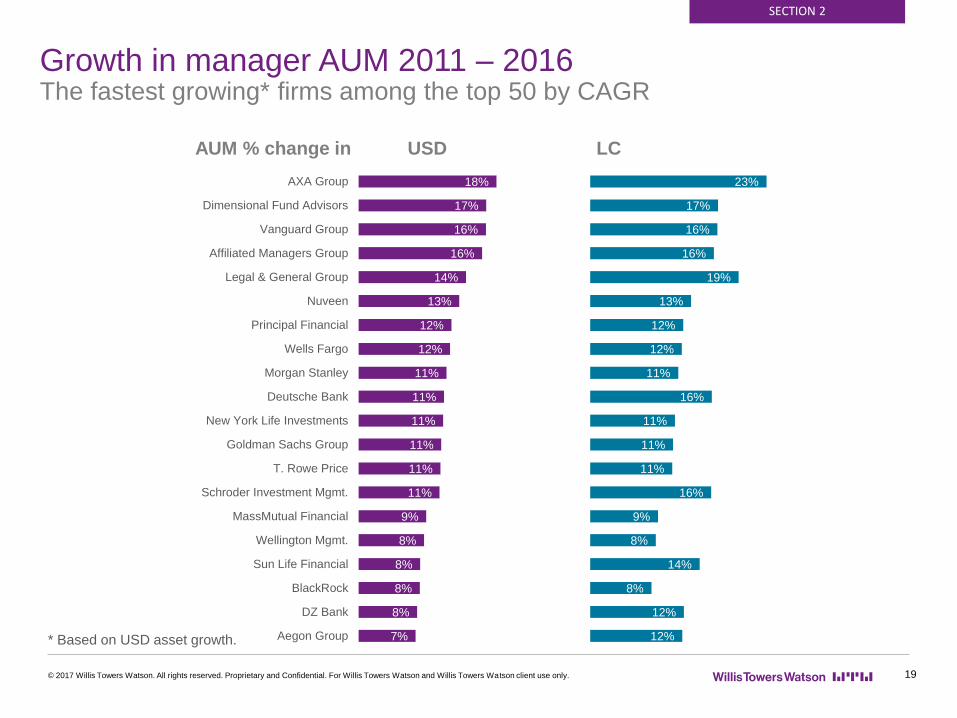
Growth in manager AUM 2011 – 2016The fastest growing* firms among the top 50 by CAGR
© 2017 Willis Towers Watson. All rights reserved. Proprietary and Confidential. For Willis Towers Watson and Willis Towers Watson client use only.
SECTION 2
AUM % change in USD LC
* Based on USD asset growth.
19
7%
8%
8%
8%
8%
9%
11%
11%
11%
11%
11%
11%
12%
12%
13%
14%
16%
16%
17%
18%
12%
12%
8%
14%
8%
9%
16%
11%
11%
11%
16%
11%
12%
12%
13%
19%
16%
16%
17%
23%
Aegon Group
DZ Bank
BlackRock
Sun Life Financial
Wellington Mgmt.
MassMutual Financial
Schroder Investment Mgmt.
T. Rowe Price
Goldman Sachs Group
New York Life Investments
Deutsche Bank
Morgan Stanley
Wells Fargo
Principal Financial
Nuveen
Legal & General Group
Affiliated Managers Group
Vanguard Group
Dimensional Fund Advisors
AXA Group

Growth in manager AUM 2011 – 2016Largest ranking gains in the top 50
© 2017 Willis Towers Watson. All rights reserved. Proprietary and Confidential. For Willis Towers Watson and Willis Towers Watson client use only.
SECTION 2
Manager Market Rank change
Dimensional Fund Advisors U.S. +31 (76→45)
Affiliated Managers Group U.S. +20 (52→32)
Nuveen U.S. +16 (36→20)
New York Life Investments U.S. +15 (55→40)
Schroder Investment Mgmt. U.K. +15 (59→44)
Principal Financial U.S. +13 (51→38)
DZ Bank Germany +13 (61→48)
AXA Group France +12 (20→8)
Wells Fargo U.S. +12 (31→19)
Legal & General Group U.K. +11 (27→16)
Manager Market Rank change
T. Rowe Price U.S. +11 (35→24)
Morgan Stanley U.S. +11 (38→27)
Great-West Lifeco Canada +7 (48→41)
Royal Bank of Canada Canada +7 (53→46)
MassMutual Financial U.S. +6 (39→33)
Wellington Mgmt. U.S. +5 (22→17)
Goldman Sachs Group U.S. +4 (14→10)
Sun Life Financial Canada +3 (37→34)
Aegon Group Netherlands +3 (29→26)
Vanguard Group U.S. +2 (4→2)
20
© 2017 Willis Towers Watson. All rights reserved. Proprietary and Confidential. For Willis Towers Watson and Willis Towers Watson client use only.
Section 3: Passive management
Analysis
21
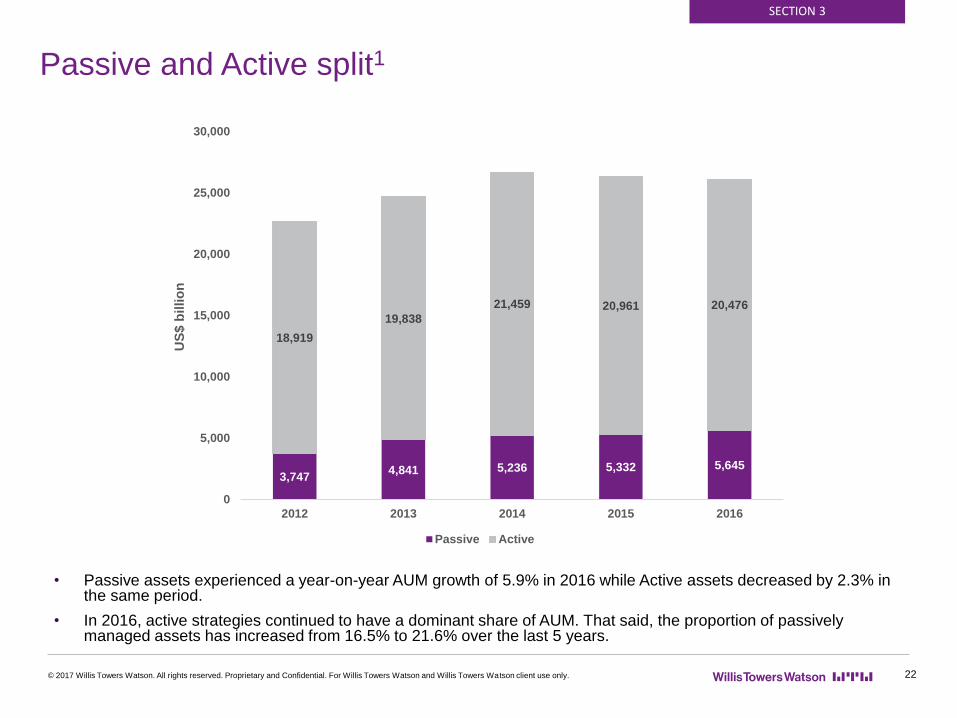
Passive and Active split1
• Passive assets experienced a year-on-year AUM growth of 5.9% in 2016 while Active assets decreased by 2.3% in the same period.
• In 2016, active strategies continued to have a dominant share of AUM. That said, the proportion of passively managed assets has increased from 16.5% to 21.6% over the last 5 years.
© 2017 Willis Towers Watson. All rights reserved. Proprietary and Confidential. For Willis Towers Watson and Willis Towers Watson client use only.
SECTION 3
22
3,7474,841 5,236 5,332 5,645
18,919
19,838
21,459 20,961 20,476
0
5,000
10,000
15,000
20,000
25,000
30,000
2012 2013 2014 2015 2016
US
$ b
illio
n
Passive Active
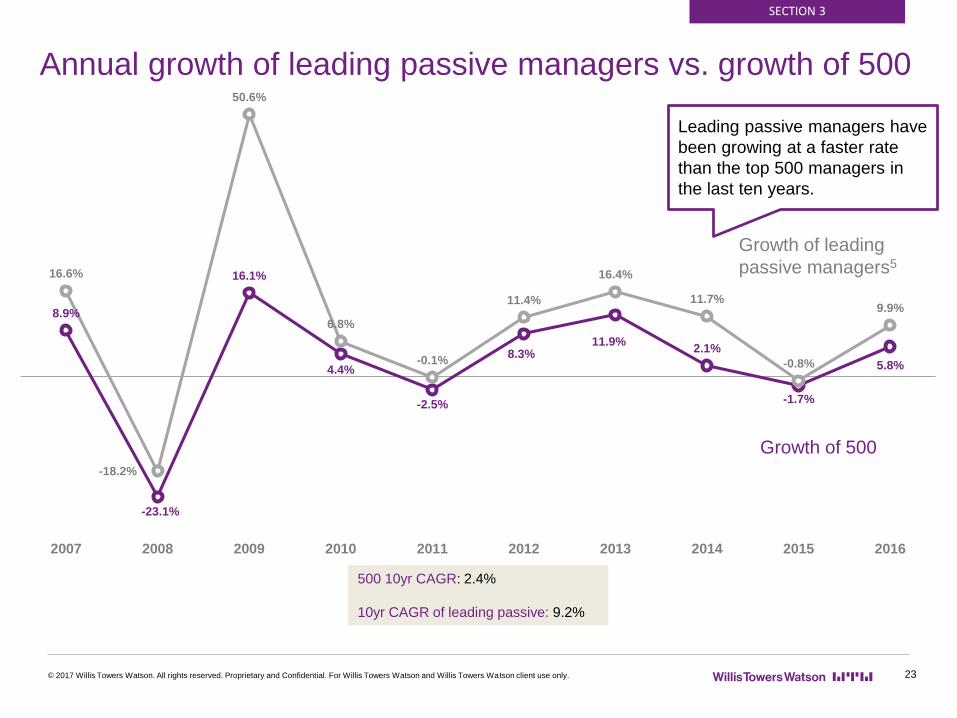
Annual growth of leading passive managers vs. growth of 500
© 2017 Willis Towers Watson. All rights reserved. Proprietary and Confidential. For Willis Towers Watson and Willis Towers Watson client use only.
Growth of 500
Growth of leading
passive managers5
500 10yr CAGR: 2.4%
10yr CAGR of leading passive: 9.2%
SECTION 3
Leading passive managers have
been growing at a faster rate
than the top 500 managers in
the last ten years.
23
8.9%
-23.1%
16.1%
4.4%
-2.5%
8.3%11.9%
2.1%
-1.7%
5.8%
16.6%
-18.2%
50.6%
6.8%
-0.1%
11.4%
16.4%
11.7%
-0.8%
9.9%
2007 2008 2009 2010 2011 2012 2013 2014 2015 2016

Total AUM value of leading passive managers with annual
growth rate
© 2017 Willis Towers Watson. All rights reserved. Proprietary and Confidential. For Willis Towers Watson and Willis Towers Watson client use only.
10yr CAGR: 9.2%
• Total assets managed by leading passive asset managers5 grew at a faster rate (9.9%) in 2016 than those of the Top 500 (5.8%).
• Increase in assets in the year 2016 was larger than the compound annual growth rate (9.2%) over the past ten years.
SECTION 3
16.6% -18.2% 50.6% 6.8% -0.1% 11.4% 16.4% 11.7% -0.8% 9.9%Annual growth rate
24
8,023
6,563
9,88110,557 10,543
11,748
13,673
15,267 15,147
16,651
0
2,000
4,000
6,000
8,000
10,000
12,000
14,000
16,000
18,000
2007 2008 2009 2010 2011 2012 2013 2014 2015 2016
US
$ b
illio
n

© 2017 Willis Towers Watson. All rights reserved. Proprietary and Confidential. For Willis Towers Watson and Willis Towers Watson client use only.
Analysis
25
Section 4: Manager insights on the industry
33%
4%
40%
60%
37%
37%
21%
44%
7%
56%
52%
52%
16%
3%
10%
27%
Level of regulatory oversight
Aggregate investment management fee level across the firm
Number of product offerings across the firm
Resources deployed to technology and big data
Level of client interest in sustainable investing, including voting
Significant decrease Moderate decrease Remained the same Moderate Increase Significant Increase
© 2017 Willis Towers Watson. All rights reserved. Proprietary and Confidential. For Willis Towers Watson and Willis Towers Watson client use only.
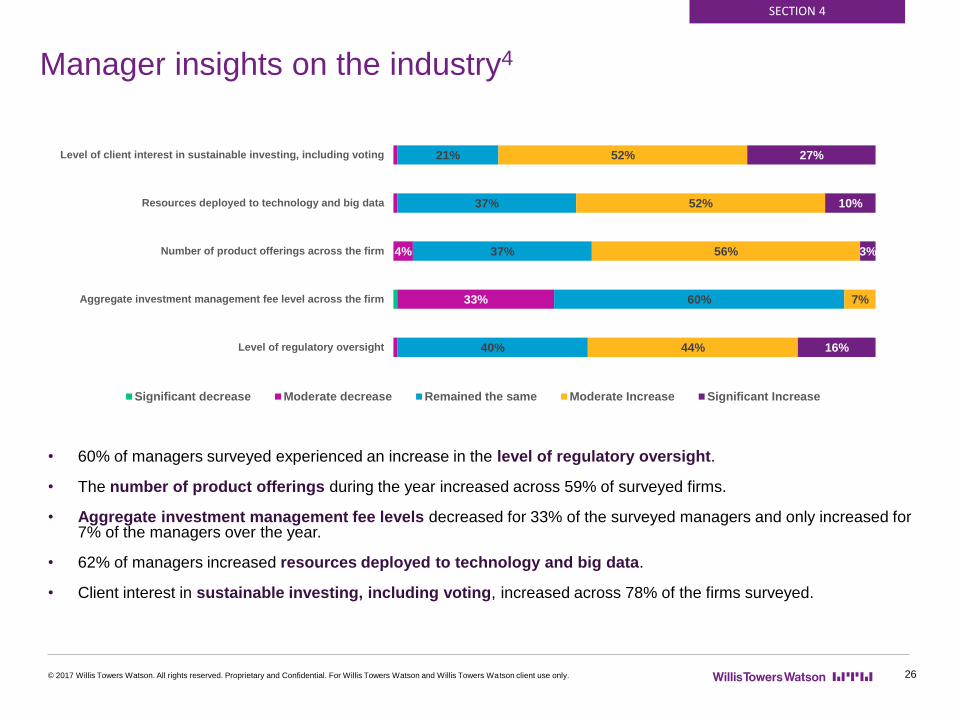
Manager insights on the industry4
26
• 60% of managers surveyed experienced an increase in the level of regulatory oversight.
• The number of product offerings during the year increased across 59% of surveyed firms.
• Aggregate investment management fee levels decreased for 33% of the surveyed managers and only increased for 7% of the managers over the year.
• 62% of managers increased resources deployed to technology and big data.
• Client interest in sustainable investing, including voting, increased across 78% of the firms surveyed.
SECTION 4
© 2017 Willis Towers Watson. All rights reserved. Proprietary and Confidential. For Willis Towers Watson and Willis Towers Watson client use only.
ContactRaashid NayeemWillis Towers Watson Investment +44 207 170 [email protected]
Limitations of reliance – Willis Towers Watson
In preparing this report at times we have relied upon data supplied to us by third parties. While
reasonable care has been taken to gauge the reliability of this data, this report carries no
guarantee of accuracy or completeness and Willis Towers Watson cannot be held accountable
for the misrepresentation of data by third parties involved.
This report is based on information available to Willis Towers Watson at the date of the report
and takes no account of subsequent developments after that date. It may not be modified or
provided to any other party without Willis Towers Watson’s prior written permission. It may also
not be disclosed to any other party without Willis Towers Watson’s prior written permission
except as may be required by law. In the absence of our express written agreement to the
contrary, Willis Towers Watson accepts no responsibility for any consequences arising from
any third party relying on this report or the opinions we have expressed. This report is not
intended by Willis Towers Watson to form a basis of any decision by a third party to do or omit
to do anything.
27

© 2017 Willis Towers Watson. All rights reserved. Proprietary and Confidential. For Willis Towers Watson and Willis Towers Watson client use only.
Complete Ranking
In US$ millions
Appendix
28
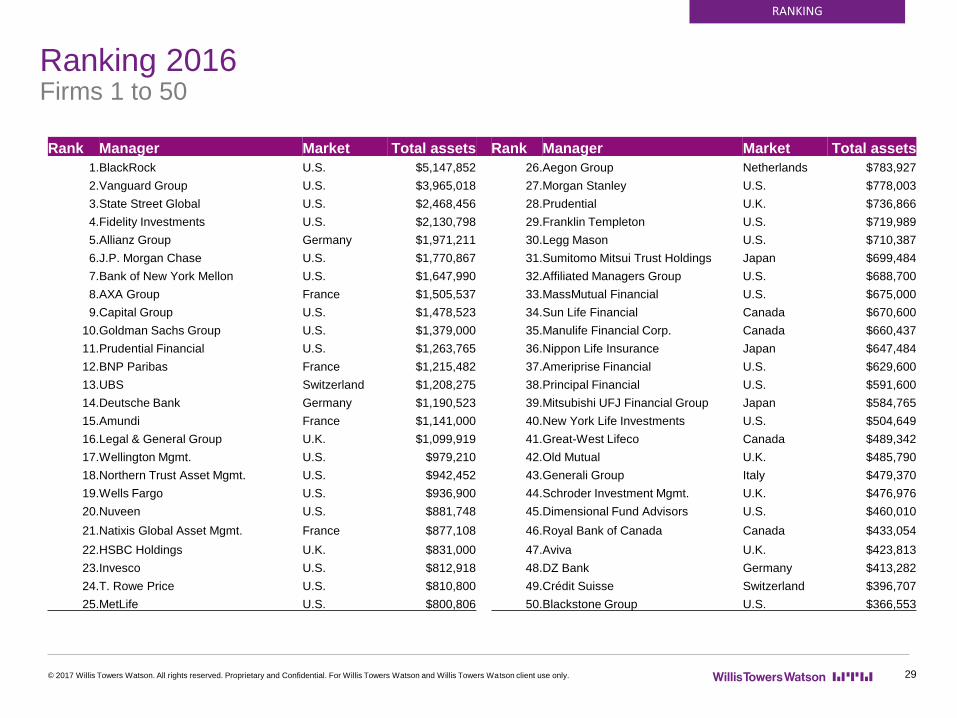
Ranking 2016 Firms 1 to 50
© 2017 Willis Towers Watson. All rights reserved. Proprietary and Confidential. For Willis Towers Watson and Willis Towers Watson client use only.
RANKING
29
Rank Manager Market Total assets Rank Manager Market Total assets
1.BlackRock U.S. $5,147,852 26.Aegon Group Netherlands $783,927
2.Vanguard Group U.S. $3,965,018 27.Morgan Stanley U.S. $778,003
3.State Street Global U.S. $2,468,456 28.Prudential U.K. $736,866
4.Fidelity Investments U.S. $2,130,798 29.Franklin Templeton U.S. $719,989
5.Allianz Group Germany $1,971,211 30.Legg Mason U.S. $710,387
6.J.P. Morgan Chase U.S. $1,770,867 31.Sumitomo Mitsui Trust Holdings Japan $699,484
7.Bank of New York Mellon U.S. $1,647,990 32.Affiliated Managers Group U.S. $688,700
8.AXA Group France $1,505,537 33.MassMutual Financial U.S. $675,000
9.Capital Group U.S. $1,478,523 34.Sun Life Financial Canada $670,600
10.Goldman Sachs Group U.S. $1,379,000 35.Manulife Financial Corp. Canada $660,437
11.Prudential Financial U.S. $1,263,765 36.Nippon Life Insurance Japan $647,484
12.BNP Paribas France $1,215,482 37.Ameriprise Financial U.S. $629,600
13.UBS Switzerland $1,208,275 38.Principal Financial U.S. $591,600
14.Deutsche Bank Germany $1,190,523 39.Mitsubishi UFJ Financial Group Japan $584,765
15.Amundi France $1,141,000 40.New York Life Investments U.S. $504,649
16.Legal & General Group U.K. $1,099,919 41.Great-West Lifeco Canada $489,342
17.Wellington Mgmt. U.S. $979,210 42.Old Mutual U.K. $485,790
18.Northern Trust Asset Mgmt. U.S. $942,452 43.Generali Group Italy $479,370
19.Wells Fargo U.S. $936,900 44.Schroder Investment Mgmt. U.K. $476,976
20.Nuveen U.S. $881,748 45.Dimensional Fund Advisors U.S. $460,010
21.Natixis Global Asset Mgmt. France $877,108 46.Royal Bank of Canada Canada $433,054
22.HSBC Holdings U.K. $831,000 47.Aviva U.K. $423,813
23.Invesco U.S. $812,918 48.DZ Bank Germany $413,282
24.T. Rowe Price U.S. $810,800 49.Crédit Suisse Switzerland $396,707
25.MetLife U.S. $800,806 50.Blackstone Group U.S. $366,553
Rank Manager Market Total assets Rank Manager Market Total assets
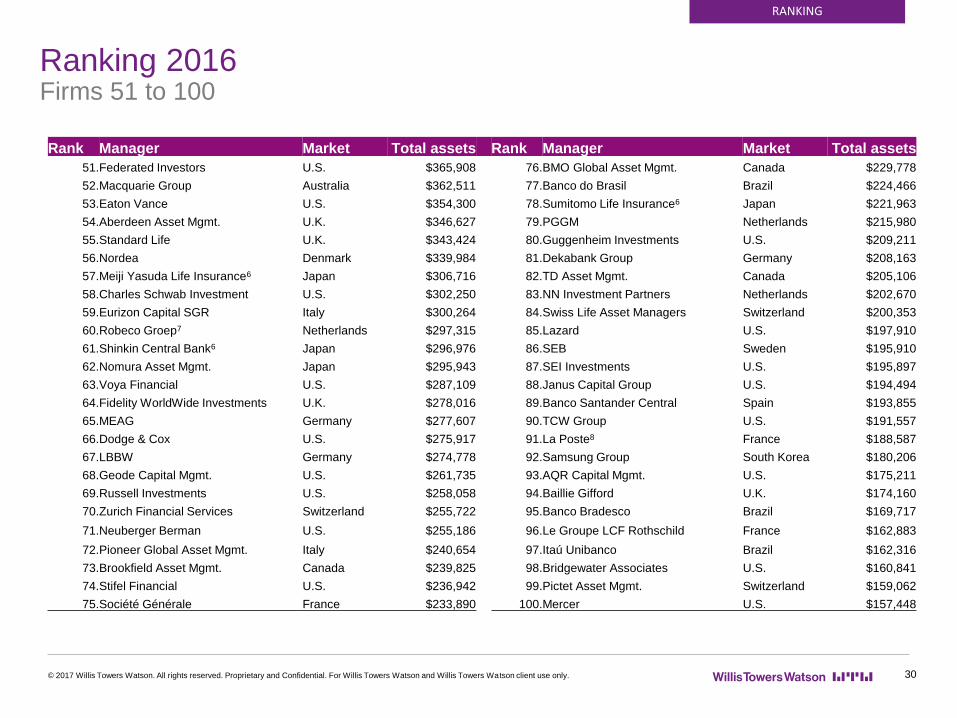
51.Federated Investors U.S. $365,908 76.BMO Global Asset Mgmt. Canada $229,778
52.Macquarie Group Australia $362,511 77.Banco do Brasil Brazil $224,466
53.Eaton Vance U.S. $354,300 78.Sumitomo Life Insurance6 Japan $221,963
54.Aberdeen Asset Mgmt. U.K. $346,627 79.PGGM Netherlands $215,980
55.Standard Life U.K. $343,424 80.Guggenheim Investments U.S. $209,211
56.Nordea Denmark $339,984 81.Dekabank Group Germany $208,163
57.Meiji Yasuda Life Insurance6 Japan $306,716 82.TD Asset Mgmt. Canada $205,106
58.Charles Schwab Investment U.S. $302,250 83.NN Investment Partners Netherlands $202,670
59.Eurizon Capital SGR Italy $300,264 84.Swiss Life Asset Managers Switzerland $200,353
60.Robeco Groep7 Netherlands $297,315 85.Lazard U.S. $197,910
61.Shinkin Central Bank6 Japan $296,976 86.SEB Sweden $195,910
62.Nomura Asset Mgmt. Japan $295,943 87.SEI Investments U.S. $195,897
63.Voya Financial U.S. $287,109 88.Janus Capital Group U.S. $194,494
64.Fidelity WorldWide Investments U.K. $278,016 89.Banco Santander Central Spain $193,855
65.MEAG Germany $277,607 90.TCW Group U.S. $191,557
66.Dodge & Cox U.S. $275,917 91.La Poste8 France $188,587
67.LBBW Germany $274,778 92.Samsung Group South Korea $180,206
68.Geode Capital Mgmt. U.S. $261,735 93.AQR Capital Mgmt. U.S. $175,211
69.Russell Investments U.S. $258,058 94.Baillie Gifford U.K. $174,160
70.Zurich Financial Services Switzerland $255,722 95.Banco Bradesco Brazil $169,717
71.Neuberger Berman U.S. $255,186 96.Le Groupe LCF Rothschild France $162,883
72.Pioneer Global Asset Mgmt. Italy $240,654 97.Itaú Unibanco Brazil $162,316
73.Brookfield Asset Mgmt. Canada $239,825 98.Bridgewater Associates U.S. $160,841
74.Stifel Financial U.S. $236,942 99.Pictet Asset Mgmt. Switzerland $159,062
75.Société Générale France $233,890 100.Mercer U.S. $157,448
Ranking 2016 Firms 51 to 100
© 2017 Willis Towers Watson. All rights reserved. Proprietary and Confidential. For Willis Towers Watson and Willis Towers Watson client use only.
RANKING
30

Rank Manager Market Total assets Rank Manager Market Total assets
101.American Century U.S. $156,764 126.Mizuho Financial Group Japan $109,690
102.Colonial First State Australia $147,154 127.Candriam Belgium $107,358
103.Scotiabank9 Canada $143,064 128.PRIMECAP U.S. $106,294
104.EFG International Switzerland $141,800 129.Payden & Rygel U.S. $106,000
105.Zürcher Kantonalbank Switzerland $141,557 130.CIBC Asset Mgmt. Canada $105,372
106.Resona Holdings Japan $139,687 131.IGM Financial Group Canada $105,295
107.PNC Financial U.S. $137,182 132.Groupama Asset Mgmt. France $101,933
108.Lord, Abbett U.S. $136,249 133.Oaktree Capital U.S. $100,504
109.Harvest Fund Mgmt. China16 $136,221 134.Covéa Group France $98,297
110.BBVA Spain $136,183 135.First Eagle Investment U.S. $97,065
111.NISA Investment U.S. $135,667 136.LSV Asset Mgmt. U.S. $97,043
112.Nikko Asset Mgmt. Japan $133,349 137.Mesirow Financial U.S. $96,904
113.Mn Services Netherlands $130,273 138.Artisan Partners U.S. $96,845
114.Kohlberg Kravis Roberts U.S. $129,556 139.Ares Mgmt. U.S. $95,259
115.Swedbank Sweden $128,700 140.Pearl Group U.K. $93,492
116.Nationwide U.S. $127,433 141.Crédit Mutuel France $92,819
117.Royal London Group U.K. $122,500 142.New England Asset Mgmt. U.S. $91,786
118.Henderson Global Investors U.K. $120,733 143.CI Financial Canada $89,522
119.Danske Bank Denmark $120,179 144.Vontobel Asset Mgmt. Switzerland $88,506
120.AMP Capital Australia $119,476 145.Caixa Economica Federal Brazil $87,895
121.GAM Holding Switzerland $118,433 146.Mirae Asset Financial Group South Korea $87,404
122.Union Bancaire Privée Switzerland $116,361 147.Fiera Capital Canada $86,806
123.China Asset Mgmt. China16 $115,367 148.CBRE Global Investors U.S. $86,600
124.Investec Asset Mgmt. South Africa $113,336 149.Willis Towers Watson Ireland $86,400
125.Talanx Group Germany $112,914 150.Caixabank Spain $86,275
Ranking 2016 Firms 101 to 150
© 2017 Willis Towers Watson. All rights reserved. Proprietary and Confidential. For Willis Towers Watson and Willis Towers Watson client use only.
RANKING
31
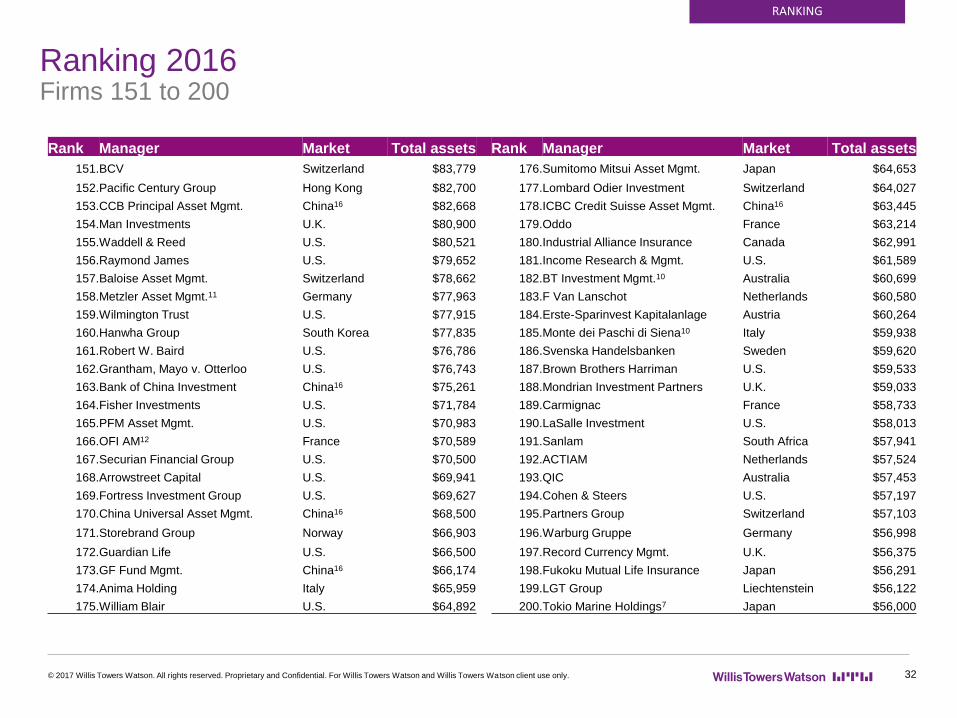
Rank Manager Market Total assets Rank Manager Market Total assets
151.BCV Switzerland $83,779 176.Sumitomo Mitsui Asset Mgmt. Japan $64,653
152.Pacific Century Group Hong Kong $82,700 177.Lombard Odier Investment Switzerland $64,027
153.CCB Principal Asset Mgmt. China16 $82,668 178.ICBC Credit Suisse Asset Mgmt. China16 $63,445
154.Man Investments U.K. $80,900 179.Oddo France $63,214
155.Waddell & Reed U.S. $80,521 180.Industrial Alliance Insurance Canada $62,991
156.Raymond James U.S. $79,652 181.Income Research & Mgmt. U.S. $61,589
157.Baloise Asset Mgmt. Switzerland $78,662 182.BT Investment Mgmt.10 Australia $60,699
158.Metzler Asset Mgmt.11 Germany $77,963 183.F Van Lanschot Netherlands $60,580
159.Wilmington Trust U.S. $77,915 184.Erste-Sparinvest Kapitalanlage Austria $60,264
160.Hanwha Group South Korea $77,835 185.Monte dei Paschi di Siena10 Italy $59,938
161.Robert W. Baird U.S. $76,786 186.Svenska Handelsbanken Sweden $59,620
162.Grantham, Mayo v. Otterloo U.S. $76,743 187.Brown Brothers Harriman U.S. $59,533
163.Bank of China Investment China16 $75,261 188.Mondrian Investment Partners U.K. $59,033
164.Fisher Investments U.S. $71,784 189.Carmignac France $58,733
165.PFM Asset Mgmt. U.S. $70,983 190.LaSalle Investment U.S. $58,013
166.OFI AM12 France $70,589 191.Sanlam South Africa $57,941
167.Securian Financial Group U.S. $70,500 192.ACTIAM Netherlands $57,524
168.Arrowstreet Capital U.S. $69,941 193.QIC Australia $57,453
169.Fortress Investment Group U.S. $69,627 194.Cohen & Steers U.S. $57,197
170.China Universal Asset Mgmt. China16 $68,500 195.Partners Group Switzerland $57,103
171.Storebrand Group Norway $66,903 196.Warburg Gruppe Germany $56,998
172.Guardian Life U.S. $66,500 197.Record Currency Mgmt. U.K. $56,375
173.GF Fund Mgmt. China16 $66,174 198.Fukoku Mutual Life Insurance Japan $56,291
174.Anima Holding Italy $65,959 199.LGT Group Liechtenstein $56,122
175.William Blair U.S. $64,892 200.Tokio Marine Holdings7 Japan $56,000
Ranking 2016 Firms 151 to 200
© 2017 Willis Towers Watson. All rights reserved. Proprietary and Confidential. For Willis Towers Watson and Willis Towers Watson client use only.
RANKING
32
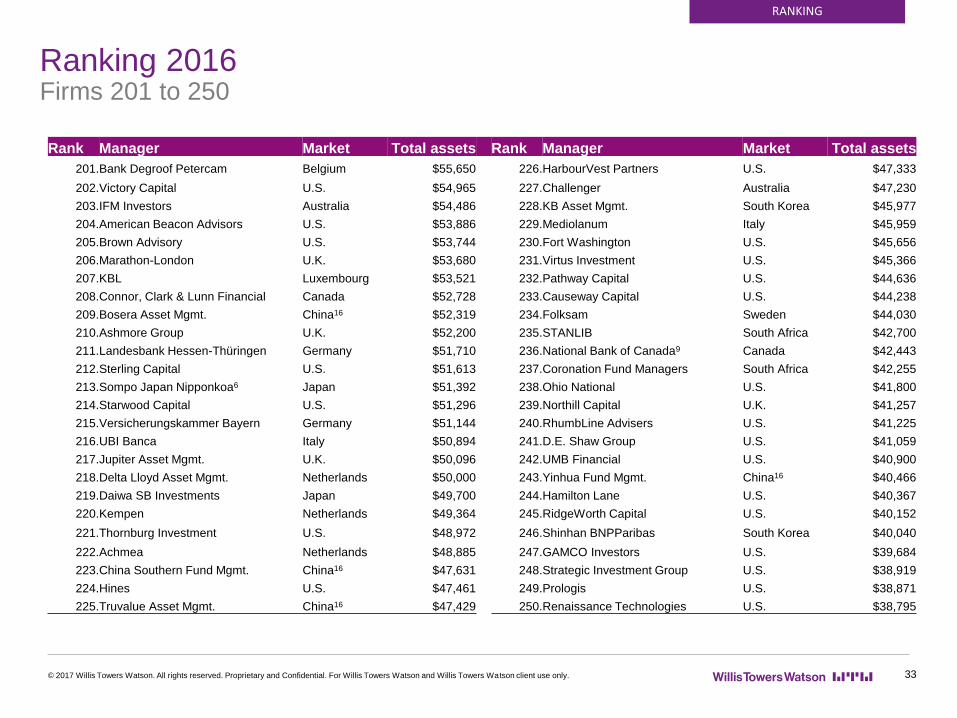
Rank Manager Market Total assets Rank Manager Market Total assets
201.Bank Degroof Petercam Belgium $55,650 226.HarbourVest Partners U.S. $47,333
202.Victory Capital U.S. $54,965 227.Challenger Australia $47,230
203.IFM Investors Australia $54,486 228.KB Asset Mgmt. South Korea $45,977
204.American Beacon Advisors U.S. $53,886 229.Mediolanum Italy $45,959
205.Brown Advisory U.S. $53,744 230.Fort Washington U.S. $45,656
206.Marathon-London U.K. $53,680 231.Virtus Investment U.S. $45,366
207.KBL Luxembourg $53,521 232.Pathway Capital U.S. $44,636
208.Connor, Clark & Lunn Financial Canada $52,728 233.Causeway Capital U.S. $44,238
209.Bosera Asset Mgmt. China16 $52,319 234.Folksam Sweden $44,030
210.Ashmore Group U.K. $52,200 235.STANLIB South Africa $42,700
211.Landesbank Hessen-Thüringen Germany $51,710 236.National Bank of Canada9 Canada $42,443
212.Sterling Capital U.S. $51,613 237.Coronation Fund Managers South Africa $42,255
213.Sompo Japan Nipponkoa6 Japan $51,392 238.Ohio National U.S. $41,800
214.Starwood Capital U.S. $51,296 239.Northill Capital U.K. $41,257
215.Versicherungskammer Bayern Germany $51,144 240.RhumbLine Advisers U.S. $41,225
216.UBI Banca Italy $50,894 241.D.E. Shaw Group U.S. $41,059
217.Jupiter Asset Mgmt. U.K. $50,096 242.UMB Financial U.S. $40,900
218.Delta Lloyd Asset Mgmt. Netherlands $50,000 243.Yinhua Fund Mgmt. China16 $40,466
219.Daiwa SB Investments Japan $49,700 244.Hamilton Lane U.S. $40,367
220.Kempen Netherlands $49,364 245.RidgeWorth Capital U.S. $40,152
221.Thornburg Investment U.S. $48,972 246.Shinhan BNPParibas South Korea $40,040
222.Achmea Netherlands $48,885 247.GAMCO Investors U.S. $39,684
223.China Southern Fund Mgmt. China16 $47,631 248.Strategic Investment Group U.S. $38,919
224.Hines U.S. $47,461 249.Prologis U.S. $38,871
225.Truvalue Asset Mgmt. China16 $47,429 250.Renaissance Technologies U.S. $38,795
Ranking 2016 Firms 201 to 250
© 2017 Willis Towers Watson. All rights reserved. Proprietary and Confidential. For Willis Towers Watson and Willis Towers Watson client use only.
RANKING
33
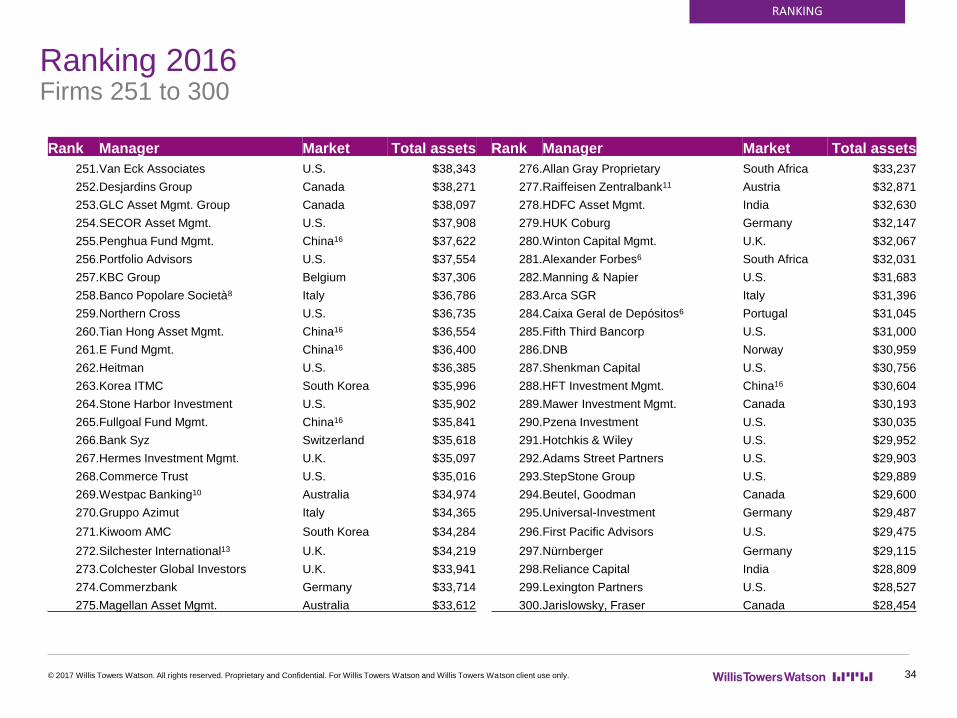
Rank Manager Market Total assets Rank Manager Market Total assets
251.Van Eck Associates U.S. $38,343 276.Allan Gray Proprietary South Africa $33,237
252.Desjardins Group Canada $38,271 277.Raiffeisen Zentralbank11 Austria $32,871
253.GLC Asset Mgmt. Group Canada $38,097 278.HDFC Asset Mgmt. India $32,630
254.SECOR Asset Mgmt. U.S. $37,908 279.HUK Coburg Germany $32,147
255.Penghua Fund Mgmt. China16 $37,622 280.Winton Capital Mgmt. U.K. $32,067
256.Portfolio Advisors U.S. $37,554 281.Alexander Forbes6 South Africa $32,031
257.KBC Group Belgium $37,306 282.Manning & Napier U.S. $31,683
258.Banco Popolare Società8 Italy $36,786 283.Arca SGR Italy $31,396
259.Northern Cross U.S. $36,735 284.Caixa Geral de Depósitos6 Portugal $31,045
260.Tian Hong Asset Mgmt. China16 $36,554 285.Fifth Third Bancorp U.S. $31,000
261.E Fund Mgmt. China16 $36,400 286.DNB Norway $30,959
262.Heitman U.S. $36,385 287.Shenkman Capital U.S. $30,756
263.Korea ITMC South Korea $35,996 288.HFT Investment Mgmt. China16 $30,604
264.Stone Harbor Investment U.S. $35,902 289.Mawer Investment Mgmt. Canada $30,193
265.Fullgoal Fund Mgmt. China16 $35,841 290.Pzena Investment U.S. $30,035
266.Bank Syz Switzerland $35,618 291.Hotchkis & Wiley U.S. $29,952
267.Hermes Investment Mgmt. U.K. $35,097 292.Adams Street Partners U.S. $29,903
268.Commerce Trust U.S. $35,016 293.StepStone Group U.S. $29,889
269.Westpac Banking10 Australia $34,974 294.Beutel, Goodman Canada $29,600
270.Gruppo Azimut Italy $34,365 295.Universal-Investment Germany $29,487
271.Kiwoom AMC South Korea $34,284 296.First Pacific Advisors U.S. $29,475
272.Silchester International13 U.K. $34,219 297.Nürnberger Germany $29,115
273.Colchester Global Investors U.K. $33,941 298.Reliance Capital India $28,809
274.Commerzbank Germany $33,714 299.Lexington Partners U.S. $28,527
275.Magellan Asset Mgmt. Australia $33,612 300.Jarislowsky, Fraser Canada $28,454
Ranking 2016 Firms 251 to 300
© 2017 Willis Towers Watson. All rights reserved. Proprietary and Confidential. For Willis Towers Watson and Willis Towers Watson client use only.
RANKING
34
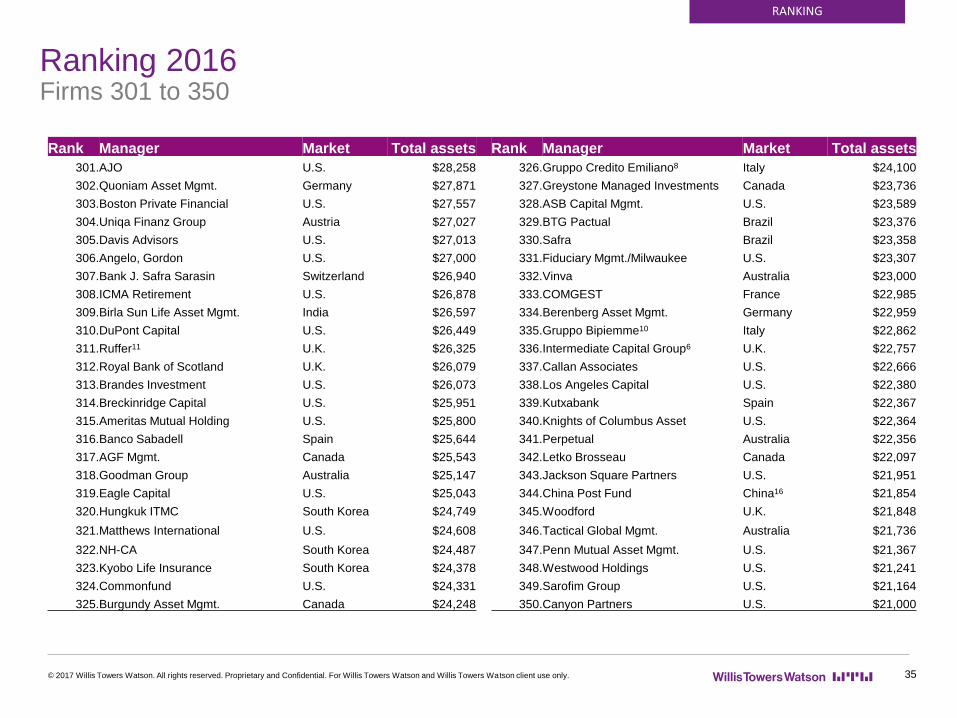
Ranking 2016 Firms 301 to 350
© 2017 Willis Towers Watson. All rights reserved. Proprietary and Confidential. For Willis Towers Watson and Willis Towers Watson client use only.
RANKING
35
Rank Manager Market Total assets Rank Manager Market Total assets
301.AJO U.S. $28,258 326.Gruppo Credito Emiliano8 Italy $24,100
302.Quoniam Asset Mgmt. Germany $27,871 327.Greystone Managed Investments Canada $23,736
303.Boston Private Financial U.S. $27,557 328.ASB Capital Mgmt. U.S. $23,589
304.Uniqa Finanz Group Austria $27,027 329.BTG Pactual Brazil $23,376
305.Davis Advisors U.S. $27,013 330.Safra Brazil $23,358
306.Angelo, Gordon U.S. $27,000 331.Fiduciary Mgmt./Milwaukee U.S. $23,307
307.Bank J. Safra Sarasin Switzerland $26,940 332.Vinva Australia $23,000
308.ICMA Retirement U.S. $26,878 333.COMGEST France $22,985
309.Birla Sun Life Asset Mgmt. India $26,597 334.Berenberg Asset Mgmt. Germany $22,959
310.DuPont Capital U.S. $26,449 335.Gruppo Bipiemme10 Italy $22,862
311.Ruffer11 U.K. $26,325 336.Intermediate Capital Group6 U.K. $22,757
312.Royal Bank of Scotland U.K. $26,079 337.Callan Associates U.S. $22,666
313.Brandes Investment U.S. $26,073 338.Los Angeles Capital U.S. $22,380
314.Breckinridge Capital U.S. $25,951 339.Kutxabank Spain $22,367
315.Ameritas Mutual Holding U.S. $25,800 340.Knights of Columbus Asset U.S. $22,364
316.Banco Sabadell Spain $25,644 341.Perpetual Australia $22,356
317.AGF Mgmt. Canada $25,543 342.Letko Brosseau Canada $22,097
318.Goodman Group Australia $25,147 343.Jackson Square Partners U.S. $21,951
319.Eagle Capital U.S. $25,043 344.China Post Fund China16 $21,854
320.Hungkuk ITMC South Korea $24,749 345.Woodford U.K. $21,848
321.Matthews International U.S. $24,608 346.Tactical Global Mgmt. Australia $21,736
322.NH-CA South Korea $24,487 347.Penn Mutual Asset Mgmt. U.S. $21,367
323.Kyobo Life Insurance South Korea $24,378 348.Westwood Holdings U.S. $21,241
324.Commonfund U.S. $24,331 349.Sarofim Group U.S. $21,164
325.Burgundy Asset Mgmt. Canada $24,248 350.Canyon Partners U.S. $21,000
Ranking 2016 Firms 351 to 400
© 2017 Willis Towers Watson. All rights reserved. Proprietary and Confidential. For Willis Towers Watson and Willis Towers Watson client use only.
RANKING
36
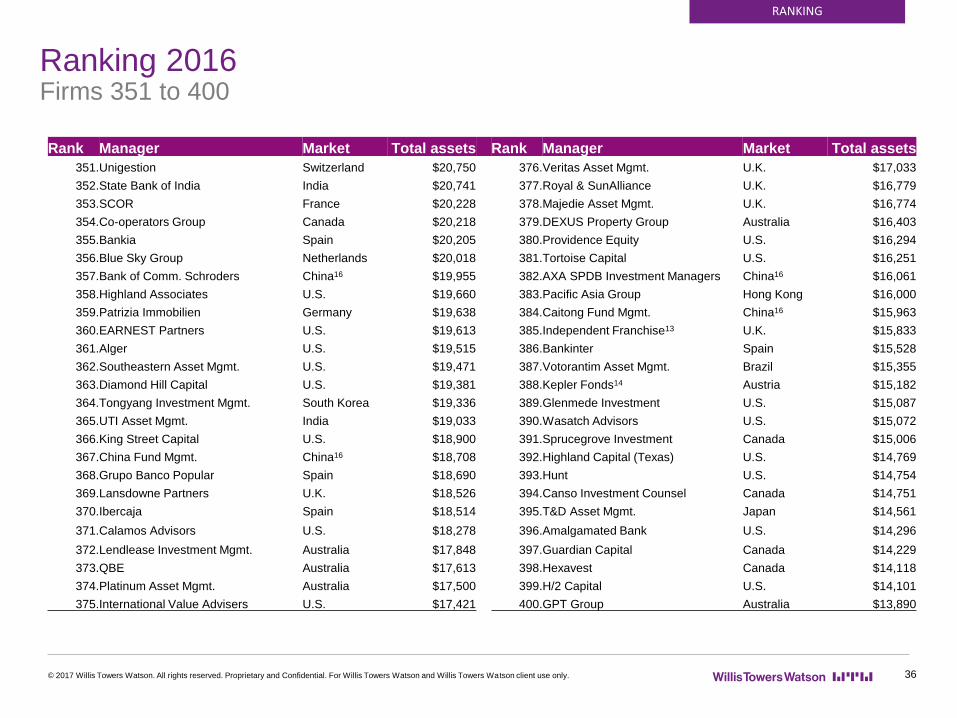
Rank Manager Market Total assets Rank Manager Market Total assets
351.Unigestion Switzerland $20,750 376.Veritas Asset Mgmt. U.K. $17,033
352.State Bank of India India $20,741 377.Royal & SunAlliance U.K. $16,779
353.SCOR France $20,228 378.Majedie Asset Mgmt. U.K. $16,774
354.Co-operators Group Canada $20,218 379.DEXUS Property Group Australia $16,403
355.Bankia Spain $20,205 380.Providence Equity U.S. $16,294
356.Blue Sky Group Netherlands $20,018 381.Tortoise Capital U.S. $16,251
357.Bank of Comm. Schroders China16 $19,955 382.AXA SPDB Investment Managers China16 $16,061
358.Highland Associates U.S. $19,660 383.Pacific Asia Group Hong Kong $16,000
359.Patrizia Immobilien Germany $19,638 384.Caitong Fund Mgmt. China16 $15,963
360.EARNEST Partners U.S. $19,613 385.Independent Franchise13 U.K. $15,833
361.Alger U.S. $19,515 386.Bankinter Spain $15,528
362.Southeastern Asset Mgmt. U.S. $19,471 387.Votorantim Asset Mgmt. Brazil $15,355
363.Diamond Hill Capital U.S. $19,381 388.Kepler Fonds14 Austria $15,182
364.Tongyang Investment Mgmt. South Korea $19,336 389.Glenmede Investment U.S. $15,087
365.UTI Asset Mgmt. India $19,033 390.Wasatch Advisors U.S. $15,072
366.King Street Capital U.S. $18,900 391.Sprucegrove Investment Canada $15,006
367.China Fund Mgmt. China16 $18,708 392.Highland Capital (Texas) U.S. $14,769
368.Grupo Banco Popular Spain $18,690 393.Hunt U.S. $14,754
369.Lansdowne Partners U.K. $18,526 394.Canso Investment Counsel Canada $14,751
370.Ibercaja Spain $18,514 395.T&D Asset Mgmt. Japan $14,561
371.Calamos Advisors U.S. $18,278 396.Amalgamated Bank U.S. $14,296
372.Lendlease Investment Mgmt. Australia $17,848 397.Guardian Capital Canada $14,229
373.QBE Australia $17,613 398.Hexavest Canada $14,118
374.Platinum Asset Mgmt. Australia $17,500 399.H/2 Capital U.S. $14,101
375.International Value Advisers U.S. $17,421 400.GPT Group Australia $13,890
Ranking 2016 Firms 401 to 450
© 2017 Willis Towers Watson. All rights reserved. Proprietary and Confidential. For Willis Towers Watson and Willis Towers Watson client use only.
RANKING
37
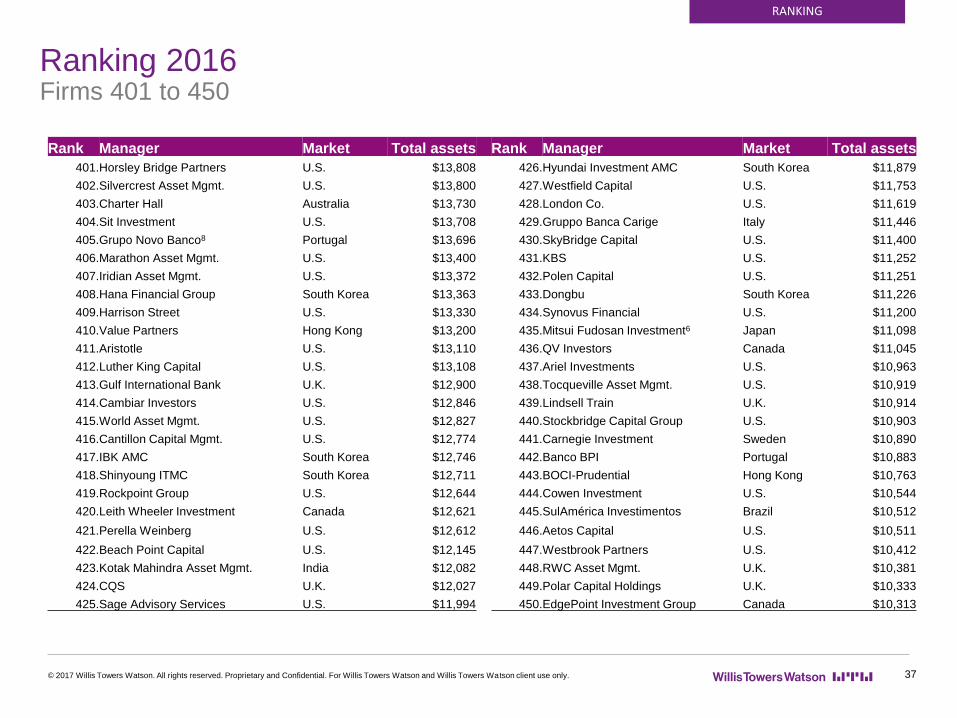
Rank Manager Market Total assets Rank Manager Market Total assets
401.Horsley Bridge Partners U.S. $13,808 426.Hyundai Investment AMC South Korea $11,879
402.Silvercrest Asset Mgmt. U.S. $13,800 427.Westfield Capital U.S. $11,753
403.Charter Hall Australia $13,730 428.London Co. U.S. $11,619
404.Sit Investment U.S. $13,708 429.Gruppo Banca Carige Italy $11,446
405.Grupo Novo Banco8 Portugal $13,696 430.SkyBridge Capital U.S. $11,400
406.Marathon Asset Mgmt. U.S. $13,400 431.KBS U.S. $11,252
407.Iridian Asset Mgmt. U.S. $13,372 432.Polen Capital U.S. $11,251
408.Hana Financial Group South Korea $13,363 433.Dongbu South Korea $11,226
409.Harrison Street U.S. $13,330 434.Synovus Financial U.S. $11,200
410.Value Partners Hong Kong $13,200 435.Mitsui Fudosan Investment6 Japan $11,098
411.Aristotle U.S. $13,110 436.QV Investors Canada $11,045
412.Luther King Capital U.S. $13,108 437.Ariel Investments U.S. $10,963
413.Gulf International Bank U.K. $12,900 438.Tocqueville Asset Mgmt. U.S. $10,919
414.Cambiar Investors U.S. $12,846 439.Lindsell Train U.K. $10,914
415.World Asset Mgmt. U.S. $12,827 440.Stockbridge Capital Group U.S. $10,903
416.Cantillon Capital Mgmt. U.S. $12,774 441.Carnegie Investment Sweden $10,890
417.IBK AMC South Korea $12,746 442.Banco BPI Portugal $10,883
418.Shinyoung ITMC South Korea $12,711 443.BOCI-Prudential Hong Kong $10,763
419.Rockpoint Group U.S. $12,644 444.Cowen Investment U.S. $10,544
420.Leith Wheeler Investment Canada $12,621 445.SulAmérica Investimentos Brazil $10,512
421.Perella Weinberg U.S. $12,612 446.Aetos Capital U.S. $10,511
422.Beach Point Capital U.S. $12,145 447.Westbrook Partners U.S. $10,412
423.Kotak Mahindra Asset Mgmt. India $12,082 448.RWC Asset Mgmt. U.K. $10,381
424.CQS U.K. $12,027 449.Polar Capital Holdings U.K. $10,333
425.Sage Advisory Services U.S. $11,994 450.EdgePoint Investment Group Canada $10,313
Ranking 2016 Firms 451 to 500
© 2017 Willis Towers Watson. All rights reserved. Proprietary and Confidential. For Willis Towers Watson and Willis Towers Watson client use only.
RANKING
38
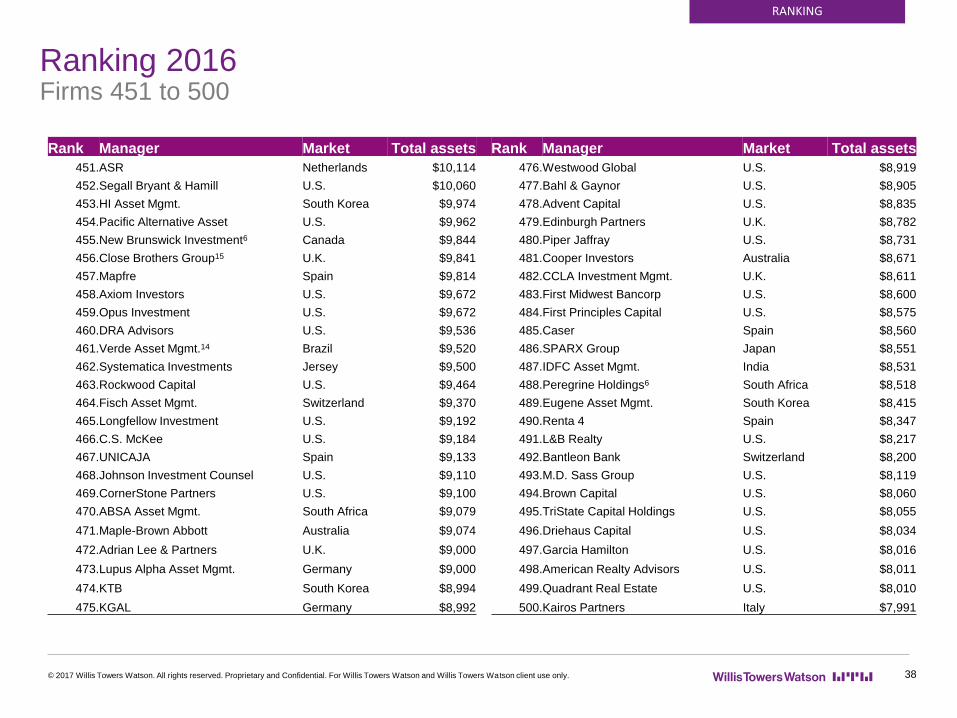
Rank Manager Market Total assets Rank Manager Market Total assets
451.ASR Netherlands $10,114 476.Westwood Global U.S. $8,919
452.Segall Bryant & Hamill U.S. $10,060 477.Bahl & Gaynor U.S. $8,905
453.HI Asset Mgmt. South Korea $9,974 478.Advent Capital U.S. $8,835
454.Pacific Alternative Asset U.S. $9,962 479.Edinburgh Partners U.K. $8,782
455.New Brunswick Investment6 Canada $9,844 480.Piper Jaffray U.S. $8,731
456.Close Brothers Group15 U.K. $9,841 481.Cooper Investors Australia $8,671
457.Mapfre Spain $9,814 482.CCLA Investment Mgmt. U.K. $8,611
458.Axiom Investors U.S. $9,672 483.First Midwest Bancorp U.S. $8,600
459.Opus Investment U.S. $9,672 484.First Principles Capital U.S. $8,575
460.DRA Advisors U.S. $9,536 485.Caser Spain $8,560
461.Verde Asset Mgmt.14 Brazil $9,520 486.SPARX Group Japan $8,551
462.Systematica Investments Jersey $9,500 487.IDFC Asset Mgmt. India $8,531
463.Rockwood Capital U.S. $9,464 488.Peregrine Holdings6 South Africa $8,518
464.Fisch Asset Mgmt. Switzerland $9,370 489.Eugene Asset Mgmt. South Korea $8,415
465.Longfellow Investment U.S. $9,192 490.Renta 4 Spain $8,347
466.C.S. McKee U.S. $9,184 491.L&B Realty U.S. $8,217
467.UNICAJA Spain $9,133 492.Bantleon Bank Switzerland $8,200
468.Johnson Investment Counsel U.S. $9,110 493.M.D. Sass Group U.S. $8,119
469.CornerStone Partners U.S. $9,100 494.Brown Capital U.S. $8,060
470.ABSA Asset Mgmt. South Africa $9,079 495.TriState Capital Holdings U.S. $8,055
471.Maple-Brown Abbott Australia $9,074 496.Driehaus Capital U.S. $8,034
472.Adrian Lee & Partners U.K. $9,000 497.Garcia Hamilton U.S. $8,016
473.Lupus Alpha Asset Mgmt. Germany $9,000 498.American Realty Advisors U.S. $8,011
474.KTB South Korea $8,994 499.Quadrant Real Estate U.S. $8,010
475.KGAL Germany $8,992 500.Kairos Partners Italy $7,991

© 2017 Willis Towers Watson. All rights reserved. Proprietary and Confidential. For Willis Towers Watson and Willis Towers Watson client use only.
Definitions used and footnotes
39
• This analysis is focused on Discretionary Assets under Management. These refers to assets managers take decisions on as opposed to assets they advises on.
• Examples of assets which would not be consistent with the term 'discretionary assets under management' include the following:
• Saving/Current Accounts
• Assets under administration and custody
• Money Market funds
• Advisory portfolios
• Assets held for purely transactional purposes
• Company assets unrelated to investment business
© 2017 Willis Towers Watson. All rights reserved. Proprietary and Confidential. For Willis Towers Watson and Willis Towers Watson client use only. 40
• Factor Based Strategies are described as a rules-based strategy that selects securities according to fundamental or technical characteristics identified through research. Examples of factors are size, value, momentum, volatility, credit risk and quality. Factor-based strategies are sometimes called “Smart beta”. This definition excludes all enhanced and market-cap weighted strategies.
Definitions used
• Alternatives can include Private equity (including venture capital), Hedge funds, Funds of funds, Real estate, Infrastructure, Commodities, Real assets, Illiquid credit and Insurance-linked investments strategies.
© 2017 Willis Towers Watson. All rights reserved. Proprietary and Confidential. For Willis Towers Watson and Willis Towers Watson client use only. 41
Footnotes
1 Based on a subset of asset managers in the 2016 ranking who provided relevant data for all years since 2012.
2 Assets under Management for Japan decreased in 2016 because of the country reclassification for a company included
under Japan in prior editions of the ranking. Controlling for that company, AUM increased 0.4% in 2016.
3 Dataset has been changed from previous years to reflect the inclusion of Real Estate under Other and of Cash as a
separate category.
4 Based on a subset of asset managers in the 2016 ranking who provided relevant data.
5 Definition of leading passive managers changed in 2014 to be more inclusive of global assets. Figures and charts have
been amended retrospectively to reflect this.
6 As of March 31, 2016.
7 As of June 30, 2017.
8 As of June 30, 2016.
9 As of October 31, 2016.
10 As of September 30, 2016.
11 As of May 31, 2017.
12 As of January 31, 2017.
13 As of April 30, 2017.
14 As of March 31, 2017.
15 As of July 31, 2016.
16 Information on Chinese fund managers was sourced from the available data from AMAC, Wind, and survey responses.