the value proposition for a diverse and inclusive ... diversity with inclusion... · 1 the value...
TRANSCRIPT
1
The Value Proposition for a Diverse and Inclusive Workforce Presented by the Division of Human Capital Services (HCS)
#Purple is Progress By 2025, Kansas State University (K-STATE) will be recognized as one of the Top 50 nationally ranked research institutions. We will achieve this vision by recruiting and retaining a highly talented, diverse workforce and fostering excellent teaching, research and service to Kansas, the nation and the international community.
This position paper outlines the value proposition for a diverse and inclusive workforce and supports the K-State 2025 Diversity Strategic Action Plan as created by the Office of Diversity in 2014. The Human Capital Services (HCS) plan spells out specific initiatives to address the recruitment and retention of a diverse workforce.
This paper defines diversity as social/group differences as it relates to race, ethnicity, color, class, gender, gender identity, sexual orientation, country of origin, ancestry, physical and mental ability, age, veteran status and generational compositions. It also in its definition embraces cultural, political, religious affiliations as well as individual differences such as personality and learning style and life experiences.
The diversity of a university’s faculty and staff influences its intellectual personality. Diversity within the faculty and s taff contributes to the richness of the environment for teaching and research. We also need diversity within the workforce to offer students the breadth of ideas that constitute a dynamic intellectual community, which in return aids in student learning and achievement.
A growing body of research provides evidence that diverse faculty and staff benefits our mission of teaching, research and service by increasing creativity, innovation, and problem-solving. Research shows that diverse workgroups are more productive, creative and innovative than homogeneous groups and suggests that developing a diverse faculty staff will enhance teaching and research.1
Moreover, in the last two decades, the world has become well socialized and overwhelmingly interconnected through the global economy. In order to effectively function and contribute in the field of Higher Education, we must adapt to the changing dynamics of the global landscape. The U.S. Census Bureau projects that by 2042, the United States will no longer be characterized by one single demographic majority. Foreign born people and people of color will constitute the majority of new entrants to our labor force. In order for K-STATE to serve its students, faculty, administration and research partners, it must also have a culturally competent and diverse workforce throughout all areas of the University. This will require dedication, innovation, and a worldview perspective to meet the complex demands of upcoming societal diversity trends.
In the decades following the passage of the Civil Rights Act of 1964, the field of Equal Employment Opportunity (EEO) has evolved from an exclusively legalistic model to the more proactive framework of diversity management. The globalization that has taken place over the past several years has spawned a new focus on inclusion, and its relationship to employee engagement and performance. Organizations realize that to remain viable in a global economy, it is not enough to recruit a diverse workforce, but we must also retain and leverage the diverse perspectives and talents of our internal human capital to sustain a competitive advantage in the marketplace. This too applies to the world of Higher Education.
2
Why Is Diversity with Inclusion Important?
Recent studies have shown that legal mandates for EEO and the presence of diversity are necessary but not sufficient to effectively manage organizational diversity (Herring, 2009).1,2 Organizations must have conditions in place to ensure that diverse perspectives are heard and all contributors are empowered. To achieve this, organizations must look internally at their cultures and processes that impact the employees’ ability to fully participate and contribute to its vision and mission. This requires examining and eliminating barriers to inclusion in all aspects of the organization. The aim is to build an inclusive organization as characterized by equal access to opportunity, culturally competent norms, transparent communications, participatory work processes and decision-making, constructive conflict management, leadership development, equitable rewards systems, and shared accountability. These inclusion characteristics are drivers of employee engagement and organizational performance; inclusion holds the key to actualizing the performance potential of workforce diversity.
As aforementioned, diversity goes beyond our race and gender, to include the diversity of thought that accompanies our human identity. It is the complex link between who we are and how we think that makes diversity such a key ingredient in organizational performance. Viewed this way, diversity management should encompass all employees, not only legally protected classes. This will strengthen the commitment to equal opportunity by expanding the stakeholders to the entire workforce, not just portions of it. Inclusion transcends insular interests, and therefore is championed by all.2
The Association of American Colleges and Universities (AAC&U) has constructed a concept of Inclusive Excellence (IE) as a way to recognize that an institution's success is dependent on how well it values, engages and includes the rich diversity of students, staff, faculty, administrators and alumni constituents. This comprehensive approach requires a fundamental transformation of the institution by embedding and practicing IE in every effort, aspect, and level of the university.3
In an endeavor to lead transformational change for student learning and achievement, AAC&U invites “equity-minded practitioners” to engage in necessary and sometimes difficult conversations and decision-making by considering the following principles:
Diversity: Individual differences (e.g., personality, learning styles, and life experiences) and group/social differences (e.g., race/ethnicity, class, gender, sexual orientation, country of origin, and ability as well as cultural, political, religious, or other affiliations).
Inclusion: The active, intentional, and ongoing engagement with diversity—in the curriculum, in the co-curriculum, and in communities (intellectual, social, cultural, geographical) with which individuals might connect—in ways that increase awareness, content knowledge, cognitive sophistication, and empathic understanding of the complex ways individuals interact within systems and institutions.
Equity: The creation of opportunities for historically underrepresented populations to have equal access to and participate in educational
programs that are capable of closing the achievement gaps in student success and completion. Equity-mindedness: A demonstrated awareness of and willingness to address equity issues among institutional leaders and staff (Center for
Urban Education, University of Southern California).
K-STATE is proud to champion a journey to build diversity and cultivate inclusion in our University as we strive to achieve our goal of becoming one of the Top 50 Public Research Universities in the country by 2025. HCS welcomes the opportunity to put in place strategic and tactical plans that will propel the achievement of the K-STATE vision and mission.
1 Herring, 2009; Chang et al., 2003; ACE and AAUP, 2000 2 The Human Equity Advantage, Beyond Diversity to Talent Optimization, June 4, 2013 3 http://www.aacu.org/resources/diversity-equity-and-inclusive-excellence
3
Call To Action
As HCS works collaboratively with K-STATE stakeholders to continue the journey of enveloping a diverse and inclusive workforce we will continuously review our processes, systems and metrics to support workplace diversity with inclusion.
Workplace Inclusion
There are many ways of assessing workplace inclusion. One commonly accepted method is to examine employee perceptions based on their responses to inclusion related items in employee surveys. The Chronicle of Higher Education suggests “great colleges achieve excellence in at least one of these 12 categories”. The categories are:
Collaborative Governance – Faculty members play significant roles in decisions related to academic programs. Compensation and Benefits – Pay is fair, and there is overall satisfaction with total rewards. Confidence in Senior Leadership – Leaders have knowledge, skills and experience necessary for the success of the college. Diversity – The University makes a concerted effort to create a welcoming and fair environment for all employees. Facilities, Workspace and Security – Facilities meet employees’ needs and the campus appearance is pleasing. Job Satisfaction – There is an overall sense that the job is meaningful to the employee and to the college. Professional/Career-Development Programs – Employees get the chance to develop skills and they understand their requirements for career
advancement. Respect and Appreciation – Employees are regularly recognized for their contributions. Supervisor or Department Chair Relationship – Supervisors or chairs make expectations clear and solicit ideas. Teaching Environment – Faculty members say the institution recognizes innovative and high quality teaching. Tenure Clarity and Process – Requirements for tenure are clear. Work/Life Balance – College policies give employees the flexibility to manage their lives on the job and at home.
In going forward, HCS will embed these criteria as a way of establishing future goals and assessing overall human resource processes and systems as complimentary to workforce diversity with inclusion.
4
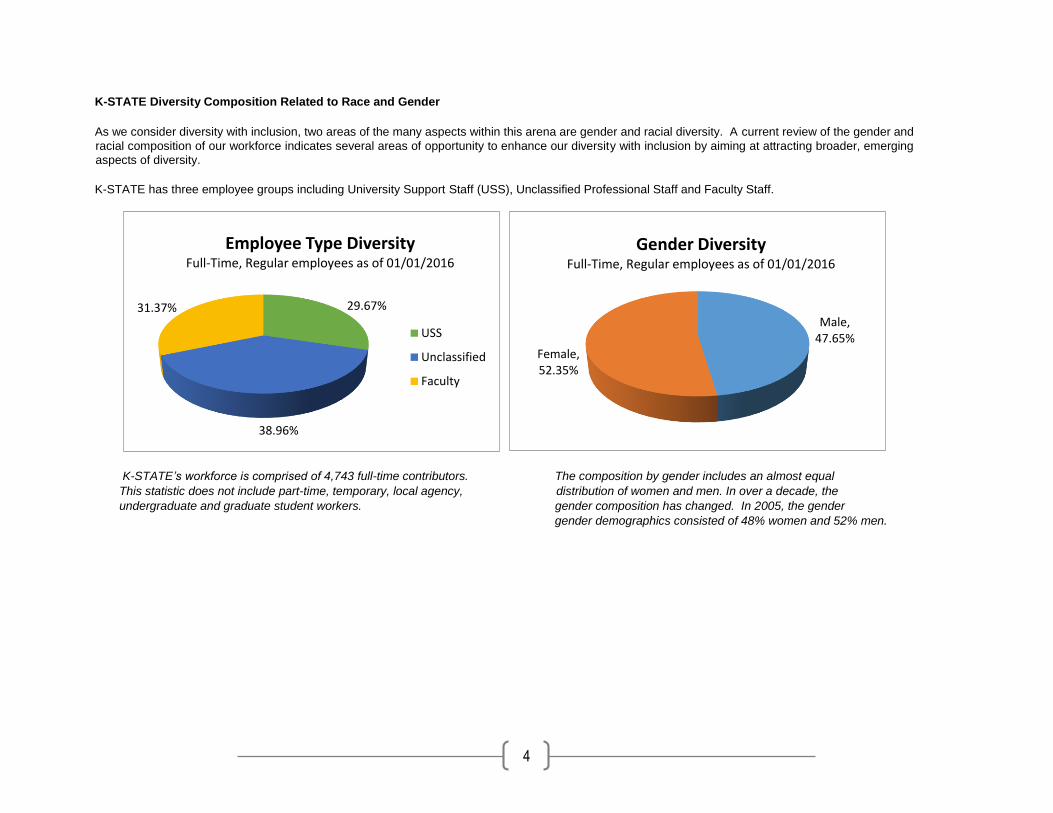
K-STATE Diversity Composition Related to Race and Gender
As we consider diversity with inclusion, two areas of the many aspects within this arena are gender and racial diversity. A current review of the gender and
racial composition of our workforce indicates several areas of opportunity to enhance our diversity with inclusion by aiming at attracting broader, emerging
aspects of diversity.
K-STATE has three employee groups including University Support Staff (USS), Unclassified Professional Staff and Faculty Staff.
K-STATE’s workforce is comprised of 4,743 full-time contributors. The composition by gender includes an almost equal
This statistic does not include part-time, temporary, local agency, distribution of women and men. In over a decade, the
undergraduate and graduate student workers. gender composition has changed. In 2005, the gender
gender demographics consisted of 48% women and 52% men.
29.67%
38.96%
31.37%
Employee Type DiversityFull-Time, Regular employees as of 01/01/2016
USS
Unclassified
Faculty
Male, 47.65%
Female, 52.35%
Gender DiversityFull-Time, Regular employees as of 01/01/2016
5
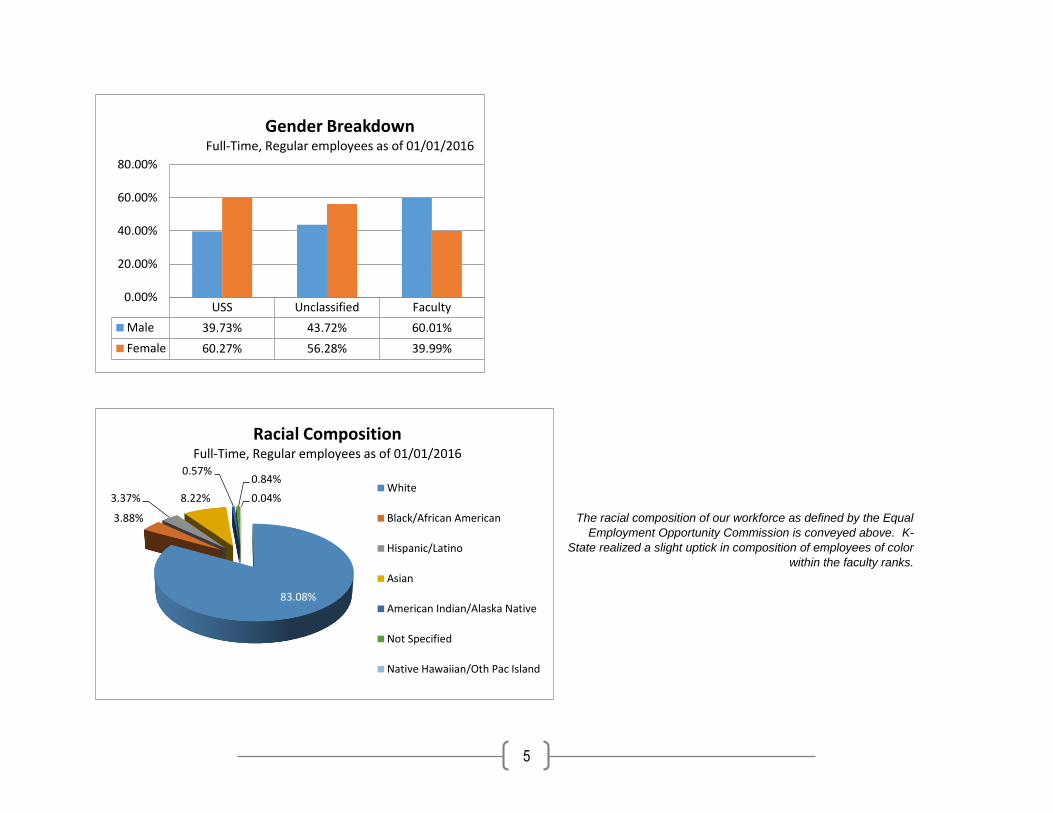
The racial composition of our workforce as defined by the Equal
Employment Opportunity Commission is conveyed above. K-
State realized a slight uptick in composition of employees of color
within the faculty ranks.
USS Unclassified Faculty
Male 39.73% 43.72% 60.01%
Female 60.27% 56.28% 39.99%
0.00%
20.00%
40.00%
60.00%
80.00%
Gender BreakdownFull-Time, Regular employees as of 01/01/2016
83.08%
3.88%
3.37% 8.22%
0.57%0.84%
0.04%
Racial CompositionFull-Time, Regular employees as of 01/01/2016
White
Black/African American
Hispanic/Latino
Asian
American Indian/Alaska Native
Not Specified
Native Hawaiian/Oth Pac Island
6
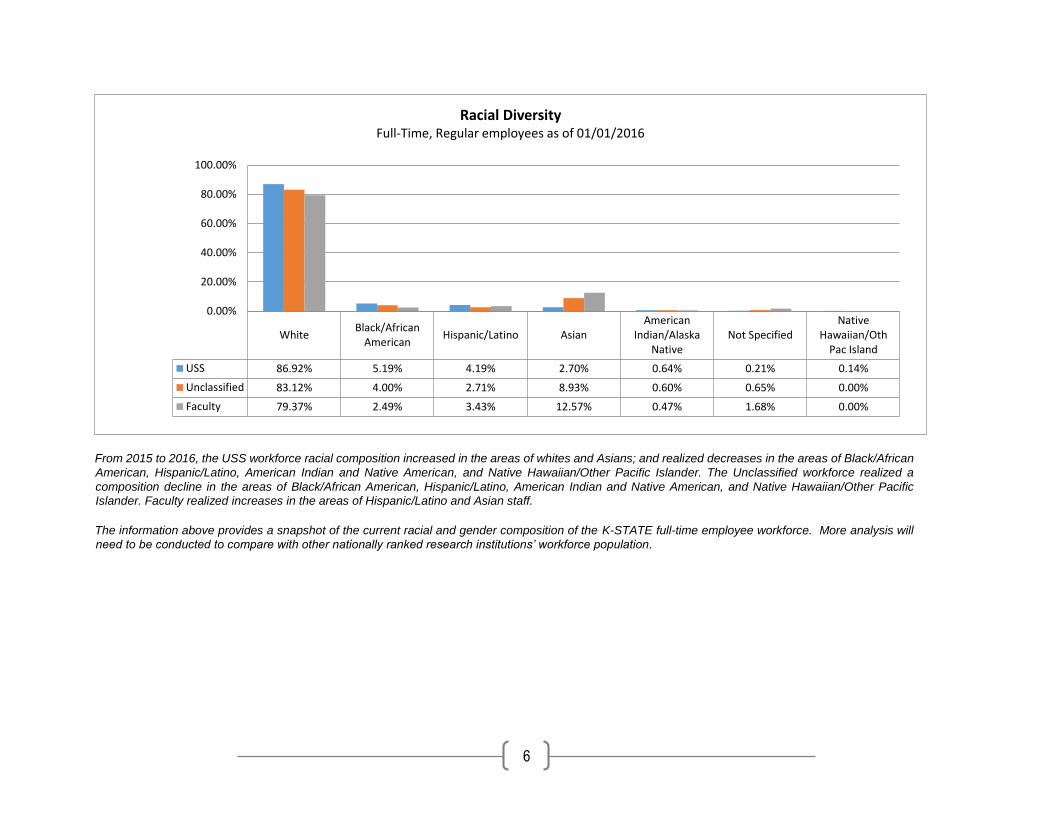
From 2015 to 2016, the USS workforce racial composition increased in the areas of whites and Asians; and realized decreases in the areas of Black/African
American, Hispanic/Latino, American Indian and Native American, and Native Hawaiian/Other Pacific Islander. The Unclassified workforce realized a
composition decline in the areas of Black/African American, Hispanic/Latino, American Indian and Native American, and Native Hawaiian/Other Pacific
Islander. Faculty realized increases in the areas of Hispanic/Latino and Asian staff.
The information above provides a snapshot of the current racial and gender composition of the K-STATE full-time employee workforce. More analysis will
need to be conducted to compare with other nationally ranked research institutions’ workforce population.
WhiteBlack/African
AmericanHispanic/Latino Asian
AmericanIndian/Alaska
NativeNot Specified
NativeHawaiian/Oth
Pac Island
USS 86.92% 5.19% 4.19% 2.70% 0.64% 0.21% 0.14%
Unclassified 83.12% 4.00% 2.71% 8.93% 0.60% 0.65% 0.00%
Faculty 79.37% 2.49% 3.43% 12.57% 0.47% 1.68% 0.00%
0.00%
20.00%
40.00%
60.00%
80.00%
100.00%
Racial DiversityFull-Time, Regular employees as of 01/01/2016
7
K-STATE’s Demographical Data Based on Hires and Separations
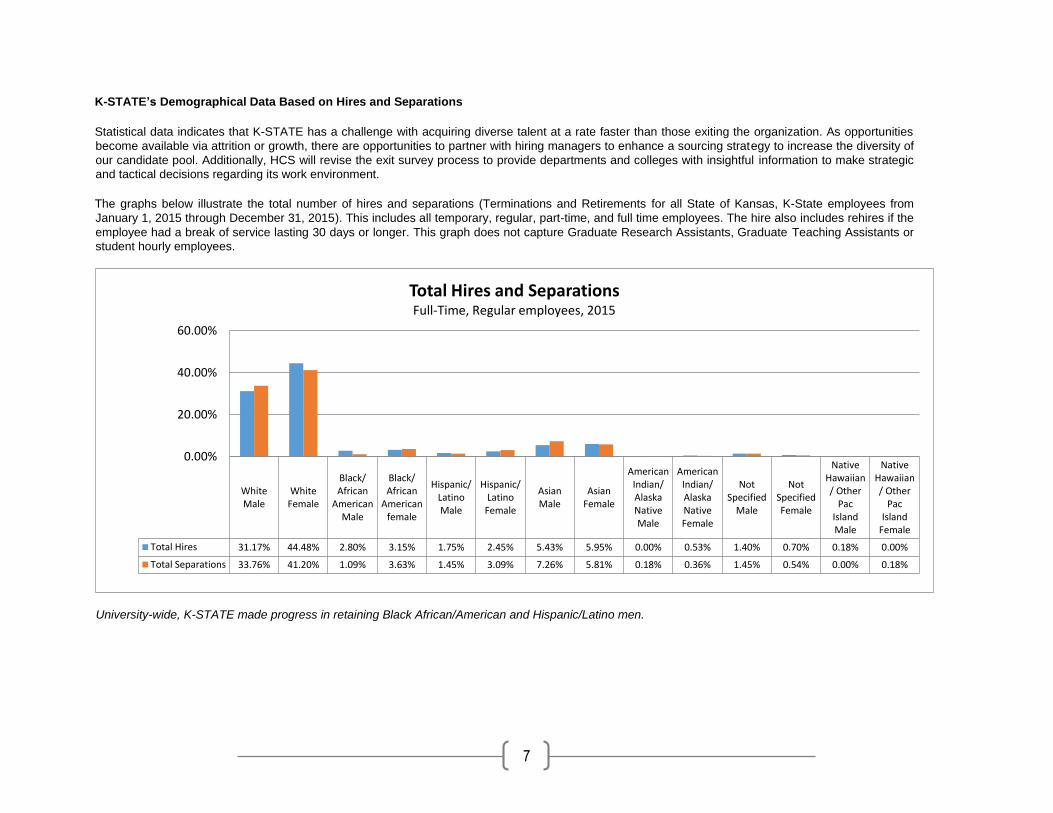
Statistical data indicates that K-STATE has a challenge with acquiring diverse talent at a rate faster than those exiting the organization. As opportunities
become available via attrition or growth, there are opportunities to partner with hiring managers to enhance a sourcing strategy to increase the diversity of
our candidate pool. Additionally, HCS will revise the exit survey process to provide departments and colleges with insightful information to make strategic
and tactical decisions regarding its work environment.
The graphs below illustrate the total number of hires and separations (Terminations and Retirements for all State of Kansas, K-State employees from
January 1, 2015 through December 31, 2015). This includes all temporary, regular, part-time, and full time employees. The hire also includes rehires if the
employee had a break of service lasting 30 days or longer. This graph does not capture Graduate Research Assistants, Graduate Teaching Assistants or
student hourly employees.
University-wide, K-STATE made progress in retaining Black African/American and Hispanic/Latino men.
WhiteMale
WhiteFemale
Black/African
AmericanMale
Black/African
Americanfemale
Hispanic/LatinoMale
Hispanic/LatinoFemale
AsianMale
AsianFemale
AmericanIndian/AlaskaNativeMale
AmericanIndian/AlaskaNativeFemale
NotSpecified
Male
NotSpecifiedFemale
NativeHawaiian/ Other
PacIslandMale
NativeHawaiian/ Other
PacIsland
Female
Total Hires 31.17% 44.48% 2.80% 3.15% 1.75% 2.45% 5.43% 5.95% 0.00% 0.53% 1.40% 0.70% 0.18% 0.00%
Total Separations 33.76% 41.20% 1.09% 3.63% 1.45% 3.09% 7.26% 5.81% 0.18% 0.36% 1.45% 0.54% 0.00% 0.18%
0.00%
20.00%
40.00%
60.00%
Total Hires and Separations Full-Time, Regular employees, 2015
8
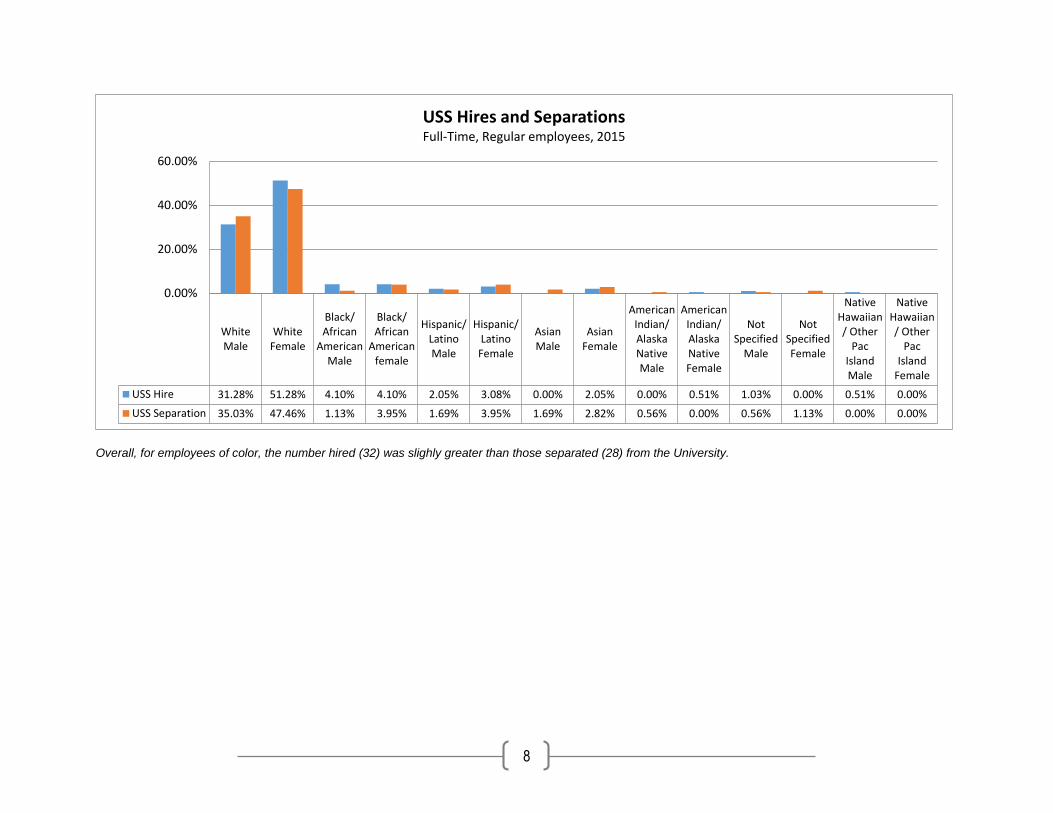
Overall, for employees of color, the number hired (32) was slighly greater than those separated (28) from the University.
WhiteMale
WhiteFemale
Black/African
AmericanMale
Black/African
Americanfemale
Hispanic/LatinoMale
Hispanic/LatinoFemale
AsianMale
AsianFemale
AmericanIndian/AlaskaNativeMale
AmericanIndian/AlaskaNativeFemale
NotSpecified
Male
NotSpecifiedFemale
NativeHawaiian/ Other
PacIslandMale
NativeHawaiian/ Other
PacIsland
Female
USS Hire 31.28% 51.28% 4.10% 4.10% 2.05% 3.08% 0.00% 2.05% 0.00% 0.51% 1.03% 0.00% 0.51% 0.00%
USS Separation 35.03% 47.46% 1.13% 3.95% 1.69% 3.95% 1.69% 2.82% 0.56% 0.00% 0.56% 1.13% 0.00% 0.00%
0.00%
20.00%
40.00%
60.00%
USS Hires and SeparationsFull-Time, Regular employees, 2015
9
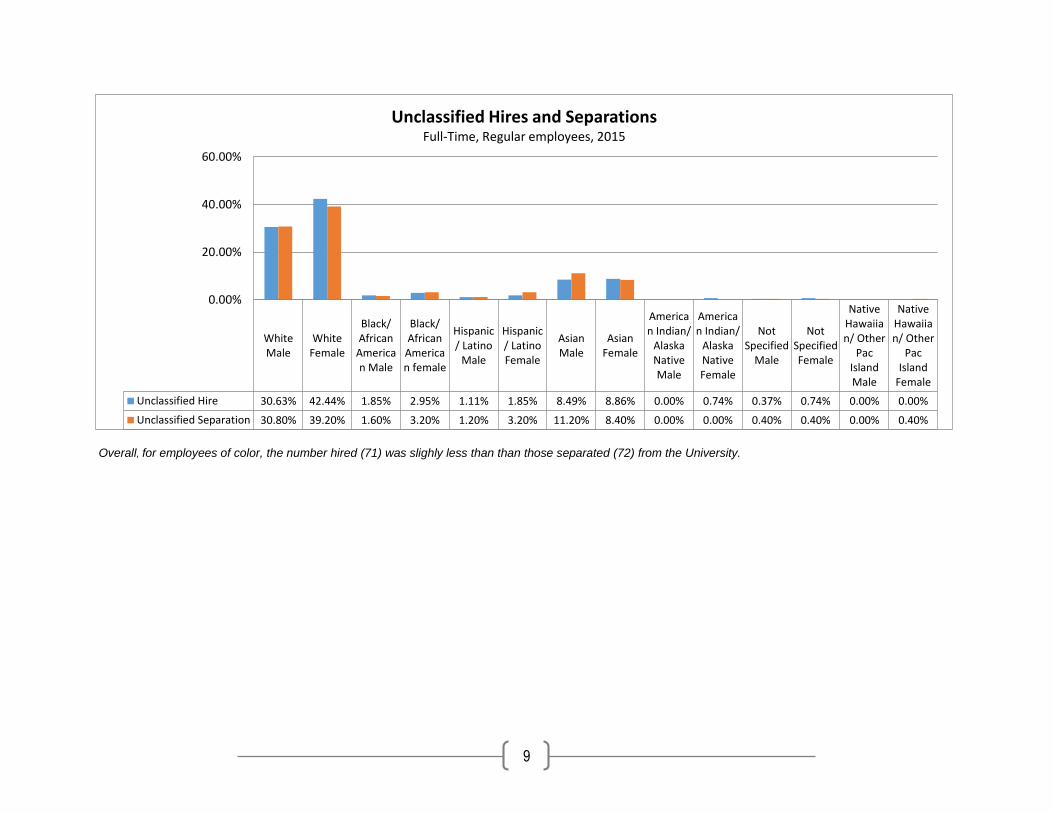
Overall, for employees of color, the number hired (71) was slighly less than than those separated (72) from the University.
WhiteMale
WhiteFemale
Black/African
American Male
Black/African
American female
Hispanic/ Latino
Male
Hispanic/ LatinoFemale
AsianMale
AsianFemale
American Indian/
AlaskaNativeMale
American Indian/
AlaskaNativeFemale
NotSpecified
Male
NotSpecifiedFemale
NativeHawaiian/ Other
PacIslandMale
NativeHawaiian/ Other
PacIsland
Female
Unclassified Hire 30.63% 42.44% 1.85% 2.95% 1.11% 1.85% 8.49% 8.86% 0.00% 0.74% 0.37% 0.74% 0.00% 0.00%
Unclassified Separation 30.80% 39.20% 1.60% 3.20% 1.20% 3.20% 11.20% 8.40% 0.00% 0.00% 0.40% 0.40% 0.00% 0.40%
0.00%
20.00%
40.00%
60.00%
Unclassified Hires and SeparationsFull-Time, Regular employees, 2015

10
Overall, for faculty of color, the number hired (25) was slighly less than than those separated (26) from the University.
WhiteMale
WhiteFemale
Black/African
American Male
Black/African
American
female
Hispanic/ Latino
Male
Hispanic/ LatinoFemale
AsianMale
AsianFemale
American
Indian/AlaskaNativeMale
American
Indian/AlaskaNativeFemale
NotSpecified Male
NotSpecifie
dFemale
NativeHawaiia
n/Other
PacIslandMale
NativeHawaiia
n/Other
PacIsland
Female
Faculty Hire 32.38% 37.14% 2.86% 1.90% 2.86% 2.86% 7.62% 5.71% 0.00% 0.00% 4.76% 1.90% 0.00% 0.00%
Faculty Separation 37.90% 36.29% 0.00% 4.03% 1.61% 1.61% 7.26% 4.84% 0.00% 1.61% 4.84% 0.00% 0.00% 0.00%
0.00%
20.00%
40.00%
60.00%
Faculty Hires and SeparationsFull-Time, Regular employees, 2015
11
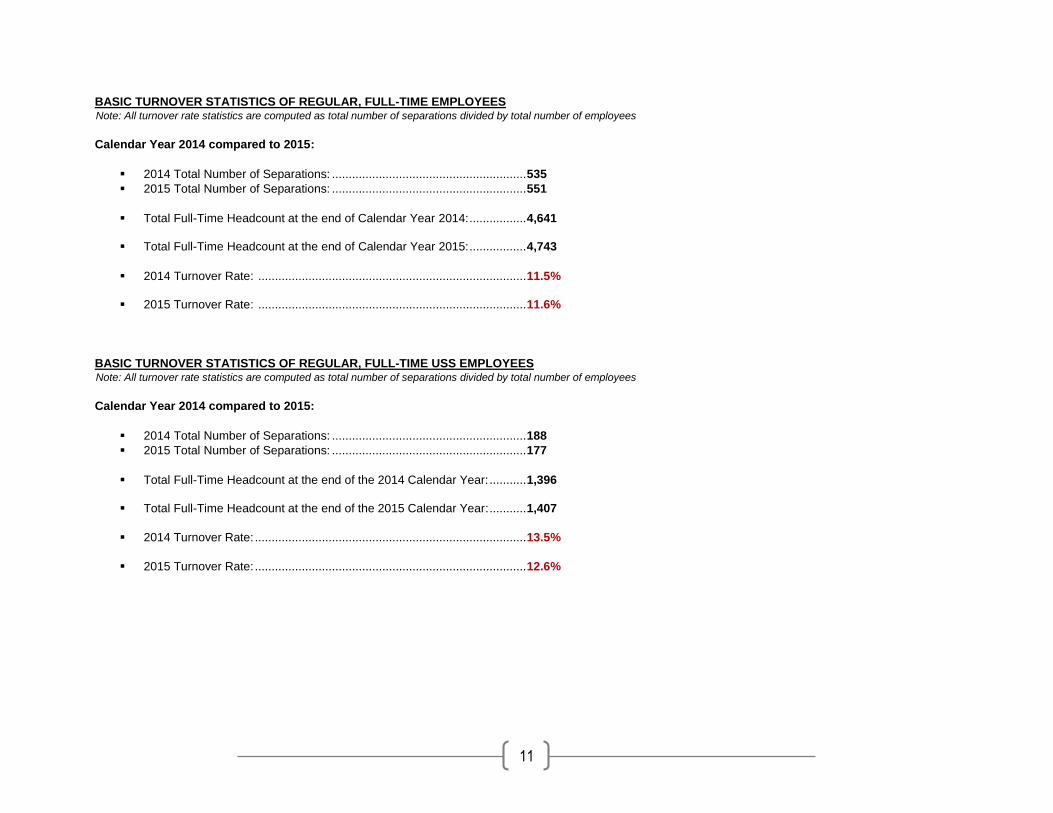
BASIC TURNOVER STATISTICS OF REGULAR, FULL-TIME EMPLOYEES Note: All turnover rate statistics are computed as total number of separations divided by total number of employees
Calendar Year 2014 compared to 2015:
2014 Total Number of Separations: .......................................................... 535
2015 Total Number of Separations: .......................................................... 551
Total Full-Time Headcount at the end of Calendar Year 2014: ................. 4,641
Total Full-Time Headcount at the end of Calendar Year 2015: ................. 4,743
2014 Turnover Rate: ................................................................................ 11.5%
2015 Turnover Rate: ................................................................................ 11.6%
BASIC TURNOVER STATISTICS OF REGULAR, FULL-TIME USS EMPLOYEES Note: All turnover rate statistics are computed as total number of separations divided by total number of employees
Calendar Year 2014 compared to 2015:
2014 Total Number of Separations: .......................................................... 188
2015 Total Number of Separations: .......................................................... 177
Total Full-Time Headcount at the end of the 2014 Calendar Year: ........... 1,396
Total Full-Time Headcount at the end of the 2015 Calendar Year: ........... 1,407
2014 Turnover Rate: ................................................................................. 13.5%
2015 Turnover Rate: ................................................................................. 12.6%

12
BASIC TURNOVER STATISTICS OF REGULAR, FULL-TIME UNCLASSIFIED EMPLOYEES Note: All turnover rate statistics are computed as total number of separations divided by total number of employees
Calendar Year 2014 compared to 2015:
2014 Total Number of Separations: .......................................................... 236
2015 Total Number of Separations: .......................................................... 250
Total Full-Time Headcount at the end of the 2014 Calendar Year: ........... 1,777
Total Full-Time Headcount at the end of the 2015 Calendar Year: ........... 1,848
2014 Turnover Rate: ................................................................................. 13.0%
2015 Turnover Rate: ................................................................................. 13.5%
BASIC TURNOVER STATISTICS OF REGULAR, FULL-TIME FACULTY EMPLOYEES Note: All turnover rate statistics are computed as total number of separations divided by total number of employees
Calendar Year 2014 compared to 2015:
2014 Total Number of Separations: .......................................................... 111
2015 Total Number of Separations: .......................................................... 124
Total Full-Time Headcount at the end of the 2014 Calendar Year: ........... 1,468
Total Full-Time Headcount at the end of the 2015 Calendar Year: ........... 1,488
2014 Turnover Rate: ................................................................................. 7.0%
2015 Turnover Rate: ................................................................................. 8.3%
More research will be conducted to compare K-State’s turnover rate to overall national higher education turnover rates.
13
HCS Diversity and Inclusion Strategic Plan
Overview
Context
In 2014, the Office of Diversity constructed a comprehensive strategic diversity plan that addressed issues pertaining to K-State’s workforce, students and
curriculum. The intent of the HCS plan is to compliment this plan with an emphasis and commitment on providing tools and methodologies to source,
attract, recruit and retain a diverse, top talent workforce.
Mission
The mission of Kansas State University is to foster excellent teaching, research, and service that develop a highly skilled and educated citizenry necessary
to advancing the well-being of Kansas, the nation, and the international community. The University embraces diversity, encourages engagement and is
committed to the discovery of knowledge, the education of undergraduate and graduate students, and improvement in the quality of life and standard of
living of those we serve.
Vision
By 2025, Kansas State University will be recognized as one of the nation’s Top 50 Public Research Universities.
Goals
To address the aforementioned demographical opportunities, support the existing diversity plan as designed by the Office of Diversity, and propel K-State
2025, HCS will pursue the following goals beginning in August 2015.
1. A Diverse Workforce: Attract, develop, reward and retain a diverse and talented workforce.
2. An Inclusive Workplace: Cultivate a flexible, collaborative, productive and inclusive work environment that leverages diversity and where people feel
valued.
3. Support the changing nature of work and the workplace environment: Develop strategies that are responsive to the changing demographics of
our student and workforce populations and address the need for multicultural and global competencies.
14
Implementation
The following pages identify the objectives, strategies, and measures designed to achieve the goal of recruiting and retaining a talented, diverse workforce.
In cases where an organization has primary (but not exclusive) responsibility for the execution of a specific strategy, that organization has been identified
in parentheses at the end of the strategy. In all other cases where there are joint or overlapping responsibilities, the responsible unit may not be specifically
identified. The HCS Diversity and Inclusion Strategic Plan is intended to be a multi-year effort, and changing conditions, including budget constraints, may
require refinement to the plan’s components. K-STATE Human Capital Services will maintain partnerships with the Office of Diversity, Colleges,
Departments, Divisions, Faculty, Staff, Senates and Cabinet as components of the plan change and as K-STATE evolves. Progress made pursuant to this plan will be reported annually in the K-STATE HCS Annual Report.

15
Goal 1: A Diverse Workforce
Attract, Develop, Reward and Retain a Diverse and Talented Workforce
The University is required to take appropriate actions to ensure there is equal opportunity in the workplace by identifying and removing barriers to Equal
Employment Opportunities. Actions include comparing the demographic composition of the workforce to the demographic composition of the relevant labor
market, removing internal barriers, conducting strategic outreach to communities and educating our hiring authorities to recognize and recruit members of
groups with less than expected representation rates. Building a diverse, high-performing workforce will involve these established strategies as well as new,
proactive strategies aimed at attracting broader, emerging aspects of our diversity.
Objective 1A: Eliminate barriers to diversity with inclusion at all levels and in all occupations.
Strategies:
• Collaborate with the K-STATE’s Office of Diversity and the College Diversity Point People.
• Provide an Affirmative Action Plan that contains informative data by colleges and departments so that hiring authorities can construct sourcing strategies
that spread a wide net to attract a talented, diverse workforce.
• Implement a HCS Dashboard to monitor the status of K-STATE’s diversity makeup and provide annual workforce diversity reports to Deans and
University leadership.
• Perform applicant flow/adverse impact analyses in recruitment and leadership selection processes.
• Utilize K-State’s Talent Acquisition Hiring Guide to develop strategic partnerships with affinity organizations, professional associations, and other
educational institutions focused on groups with low participation rates to perform recruitment outreach, leverage internal and external organizations,
including, but not limited to: people of color, women, veterans, LGBT, and people with disabilities.
Measures:
• Conduct a collaborative session with the Office of Diversity and College Diversity Point People.
• Report K-STATE Diversity Index in annual workforce diversity reports beginning in FY 2016. (Note: This Index is intended for use as an indicator of
program impact and overall progress, not as a target metric)
• Deliver timely, workforce diversity data reports to leadership.
• Implement applicant flow/adverse impact data analysis by the end of FY 2016 in order to influence the representation of groups with low participation
rates.
• Participate in a minimum of two national/local job fairs or events targeting outreach to groups with low participation rates by year end 2016.
• Develop a complimentary and informative OIE website
16
Goal 1: A Diverse Workforce
Attract, Develop, Reward and Retain a Diverse and Talented Workforce
Objectives 1B: Strengthen relations with stakeholders.
Strategies:
Leverage, support, and coordinate with internal and external K-STATE stakeholders, including, but not limited to, the attached tool which provides a broad
and comprehensive list of national diversity organizations. (i.e., Housed with Talent Acquisition of HCS)
• Network with Historically Black Colleges, predominantly Latino, or tribal colleges and universities to secure lists of doctoral students graduating.
• Contact various organizations (e.g., National Science Foundation) to see if they maintain a database of qualified ethnic minority professionals in the
sciences.
• Place advertisements in periodicals and communications such as Black Issues in Higher Education, The Black Collegian, Hispanic, American Visions,
Outlook in Higher Education, Pro Gay Jobs, Ability Jobs, and Hire Veterans.
• Write to institutions that have a high level of minority graduate and postdoctoral students and request nominations of their students for positions.
• Contact different associations (e.g., NSF) for a list of students who have received the minority fellowship award and are interested in academic positions.
• Contact officers of National Association divisions, special interest groups, the Association of Black Professionals, the National Hispanic Association, the
Society of Indian Psychologists, the Asian American Association, and other discipline specific minority organizations that can recommend ethnic minority
applicants or provide information on advertising in newsletters.
• Write to ethnic minority caucus groups (e.g., Black Coalitions of Higher Education) that may have a network of discipline specific individuals within their
organization.
Measures:
• Increase participation in national/local outreach and partnership events involving stakeholder/affinity organizations to 5% (budget permitting) by the end
of FY 2017.
17
Goal 2: An Inclusive Workplace
Cultivate a flexible, collaborative, productive and inclusive work environment that leverages diversity and where people feel valued
To benefit from workforce diversity, work environments must maintain conditions that enable diverse perspectives to be heard and empower all participants
to contribute. This requires intentional efforts by leadership to provide flexibility with respect to where, when, and how work gets done; promote robust
collaboration through teamwork, participatory work processes, and cross-functional work experiences; and engage all employees through cultural
competency, leadership development, reasonable accommodation, and constructive conflict management. These are more than retention strategies; they
are strategies that engage and develop our human capital to their fullest potential so that they may advance the K-STATE strategic plan.
Objective 2A: Leverage workforce diversity and empower diverse perspectives throughout the organization through career/leadership development.
Strategies:
• Incorporate diversity and inclusion in the curricula for the Director’s Roundtable,
Supervisory Training and other leadership development programs.
• Provide processes and methodologies for Selection Committees to have diverse and inclusive interviewing panels.
• Incorporate throughout HCS roadshows the common themes that impede a diverse and inclusive work environment based on data and common themes
generated by the Office of Institutional Equity.
• By 2016, provide colleges and departments data on attrition, the causes of attrition and suggested solutions for increasing retention.
• Provide support with Department Chairs interested in establishing mentoring programs for new faculty members.
• Develop job families and career ladders to support vertical and horizontal career movement.
• Conduct Salary Equity studies to assess comparative salaries of women and people of color.
Measures
• Reduce “voluntary losses” (non-retirement voluntary separations/resignations) by 2 percent of current baseline for groups with higher than expected
attrition rates by end of FY 2018.
18
Goal 2: An Inclusive Workplace
Cultivate a collaborative, productive and inclusive work environment that leverages diversity and where people feel valued
Objective 2B: Cultivate a collaborative, and inclusive organizational culture for all employees.
Strategies:
• Equip leaders with diversity and inclusion knowledge and skills to effectively lead their workforce.
• Utilize Employee Engagement study data to measure K-STATE’s organizational inclusion rates.
• Employ Organizational Climate Assessment Programs in Colleges experiencing high workplace conflict/per capita complaints
• Employ Civility, Respect, and Engagement in the Workplace initiatives in organizations experiencing high workplace conflict/per capita complaints.
• Analyze the results of K-STATE’s Employee Engagement Survey.
• Support special emphasis programs, including Black Faculty Staff Alliance, Women of K-State, Alianza, and LGBT affinity and resource groups, and
expand these groups to represent new, emerging aspects of diversity (e.g., multigenerational).
• Employ and modify electronic employee exit surveys to include questions focused on diversity and inclusion issues.
• Support and participate in Dispute Resolution processes and promote effective union/management collaborations with the Fraternal Order of Police,
Kansas Association of Public Employees and Kansas Organization of State Employees.
• Implement and promote a reasonable accommodation system.
• Update the current Affirmative Action Plan (AAP) to maintain compliance and to serve as a livable, usable sustainable tool to inform leaders of diversity
and workforce planning.
• Implement Info-graphics that enable Leaders to make informed decisions
• Collaborate, visibly support and participate in programming offered by the Office of Diversity to enhance cultural competence within HCS
Measures:
• Support action plans deriving from K-STATE’s Employee Engagement Survey and determine baseline to inform future goal setting.
• Implement responsive action plans in accordance with the employee survey.
• Enhance standardized electronic employee exit survey to include questions on diversity and inclusion by end of FY 2017.
• Provide in-depth dispute resolution and facilitation training to Employee Relations Specialists.
• Implement updated AAP by the end of FY 2016.
• Implement Executive Dashboard reporting EEO, diversity and inclusion, and Dispute Resolution performance metrics by the end of FY 2017.
19
Goal 3: An Evolving Workplace
Support the changing nature of work and the workplace environment
Foster policies, programs and work arrangements that support the well-being of the K-STATE community.
Objectives 3A:
Strategies:
• Explore benefits, programs and work practices that support employees in balancing their work life.
• Implement work/life flexibilities (i.e., wellness programs “Live Your Best”, telecommuting policy, financial workshops “Equally Prepared”) as appropriate.
Measures:
• Provide at least five financial awareness workshops to employees and their spouse/partners by FY 2015. Obtain a satisfaction rating of at least 80%
from participants.
• Implement a physical wellness program “Movement Challenge” beginning in the fall of 2015 and expand the program over a five year period.
• Establish a telecommuting policy for targeted positions suited for such arrangements.
20
Goal 3: An Evolving Workplace
Support the changing nature of work and the workplace environment
Objective 3B: Institutionalize shared accountability for a culture of diversity and inclusion.
Strategies:
• Conduct department and college roadshows providing informative and user-friendly AAP material.
• Issue a K-STATE Diversity and Inclusion Annual Performance Report reporting progress made on the K-STATE Diversity and Inclusion Strategic Plan.
• Share annual K-STATE diversity and inclusion policy directives and statements based off of requirements issued by the EEO and Office of Federal
Contract Compliance Programs (OFCCP).
• Provide web based anti-discrimination training for all new hires.
• Maintain collaborative relationships with the Diversity Point People throughout campus.
• Support the Office of Diversity’s initiatives to recognize and celebrate diversity excellence.
• Incorporate broad-based diversity and inclusion content in K-STATE branding and communication strategies (media outreach, public awards, various
communications tools and vehicles, strategic communications, HCS and OIE Web sites).
• Link HCS Website when appropriate to the Office of Diversity to further publicize their best practices in the areas of diversity.
Measures:
• Issue timely and accurate K-STATE Diversity and Inclusion Annual Performance Report reporting progress made on K-STATE Diversity and Inclusion Strategic Plan.
• Implement online EEO, diversity, and DR dashboard to report subject metrics, including K-STATE Diversity and Inclusion Indices, to K-STATE leadership
by the end of FY 2017.
• Increase dissemination and readership of Diversity at Work newsletters and publications annually.
• Create and maintain updated content on the K-STATE website relating to diversity and inclusion annually.
21
Applicable Laws
(Not exhaustive list)
Title VI Civil Rights Act of 1964 – protects people from discrimination based on race, color or national origin in programs or activities that receive
Federal financial assistance. Title VI states that: “No person in the United States shall, on the ground of race, color, or national origin, be excluded
from participation in, be denied the benefits of, or be subjected to discrimination under any program or activity receiving Federal financial assistance.”
Title VII, Civil Rights Act of 1964, as amended – prohibits employment discrimination based on race, color, religion, sex, national origin; the law also
makes it illegal to retaliate against an individual because he/she complained about discrimination, filed a complaint, or participated in an employment
discrimination investigation or lawsuit.
Title IX of the Education Amendments of 1972 – protects people from discrimination based on sex in education programs or activities which receive
Federal financial assistance. Title IX states that: “No person in the United States shall, on the basis of sex, be excluded from participation in, be denied
the benefits of, or be subjected to discrimination under any education program or activity receiving federal financial assistance.”
Age Discrimination in Employment Act of 1967, as amended – prohibits employment discrimination against individuals 40 years of age or older.
Equal Pay Act of 1963, as amended – prohibits discrimination on the basis of sex in compensation for substantially equal work performed under similar
working conditions.
Genetic Information Non-Discrimination Act of 2008 – prohibits employment discrimination based on genetic information.
Title V, United States Code Section 2301 – provides that recruitment should be from qualified individuals from appropriate sources from all segments
of society; selection and advancement should be determined solely on the basis of merit, after fair and open competition so that that all receive equal
opportunity; and fair and equitable treatment in all aspects of personnel management without regard to political affiliation, race, color, religion, national
origin, sex, marital status, age, or handicapping condition, and with proper regard for their privacy and constitutional rights.
Americans with Disabilities Act (ADA) of 1990, Title 1, and ADA Amendments Act of 2008 – revises the definition of “disability” to more broadly
encompass impairments that substantially limit a major life activity. The amended language also states that mitigating measures, including assistive
devices, auxiliary aids, accommodations, medical therapies and supplies (other than eyeglasses and contact lenses) have no bearing in determining
whether a disability qualifies under the law. Changes also clarify coverage of impairments that are episodic or in remission that substantially limit a
major life activity when active, such as epilepsy or post-traumatic stress disorder. The amendments took effect January 1, 2009.
1/14/2016
9:07 p.m.