the utility of the forced oscillation technique in assessing bronchodilator responsiveness in...
TRANSCRIPT

ARTICLE IN PRESS
Respiratory Medicine (2007) 101, 995–1000
0954-6111/$ - see frodoi:10.1016/j.rmed.
Abbreviation: FOT20Hz, respectivelyconductance, the reestimating equationSociety
$The abstract ofYamalanchili VAK, Kain Patients with Asrecommendation fro�Corresponding au
E-mail address: m
The utility of the forced oscillation technique inassessing bronchodilator responsiveness inpatients with asthma$
Makito Yaegashia,�, Venkata A.K. Yalamanchilib, Vaidehi Kazab,Jeremy Weedonc, Albert E. Heurichc, Michael J. Akermanc
aUniversity of Pittsburgh Medical Center, Pittsburgh, PA, USAbBaylor College of Medicine, Houston, TX, USAcState University of New York, Health Science Center at Brooklyn, Brooklyn, NY, 15261, USA
Received 15 May 2006; accepted 1 September 2006Available online 23 October 2006
KEYWORDSAirway obstruction;Asthma;Bronchodilator;Forced oscillation;Impulse oscillometrysystem (IOS)
nt matter & 20062006.09.001
, forced oscillome(R5 and R20); Rrciprocal of Rrs5–2analysis; COPD, c
this article wasza V, Weedon J, Hthma’’ Chest 200m ERS task force.thor. Scaife hall s
yaegashi@hotmai
SummaryObjective: To address the utility of the forced oscillation technique (FOT) in assessingbronchodilator responsiveness compared with forced expiratory volume in 1 s (FEV1).Methods: This is a retrospective analysis of consecutive 126 patients with a clinical historyof asthma without any other lung diseases at a pulmonary function testing laboratory. Thefollowing measurements were obtained three times each, before and after two doses ofpirbuterol 0.2mg inhalation: the respiratory resistance at 5Hz (Rrs5), the meanrespiratory resistance between 5 and 20Hz (Rrs5–20), and the mean respiratoryconductance (Grs5–20) by FOT and the FEV1 by spirometer. These measurements weretransformed into dimensionless subject-specific effect-size ‘‘d-scores’’ by dividing them bythe estimated pooled within-subject standard deviation.Results: Descriptive statistics for each value were the following [mean baseline value(7SD), D value (pre- minus post value), and d-score (P value compared to FEV1)]: Grs5–20(L s�1 kPa�1) [1.7970.53, D ¼ +0.39, d ¼ 2.64 (Po0.001)], Rrs5–20 (kPa L�1 s)[0.6070.16L, D ¼ �0.10, d ¼ 2.56 (P ¼ 0.001)], Rrs5 (kPa L�1 s) [0.7870.25,
Elsevier Ltd. All rights reserved.
try technique; IOS, impulse oscillometry system; Rrs5 and Rrs20, the respiratory resistance at 5 ands5–20, the mean respiratory resistance between 5 and 20Hz, Rrs; Grs5–20, the total respiratory0, Grs; FEV1, forced expiratory volume in 1 s; PEF, peak expiratory flow; GEE analysis, generalizedhronic obstructive pulmonary disease; ATS, American Thoracic Society; ERS, European Respiratory
presented at the American College of Chest Physicians 2004 Seattle: Yaegashi M, Akerman MJ,eurich AE. ‘‘The Utility of Forced Oscillation Technique (FOT) to Assess Bronchodilator Responsiveness4; 126S (4): 796. All abbreviations of FOT measurements were based on the ones used in the
uite 655, 3550 Terrace St., Pittsburgh, PA 15261, USA. Tel.: +1 412 647 3135; fax: +1 412 647 8060.
l.com (M. Yaegashi).

ARTICLE IN PRESS
M. Yaegashi et al.996
D ¼ �0.16, d ¼ 2.52 (Po0.001)], and FEV1 (L) [1.9070.64, D ¼ �0.20, d ¼ 1.83]. Thehigher d-score of Grs5–20, Rrs5–20 and Rrs5 compared to FEV1 indicates that these arebetter indicators for bronchodilator response than FEV1. The percentages of subjectsexhibiting change in the expected direction after bronchodilator were not significantlydifferent between each value: Rrs5 (85.7%), Rrs5–20 (83.3%), Grs5–20 (83.3%), and FEV1(83.3%) [P40.05].Conclusions: Several forced oscillation measures, namely Grs5–20, Rrs5–20 and Rrs5, aremore accurate and sensitive for detecting bronchodilator response than FEV1 in patientswith asthma.& 2006 Elsevier Ltd. All rights reserved.
Background
Measuring reversibility of airway obstruction by spirometryis important diagnostic information in the diagnosis andmanagement of asthma. However, compared to spirometricmeasurements to determine bronchodilator responsivenesssuch as forced expiratory flow in 1 s (FEV1) or peakexpiratory flow (PEF), forced oscillometry technique (FOT)measurement is easier for patients to perform and requiresless patient cooperation. Previous studies, though, showedmixed results in the use of FOT to evaluate asthma. VanNoord and coworkers1 showed that one of the FOTmeasurements, Rrs6 was less sensitive than Raw in theirstudy in asthma and chronic obstructive pulmonarydisease (COPD) patients. On the other hand, in Zerah andcoworker’s study which used better defined patients,2 therespiratory conductance (Grs0) was as sensitive and specificas FEV1. Thus, the guideline for FOT published by theEuropean Respiratory Society Task Force3 called for a studyin a larger, well-defined group. In response to that need, weconducted this study using different statistical and pulmon-ary function methodologies in a larger number of patientswith asthma.
Methods
Patients
We retrospectively collected data of outpatients who hadboth spirometry and forced oscillation technique pre- andpost-bronchodilator (pirbuterol) at the Kings County Hospi-tal between 2000 and 2003. We included patients with anyobstructive pattern in PFT independent of bronchodilatorresponse and a clinical history of asthma. Patients withequivocal clinical history were included only when they metthe criteria for bronchodilator response defined by FEV1increase more than 12% and 200 cc.4 Patients with knownCOPD, more than 10 pack-year history of smoking orobstructive pattern without a clinical history of asthmawere excluded. We excluded patients with known lungdisease other than asthma. All patients where theirspirometry quality did not meet the American ThoracicSociety (ATS) criteria for spirometery4 or who were missingFOT data were excluded. All patients were outpatients andclinically stable at the time of the measurement.
Study design
The pulmonary function test procedure was as follows: Pre-bronchodilator measurement of spirometry and FOT wereobtained first. FEV1, PEF, obstructive/restrictive pattern,and quality of the study were recorded from the spirometry.Among the FOT measurements, the respiratory resistance at5Hz (Rrs5) and at 20Hz (Rrs20), R5minus R20 (Rrs5–Rrs20),the mean respiratory resistance (Rrs5–20: the mean resis-tance from Rrs5 to Rrs20) in kPa L�1 s, and the meanrespiratory conductance (Grs5–20: the reciprocal ofRrs5–20) in L s�1 kPa�1 were recorded. Then, two puffs ofpirbuterol 0.2mg inhalation were given via a metered doseinhaler. After 30min, the spirometric and FOT measure-ments were repeated. All measurements followed technicalrecommendations from ATS and European RespiratorySociety (ERS).3–5
Spirometry measurement including FEV1 and PEF wererecorded at the mouth using a pneumotachograph withelectronic integration. Highest values of three maneuverswere reported for pre- and post-bronchodilator measure-ments.
The FOT measurements were obtained using a method ofFOT (IOS; impulse oscillometry system: Jaeger; Wurzburg,Germany6) using previously described methodology byLandser.7,8 Briefly, a random noise signal of 5 to 35Hz wasgenerated by loudspeakers and superimposed on thespontaneous breathing of the subject wearing a mouthpieceand a nose-clip. The subject’s cheeks were held firmly byhim/herself while measurements were obtained in a sittingposition with the head in a neutral position. A continuousmeasurement of 60 s was obtained and divided into first,second and third 20 s periods. Rrs5, Rrs20, Rrs5–Rrs20,Rrs5–20, and Grs5–20 were obtained for each time periodpre- and post-bronchodilator, which totaled three measure-ment values of each parameter for pre and three measure-ment values for post-bronchodilator. The mean respiratoryresistance (Rrs5–20) was calculated from R5, R10, R15 andR20. The mean value of respiratory conductance (Grs5–20)was calculated as the reciprocal of Rrs5–20.
Statistical analysis
For each measurement, a change score ðD ¼ X̄D � X̄BÞ wascomputed as the difference between post-drug (D) andbaseline (B) means. Since various spirometric and FOTmeasurements have differing metrics, direct numerical

ARTICLE IN PRESS
Table 1 Anthropometric data and baseline spirometryresults.
(Total of 126 subjects)
SexWomen 96 (76.1%)Men 30 (23.8%)
Age 45.1713.9 year-oldHeight 16478.0 cmWeight 83.9720.1 kgBMI 31.377.5 kg/m2
RaceBlack 103 (81.7%)Hispanic 19 (15.1%)Asian 3 (2.4%)White 1 (0.8%)
Smoking historyNever 108Quit 18 (average 4.39 pack-year)
Symptoms 95 patients answeredDyspnea 48 (50.5%)Cough 35 (36.8%)Sputum 17 (17.9%)Wheezing 11 (11.6%)Symptomatic 58 (61.1%)Asymptomatic 37 (38.9%)
FVC (pre-bronchodilator) 2.7770.85 LFVC % predicted (pre) 88.7718.0%
FOT for BD responsiveness in asthma 997
comparisons of these scores are statistically questionable.They were therefore transformed into dimensionless sub-ject-specific effect-size scores (d-score) by dividing them bythe estimated pooled (across D and B) within-subject
standard deviation (d ¼ D=s ¼ D=ffiffiffiffiffiffiffiffiffiffiffiffiffiffiffiffiffiffiffiffiffiffiffiðs2B þ s2DÞ=2
q; when all
three pre- and post-value are present), where sB and sDrepresent estimated pooled (across subjects) within-subjectstandard deviations. Modified equations were used whensubjects had one repeat data point missing (i.e. twomeasurements instead of three repeated measurements).These d-score correspond to Cohen’s ds estimate of effectsize for the difference between two means.9 The sign ofthese scores was reversed for Rrs5–20, Rrs5, Rrs20 andRrs5–Rrs20, since the expected direction of the effect of thebronchodilator is opposite for these measures. Mixed linearmodels were employed to estimate sB, and sD. A furthermixed linear model was then used to detect differences inmean effect among the seven measures: their covariancematrix was assumed to be unstructured, and Satterthwaiteadjustments to degrees of freedom were applied. Bothunadjusted and Tukey-adjusted P values for post hoc tests ofpair-wise differences are reported.
Analysis was also conducted on the signs of the d-scores,to determine what proportion of subjects exhibited changein the expected direction. A generalized estimating equa-tions (GEE) analysis was conducted to test for differencesin this population among the seven measures. UnadjustedP-values for post-hoc tests of pair-wise differences wereused. For all comparisons, P-values less than 0.05 wereconsidered significant. SAS (SAS Institute, Cary, NC) softwarewas used for analysis.
FEV1 1.9070.64 LFEV1% predicted 77.7719.8%FFV1/FVC ratio 70.4711.9
Results
Anthropometric data in the 126 patients included in thestudy are presented in Table 1. Of the possible total of 5292data points (126 subjects� seven measures� two conditions[pre+post] � three replications), only 25 data points(belonging to eight subjects) were missing, and at leastone replication was always available. An omnibus test ofdifferences in mean effect size among the seven measuresyielded F(6,119) ¼ 22.39, Po0.0001.
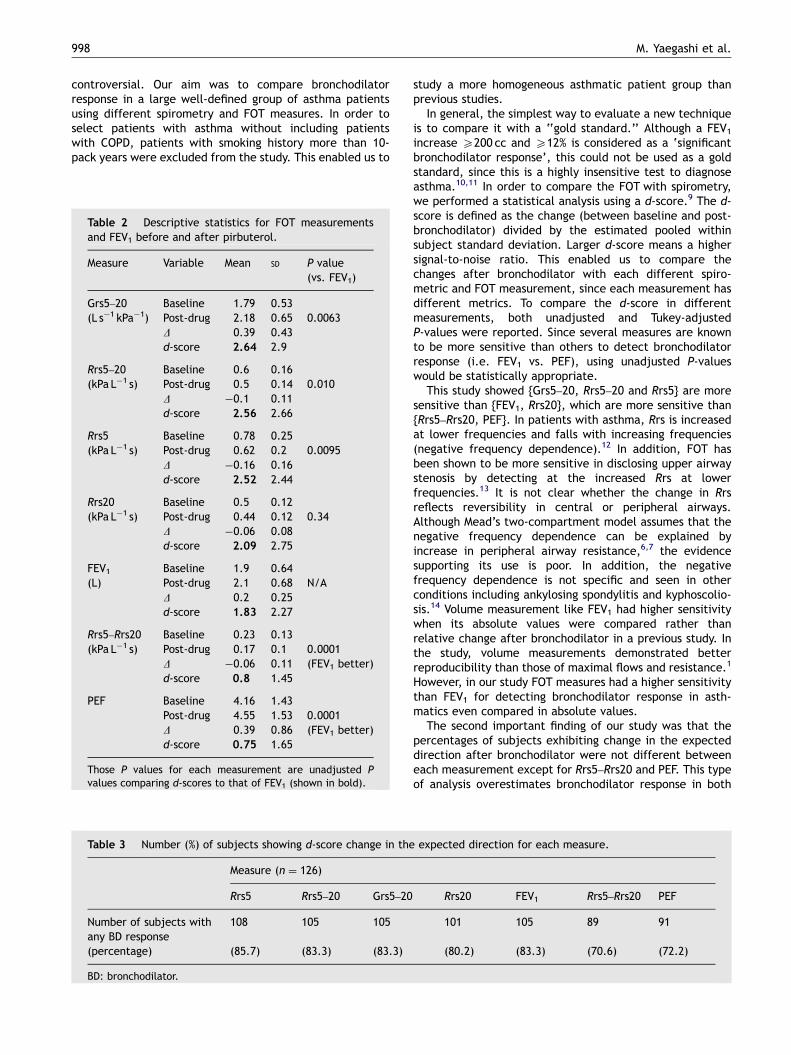
Descriptive statistics for mean raw scores, D-scores and d-scores are presented in Table 2. The higher d-score ofGrs5–20, Rrs5–20 and Rrs5 indicates that these are betterindicators for bronchodilator response than FEV1. Looking atother indexes, the pattern of unadjusted P values o0.05suggests there are three homogeneous sets of measures indescending order of sensitivity; {Grs5–20, Rrs5–20 and Rrs5},{FEV1, Rrs20} and {Rrs5–Rrs20, PEF}. Post-hoc tests indicatedthat PEF and Rrs5–Rrs20 are less sensitive for bronchodilatorresponse than any of the other measurements [TukeyPo0.0001 in all cases]; in addition, Rrs20 is less sensitivethan either Grs5–20 or Rrs5–20 [Tukey Po0.01 in bothcases].
Table 3 shows the proportions of subjects exhibitingchange in the expected direction. A GEE test of differencesamong the seven measures yielded w2 ¼ 21.95, df ¼ 6,P ¼ 0.001. Post-hoc comparisons indicate that Rrs5–Rrs20& PEF are less likely to show change in the expected
direction than any other measure (Po0.05 in all cases,except for Rrs20 vs. PEF, P ¼ 0.14). On the other hand, thepercentage of subjects exhibiting change in the expecteddirection after bronchodilator was not significantly differentbetween each value: Rrs5 (85.7%), Rrs5–20 (83.3%), Grs5–20(83.3%), and FEV1 (83.3%) [P40.05].
In each measurement, the corresponding changes to 0.2Lincrease in FEV1 were presented in Table 4. DFEV1 of 0.2L (or10.5% change) corresponded to a d-score of 1.85. Thischange was equivalent to DGrs5–20: +0.28 (+15.6%),DRrs5–20: �0.075 (�16.0%), and DRrs5: �0.125 (�12.5%).The percentages of subjects showing this change were 62%in Rrs5–20, 61% in Rrs5, 60% in Grs5–20, 58% in Rrs20, and45% in FEV1. According to the unadjusted P-value o0.05,measurements can be classified into three groups indescending order of sensitivity for bronchodilator respon-siveness: {Grs5–20, Rrs5–20, Rrs5, Rrs20}, {FEV1}, and{Rrs5–Rrs20, PEF}.
Discussion
The sensitivity of FOT measurement compared with that ofspirometry and the correlation between their indices inbronchodilation testing were previously undetermined and
ARTICLE IN PRESS
M. Yaegashi et al.998
controversial. Our aim was to compare bronchodilatorresponse in a large well-defined group of asthma patientsusing different spirometry and FOT measures. In order toselect patients with asthma without including patientswith COPD, patients with smoking history more than 10-pack years were excluded from the study. This enabled us to
Table 3 Number (%) of subjects showing d-score change in the
Measure (n ¼ 126)
Rrs5 Rrs5–20 Grs5–20
Number of subjects withany BD response
108 105 105
(percentage) (85.7) (83.3) (83.3)
BD: bronchodilator.
Table 2 Descriptive statistics for FOT measurementsand FEV1 before and after pirbuterol.
Measure Variable Mean SD P value(vs. FEV1)
Grs5–20 Baseline 1.79 0.53(L s�1 kPa�1) Post-drug 2.18 0.65 0.0063
D 0.39 0.43d-score 2.64 2.9
Rrs5–20 Baseline 0.6 0.16(kPa L�1 s) Post-drug 0.5 0.14 0.010
D �0.1 0.11d-score 2.56 2.66
Rrs5 Baseline 0.78 0.25(kPa L�1 s) Post-drug 0.62 0.2 0.0095
D �0.16 0.16d-score 2.52 2.44
Rrs20 Baseline 0.5 0.12(kPa L�1 s) Post-drug 0.44 0.12 0.34
D �0.06 0.08d-score 2.09 2.75
FEV1 Baseline 1.9 0.64(L) Post-drug 2.1 0.68 N/A
D 0.2 0.25d-score 1.83 2.27
Rrs5–Rrs20 Baseline 0.23 0.13(kPa L�1 s) Post-drug 0.17 0.1 0.0001
D �0.06 0.11 (FEV1 better)d-score 0.8 1.45
PEF Baseline 4.16 1.43Post-drug 4.55 1.53 0.0001D 0.39 0.86 (FEV1 better)d-score 0.75 1.65
Those P values for each measurement are unadjusted Pvalues comparing d-scores to that of FEV1 (shown in bold).
study a more homogeneous asthmatic patient group thanprevious studies.
In general, the simplest way to evaluate a new techniqueis to compare it with a ‘‘gold standard.’’ Although a FEV1increase X200 cc and X12% is considered as a ‘significantbronchodilator response’, this could not be used as a goldstandard, since this is a highly insensitive test to diagnoseasthma.10,11 In order to compare the FOT with spirometry,we performed a statistical analysis using a d-score.9 The d-score is defined as the change (between baseline and post-bronchodilator) divided by the estimated pooled withinsubject standard deviation. Larger d-score means a highersignal-to-noise ratio. This enabled us to compare thechanges after bronchodilator with each different spiro-metric and FOT measurement, since each measurement hasdifferent metrics. To compare the d-score in differentmeasurements, both unadjusted and Tukey-adjustedP-values were reported. Since several measures are knownto be more sensitive than others to detect bronchodilatorresponse (i.e. FEV1 vs. PEF), using unadjusted P-valueswould be statistically appropriate.
This study showed {Grs5–20, Rrs5–20 and Rrs5} are moresensitive than {FEV1, Rrs20}, which are more sensitive than{Rrs5–Rrs20, PEF}. In patients with asthma, Rrs is increasedat lower frequencies and falls with increasing frequencies(negative frequency dependence).12 In addition, FOT hasbeen shown to be more sensitive in disclosing upper airwaystenosis by detecting at the increased Rrs at lowerfrequencies.13 It is not clear whether the change in Rrsreflects reversibility in central or peripheral airways.Although Mead’s two-compartment model assumes that thenegative frequency dependence can be explained byincrease in peripheral airway resistance,6,7 the evidencesupporting its use is poor. In addition, the negativefrequency dependence is not specific and seen in otherconditions including ankylosing spondylitis and kyphoscolio-sis.14 Volume measurement like FEV1 had higher sensitivitywhen its absolute values were compared rather thanrelative change after bronchodilator in a previous study. Inthe study, volume measurements demonstrated betterreproducibility than those of maximal flows and resistance.1
However, in our study FOT measures had a higher sensitivitythan FEV1 for detecting bronchodilator response in asth-matics even compared in absolute values.
The second important finding of our study was that thepercentages of subjects exhibiting change in the expecteddirection after bronchodilator were not different betweeneach measurement except for Rrs5–Rrs20 and PEF. This typeof analysis overestimates bronchodilator response in both
expected direction for each measure.
Rrs20 FEV1 Rrs5–Rrs20 PEF
101 105 89 91
(80.2) (83.3) (70.6) (72.2)

ARTICLE IN PRESS
Table 4 Number (%) of subjects showing change in each measurement equivalent or more than 0.2 L FEV1 increase (d-scoreX1.85).
n ¼ 126 Measure
Rrs5 Rrs5–20 Grs5–20 Rrs20 FEV1 Rrs5–Rrs20 PEF
D value when d ¼ 1.85 �0.125 �0.075 0.28 �0.054 0.2 �0.14 0.95(%changes from baseline) (�16.0%) (�12.5%) (15.6%) (�10.8%) (10.5%) (�60.9%) (22.8%)Number (%) of 77 78 76 73 57 27 27patients who showedequivalent changes to0.2 L increase in FEV1
(61.1%) (61.9%) (60.3%) (57.9%) (45.2%) (21.4%) (21.4%)
P-value (vs. FEV1) 0.0049� 0.0041� 0.013� 0.038� N/A o0.0001y o0.0001y
�Rrs5, Rrs5–20, Grs5–20, and Rrs20 detected more patients with bronchodilator response than FEV1.yFEV1 detected more patients with bronchodilator response than Rrs5–Rrs20 or PEF.
FOT for BD responsiveness in asthma 999
spirometry and FOT, since any small change from baseline iscounted as a positive bronchodilator response.4 Of note,though, the percentage of patients who showed changesmore than the threshold value was similar between FEV1 andFOT indexes including Grs5–20, Rrs5–20 and Rrs5. Thethreshold values for bronchodilator response of FOT mea-sures, which we found were smaller in our study comparedto previous studies.
There are some discrepancies between this study and theprevious study by Van Noord et al.1 Although both studiesshowed that airway resistance at lower frequency (Rrs5 orRrs6) is more sensitive than FEV1 in absolute changes, ourstudy showed a much lower threshold change for Rrs5compared to their study (16% vs. 35.6%). This discrepancyresulted in an increased percentage of patients who hadmore than the threshold bronchodilator response (61% vs.16%) in our study compared to their study. As noted above,we used a different statistical analysis (d-score) from thestudy by Van Noord and coworkers. This enabled directcomparison of all the different types of measurementsthrough quasi-ANOVA analyses. In addition, this statisticalsignificance testing incorporates the difference of twosample means to compute the d-score, whereas thecoefficient of variance used by Van Noord et al. does not.Looking at the patient population, the previous studyevaluated mixed patient population with asthma and COPD,compared to this study where we used only uniform patientswith asthma. Van Noord’s group published another articleshowing that even patients with similar FEV1, the Rrs variesdepending on the diagnosis of the patients. For example,the Rrs was highest in asthmatics compared to patients withemphysema and chronic bronchitis.12 Those reasons mayhave accounted for the difference between this study andVan Noord’s study.
Zerah et al.2 evaluated reversibility of airway obstructionin two well-defined groups of patients with asthma andCOPD. In that study, FEV1 and Grs0 both exhibited compar-able changes with similar sensitivity and specificity indetecting bronchodilator responsiveness in asthmatics andCOPD patients. The current study is not a simple duplicate ofthe study with larger number of asthma patients. Weevaluated Grs5–20 that is the reciprocal of mean Rrs at
5-20Hz, not Grs0 that is the reciprocal of estimated Rrs at0 Hz. Thus, those studies are complimentary to each other.
There are limitations to this study. First, this is aretrospective analysis of PFT and FOT, thus all the inherentproblems associated with the retrospective study design isapplicable. Our results would now have to be validatedprospectively. Second, the three measurements (Grs5–20,Rrs5–20 and Rrs5) were obtained without the patientremoving his/her mouth from the mouthpiece. This couldresult in overestimation of d-score in FOT measures. Theintra-subject variation of the FOT measures in patients withor without obstruction are reported with coefficients ofvariation between 10 to 15.2.1,15,16 Thus, the manufacturerof the specific IOS is not recommending repeating measure-ments. Third, upper airway shunt artifacts could under-estimate the upper airway resistance measurements. Tominimize this artifact, all subject held their cheek to reducethe shunt in our study.17,18 Nonetheless this artifact isparticularly documented in patients with airway obstruc-tion. Use of head generator has been suggested to reducethe artifacts.19 In a comparative study by Iwatsubo et al.20
they found that the standard method of applying forcedoscillation at the mouth seems an acceptable method formeasuring respiratory impedance compared to the headgenerator method. Lastly, coherence functions were notused in our study unlike in other previous studies21 becausethey were not saved in the PFT database. On the other hand,in the ERS guideline for FOT standardization, the coefficientof variation is optionally recommended as the main index tothe use for the reliability and repeatability of airwayimpedance data.3 The coefficient of variation is useful forcomparing scatter of variables, since that is defined asstandard of deviation divided by mean. To compensate forthis, we used the d-score, which incorporates the pre- andpost-standard deviation and mean value into the equation inour study. This is an equally statistically acceptable orpossibly even better alternative than the coefficient ofvariation cited by ERS.
In conclusion, we found that several forced oscillationmeasures, namely Grs5–20, Rrs5–20 and Rrs5, are morespecific for detecting bronchodilator response in patientswith asthma than FEV1. These measurements are also

ARTICLE IN PRESS
M. Yaegashi et al.1000
equally sensitive to FEV1. Since measurement of forcedoscillation is an easier technique for patients to perform,FOT may be useful to detect bronchodilator response inasthmatic patients. Future research should test our findingsin a prospective fashion.
References
1. Van Noord JA, Smeets J, Clement J, Van de Woestijne KP,Demedts M. Assessment of reversibility of airflow obstruction.Am J Respir Crit Care Med 1994;150(2):551–4.
2. Zerah F, Lorino AM, Lorino H, Harf A, Macquin-Mavier I. Forcedoscillation technique vs spirometry to assess bronchodilatationin patients with asthma and COPD. Chest 1995;108(1):41–7.
3. Oostveen E, MacLeod D, Lorino H, Farre R, Hantos Z, Desager K,et al. The forced oscillation technique in clinical practice:methodology, recommendations and future developments. EurRespir J 2003;22(6):1026–41.
4. Lung function testing: selection of reference values andinterpretative strategies. American Thoracic Society. Am RevRespir Dis 1991;144(5):1202–18.
5. Standardization of Spirometry, 1994 Update. American ThoracicSociety. Am J Respir Crit Care Med 1995;152(3):1107–36.
6. Vogel JSU. Impulse Oscillometry. Frankfurt am Main: pmlVerlagsgruppe; 1994.
7. Nagels J, Landser FJ, van der Linden L, Clement J, Van deWoestijne KP. Mechanical properties of lungs and chest wallduring spontaneous breathing. J Appl Physiol 1980;49(3):408–16.
8. Landser FJ, Nagles J, Demedts M, Billiet L, van de Woestijne KP.A new method to determine frequency characteristics of therespiratory system. J Appl Physiol 1976;41(1):101–6.
9. Cohen J. Statistical power analysis for the behavioral sciences,2nd ed. Hillsdale NJ: Erlbaum; 1988.
10. Anthonisen NR, Wright EC. Bronchodilator response in chronicobstructive pulmonary disease. Am Rev Respir Dis 1986;133(5):814–9.
11. Tweeddale PM, Alexander F, McHardy GJ. Short termvariability in FEV1 and bronchodilator responsiveness in patientswith obstructive ventilatory defects. Thorax 1987;42(7):487–90.
12. Van Noord JA, Clement J, Van de Woestijne KP, Demedts M.Total respiratory resistance and reactance in patients withasthma, chronic bronchitis, and emphysema. Am Rev Respir Dis1991;143(5 Pt 1):922–7.
13. Horan T, Mateus S, Beraldo P, Araujo L, Urschel J, Urmenyi E,et al. Forced oscillation technique to evaluate tracheostenosis in patients with neurologic injury. Chest 2001;120(1):69–73.
14. van Noord JA, Cauberghs M, Van de Woestijne KP, Demedts M.Total respiratory resistance and reactance in ankylosingspondylitis and kyphoscoliosis. Eur Respir J 1991;4(8):945–51.
15. van den Elshout FJ, van de Woestijne KP, Folgering HT.Variations of respiratory impedance with lung volume inbronchial hyperreactivity. Chest 1990;98(2):358–64.
16. Neild JE, Twort CH, Chinn S, McCormack S, Jones TD, BurneyPG, et al. The repeatability and validity of respiratoryresistance measured by the forced oscillation technique. RespirMed 1989;83(2):111–8.
17. Peslin R, Duvivier C, Gallina C, Cervantes P. Upper airwayartifact in respiratory impedance measurements. Am Rev RespirDis 1985;132(3):712–4.
18. Cauberghs M, Van de Woestijne KP. Effect of upper airway shuntand series properties on respiratory impedance measurements.J Appl Physiol 1989;66(5):2274–9.
19. Peslin R, Duvivier C, Didelon J, Gallina C. Respiratoryimpedance measured with head generator to minimize upperairway shunt. J Appl Physiol 1985;59(6):1790–5.
20. Iwatsubo Y, Lorino H, Hubert C, Duvivier C, Peslin R, Pham QT,et al. Measurement of respiratory impedance by forcedoscillation: comparison of the standard and head generatormethods. Eur Respir J 1994;7(5):901–6.
21. Lorino H, Mariette C, Karouia M, Lorino AM. Influence of signalprocessing on estimation of respiratory impedance. J ApplPhysiol 1993;74(1):215–23.