the truth, the whole truth, and nothing but the truth: a...
TRANSCRIPT

Environment for Development
Discussion Paper Series November 2010 EfD DP 10-24
The Truth, the Whole Truth, and Nothing but the Truth
A Multiple-Country Test of an Oath Script
Fredr ik Car lsson , M i tesh Ka ta r ia , A lan Kru pn ick , E l ina Lampi ,
Åsa Lö fgren , P ing Q in , Thomas S te rner , and Sus ie Chung

Environment for Development
The Environment for Development (EfD) initiative is an environmental economics program focused
on international research collaboration, policy advice, and academic training. It supports centers in Central
America, China, Ethiopia, Kenya, South Africa, and Tanzania, in partnership with the Environmental
Economics Unit at the University of Gothenburg in Sweden and Resources for the Future in Washington, DC.
Financial support for the program is provided by the Swedish International Development Cooperation Agency
(Sida). Read more about the program at www.efdinitiative.org or contact [email protected].
Central America Environment for Development Program for Central America Centro Agronómico Tropical de Investigacíon y Ensenanza (CATIE) Email: [email protected]
China Environmental Economics Program in China (EEPC) Peking University Email: [email protected]
Ethiopia Environmental Economics Policy Forum for Ethiopia (EEPFE) Ethiopian Development Research Institute (EDRI/AAU) Email: [email protected]
Kenya Environment for Development Kenya Kenya Institute for Public Policy Research and Analysis (KIPPRA) Nairobi University Email: [email protected]
South Africa Environmental Policy Research Unit (EPRU) University of Cape Town Email: [email protected]
Tanzania Environment for Development Tanzania University of Dar es Salaam Email: [email protected]

© 2010 Environment for Development. All rights reserved. No portion of this paper may be reproduced without permission
of the authors.
Discussion papers are research materials circulated by their authors for purposes of information and discussion. They have
not necessarily undergone formal peer review.
The Truth, the Whole Truth, and Nothing but the Truth:
A Multiple-Country Test of an Oath Script
Fredrik Carlsson, Mitesh Kataria, Alan Krupnick, Elina Lampi, Åsa Löfgren, Ping Qin,
Thomas Sterner, and Susie Chung
Abstract
Hypothetical bias is one of the main issues bedeviling the field of nonmarket valuation. The general
criticism is that survey responses reflect how people would like to behave, rather than how they actually behave.
In our study of climate change and emissions reductions, we took advantage of the increasing bulk of evidence
from psychology and economics that addresses the effects of making promises, in order to investigate the effect
of an oath script in a contingent valuation survey. The survey was conducted in Sweden and China, and its
results indicate that an oath script has significant effects on respondent behavior in answering willingness-to-pay
(WTP) questions, some of which vary by country. In both countries, the share of zero WTP responses and
extremely high WTP responses decreases when an oath script is used, which also results in lower variance. In
China, the oath script also reduces the average WTP, cutting it by half in certain instances. We also found that
the oath script has different impacts on various respondent groups. For example, without the oath script,
Communist party members in China are more likely than others to have a positive WTP for emissions
reductions, but with the oath script, there is no longer any difference between the groups.
Key Words: oath script, hypothetical bias, willingness to pay
JEL Classification: D61, Q5

Contents
Introduction ............................................................................................................................. 1
1. Descriptions of the Survey and the Oath Script ............................................................... 4
1.1 The Oath Script ............................................................................................................ 6
1.2 Hypotheses on the Effect of an Oath Script ................................................................. 8
1.3 Administration of the Surveys ..................................................................................... 9
2. Characteristics of Respondents ......................................................................................... 9
3. Willingness to Pay Results................................................................................................ 10
3.1 Econometric Analysis ................................................................................................ 13
3.2 Who Is Affected by the Oath Script? ......................................................................... 17
4. Conclusions ........................................................................................................................ 21
Appendices ............................................................................................................................. 22
References .............................................................................................................................. 27
Environment for Development Carlsson et al.
1
The Truth, the Whole Truth, and Nothing but the Truth:
A Multiple-Country Test of an Oath Script
Fredrik Carlsson, Mitesh Kataria, Alan Krupnick, Elina Lampi, Åsa Löfgren, Ping Qin,
Thomas Sterner, and Susie Chung
Introduction
Stated preference methods are frequently used for valuing public and quasi-public goods.
Indeed, for some types of public goods, such as those with expected high existence values, only
stated preference approaches are available. One of the major concerns with stated preference
approaches is to what extent survey responses are consistent with actual decisionmaking
behavior, often called hypothetical bias.1 While the empirical evidence is not conclusive, the
majority of studies suggests that willingness-to-pay (WTP) estimates are higher in a hypothetical
setting than the corresponding real setting. (See. e.g., Cummings et al. 1995; Cummings et al.
1997; and Frykblom 1997. Also see List and Gallet 2001; and Murphy et al. 2005 for meta-
analyses. Additionally, Ehmke et al. 2008 found that the extent of hypothetical bias, for the same
survey design, can differ across countries.)
In the contingent valuation literature, many studies have explored different methods for
reducing the difference between real and hypothetical situations. One of the most successful and
frequently imitated efforts has been the use of a cheap talk script, initially suggested by
Fredrik Carlsson, Department of Economics, University of Gothenburg, Box 640, SE-40530 Gothenburg, Sweden,
(email) [email protected]; Mitesh Kataria, corresponding author, Max Planck Institute of
Economics, Kahlaische Straße 10, D-07745 Jena, Germany, (tel) +49 3641 686 632, (fax) +49 3641 686-667,
(email) [email protected] ; Alan Krupnick, Resources for the Future, 1616 P St., NW, Washington, DC, 20036,
USA, (email) [email protected]; Elina Lampi, Department of Economics, University of Gothenburg, Box 640, SE-
40530 Gothenburg, Sweden, (email) [email protected]; Åsa Löfgren, Department of Economics,
University of Gothenburg, Box 640, SE-40530 Gothenburg, Sweden, (email) [email protected]; Ping
Qin, Peking University, College of Environmental Sciences and Engineering, 100871 Beijing, China, (email)
[email protected]; Thomas Sterner, Department of Economics, University of Gothenburg, Box 640, SE-
40530 Gothenburg, Sweden, (email) [email protected]; Susie Chung, Resources for the Future, 1616
P St., NW, Washington, DC, 20036, USA, (email) [email protected]
Financial support from the Adlerbertska Research Fund, Formas, Sida (through the Environment for Development
Initiative), Jan Wallander and Tom Hedelius Foundation, and Clipore (Mistra’s Climate Policy Research Program)
is gratefully acknowledged.
1 The term hypothetical bias is somewhat misleading because it suggests that one single real value exists with which
we can compare the value obtained from a hypothetical situation. However, studies have shown that experimental
situations involving real payoffs can also lead to biased estimates (e.g., Alpízar et al. 2008; List et al. 2004).

Environment for Development Carlsson et al.
2
Cummings and Taylor (1999). The cheap talk script aims to reduce hypothetical bias by
thoroughly describing and discussing the propensity that respondents have to exaggerate their
stated willingness to pay. The underlying idea of the script is that, by raising the issue in the
survey, respondents will not want to be part of such an ill-behaved group and will be less prone
to hypothetical bias. The effect of the cheap talk script is varied and, among other factors, its
success seems to depend on the characteristics of the good, the length of the script, and the
valuation method (see Aadland and Caplan 2003; ibid. 2006; Carlsson et al. 2005; Cummings
and Taylor 1999; List 2001; and Murphy et al. 2005). Given these limitations, it is too optimistic
to expect cheap talk to completely mitigate hypothetical bias.2 Furthermore, respondents may
still be tempted to answer insincerely due to motives, such as projecting a ―better‖ self-image,
applying strategic behavior, or protesting against the survey.
A more recent approach to addressing hypothetical bias is the use of an oath script. With
this approach, respondents are asked to swear (or promise) to answer truthfully, as if they were in
a courtroom. An oath can be viewed as an active commitment, in contrast to a cheap talk script,
which is only informative. Whereas a cheap talk script is likened to using ―moral suasion,‖
encouraging the respondents to behave better than others, an oath may induce more truthful
answers by binding respondents to their answers.
The seminal paper on the effects of oaths is Jacquemet et al. (2009), which used an oath
in a laboratory setting. Prior to participating in an incentive-compatible second-price auction,
bidders were asked to sign an oath document and swear ―on their honor‖ to give honest answers.
The main result was that subjects who took the oath were, on average, less likely to either
overstate or understate their bids; that is, the variance of bids was reduced. Furthermore, the
study found that the hypothetical treatment with an oath outperformed hypothetical and
treatments with monetary incentives without an oath, as well as treatments with monetary
incentives with an oath.3 Jacquemet et al. (2010) found, by comparing votes in a real and
hypothetical setting with and without an oath script, that an oath script eliminated hypothetical
bias in an election referendum.
2 There are other suggestions for how to reduce hypothetical bias, for example, ex-post calibration of the WTP
responses with follow-up questions on certainty (e.g., Champ et al. 1997; Champ and Bishop 2001) and time-to-
think protocols (Cook et al. 2007; Whittington et al. 1992).
3 Jacquemet et al. (2009) found that monetary incentives weaken the positive impact of taking an oath and discussed
that as an extrinsic motivation. In other words, money may have a crowding-out effect on an intrinsic motivation,
such as keeping one´s promises after taking an oath.
Environment for Development Carlsson et al.
3
The aim of our study is to investigate the effect of an oath script in a contingent valuation
survey concerning climate change, conducted outside a laboratory setting and with a relatively
large sample size.4 As far as we know, this has not been done before. Note that Jacquemet et al.
(2010) did not estimate WTP, but instead looked at the share of yes-voters for a referendum with
a fixed cost (bid). Outside the laboratory setting, for nonmarket goods, it is difficult to test
whether or not the oath script leads to a closer match between hypothetical and real WTP, since
one cannot generally observe real WTP. This is particularly true for our good in question,
reductions in greenhouse gas emissions. What we can do, however, is investigate the differences
in WTP across treatments with and without an oath. We also can relate our main findings to
Jacquemet et al. (2009) to see if our subjects show similar behavior.
The contingent valuation survey elicited willingness to pay for reducing greenhouse gas
emissions and was conducted with and without an oath script in China and Sweden. We analyzed
the effect of the oath script on two decisions: first, whether the respondent is willing to pay
anything to reduce greenhouse gas emissions; and second, how much the respondent is willing to
pay. Each respondent answered WTP questions for three different levels of emissions reductions.
In addition, we identified which sociodemographic groups of respondents are more likely to be
affected by the oath script. By using identical surveys in China and Sweden, we were also able to
test the commitment device in two different cultural contexts.
We found several notable results. First, respondents in both countries were less likely to
state a zero WTP in the oath treatment, a result that is in line with the findings by Jacquemet et
al. (2009). Second, the oath script raised the average conditional WTP in Sweden for one of three
WTP questions asked. In the Chinese sample, the oath script reduced average conditional WTP
substantially, in some instances around 50 percent. Third, the oath script had varying impacts on
respondent groups with different demographic characteristics, and we found that the cultural
context could be an important factor. Last, we found that, irrespective of the effect of the oath on
average WTP, the variance of the WTP was reduced.
4 What works in lab experiments does not necessary work outside the lab. There are many reasons for this. For
example, differences in population profile (experiments in economics and psychology often use students as subjects)
and demand effects (i.e., subjects want to comply with what the experimenter expects from them) are two well-
known sources of possible divergence between lab and field behavior. Jacquemet et al. (2009) found evidence
against the demand effect in their study. Furthermore, an auction-based value revelation mechanism may trigger
different behavior and feelings (for example pleasure of winning), compared to a non-market valuation survey.

Environment for Development Carlsson et al.
4
The paper is organized as follows. Section 1 describes the survey and the oath script, as
well as hypotheses on the effect of the oath script. Section 2 gives the characteristics of the
respondents. Section 3 presents the WTP results and econometric analysis, including an analysis
of which groups of respondents are more likely to change their behavior due to the oath script.
Section 4 provides overall conclusions.
1. Descriptions of the Survey and the Oath Script
The survey consisted of four sections. The first section elicited general attitudes about
climate change. In the second section, the survey provided information on the effects of climate
change, which was summarized from the Intergovernmental Panel on Climate Change (IPCC)
reports. Respondents were told that a future temperature increase will depend on the amount of
future global CO2 emissions: specifically, if CO2 emissions are reduced from current emissions
levels by 30 percent, 60 percent, or 85 percent, then the temperature increase can be limited to
4°F, 3°F, or 2°F, respectively. If the world instead does not reduce emissions, but continues with
―business as usual,‖ the temperature is expected to increase by more than 4°F by 2050. We
explained that this would most likely correspond to large changes in the global ecosystems and
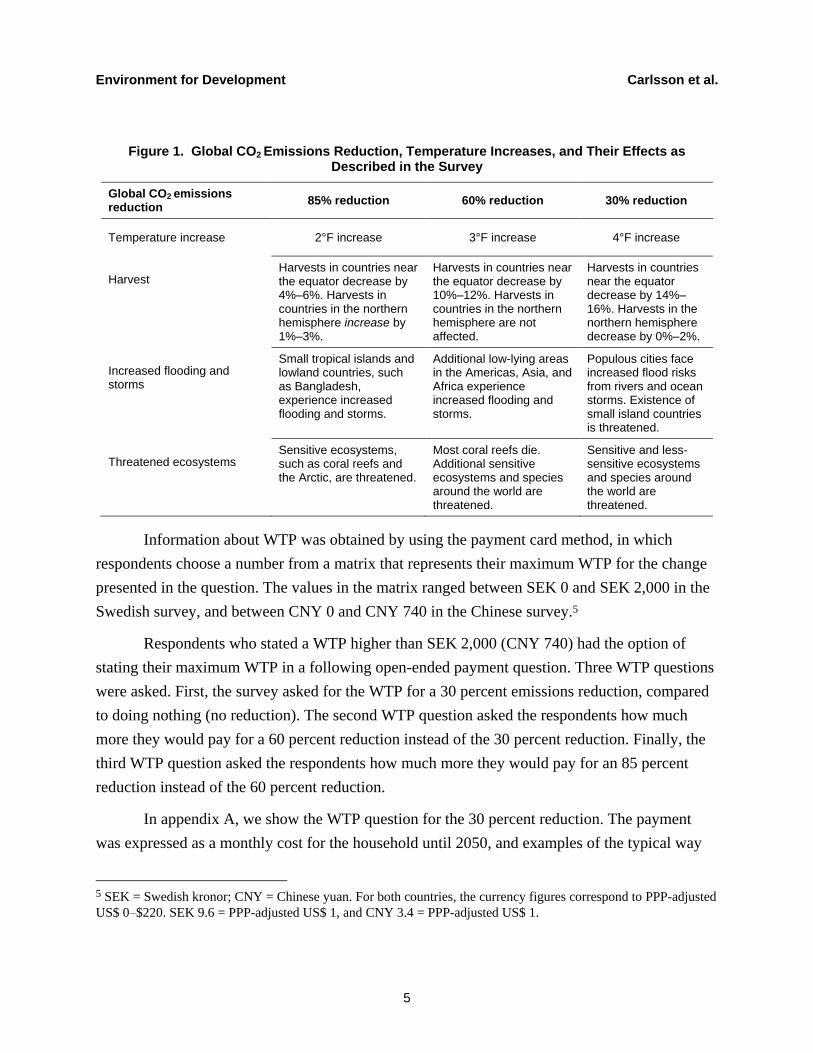
most countries would be negatively affected. An information screen (figure 1), that was shown to
the respondents, summarized the effect of the temperature increases on harvests, flooding,
storms, and ecosystems by the year 2050. Subsequently, questions about the respondents’
attitudes on reducing global CO2 emissions were included. (For a full description of the survey
and the implementation, see Carlsson et al. 2010.)
Toward the end of section 2, a cheap-talk script was included. In the oath script
treatment, the commitment device followed the cheap talk script, asking respondents to promise
to answer the questions truthfully. (The oath script is described and further discussed in section
1.1). This section of the questionnaire concluded with the WTP questions for reducing CO2
emissions.
Environment for Development Carlsson et al.
5
Figure 1. Global CO2 Emissions Reduction, Temperature Increases, and Their Effects as Described in the Survey
Global CO2 emissions reduction
85% reduction 60% reduction 30% reduction
Temperature increase 2°F increase 3°F increase 4°F increase
Harvest Harvests in countries near the equator decrease by 4%–6%. Harvests in countries in the northern hemisphere increase by 1%–3%.
Harvests in countries near the equator decrease by 10%–12%. Harvests in countries in the northern hemisphere are not affected.
Harvests in countries near the equator decrease by 14%–16%. Harvests in the northern hemisphere decrease by 0%–2%.
Increased flooding and storms
Small tropical islands and lowland countries, such as Bangladesh, experience increased flooding and storms.
Additional low-lying areas in the Americas, Asia, and Africa experience increased flooding and storms.
Populous cities face increased flood risks from rivers and ocean storms. Existence of small island countries is threatened.
Threatened ecosystems Sensitive ecosystems, such as coral reefs and the Arctic, are threatened.
Most coral reefs die. Additional sensitive ecosystems and species around the world are threatened.
Sensitive and less-sensitive ecosystems and species around the world are threatened.
Information about WTP was obtained by using the payment card method, in which
respondents choose a number from a matrix that represents their maximum WTP for the change
presented in the question. The values in the matrix ranged between SEK 0 and SEK 2,000 in the
Swedish survey, and between CNY 0 and CNY 740 in the Chinese survey.5
Respondents who stated a WTP higher than SEK 2,000 (CNY 740) had the option of
stating their maximum WTP in a following open-ended payment question. Three WTP questions
were asked. First, the survey asked for the WTP for a 30 percent emissions reduction, compared
to doing nothing (no reduction). The second WTP question asked the respondents how much
more they would pay for a 60 percent reduction instead of the 30 percent reduction. Finally, the
third WTP question asked the respondents how much more they would pay for an 85 percent
reduction instead of the 60 percent reduction.
In appendix A, we show the WTP question for the 30 percent reduction. The payment
was expressed as a monthly cost for the household until 2050, and examples of the typical way
5 SEK = Swedish kronor; CNY = Chinese yuan. For both countries, the currency figures correspond to PPP-adjusted
US$ 0–$220. SEK 9.6 = PPP-adjusted US$ 1, and CNY 3.4 = PPP-adjusted US$ 1.

Environment for Development Carlsson et al.
6
households would pay were listed, such as increased energy and gasoline prices.6 Moreover, we
asked the respondents to assume that the costs of reducing CO2 emissions are shared among the
countries according to their emissions today.7
When the respondents chose their WTP value, both the monthly payment and the
corresponding annual cost for the household were shown on the screen. The purpose of this was
to ensure that the respondents clearly understood how much they said they were willing to pay.
Section 3 of the survey was a choice experiment on rules for allocating the
responsibilities for CO2 reductions across countries and is not included in this paper. Finally, the
fourth section asked questions about the respondent’s socioeconomic characteristics.
1.1 The Oath Script
The surveys with and without the oath were identical except for the inclusion of the oath
script. In the treatment without the oath, the WTP questions followed the cheap talk script.
Otherwise, the oath script was placed immediately before the WTP questions. Since we wanted
the respondents to be aware of what they were taking the oath for, the survey introduced the oath
by informing the respondent that it would ask for their household’s willingness to pay for CO2
emissions reductions.
Both treatments included a shorter version of a standard cheap talk script. The script read
as follows: ―Before making your choices, please consider how an increased cost would affect
your possibilities of buying other things. Previous studies of this kind have shown that people
claim to be willing to pay more money than they actually would in a real situation. Given this, it
is important for you to answer these questions as truthfully as possible.‖
6
Wiser (2007) found that the WTP to support climate change policy depends on the payment vehicle used in the
study. For example, with a collective payment mechanism, the elicited WTP is higher, compared to using voluntary
payment mechanisms. In our study, we did not test for different payment vehicles, but rather made clear how the
payments were made and kept this constant across countries. 7 The text read: ―We will now ask you about your household’s willingness to pay for CO2 emissions reductions.
Reducing emissions will be costly for households, mainly because of increased energy costs, such as higher
electricity and gasoline prices. Your household and your descendants will have to pay a monthly cost until the year
2050. Moreover, the cost will be adjusted for inflation over time. Also, assume that the costs of reducing CO2
emissions are shared among the countries according to their emissions today.‖
Environment for Development Carlsson et al.
7
In our oath design, respondents were first asked, ―Do you feel that you can promise us to
answer as truthfully as possible the questions that follow?‖ The alternatives were 1) ―Yes, I
promise to answer the questions in the survey as truthfully as possible,‖ or 2) ―No, I cannot
promise this.‖ From a practical viewpoint, such a commitment device is reminiscent of a
common practice in Anglo-Saxon courts, where a witness is instructed to take an oath ―to tell the
truth, the whole truth, and nothing but the truth.‖ However, asking the respondent to swear to tell
the truth is not customary in Swedish or Chinese court systems. Respondents might also feel
uncomfortable and regard it as strange to be forced to swear an oath in a survey. Therefore, we
opted for a more neutral wording of the question, using ―promise‖ instead of ―swear.‖
The essence of an oath script is to increase the respondent’s commitment and attention to
the survey, diminishing the propensity of light-hearted or ―insincere‖ responses. Theoretical
support can be found in the theory of commitment in social psychology (Kiesler 1971;
Jacquemet et al. 2009; Joule and Beauvois 1998). There is also evidence in economics research,
suggesting that a promise can induce emotional commitments to fulfill the promise (Braver 1995,
69–86; Ostrom et al. 1992; Ellingsen and Johannesson 2004). Ellingsen and Johannesson (2004)
proposed a model that includes preferences for keeping one’s word. In a recent study, Vanberg
(2008) examined whether people keep their promises because they have preferences for keeping
their word or because they dislike letting others down. His results suggest that people have
preferences for promise keeping per se. Jacquemet et al. (2009) tested whether their results
changed when the respondents were first asked to read a warning that lying might cause negative
consequences for other people. They found that the results of the oath are independent of this
warning and concluded that the oath works through the intrinsic motives of a person to tell the
truth. In our case, the respondents were anonymous survey participants, meaning that any effects
of the oath would be through internal, not external, processes.
An oath script may also be seen as a signal that the topic of the study is important and
that one’s answers matter more than in a survey without an oath script. The oath can also be
thought of as an emotionally charged version of the cheap talk script. We do not assume,
however, that all people not telling the truth will admit it. What is crucial is that we emphasized
to the respondents that it is important to tell the truth, and thus the answer to the oath question is

Environment for Development Carlsson et al.
8
of secondary importance. In our study, most subjects chose to promise to tell the truth, so we
only included these subjects in the analysis.8
1.2 Hypotheses on the Effect of an Oath Script
What is the expected effect of an oath script in a payment card setting? One might expect
that an oath would shift the whole WTP distribution to the left (including a rise in the number of
zero bids), which leads to a lower valuation in general and a lower average WTP in particular.
This rests on the assumption that people will exaggerate their WTP in hypothetical situations, for
example, due to warm-glow effects (Andreoni 1990) or moral satisfaction (Kahnemann and
Knetsch 1992). However, an oath script could also affect the extent of strategic behavior (also
known as strategic bias).
Strategic bias arises when the respondent provides a biased answer in order to influence a
particular outcome. This can be prominent in hypothetical surveys. For example, respondents in
favor of a project may be tempted to overstate their WTP in an open-ended or payment-card
question, assuming that a favorable decision depends on whether or not the survey produces a
sufficiently large average value. At the same time, respondents whose expected cost of a scenario
is larger than their WTP may be tempted to act strategically and state a zero WTP.
In any case, the oath script can make strategic responses less acceptable to the
respondent, and therefore result in a decrease in conditional WTP (i.e., WTP|WTP>0) and in the
share of respondents stating zero WTP, leaving the effect on average WTP indeterminate, but the
variance of WTP tighter. In addition, protest bids and insincere bids may also be affected by an
oath. Because protest bids are usually thought to involve a zero bid, the oath script might result
in fewer such bids. Insincere bidding, made less insincere by an oath, could result in either an
increase or decrease in zero bids or WTP condition on WTP>0.
Jacquemet et al. (2009) found in their experimental study that taking an oath decreased
both the frequency of zero bids (interpreted as a decrease in opting-out behavior) and extreme
bids that violate the earnings budget constraint set in the experiment; thus, they found a tighter
variance for WTP. Because of opposing forces influencing zero bids and conditional WTP, we
are agnostic about the expected direction of results, including the size of the WTP variance.
8 We also conducted an analysis that included the few respondents who answered no to the oath question, and our
results remained robust.
Environment for Development Carlsson et al.
9
The extent of hypothetical bias depends, as discussed in the introduction, on a number of
factors. In particular, Ehmke et al. (2008) found that hypothetical bias could differ across
different countries due to cultural differences. It is, of course, not clear that their results can be
generalized, but their results suggest that the oath script could have different impacts on Chinese
and Swedish respondents.
1.3 Administration of the Surveys
The two surveys were conducted in November and December 2009. The questionnaire
was carefully designed and tested on several focus groups and pilot studies. The survey was
designed to be self-administered on the computer to eliminate interviewer bias and strategic
answering to please the interviewer. In China, the survey was conducted on laptops in special
rooms with invited respondents. In Sweden, the survey was taken online. The survey yielded
2,406 responses in Sweden (1,230 for the version without an oath script, and 1,176 for the
version with an oath script), and 550 responses in China (277 for the version without an oath
script, and 273 for the version with an oath script). The Chinese survey was administered in one
city, Nanning, the capital of the autonomous Guangxi region in southwest China.9 Respondents
were randomly selected to participate in the survey using a neighborhood-based sampling
strategy that has been used in previous surveys (Krupnick et al. 2010). The respondents in the
Swedish survey were reached using panel members of ―Panel.se‖, Sweden’s largest survey panel
with around 100,000 members. Panel.se members are recruited by telephone via random digit
dialing, as well as through online recruitment. Members between 18–74 years were randomly
selected to participate in our survey.
2. Characteristics of Respondents
Descriptive statistics of the four samples are presented in table 1. Using a chi-square test
(binary variables) and a t-test (remaining variables), we cannot reject the hypothesis of equal
9
To develop a sample that was reasonably representative of the Nanning population, we randomly selected 277
respondents to take the survey without oath script, and 273 respondents for the survey with the oath script. Although
samples within any community should ideally be stratified for income and education, there is no public information
database in Nanning that includes education, income, gender, and other important demographic characteristics.
Therefore, we randomly chose families through a population information network set up by the Nanning
government. Specifically, the survey teams adopted a five-stage random sampling method to select respondents.
(The primary sampling unit is the city district, the second sampling unit is the urban sub-district, the third is the
neighborhood committee, and the fourth is households, and fifth is the individual.)

Environment for Development Carlsson et al.
10
means/distributions for any of the socio-economic variables in Sweden, except for university
education. In China, the same is true for all socioeconomic variables, other than members of the
Communist Party. Thus, the two samples in the two different treatments are generally
comparable to each other. Also note that a large fraction of the respondents in the oath treatment
group promised that they would answer the survey truthfully. In the Swedish sample, 98 percent
made this promise, and 95 percent in the Chinese sample. This is in line with Jacquemet et al.
(2009), in which only one respondent elected not to sign the oath in one of the experiments,
corresponding to a refusal rate of just over 5 percent.
Table 1. Descriptive Statistics
Variable (description)
Sweden China
Without oath
Std. dev.
With oath
Std. dev.
Without oath
Std. dev.
With oath
Std. dev.
Female (1 if female) 0.483 0.490 0.484 0.440 0.497
Age (in years) 49.679 15.431 49.821 15.366 53.950 13.965 53.934 14.106
No. of adults in household (>18 years)
1.868 0.677 1.845 0.632 3.256 1.350 3.223 1.200
No. of children in household (<18 years)
0.522 0.911 0.526 0.946 0.596 0.809 0.531 0.697
Household members with university edu-cation
0.374 0.412 0.274 0.253
Income 3.386 1.526 3.413 1.492 1.034 0.952 0.915 0.784
Household active in religious organization (1 if active)
0.064 0.065 0.025 0.011
Left-wing party 0.315 0.305
Green party 0.119 0.134
Other party 0.154 0.150
Center/right-wing party (ref. category)
0.413 0.411
Communist 0.170 0.304
No. in sample 1,230 1,176 277 273
3. Willingness to Pay Results
Based on the responses to the three payment-card questions, we calculated a number of
WTP measures. What we report in this paper is the WTP to reduce CO2 emissions zero–30

Environment for Development Carlsson et al.
11
percent, 30–60 percent, and 60–85 percent. Respondent WTP is set to the midpoint of the
interval,10 except for those respondents who stated a WTP that was outside the range of the bid
vector. For these respondents, the WTP is set as the point values they gave in the open-ended
payment question. In order to be able to compare the responses between the two countries, we
report WTP in PPP-adjusted U.S. dollars.11 Table 2 reports each country’s monthly WTP and the
share of respondents with zero WTP for each reduction level, with and without the oath
treatment. For the treatments with the oath script, we only included respondents who agreed to
answer the questions as truthfully as possible.12 In the appendix, we present the full distribution
of responses for the various reduction levels and treatments.
Irrespective of the treatment group, a number of regularities are apparent in table 2.
Swedes have substantially higher WTP for reducing CO2 emissions at all reduction levels,
whether on a conditional or unconditional basis, implying, as can be seen in the table, that the
share of respondents who are willing to pay nothing is much lower in Sweden. In addition, there
is evidence in the Swedish sample for declining marginal utility as CO2 reductions get larger;
there is less evidence of this effect in the Chinese sample.
Turning to differences in the treatments, we had two opposing hypotheses about the
effects of an oath on the share of respondents with zero WTP. We found some evidence
supporting the hypothesis that the share of zero bids is lower for subjects taking an oath. Indeed,
for every CO2 reduction level in both countries, except for the 85 percent reduction in China, the
share of subjects stating a zero WTP is relatively lower in the oath script treatment. However,
proportion tests indicate that there are only significant differences between the shares of zero
WTP for the 30 percent and 60 percent reduction in Sweden, and the 30 percent reduction in
China.
10 There are many ways to interpret a choice on a payment screen. The midpoint approach may be the most neutral.
Furthermore, since the WTP for 60% and 85% reductions depend on the choices made in the preceding question(s),
there will be a large number of intervals, which means that it is simpler to treat the data as continuous.
11 SEK 9.6 = US$ 1 (PPP-adjusted); and CNY 3.4 = US$ 1 (PPP-adjusted).
12 There are some differences between the respondents who agreed to answer truthfully and those who did not. In
both the Swedish and Chinese samples, there is a larger fraction of zero WTP responses and lower WTP responses
for those who did not agree to answer truthfully, but no significant differences. Given the small sample sizes for
those who did not agree to answer, the comparisons and tests are not very reliable.

Environment for Development Carlsson et al.
12
Table 2. Monthly WTP in PPP U.S. Dollars and Share of Subjects with Zero WTP
SWEDEN
Without oath
(1,230 obs.)
With oath
(1,152 obs.)
CO2 reduction
All
Mean (std. err.)
WTP>0
Mean (std. err.)
Share zero WTP
All
Mean (std. err.)
WTP>0
Mean (std. err.)
Share zero WTP
0%–30% 24.08
(40.68)
26.49
(41.91)
0.091 28.12
(40.25)
30.16
(40.94)
0.067
30%–60% 19.79
(47.32)
23.48
(50.70)
0.156 20.96
(36.95)
24.10
(38.66)
0.130
60%–85% 17.14
(55.63)
23.55
(64.06)
0.272 16.09
(35.55)
21.89
(39.91)
0.265
CHINA
Without oath
(277 obs.)
With oath
(259 obs.)
CO2 reduction
All
Mean (std. err.)
WTP>0
Mean (std. err.)
Share zero WTP
All
Mean (std. err.)
WTP>0
Mean (std. err.)
Share zero WTP
0%–30% 4.48
(8.43)
6.46
(9.48)
0.307 3.57
(3.97)
4.72
(3.93)
0.243
30%–60% 3.39
(9.90)
6.14
(12.68)
0.448 2.00
(2.46)
3.26
(2.51)
0.386
60%–85% 3.23
(11.25)
6.44
(15.24)
0.489 1.62
(3.17)
3.47
(3.86)
0.533
Ultimately, we estimated the effects of the oath script on the average WTP across the
sample, which depends on the effect of the oath script on both the share bidding zero and the
conditional WTP. We found that the conditional WTP decreases with the oath script in the
Chinese sample, in which the treatment effect is significant for all reduction levels. In the
Swedish sample, however, the conditional WTP is higher for the sample given the oath
treatment, and we failed to reject the hypothesis that there is no significant difference for the 30
percent reduction using a two-sided t-test. The need for future empirical efforts is evident to
understand such patterns and whether they are dependent on the commodity or cultural context.
Because we see that the oath decreases the share of zero-WTP responses and conditional
WTP in China, the effect on the average WTP depends on which effect is stronger and more

Environment for Development Carlsson et al.
13
pervasive. Our results indicate that the oath treatment results in a significantly lower average
WTP for the 30–60 percent and 60–85 percent reductions, suggesting that the effect in terms of
lower conditional WTP is stronger there than on the respondents with a zero WTP. In Sweden,
the effect of the oath is the opposite, raising the average WTP, although this difference is only
significant at the 30 percent level.
We now turn to the issue of variance reduction, owing to fewer zero bids and very high
bids. In line with the results of Jacquemet et al. (2009), we see support for the oath’s effect on
variance reduction. This pattern is further supported when we take a closer look at the full
distribution of WTP. The variance in WTP is consistently lower when an oath has been taken,
even where the average WTP is higher in the oath treatment. Using an F-test, we can reject the
hypothesis of equal variance between the two treatments for all reduction levels in the Chinese
data, and for all but the first reduction level in the Swedish data.
3.1 Econometric Analysis
Because there are some differences in respondent characteristics between treatments, the
next step is to estimate the effects of the oath treatment controlling for other variables. In
addition, we will explore how the oath affects respondent groups with different demographic
characteristics.
The decision of whether or not to state a positive WTP is modeled with a binary probit
model. The decision of how much to pay is modeled with a regression model with multiplicative
heteroskedasticity using only the positive responses (WTP > 0). Both models are estimated for
each level of reduction. We chose this approach because of the small Chinese sample and the
sensitivity of any selection model to how well the first decision can be explained.13 The results of
the probit models are presented in table 3.
13 Because WTP is censored at zero, these decisions can be analyzed together using a Tobit type 1 model, but this
model is somewhat restrictive because it does not allow for the possibility that the two decisions could be
fundamentally different.

Environment for Development Carlsson et al.
14
Table 3. Why People Bid More than Zero: Marginal Effects of the Probit Model
Sweden China
Variable 0–30% 30–60% 60–85% 0–30% 30–60% 60–85%
Female 0.015
(0.010)
0.003
(0.014)
-0.014
(0.019)
0.073**
(0.037)
0.097**
(0.045)
0.069
(0.046)
Age -0.001
(0.001)
-0.001
(0.001)
-0.004***
(0.001)
0.004*
(0.001)
0.006***
(0.002)
0.006***
(0.002)
Adults -0.007
(0.009)
0.004
(0.013)
-0.023
(0.016)
0.001
(0.014)
-0.023
(0.017)
-0.003
(0.018)
Children 0.012**
(0.006)
0.013
(0.009)
0.007
(0.011)
0.064**
(0.027)
-0.038
(0.030)
-0.030
(0.030)
University education
-0.002
(0.011)
-0.022
(0.015)
0.007
(0.019)
0.044
(0.048)
0.042
(0.059)
0.015
(0.058)
Income -0.002
(0.004)
-0.001
(0.006)
0.020***
(0.007)
0.246***
(0.030)
0.238***
(0.033)
0.202***
(0.029)
Religious -0.001
(0.020)
0.008
(0.028)
0.076**
(0.033)
0.132*
(0.080)
-0.182
(0.178)
-0.067
(0.174)
Left party 0.017
(0.011)
0.024
(0.016)
0.020
(0.022)
Green party 0.068***
(0.009)
0.097***
(0.016)
0.145***
(0.024)
Other party -0.105***
(0.022)
-0.130***
(0.027)
-0.133***
(0.031)
Communist party
0.085*
(0.044)
0.201***
(0.052)
0.076
(0.058)
Oath 0.019**
(0.010)
0.025*
(0.014)
0.003
(0.018)
0.080**
(0.038)
0.059
(0.46)
-0.034
(0.046)
Constant 1.495***
(0.219)
1.108***
(0.180)
1.123***
(0.159)
-1.310***
(0.328)
-1.209***
(0.305)
-1.384***
(0.305)
No. of observations
2382 2382 2382 536 536 536
Pseudo R2 0.078 0.045 0.043 0.178 0.151 0.105
Notes: Dependent variable = 1, if WTP is positive. Standard error is in parentheses.
*, **
, ***
denote coefficient is statistically significant at 10%, 5%, and 1%, respectively.
The results of the probit models on the probability of stating a positive WTP confirms the
results of the proportion and t-tests. Including an oath script increases the share of subjects
stating a positive WTP. In the Swedish sample, the effect is significant for both the 0–30 percent

Environment for Development Carlsson et al.
15
reduction and the 30–60 percent reduction, while for China the effect is significant for 0–30
percent reduction.
The results of the regression models with conditional WTP as the dependent variable are
reported in table 4. Note that these models only include respondents who stated a positive WTP.
Furthermore, we allowed for multiplicative heteroskedasticity, where .
Thus, the model allows for different variances in the two treatments (see Harvey 1976 and
Greene 2003).
Table 4. Explaining Conditional Willingness to Pay: Marginal Effects Ordinary Least Squares Models
Sweden China
Variable 0–30% 30–60% 60–85% 0–30% 30–60% 60–85%
Regression function
Female -6.349***
(1.728)
-7.620***
(1.916)
-9.942***
(2.322)
-0.609*
(0.365)
-01173
(0.358)
-0.095
(0.699)
Age -0.164***
(0.061)
-0.191***
(0.068)
-0.183**
(0.082)
0.016
(0.014)
0.027*
(0.014)
-0.041
(0.028)
Adults -2.976**
(1.481)
-0.986
(1.662)
-0.107
(2.033)
-0.054
(0.150)
0.025
(0.152)
0.207
(0.281)
Children -1.028
(1.012)
-1.537
(1.124)
0.495
(1.328)
0.345
(0.253)
0.139
(0.287)
0.242
(0.569)
University education 11.057***
(1.811)
6.588***
(2.013)
6.148**
(2.418)
0.536
(0.438)
-0.048
(0.423)
0.182
(0.844)
Income 5.891***
(0.687)
4.708***
(0.772)
3.208***
(0.930)
3.616***
(0.213)
1.274***
(0.204)
1.395***
(0.400)
Religious 6.510**
(3.525)
-0.490
(3.908)
-3.714
(4.603)
-2.175
(1.626)
-1.590
(7.086)
-1.970
(8.575)
Left party -0.683
(2.042)
-0.472
(2.270)
3.075
(2.754)
Green party 10.678***
(2.694)
9.419***
(2.937)
8.647**
(3.440)
Other party -3.466
(2.761)
-1.289
(3.077)
0.091
(3.748)
Communist party
0.468
(0.405)
0.250
(0.383)
1.197
(0.772)
Oath 3.134*
(1.696)
0.154
(1.946)
-2.025
(2.503)
-1.285*
(0.608)
-2.760***
(1.007)
-2.879**
(1.304)
Constant 18.531***
(4.635)
20.008***
(5.205)
21.828***
(6.282)
1.112
(1.146)
2.880***
(1.141)
1.100
(4.097)

Environment for Development Carlsson et al.
16
Variance function
Sigma 40.391***
(0.854)
49.545***
(1.088)
62.932***
(1.487)
7.964***
(0.406)
12.129***
(0.694)
14.617***
(0.877)
Oath -0.073
(0.060)
-0.553***
(0.063)
-0.944***
(0.068)
-2.293***
(0.144)
-3.452***
(0.160)
-2.728***
(0.176)
No. of observations 2192 2039 1742 388 312 260
R2 0.084 0.048 0.029 0.357 0.168 0.152
Notes: The dependent variable = stated WTP. Standard error is in parentheses.
*, **
, ***
denote coefficient is statistically significant at 10%, 5%, and 1%, respectively.
Again, the results in table 2 are confirmed by the regression models. In the Swedish
sample, those who agreed to answer the survey truthfully have a considerably higher conditional
WTP for the 0–30 percent reduction, and the difference is statistically significant. For the
Chinese sample, the effect is the opposite: the conditional WTP is significantly lower in the oath
script treatment for all levels of reduction. Furthermore, the variance is consistently lower in the
oath treatments for all reductions levels for China, and for two of the reduction levels for
Sweden. Moreover, taking an oath seems to decrease the variance relatively more in the Chinese
data than in the Swedish data. The decrease in variance is around 90 percent in the Chinese case,
while the corresponding decrease in the Swedish data is only marginal, although statistically
significant.
Finally, we turn to the effect of the oath script treatment on unconditional WTP. This
effect depends on the two effects we already have reported, the effect on the probability of
stating a positive response, P ; and the effect on the conditional WTP,
. The effect on unconditional WTP of a change in a dependent variable x is
thus (cf. McDonald and Moffitt 1980):
See the effect on the unconditional WTP of the oath script treatment in table 5.

Environment for Development Carlsson et al.
17
Table 5. Effect of Oath Script on Unconditional WTP
Sweden China
0%–30% 30%–60% 60%–85% 0%–30% 30%–60% 60%–85%
3.431***
(1.586)
-0.732
(1.700)
-1.406
(1.877)
-0.601
(0.512)
-1.331*
(0.627)
-1.643**
(0.708)
Note: Standard error is in parentheses.
*, **
, ***
denote coefficient is statistically significant at 10%, 5%, and 1%, respectively.
In the Swedish sample, the group that received the oath script has a considerably higher
unconditional WTP for the 0–30 percent reduction (i.e., Swedes are willing to pay $3.43 more
for a 0–30 percent reduction in the treatment with the oath script, compared to the treatment
without an oath), and the difference is statistically significant. In the Chinese sample, the effect is
the opposite. For all levels of reduction, the unconditional WTP is substantially lower in the oath
script treatment, and the difference is significant for the 30–60 percent and 60–85 percent
reductions.
3.2 Who Is Affected by the Oath Script?
Thus far, we have shown that the oath script does affect behavior in both Sweden and
China, albeit in different directions. However, it is also interesting to determine if different
respondent groups are more or less affected by the oath script. We investigated whether any
differences are consistent across respondent groups and between the two cultural contexts. In
order to examine the effect of the oath script, we estimated the same models as before, but
included interaction terms between the oath treatment dummy variable and respondent
characteristics; in other words, for each group of respondents, we estimated two sets of
parameters. One set represents the main effect, while the other represents the change due to the
oath script. Because we still included the treatment dummy variable for the oath treatment, these
interaction terms show whether a certain group of respondents is more or less affected by taking
the oath, holding other respondent characteristics constant. The results for the probit model
analyzing the likelihood to state a positive WTP are shown in table 6.

Environment for Development Carlsson et al.
18
Table 6. Marginal Effects for Probit Models with Interaction Terms
Sweden China
Variable 0%–30% 30%–60% 60%–85% 0%–30% 30%–60% 60%–85%
Female 0.019
(0.015)
0.014
(0.019)
0.023
(0.026)
0.106**
(0.047)
0.079
(0.062)
0.046
(0.065)
Female × oath -0.006
(0.024)
-0.022
(0.030)
-0.075*
(0.040)
-0.101
(0.085)
0.029
(0.092)
0.035
(0.094)
Age -0.001
(0.001)
-0.0005
(0.001)
-0.004***
(0.001)
0.005***
(0.002)
0.009***
(0.002)
0.011***
(0.003)
Age × oath 0.001
(0.001)
-0.0001
(0.001)
0.001
(0.001)
-0.003
(0.003)
-0.007**
(0.004)
-0.010***
(0.004)
Adults -0.011
(0.012)
-0.004
(0.016)
-0.023
(0.021)
0.007
(0.018)
-0.024
(0.023)
-0.023
(0.024)
Adults × oath 0.008
(0.020)
0.018
(0.025)
0.001
(0.032)
-0.016
(0.028)
0.004
(0.036)
0.049
(0.037)
Children 0.009
(0.010)
0.019
(0.012)
0.018
(0.016)
0.041
(0.033)
-0.078**
(0.039)
-0.010
(0.038)
Children × oath 0.010
(0.014)
-0.011
(0.017)
-0.020
(0.023)
0.046
(0.054)
0.115*
(0.063)
-0.045
(0.064)
University education
0.009
(0.016)
-0.030
(0.021)
0.002
(0.028)
0.076
(0.057)
0.027
(0.079)
-0.061
(0.081)
University education × oath
-0.026
(0.028)
0.016
(0.028)
0.008
(0.039)
-0.079
(0.114)
0.053
(0.115)
0.162
(0.113)
Income -0.001
(0.006)
0.004
(0.007)
0.028***
(0.010)
0.173***
(0.037)
0.160***
(0.039)
0.177***
(0.039)
Income × oath -0.004
(0.009)
-0.011
(0.011)
-0.016
(0.015)
0.227***
(0.076)
0.267***
(0.082)
0.075
(0.061)
Religious 0.015
(0.028)
0.020
(0.036)
0.074
(0.046)
0.110
(0.084)
-0.066
(0.206)
0.038
(0.204)
Religious × oath -0.042
(0.063)
-0.025
(0.065)
0.003
(0.078)
Left party 0.017
(0.018)
0.028
(0.022)
0.009
(0.031)
Left party × oath 0.004
0.027)
-0.012
(0.034)
0.020
(0.040)
Green party 0.056
***
(0.015)
0.063**
(0.026)
0.105***
(0.037)
Green party × oath ‡
0.097***
(0.029)
0.098*
(0.053)
Other party -0.154***
-0.169***
-0.170***

Environment for Development Carlsson et al.
19
(0.036) (0.039) (0.044)
Other party × oath
0.040**
(0.180)
0.053*
(0.028)
0.064
(0.044)
Communist party
0.107*
(0.063)
0.315***
(0.071)
0.257***
(0.087)
Communist party × oath
-0.058
(0.113)
-0.263**
(0.131)
-0.297***
(0.100)
Oath -0.047
(0.065)
0.023
(0.076)
0.037
(0.101)
0.174
(0.175)
0.204
(0.225)
0.329
(0.224)
Constant 1.726
***
(0.294)
1.116***
(0.236)
1.072***
(0.215)
-1.570***
(0.438)
-1.512***
(0.416)
-1.865***
(0.424)
Pseudo R2 0.067 0.050 0.047 0.199 0.182 0.125
No. of observations
2227 2382 2382 534 534 534
Dependent variable = 1, if WTP is positive. Standard error is in parentheses.
*, **
, ***
denotes statistically significant at 10%, 5%, and 1%, respectively.
‡ We dropped the interaction term between Green party voters and taking the oath from the 0%–30% regression. The
reason is that all Green party supporters who took the oath had a positive WTP for the 30% reduction.
In the Swedish sample, most of the interaction terms, with a few exceptions, are
insignificant, indicating that the effect of the oath script is generally not dependent on respondent
characteristics. An exception is that supporters of ―other party‖ have the highest probability of
stating zero WTP without the oath script, but with an oath script, they are actually more likely
than right-wing voters to state a positive WTP. All the parties in this group are small political
parties in Sweden, usually formed in protest to the more established political parties. Common
supporters of these parties are young males (Holmberg and Weibull 2009; Oscarsson and
Holmberg 2008; SOM-Institute 2009).14 It is possible, therefore, that supporters of these ―other‖
parties are more likely to protest against the survey and state a zero WTP. This tendency seems
to be reduced when the oath is taken. Additionally, Green party voters are more likely to offer a
positive WTP with an oath, even though they already have a greater tendency than all other
political groups to do so without the oath.15
14 The shares of male sympathizers are between 65% and 85%.
15 This result is rather puzzling because we would have expected most of the Green party voters to have a positive
WTP from the beginning. One possible explanation is that some of them are protesting against the whole survey in
the treatment without oath, for example, because they think that someone else should pay.

Environment for Development Carlsson et al.
20
In the Chinese sample, a number of the interaction terms with the oath and respondent
characteristics are significant. Older Chinese respondents are more likely than younger
respondents to have a positive WTP. With an oath, however, this tendency is reduced. Those
who earn more are more likely to have a positive WTP, and with an oath become even more
prone to offering a positive bid. As in Sweden, the effect of an oath is not mediated or enhanced
by age or income.
In China, the respondent group that shows the largest effect of the oath is Communist
party members. Without the oath treatment, the probability of having a positive WTP is 11, 32,
and 26 percentage points higher for the 30, 60, and 85 percent reduction levels, respectively, if a
respondent is a Communist party member. However, when both Communist and non-Communist
party groups are given the oath, for the 85 percent reduction level, Communist party members
are actually less likely to state a positive WTP than non-Communist party members. Thus, being
a party member increases the probability of paying something to reduce CO2, but this result
disappears with the oath treatment. One can only speculate why this result occurs. One
explanation might be that the oath treatment reduces the propensity to be dishonest and preserve
a self-image of being a Communist party member.
Turning to the conditional WTP (see results in appendix B), taking the oath has a stronger
impact on those who vote for ―other small parties‖ in both the 30 and 60 percent reduction levels.
In the treatment without the oath, their WTP is around $8–$9 lower than for right-wing voters,
while those who took the oath have an almost $11 higher WTP than right-wing voters. Thus,
taking the oath both increases the probability of stating a positive WTP and the level of WTP for
respondents who belong to these small political parties. The oath also has a clear and large effect
on religious respondents in the Swedish sample. Willingness to pay increases by $14 per month
for the 30 percent emissions reduction if the religious respondent takes the oath, compared to a
non-religious person who took the oath.
For Chinese respondents with higher incomes, the oath treatment reduces the conditional
WTP, although this group is also more likely to state a positive WTP with the oath.
In summary, because we see some clear differences on how the oath affects people in
China and Sweden, we conclude that taking the oath has different impacts on different
respondent groups in both countries. Furthermore, people with some specific political
preferences are highly affected by taking the oath in both China and Sweden.

Environment for Development Carlsson et al.
21
4. Conclusions
The aim of our study was to implement and investigate the effects of an oath script in a
stated preference survey. One advantage of testing this protocol in a survey—besides the fact
that it is the natural environment for non-market valuation—is that our relatively larger sample
size allowed us to identify groups of respondents that are more likely to change their behavior in
the oath treatment. Another advantage of our study is that we were able to test these effects in
two different cultural contexts, in China and in Sweden. A further advance in this study was our
decision to separately analyze the probability of bidding zero versus a positive bid, and the
conditional WTP, given that a positive bid was offered. This disaggregation of average WTP
revealed quite interesting, if complex, patterns.
We found a generally lower percentage of zero bidders with the oath than without it, but
conditional WTP decreased with the oath in China and increased with the oath in Sweden,
although not at all CO2 reduction levels. Overall, the oath significantly lowered average WTP in
China with substantial magnitude at all reduction levels, and significantly raised WTP in Sweden
at the 30 percent reduction level. In addition, the oath treatment produced lower variances in
WTP, which is in line with the results found by Jacquemet et al. (2009) in a lab environment.
While the results of lower variance of WTP on the oath treatment for hypothetical valuation
questions are encouraging, we are still aware that challenges remain regarding how an oath script
can reduce hypothetical bias. Hence, those hoping that administering an oath will unilaterally
work to reduce WTP in all situations and partly answer critics of hypothetical bias in stated
preference surveys will not find much comfort in our results.
We cannot test why we observed such differences across these two countries, but can
offer some ideas. One reason may be that Swedes (but not Chinese) are more used to
participating in surveys and being asked for their opinions, causing them react to the oath in
different ways than the Chinese. It is also possible that the Chinese respondents took the oath
script more seriously than their Swedish respondents due to cultural factors. More research is
clearly needed to investigate the effects of an oath in different cultural contexts and on taking an
oath in different survey contexts, in other words, on issues other than global warming.
Disaggregating the oath effects by respondent characteristics opens another window to
understand these results. The largest effects were seen for Communist party members in China
and for those who vote for smaller ―alternative‖ political parties in Sweden. Communist party
members were more likely to have a positive WTP than non-members in the survey version
without the oath, but a large part of the positive effect of being a Communist party member

Environment for Development Carlsson et al.
22
disappears in the treatment with an oath script. In Sweden, taking the oath had a large effect on
―other parties‖ voters. Without the oath script, this is the group with the highest probability of
stating zero WTP; however, with an oath script, they become more likely to state a positive WTP
than even right-wing party voters.
Appendixes
Appendix A. Contingent Valuation Question: 30% Reduction
Question 1: How much would your household pay for the 30% reduction?
Global emission reduction No reduction 30% reduction
Temperature increase More than 4°F increase 4°F increase
Amount your household is willing to pay per month until 2050
$0 $__?__
Click here to see the comparison table again.
To fill in the blank above, select the amount that is the highest monthly amount your
household would pay.
$0 $1 $2 $3 $4 $5 $6 $7 $8
$9 $10 $15 $20 $25 $30 $40 $50 $60
$80 $100 $130 $170 $220 >$220
You clicked on [X1] per month. This means that your household would be willing to pay
[12 times X1] per year until the year 2050 to reduce emissions by 30 percent.

Environment for Development Carlsson et al.
23
Appendix B.
Table B1. Distribution of Responses for Chinese Sample
Bid
0%–30% 30%–60% 60%–85%
No oath Oath No oath Oath No oath Oath
0 30.69 24.32 44.77 38.61 49.82 53.28
4 19.49 17.76 17.33 22.01 16.97 15.06
7 1.44 9.65 2.17 10.04 3.25 10.04
11 17.33 10.81 14.08 6.56 13 5.41
15 5.42 11.97 3.97 10.81 3.25 8.11
19 5.42 5.79 6.14 3.09 5.78 1.93
22 1.08 5.02 1.08 5.41 0.36 2.32
26 0.72 1.54 0.00 0.77 0 1.16
30 6.86 6.95 5.05 2.32 1.81 1.93
33 0.72 0.77 0.00 0.00 0.00 0.00
37 1.08 0.77 0.00 0.00 0.36 0.39
45 4.33 1.54 1.44 0.00 1.81 0.00
55 0.72 2.32 1.81 0.39 1.08 0.00
75 3.61 0.77 0.72 0.00 1.08 0.00
130 0.36 0.00 0.36 0.00 0.36 0.39
165 0.00 0.00 0.36 0.00 0.00 0.00
210 0.00 0.00 0.36 0.00 0.36 0.00
270 0.72 0.00 0.00 0.00 0.00 0.00
350 0.00 0.00 0.00 0.00 0.36 0.00
445 0.00 0.00 0.36 0.00 0.36 0.00

Environment for Development Carlsson et al.
24
Table B2. Distribution of Responses for Swedish Sample
Bid
0%–30% 30%–60% 60%–85%
No oath Oath No oath Oath No oath Oath
0 9.11 6.77 15.69 13.02 27.24 26.48
10 5.77 4.77 6.5 6.34 8.29 6.34
20 3.74 3.04 5.45 4.77 6.91 5.9
30 2.11 1.91 3.9 2.08 2.76 3.13
40 1.06 1.3 1.38 1.56 1.63 1.48
50 12.03 9.81 14.07 15.36 13.33 13.98
60 0.49 0.78 0.81 0.95 0.81 0.52
70 0.73 0.35 1.06 1.22 0.41 1.04
80 1.22 0.87 0.98 0.95 0.57 0.61
90 0.41 0.09 0.57 0.35 0.24 0.17
100 22.85 22.83 15.77 16.23 13.17 14.93
125 0.89 1.3 2.03 2.43 1.79 1.82
150 3.41 3.21 5.69 6.6 4.07 4.17
200 14.15 16.75 8.86 9.03 6.26 6.16
275 2.03 1.39 2.36 3.13 1.06 2.17
350 4.07 6.6 3.74 3.39 2.76 2.08
450 5.61 5.12 3.17 3.56 1.95 1.74
575 3.01 2.43 2.11 2.34 1.71 2.00
725 0.89 1.65 1.79 1.39 0.65 1.04
950 2.52 4.08 1.06 1.56 1.54 1.39
1200 2.52 2.95 1.3 1.74 1.06 1.13
1550 0.08 0.35 0.81 0.78 0.57 0.61
2000 1.06 1.39 0.49 0.95 0.73 0.95
>2000 0.24 0.26 0.4 0.26 0.49 0.18

Environment for Development Carlsson et al.
25
Table B3. Marginal Effects Ordinary Least Squares Models with Interaction Terms
Sweden China
0%–30% 30%–60% 60%–85% 0%–30% 30%–60% 60%–85%
Regression function
Female -5.351
**
(2.467)
-5.257*
(3.152)
-7.874*
(4.263)
-2.013*
(1.141)
-1.395
(1.907)
-2.817
(2.373)
Female × oath -1.833
(3.450)
-3.716
(3.973)
-2.897
(5.077)
1.564
(1.206)
1.329
(1.942)
2.791
(2.479)
Age -0.272
***
(0.086)
-0.275**
(0.110)
-0.419***
(0.150)
-0.004
(0.046)
0.039
(0.078)
-0.033
(0.105)
Age × oath 0.197
(0.123)
0.121
(0.141)
0.318*
(0.179)
0.020
(0.048)
-0.011
(0.079)
0.082
(0.108)
Adults -2.208
(1.963)
-0.647
(2.492)
1.561
(3.304)
0.001
(0.432)
0.113
(0.735)
-0.367
(0.887)
Adults × oath -1.780
(2.987)
-0.718
(3.345)
-2.414
(4.188)
-0.065
(0.460)
-0.112
(0.751)
0.610
(0.934)
Children -1.385
(1.456)
-1.607
(1.841)
-0.656
(2.459)
0.136
(0.652)
0.628
(1.377)
1.489
(1.530)
Children × oath 0.626
(2.021)
0.035
(2.324)
1.529
(2.918)
0.283
(0.705)
-0.491
(1.407)
-1.110
(1.647)
University education 12.103
***
(2.601)
10.425***
(3.342)
15.292***
(4.515)
2.052
(1.374)
2.381
(2.167)
4.940*
(2.750)
University education × oath
-2.493
(3.623)
-6.375
(4.190)
-12.857**
(5.342)
-1.671
(1.449)
-2.518
(2.209)
-5.139
(2.887)
Income 4.941
***
(0.940)
4.558***
(1.204)
4.391***
(1.611)
4.696***
(0.602)
5.148***
(0.986)
5.182***
(1.235)
Income × oath 1.875
(1.380)
0.269
(1.571)
-1.656
(1.974)
-1.263**
(0.643)
-4.043***
(1.007)
-4.203***
(1.303)
Religious -1.025
(4.991)
-3.963
(6.340)
-5.383
(8.427)
-0.309
(3.648)
1.773
(7.005)
-1.385
(8.423)
Religious × oath 14.203
**
(7.052)
5.711
(8.058)
2.755
(10.054)
-2.221
(4.073) ‡
‡
Left party -0.252
(2.885)
-2.461
(3.670)
-2.516
(5.013)
Left × oath -0.955
(4.075)
3.271
(4.667)
8.026
(5.992)
Green party 6.825
*
(3.909)
8.787**
(4.963)
7.706
(6.609)
Green party × oath 7.266 1.237 1.463

Environment for Development Carlsson et al.
26
(5.382) (6.153) (7.732)
Other party -9.157
**
(4.020)
-8.190*
(5.186)
-8.689
(7.043)
Other party × oath 10.460*
(5.527)
10.914*
(6.444)
12.899
(8.314)
Communist party
0.043
(1.511)
-1.823
(2.326)
1.245
(3.034)
Communist party × oath
0.478
(1.569)
2.134
(2.358)
-0.132
(3.136)
Oath -11.107
(9.130)
-4.127
(10.460)
-6.156
(13.111)
-1.108
(3.310)
3.445
(5.687)
-2.880
(7.286)
Constant 26.542
***
(6.424)
23.282***
(8.263)
25.279***
(10.949)
0.899
(3.146)
-3.152
(5.597)
1.204
(7.002)
Variance function
Sigma 40.262
***
(0.852)
49.427***
(1.086)
62.530***
(1.478)
7.773***
(0.397)
11.282***
(0.645)
13.521***
(0.811)
Oath -0.072
(0.061)
-0.551***
(0.063)
-0.937***
(0.068)
-2.251***
(0.144)
-3.313***
(0.160)
-2.589***
(0.176)
Pseudo R2 0.001 0.003 0.010 0.085 0.145 0.162
No. of observations 2192 2039 1742 388 312 260
The dependent variable = conditional WTP. Standard error is in parentheses.
‡ We dropped the interaction term between religious person and the oath from the two last regressions because no religious
persons who took the oath had a positive WTP for the 30%–60% and 60%–85% reduction in China. *, **
, ***
denote coefficient is statistically significant at 10%, 5%, and 1%, respectively.

Environment for Development Carlsson et al.
27
References
Aadland, D., and A.J. Caplan. 2003. Willingness to Pay for Curbside Recycling with Detection
and Mitigation of Hypothetical Bias. American Journal of Agricultural Economics 85:
492–502.
———. 2006. Cheap Talk Revisited: New Evidence from CVM. Journal of Economic Behavior
and Organization 60: 562–78.
Alpízar, F., F. Carlsson, and O. Johansson-Stenman. 2008. Does Context Matter More for
Hypothetical than for Actual Contributions? Evidence from a Natural Field Experiment.
Experimental Economics 11(3): 299–314.
Andreoni, J. 1990. Impure Altruism and Donations to Public Goods: A Theory of Warm Glow
Giving. Economic Journal 100: 464–77.
Braver, S. 1995. Social Contracts and the Provision of Public Goods. In Social Dilemmas:
Perspectives on Individuals and Groups, ed. by D. Schroeder. New York: Praeger.
Carlsson, F., P. Frykblom, and C.J. Lagerkvist. 2005. Using Cheap-Talk as a Test of Validity in
Choice Experiments. Economics Letters 89: 147–52.
Carlsson, F., M. Kataria, A. Krupnick, E. Lampi, Å. Löfgren, P. Qin, S. Chung, and T. Sterner.
2010. Paying for Mitigation: A Multiple-Country Study. Working Papers in Economics,
no. 447. Gothenburg, Sweden: Department of Economics, University of Gothenburg.
Champ, P., R. Bishop, T. Brown, and D. McCollum. 1997. Using Donation Mechanisms to
Value Nonuse Benefits from Public Goods. Journal of Environmental Economics and
Management 33: 151–62.
Champ, P., and R. Bishop. 2001. Donation Payment Mechanisms and Contingent Valuation: An
n Empirical Study of Hypothetical Bias. Environmental and Resource Economics 19:
383–402.
Cook, J., D. Whittington, D. Canh, F.R. Johnson, and A. Nyamete. 2007. Reliability of Stated
Preferences for Cholera and Typhoid Vaccines with Time to Think in Hue, Vietnam.
Economic Inquiry 45: 100–114.
Cummings, R., S. Elliot, G. Harrison, and J. Murphy. 1997. Are Hypothetical Referenda
Incentive Compatible? Journal of Political Economy 105: 609–621.

Environment for Development Carlsson et al.
28
Cummings, R., G. Harrison, and E. Rutstrom. 1995. Homegrown Values and Hypothetical
Surveys: Is the Dichotomous Choice Approach Incentive Compatible? American
Economic Review 85: 260–66.
Cummings, R.G., and L.O. Taylor. 1999. Unbiased Value Estimates for Environmental Goods:
A Cheap Talk Design for the Contingent Valuation Method. American Economic Review
89(3): 649–65.
Ehmke, M.D., J.L. Lusk, and J.A. List. 2008. Is Hypothetical Bias a Universal Phenomenon? A
Multinational Investigation. Land Economics 84(3): 489–500.
Ellingsen, T., and M. Johannesson. 2004. Promises, Threats, and Fairness. Economic Journal
114: 397–420.
Frykblom, P. 1997. Hypothetical Question Modes and Real Willingness to Pay. Journal of
Environmental Economics and Management 34: 275–87.
Greene, W. 2003. Econometric Analysis. Upper Saddle River, NJ, USA: Prentice-Hall.
Harvey, A. 1976. Estimating Regression Models with Multiplicative Heteroskedasticity.
Econometrica 44: 461–65.
Holmberg, S., and L. Weibull. 2009. Svensk höst [Swedish autumn]. SOM Report, no. 46.
Gothenburg, Sweden: SOM Institute, University of Gothenburg. In Swedish.
Jacquemet, N., R.V. Joule, S. Luchini, and J.F. Shogren. 2009. Preference Elicitation under Oath.
CES Working Paper, no. 43. Paris: Université Panthéon-Sorbonne (Paris 1), Centre
d'Economie de la Sorbonne.
Jacquemet, N., A. Jameas, S. Luchini, and J.F. Shogren. 2010. Referenda under Oath.
Unpublished working paper, GREQAM-CNRS, Universités d'Aix-Marseille II et III,
France.
Joule, R., and J. Beauvois. 1998. La soumission librement consentie [Voluntary submission].
Paris: Presses Universitaires de France.
Kahnemann, D., and J. Knetsch. 1992. Valuing Public Goods: The Purchase of Moral
Satisfaction. Journal of Environmental Economics and Management 22: 57–70.
Kiesler, C. 1971. The Psychology of Commitment: Experiments Liking Behavior to Belief. New
York: Academic Press.

Environment for Development Carlsson et al.
29
Krupnick, A., S. Hoffmann, and P. Qin. 2010, forthcoming. The Willingness to Pay for Mortality
Risk Reductions in China. RFF Discussion Paper. Washington, DC: Resources for the
Future.
List, J.A. 2001. Do Explicit Warnings Eliminate the Hypothetical Bias in Elicitation Procedures?
Evidence from Field Auction Experiments. American Economic Review 91: 1498–150.
List, J., and C. Gallet. 2001. What Experimental Protocol Influence Disparities between Actual
and Hypothetical Stated Values? Environmental and Resource Economics 20: 241–54.
List, J., R. Berrens, A. Bohara, and J. Kerkvilet. 2004. Examining the Role of Social Isolation on
Stated Preferences. American Economic Review 94 (3): 741–52.
McDonald, J.F., and R.A. Moffitt. 1980. The Uses of Tobit Analysis. Review of Economics and
Statistics 62: 318–21.
Murphy, J.G., T. Allen, T. Stevens, and D. Weatherhead. 2005. A Meta-analysis of Hypothetical
Bias in Stated Preference Valuation. Environmental and Resource Economics 30: 313–
25.
Oscarsson, H., and S. Holmberg. 2008. Regeringsskifte: Väljarna och valet 2006 [Change of
government: The voters and the 2006 elections]. Stockholm, Sweden: Norstedts Juridik.
In Swedish.
Ostrom, E., J. Walker, and R. Gardner. 1992. Covenants With and Without the Sword: Self-
Governance Is Possible. American Political Science Review, 86: 404–417.
Vanberg, C. 2008. Why Do People Keep Their Promises? An Experimental Test of Two
Explanations. Econometrica 76(6): 1467–80.
Whittington, D., V.K. Smith, A. Okorafor, A. Okore, J.L. Liu, and A. McPhail. 1992. Giving
Respondents Time to Think in Contingent Valuation Studies: A Developing Country
Application. Journal of Environmental Economics and Management 22: 205–25.
Wiser, R. 2007. Using Contingent Valuation to Explore Willingness to Pay for Renewable
Energy: A Comparison of Collective and Voluntary Payment Vehicles, Ecological
Economics 62:419–32.