the trade impact of enhanced multimodal connectivity in ... · [email protected] ... for...
TRANSCRIPT
349 5th Avenue New York, NY 10016 [email protected]
Journal of Economic Integration, 26(4): 624-650
The Trade Impact of Enhanced Multimodal Connectivity in the Asia-Pacific Region
Ben Shepherd, Principal.
Ramonette B. Serafica, Australia Indonesia Partnership for Economic Governance.
Akhmad Bayhaqi, APEC.
Hao Jing, APEC.
September 6, 2011.
1
The Trade Impact of Enhanced Multimodal Connectivity in the
Asia-Pacific Region
Ben Shepherd, Ramonette B. Serafica, Akhmad Bayhaqi, and Hao Jing1
This draft dated: September 6, 2011. Forthcoming in the Journal of Economic Integration.
Abstract: This paper develops new measures of multimodal transport connectivity, and uses a
gravity model to show that improving performance could lead to major trade gains
for the Asia-Pacific region. By improving multimodal connectivity by 5%, APEC would
increase exports by around 4%, or between 2% and 6% per member economy. In
dollar terms, this equates to an impact gain of $500bn in total, or between $850m
and $115bn per member economy. Economies that are open, highly integrated into
world markets, and with strong connectivity baselines stand to gain the most. We
also find that of the elements of multimodal transport connectivity, it is logistics
services performance that generally has the strongest effect on trade.
JEL Codes: F13; F15.
Keywords: International trade; Transport; Logistics; Asia-Pacific.
1 Shepherd: Principal, Developing Trade Consultants Ltd, [email protected] (corresponding author).
Serafica: Trade in Services Adviser, Australia Indonesia Partnership for Economic Governance,
[email protected]. Bayhaqi: Policy Analyst, APEC Policy Support Unit, [email protected]. Jing:
Researcher, APEC Policy Support Unit, [email protected]. The views expressed here are those of the authors only,
and do not represent the views of the APEC Secretariat or the member economies of APEC.
2
1 Introduction
The Asia-Pacific Economic Cooperation (APEC) has a long history of involvement with trade
facilitation. Its two Trade Facilitation Action Plans adopted the goal of reducing trade transactions
costs by five percent over five years. Although performance against this metric has been mixed,
there is evidence that significant trade cost reductions have indeed taken place within the region
over recent years (e.g., Shepherd 2010).
More recently, APEC has identified underdeveloped multimodal transport capabilities as one of the
priority chokepoints to be addressed under the Supply Chain Connectivity Framework.2 Multimodal
transport connectivity is a complex concept. It involves the quality and quantity of infrastructure, as
ell as the p i ate se to ’s a ilit to oo di ate i te odal li kages. It includes individual modes of
transport (air, sea, and land) as well as intermodal linkages. As such, it entails a network of links
(such as the roadways, railways and transport routes) and nodes (facilities such as marine ports and
airports). According to Battaglia (2007), a holistic view of transportation in which individual
transportation modes work together or within their own niches is a useful way to understand the
concept of intermodalism.
This paper is the first attempt to comprehensively assess and model the impact of multimodal
transport connectivity within APEC. Work already exists on individual modes of transport, such as air
(Geloso Grosso and Shepherd 2009). Previous work on trade facilitation in APEC includes indicators
of the quality of air and maritime infrastructure (Wilson et al. 2004). In addition, Limao and Venables
(2001) show more generally that infrastructure—an average of performance in road, rail, and
telecommunications—is an important determinant of bilateral trade. This paper extends this line of
research by including air, land, and maritime links in a single modeling framework, and by showing
the importance not just of modal performance, but of ensuring that all modes can work together
within a sophisticated logistics framework.
2 A conclusion from the APEC Supply Chain Connectivity Symposium held in May 2009.
3
The paper proceeds as follows. In Section 2, we review the literature on the importance of
multimodal transport connectivity from an economic and trade standpoint. Section 3 introduces the
data we use to measure multimodal transport performance. In Section 4, we report results from a
gravity model of bilateral trade—aggregate and by sector—augmented to include measures of
multimodal transport performance. We also report the results of counterfactual simulations. Finally,
Section 5 concludes and discusses the policy implications of our findings.
2 The Importance of Multimodal Transport Connectivity
Improvements in multimodal connectivity are immediately enjoyed by the direct users. The potential
benefits to shippers are explained by Jacoby and Hodge (2008). For example, when new
transportation infrastructure is built, companies take advantage by adjusting their logistics processes
and supply chains. They change purchasing and operations behavior in the short-run, while in the
longer term they make input substitutions and reconfigure production processes to take advantage
of transportation system improvements, thereby improving service and reducing costs. The potential
to edu e a o pa ’s ope ati g osts a ises from lower sourcing costs; reduced fleet, warehousing
and inventory costs; and from improved transit time visibility.
The economy-wide impact captures the spillover or other related multiplier effects from the
transportation and supply chain benefits. Expansion of a transportation network, as a result of
multimodal connectivity brings better linkages to supplies, inputs, and final goods, thereby
improving the efficiency of global supply chains in production. Improved logistics and supply chains
could open up access to previously unreachable areas as well as link key economic centers in a
region to national markets. The economy-wide benefits could include the following:
Trade expansion and larger foreign direct investment: Transportation and logistics improvements are
iti al to t ade flo s a d the o petiti e ess of a e o o ’s e po ts a d i po ts. Ea h da sa ed
is equivalent to an average ad valorem tariff reduction of between approximately 0.4 and 1% for
4
export and 0.8 and 1.5% for import (Hummels et al., 2007).3 In addition, an increase in
competitiveness could attract additional FDI. For manufacturers, more efficient transport links mean
factories can take advantage of cheaper land and labor in the ou t ’s i te io . I te atio al
companies are also discovering that there are clusters of complementary businesses emerging inland
that they can tap into.
Industrial impact: More trade and investment could foster growth in other industrial sectors such as
tourism, manufacturing, and retail. Carruthers et al. (2003) note that improved logistics can foster
faster progress in industrialization because as countries move from resource extraction to
sophisticated manufacturing, they must also develop their logistics capabilities accordingly.
Improved logistics will also enable more efficient (global and regional) production networks. In turn,
this will result in more employment in positively affected industries/sectors through forward and
backward linkages.
Regional Integration: Better transport and logistics support stronger regional integration. World
Bank (2009) argues that falling transport costs have coincided with greater economic concentration
within countries and have caused trade with neighbors to become even more important. Guerrero
et al. (2009) argue that one explanation for why Latin American and the Caribbean (LAC) countries
have lagged in their integration into the world trading system is their inability to cope with a
globalization process that is inherently transport intensive and where supply chains are now being
organized on a global scale.
Development and poverty reduction: Basic foodstuffs, as well as agricultural inputs like fertilizers,
and development products like medicines, all need to be moved quickly and cost-effectively in order
to promote human development aims. Better transportation logistics enables faster deliveries of
goods and services as well as a reduction in consumer prices. Transport infrastructure also provides
3 The per-day value of time savings for export and imports will be different depending on the product
composition (of the related exports and imports).
5
rural areas with access to greater participation in development opportunities that leads to a more
balanced spatial development. Adequate logistics access will promote rural entrepreneurship and
trade (UNESCAP 2008).
The economy-wide impact of improved multimodal connectivity will mostly be realized in the
medium to long-run. Moreover, the distribution of these benefits will depend on the linkages and
the integration level between the overall international supply chain and transport logistics network.
For the case of an infrastructure project, size is not directly related to the economic impact that the
project will have (e.g., Vickerman, 2007).
As discussed by Prentice (2003), ideally each mode of transport is used for the length of the haul
that minimizes the line haul cost for the maximum distance moved, such that the best attributes of
each mode are combined yielding the lowest cost of transportation for the supply chain. Although
efficiency is a prime consideration, accessibility is a further reason for using two or more modes of
transport. Moreover, intermodal transportation systems compete in terms of cost and time. For
shippers of value-added goods, for example, reliability and transit time are as important as freight
rates in modal choice decisions. Reliability and transit time can be affected by the level of
connectivity. For maximum connectivity of intermodal transport, the absence of bottlenecks is
required: a supply chain is only as strong as its weakest link.
Prentice (2003) classifies the causes of bottlenecks into three general categories, namely:
infrastructure bottlenecks, regulatory bottlenecks, and supply chain dysfunctions. Chronic
infrastructure bottlenecks can be due to climate and physical barriers or due to underinvestment.
There are also temporary infrastructure bottlenecks which could arise from weather disruptions,
market perturbations (e.g., a temporary surge in demand), and disinvestments (i.e., when parts of
infrastructure are abandoned or maintained at a lower level of efficiency). Regulatory bottlenecks
are described as unintended consequences of some other policy objective and these could be direct
effects (e.g., safety/quality inspections and security measures) and indirect effects (e.g., cabotage
6
restrictions). Finally, another source of bottlenecks could be due to dysfunctional supply chains
which occur when participants fail to act in the common interest, for example with respect to hours
of operation. Congestion and queues are symptoms of bottlenecks and careful analysis is needed in
removing the bottleneck.
Although specific bottlenecks and priorities for action vary among APEC economies, there seem to
be some common issues that affect the achievement of multimodal connectivity. For one, the
problem of underinvestment in infrastructure is not confined to developing APEC members, and is
an issue even in industrialized economies. However, it is recognized that while under-investing leads
to congestion, over-investing will lead to wastage. As such, efficient use and maintenance of existing
assets require attention too. Related to infrastructure provision is the need for a strategic approach
to infrastructure development. Again, in both developed and developing economies, the business
sector in particular stresses that transport infrastructure planning should be more closely linked with
trade and other policies (e.g. land use, tax, foreign investment, etc.). More specifically, a supply
chain approach to infrastructure development is seen by industry as a missing element. Failure to
have an economy-wide approach and consideration for whole-of-supply chain requirements lead to
either under-provision or under-utilization of transport infrastructure. Thus, while inadequacy of
infrastructure investment is a constraint, inefficiency of investment is as crucial.
Another difficulty revolves around the sharing of costs and benefits among stakeholders or affected
parties. Even when there is agreement on the overall benefits of fixing a particular bottleneck, the
lack of understanding and of a mechanism to share both the risks and rewards work against
achieving multimodal connectivity. The result is that critical projects do not get implemented or
facilitation arrangements are slow to get off the ground.
Regulatory frameworks governing the various transport sectors could hinder the achievement of
multimodal connectivity as well. Access regulations and price signals which distort modal choices
and utilization are seen as key impediments to the development of optimal multimodal transport
7
networks. One area, for example, is the need to ensure a level playing field between modes (e.g.,
between road and rail).
Last but not the least, the quality of service is a subject that has been highlighted. Behind this are
concerns about inefficient service providers as well the shortage of required skills (both existing and
forecasted), which could hamper the development and growth of the various transport and logistics
industries.
Against this background, the remainder of the paper examines the performance of APEC economies
when it comes to multimodal transport connectivity, and assesses the trade gains that could result
from improving the situation.
3 Measuring Multimodal Transport Connectivity
The fi st stage i a al zi g the elatio ship et ee APEC e e e o o ies’ t ade a d thei
multimodal transport capabilities is to develop summary performance measures. Constructing
multimodal transport indicators is a challenging task. Ideally, these sorts of indicators should
combine data on the quantity and quality of transport facilities in each mode. Many different
datasets are available that could potentially have something to add in assessing multimodal
connectivity. However, there is a tradeoff between constructing broad-based indicators, and
ensuring that their coverage is wide enough to take account of the heterogeneity of APEC member
economies. In the interests of ensuring maximum coverage, we have chosen to base our indicators
on just a small number of data series in each case.
Fo a iti e t a spo t, UNCTAD’s Liner Shipping Connectivity Index serves as a readily available
reference. It uses principal components analysis to combine a variety of liner shipping indicators into
a single, broad-based index (UNCTAD 2009). This method produces a weighted average of the
underlying data in which the weights are chosen objectively so as to produce an optimal summary
measure, i.e., one that accounts for the maximum possible amount of variance in the underlying
8
data. In this way, the LSCI takes account of the following five factors: number of ships; their
container-carrying capacity; maximum vessel size; number of services; and number of companies
deplo i g o tai e ships to a d f o a e o o ’s po ts. Fa to s o e, fou , a d fi e a e
interpreted as quantity measures: they show the number of ships, services, and companies linking
an economy with the rest of the world. Factors two and three are closer to being quality indicators,
since they provide detail on the type of service provided, rather than just the quantity.
The LSCI has previously been used in policy analysis. Wilmsmeier and Hoffmann (2008) show that
connectivity has an important impact on maritime freight rates. However, the present paper is, to
our knowledge, the first one to use the LSCI in an econometric analysis of the determinants of trade
flows in goods markets.
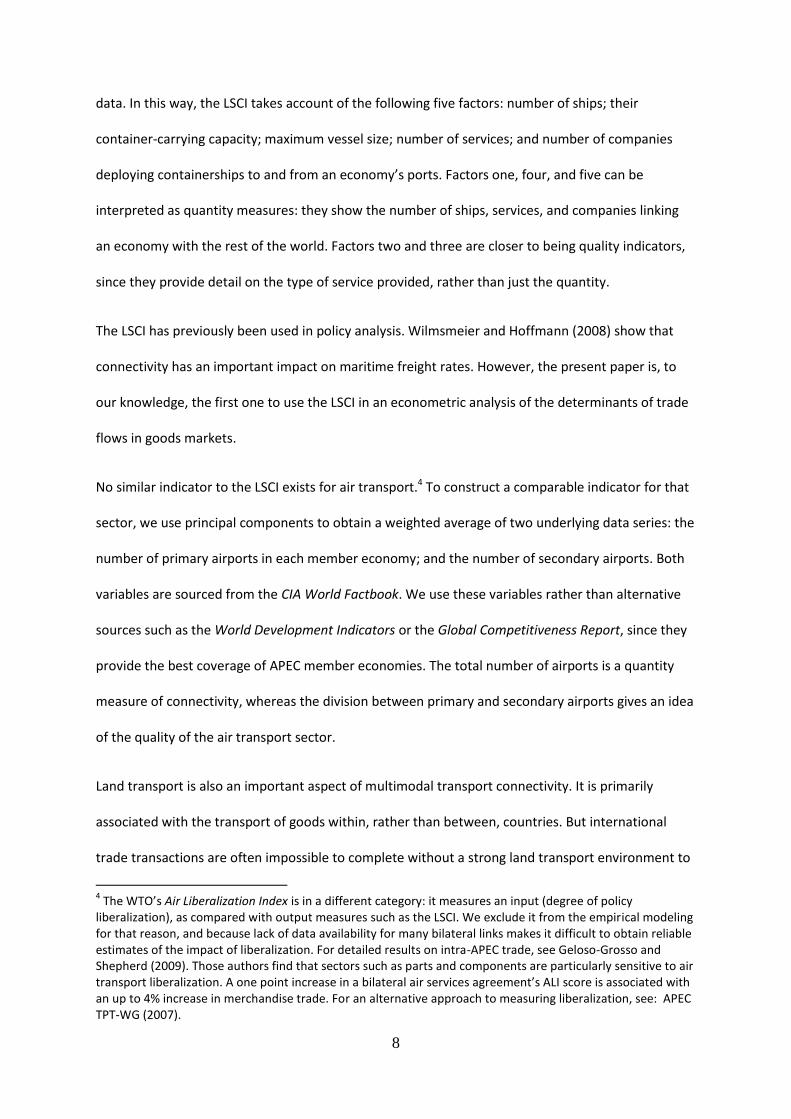
No similar indicator to the LSCI exists for air transport.4 To construct a comparable indicator for that
sector, we use principal components to obtain a weighted average of two underlying data series: the
number of primary airports in each member economy; and the number of secondary airports. Both
variables are sourced from the CIA World Factbook. We use these variables rather than alternative
sources such as the World Development Indicators or the Global Competitiveness Report, since they
provide the best coverage of APEC member economies. The total number of airports is a quantity
measure of connectivity, whereas the division between primary and secondary airports gives an idea
of the quality of the air transport sector.
Land transport is also an important aspect of multimodal transport connectivity. It is primarily
associated with the transport of goods within, rather than between, countries. But international
trade transactions are often impossible to complete without a strong land transport environment to
4 The WTO’s Air Liberalization Index is in a different category: it measures an input (degree of policy
liberalization), as compared with output measures such as the LSCI. We exclude it from the empirical modeling
for that reason, and because lack of data availability for many bilateral links makes it difficult to obtain reliable
estimates of the impact of liberalization. For detailed results on intra-APEC trade, see Geloso-Grosso and
Shepherd (2009). Those authors find that sectors such as parts and components are particularly sensitive to air
t a spo t li e alizatio . A o e poi t i ease i a ilate al ai se i es ag ee e t’s ALI s o e is asso iated ith an up to 4% increase in merchandise trade. For an alternative approach to measuring liberalization, see: APEC
TPT-WG (2007).
9
facilitate shipping between factory, port, and warehouse. We again use principal components to
produce an overall land transport indicator, based on a weighted average of the following indicators:
road infrastructure density; and rail infrastructure density. Each measure is defined as the total
le gth of the et o k di ided the e o o ’s total la d a ea; this is a si ila app oa h to Li ao
and Venables (2001). Both data series are sourced from the CIA World Factbook. As for air transport,
the composite index captures the twin aspects of the quantity (length of the network) and quality
(adjustment for land area) of connections.
The final major dimension of multimodal transport connectivity is the logistics environment.
Logistics operators are responsible for coordinating complex cross-border transactions involving a
variety of transport modes, as well as the necessary interchanges and transshipments. The most
o p ehe si e dataset o a e o o ’s logisti s f ie dli ess is the Wo ld Ba k’s Logistics
Performance Index (LPI). The LPI is based on private sector perceptions of supply-chain performance
and bottlenecks, drawn from survey responses given by logistics professionals around the world. Like
the LSCI and our transport indicators, it uses principal components analysis to create a single,
comprehensive index based on the following core dimensions: efficiency of the clearance process;
quality of trade and transport infrastructure; ease of arranging competitively priced shipments;
competence and quality of logistics services; ability to track and trace consignments; and timeliness
of deli e . We use o e of those di e sio s to easu e a e o o ’s a ilit to oo di ate o ple
multimodal transactions, namely the competence and quality of logistics services. Although the
overall LPI has been used in econometric work on the determinants of goods trade (Hoekman and
Nicita 2008), the logistics competence component has not yet, to our knowledge, received such
detailed attention.
To obtain an overall picture of multimodal transport connectivity across the region, we use principal
components analysis to create a summary indicator (Figure 1). This indicator incorporates the air,
maritime, and land transport indicators, as well as logistics competence from the LPI. Data are
10
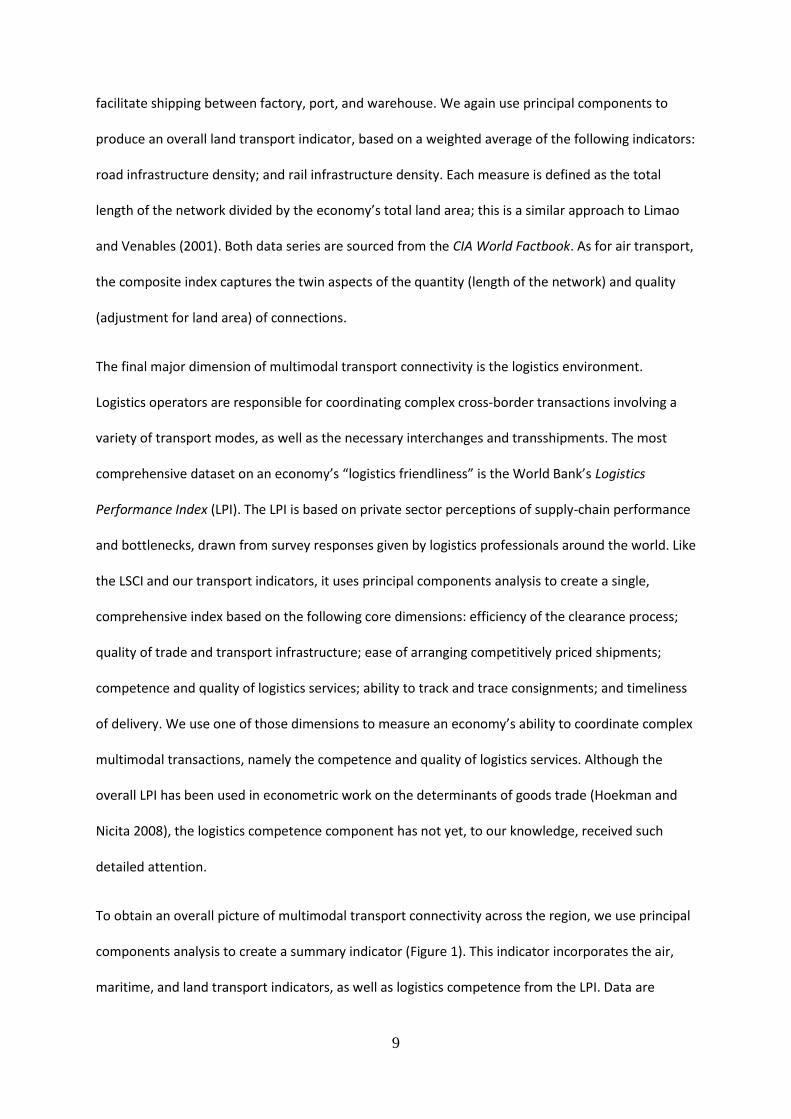
available for 19 APEC member economies. There is a strong correlation between our overall
indicator and each of the modal indicators.. The overall indicator clearly captures an important
tendency of the full range of modal data, and should be a useful indicator of multimodal transport
connectivity.
Figure 1 Multimodal transport indicator, as a percentage of the regional leader's score
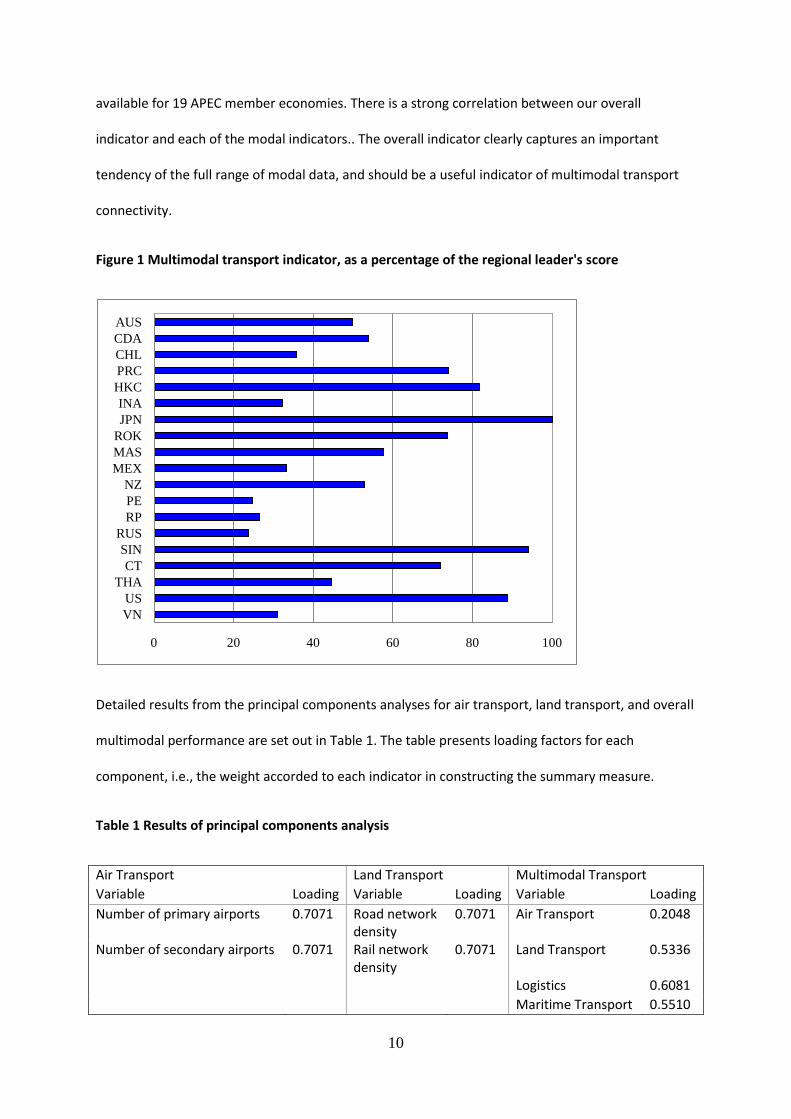
Detailed results from the principal components analyses for air transport, land transport, and overall
multimodal performance are set out in Table 1. The table presents loading factors for each
component, i.e., the weight accorded to each indicator in constructing the summary measure.
Table 1 Results of principal components analysis
Air Transport Land Transport Multimodal Transport
Variable Loading Variable Loading Variable Loading
Number of primary airports 0.7071 Road network
density
0.7071 Air Transport 0.2048
Number of secondary airports 0.7071 Rail network
density
0.7071 Land Transport 0.5336
Logistics 0.6081
Maritime Transport 0.5510
0 20 40 60 80 100
VNUS
THACT
SINRUS
RPPENZ
MEXMASROKJPNINA
HKCPRCCHLCDAAUS
11
Note: Eigenvalues for the first principal components are 1.9, 1.4, and 2.03 respectively.
4 Multimodal Transport and Exports: Empirical Analysis using the
Gravity Model
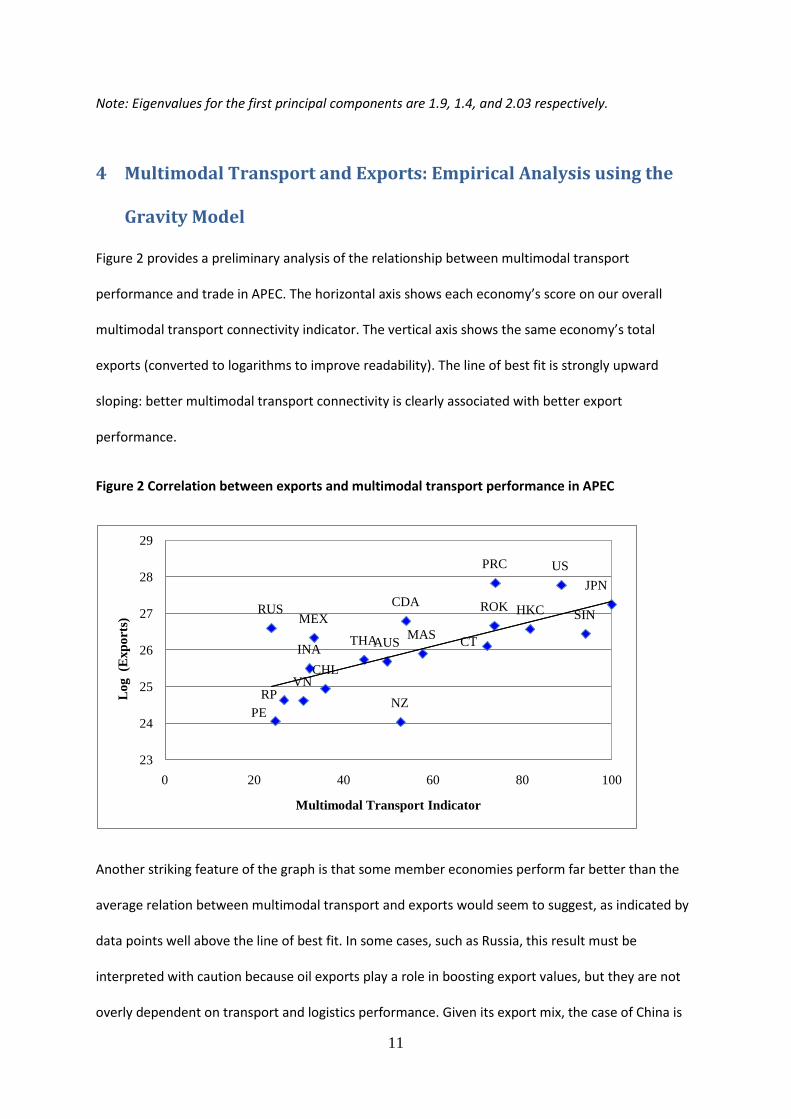
Figure 2 provides a preliminary analysis of the relationship between multimodal transport
pe fo a e a d t ade i APEC. The ho izo tal a is sho s ea h e o o ’s s o e o ou o e all
multimodal transport connectivity indicato . The e ti al a is sho s the sa e e o o ’s total
exports (converted to logarithms to improve readability). The line of best fit is strongly upward
sloping: better multimodal transport connectivity is clearly associated with better export
performance.
Figure 2 Correlation between exports and multimodal transport performance in APEC
Another striking feature of the graph is that some member economies perform far better than the
average relation between multimodal transport and exports would seem to suggest, as indicated by
data points well above the line of best fit. In some cases, such as Russia, this result must be
interpreted with caution because oil exports play a role in boosting export values, but they are not
overly dependent on transport and logistics performance. Given its export mix, the case of China is
AUS
CDA
CHL
CT
HKC
INA
JPN
MASMEX
NZPE
PRC
ROK
RP
RUS SIN
THA
US
VN
23
24
25
26
27
28
29
0 20 40 60 80 100
Log
(E
xpor
ts)
Multimodal Transport Indicator
12
more noteworthy. It may be that one of the reasons for its strong performance compared with the
average is that in such a large and diverse economy, our general measures of transport connectivity
do not capture the fact that major international gateways may be of much better than average
quality compared with infrastructure in the hinterland.
We use the gravity model of bilateral trade to investigate the association between multimodal
transport connectivity and trade in greater depth. It takes account of trade within APEC, and
between APEC member economies and the rest of the world (up to 230 economies in total). The
model controls for a range of influences on bilateral trade, such as the size of each economy, and the
level of trade costs between them.
4.1 Specification of the Gravity Model
The starting point for the analysis is a gravity model based on standard theories of international
trade (Anderson & Van Wincoop 2003, 2004). It takes the following form:
where: is exports from economy i to economy j in sector k; is sectoral expenditure in
economy j; is sectoral production in economy i; is bilateral trade costs; is the intra-sectoral
elasticity of substitution (between varieties within a sector); and is a random error term satisfying
standard assumptions. The and terms represent multilateral resistance, i.e. the fact that trade
patterns are determined by the level of bilateral trade costs relative to trade costs elsewhere in the
world. Inward multilateral resistance captures the
dependence of economy j’s i po ts o t ade osts a oss all supplie s. Out a d ultilate al
resistance captures the dependence of economy i’s e po ts
13
on trade costs across all destination markets. The w te s a e eights e ui ale t to ea h e o o ’s
share in global output or expenditure.
Ideally, empirical work based on equation (1) should fully account for multilateral resistance, for
example by using fixed effects. This is not possible in the present case, however, since the analysis is
focused on data that vary by exporting economy but not across importers for a given exporter.
Indicators of multimodal transport performance would be perfectly collinear with exporter fixed
effects, and the model therefore could not be estimated.
A second-best estimation option is to use fixed effects to account for inward multilateral resistance,
and random effects for outward multilateral resistance (equation 2). The random effects
specification puts more structure on the data than fixed effects, since it assumes that outward
multilateral resistance can be adequately summarized by a random variable that follows a normal
distribution; a fixed effects specification allows for unconstrained variation. The mixed effects model
with fixed effects by importer and random effects by exporter represents an acceptable compromise
in this case between research objectives and empirical rigor.
The final part of the model is the trade costs function t. The basic specification (equation 3) includes
the indicators of maritime, air, and logistics performance discussed above. It also includes standard
gravity model control variables such as distance (a proxy for transport costs), tariffs, colonial
connections, common language, and APEC membership of the exporting and importing economies
jointly.
14
To estimate the model, we substitute equation (3) into equation (2) and proceed using the standard
GLS estimator.5 The presence of zeros in the bilateral trade matrix—132 out of 3790 observations for
total trade—means that we need to adjust the export data by adding one prior to taking the
logarithm.
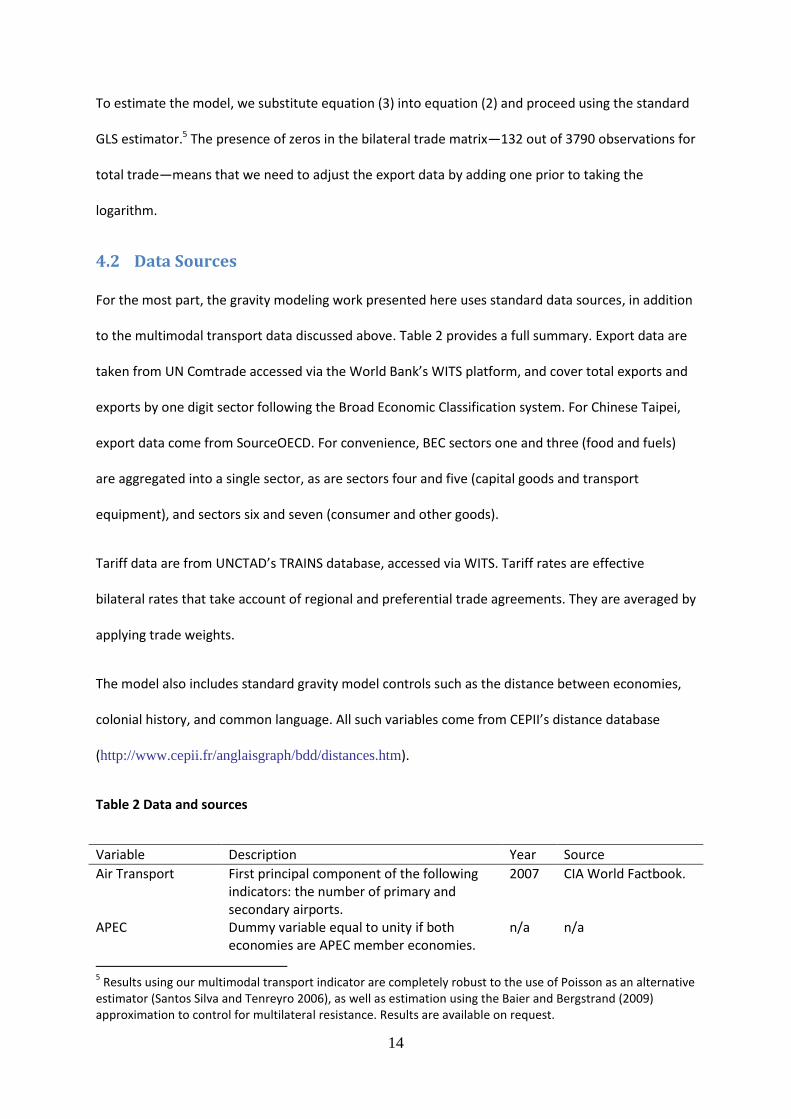
4.2 Data Sources
For the most part, the gravity modeling work presented here uses standard data sources, in addition
to the multimodal transport data discussed above. Table 2 provides a full summary. Export data are
take f o UN Co t ade a essed ia the Wo ld Ba k’s WITS platfo , a d o e total e po ts a d
exports by one digit sector following the Broad Economic Classification system. For Chinese Taipei,
export data come from SourceOECD. For convenience, BEC sectors one and three (food and fuels)
are aggregated into a single sector, as are sectors four and five (capital goods and transport
equipment), and sectors six and seven (consumer and other goods).
Tariff data are from UNCTAD’s TRAINS data ase, a essed ia WITS. Ta iff ates a e effe ti e
bilateral rates that take account of regional and preferential trade agreements. They are averaged by
applying trade weights.
The model also includes standard gravity model controls such as the distance between economies,
olo ial histo , a d o o la guage. All su h a ia les o e f o CEPII’s dista e data ase
(http://www.cepii.fr/anglaisgraph/bdd/distances.htm).
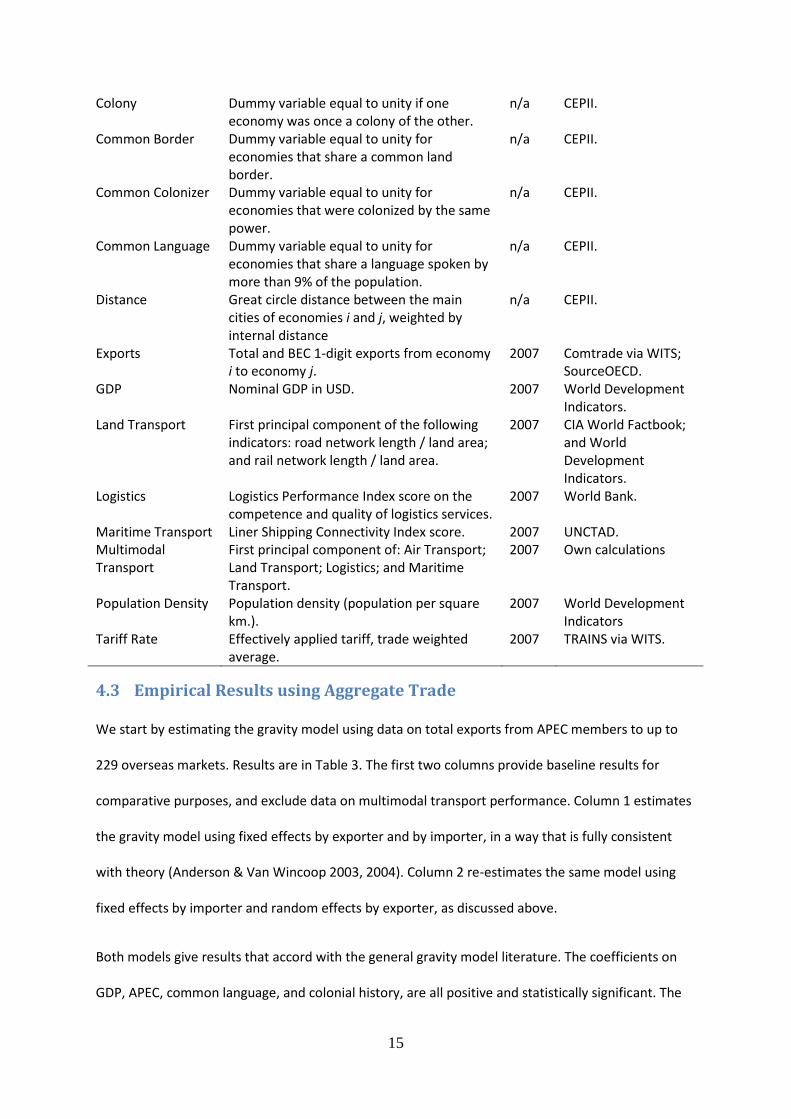
Table 2 Data and sources
Variable Description Year Source
Air Transport First principal component of the following
indicators: the number of primary and
secondary airports.
2007 CIA World Factbook.
APEC Dummy variable equal to unity if both
economies are APEC member economies.
n/a n/a
5 Results using our multimodal transport indicator are completely robust to the use of Poisson as an alternative
estimator (Santos Silva and Tenreyro 2006), as well as estimation using the Baier and Bergstrand (2009)
approximation to control for multilateral resistance. Results are available on request.
15
Colony Dummy variable equal to unity if one
economy was once a colony of the other.
n/a CEPII.
Common Border Dummy variable equal to unity for
economies that share a common land
border.
n/a CEPII.
Common Colonizer Dummy variable equal to unity for
economies that were colonized by the same
power.
n/a CEPII.
Common Language Dummy variable equal to unity for
economies that share a language spoken by
more than 9% of the population.
n/a CEPII.
Distance Great circle distance between the main
cities of economies i and j, weighted by
internal distance
n/a CEPII.
Exports Total and BEC 1-digit exports from economy
i to economy j.
2007 Comtrade via WITS;
SourceOECD.
GDP Nominal GDP in USD. 2007 World Development
Indicators.
Land Transport First principal component of the following
indicators: road network length / land area;
and rail network length / land area.
2007 CIA World Factbook;
and World
Development
Indicators.
Logistics Logistics Performance Index score on the
competence and quality of logistics services.
2007 World Bank.
Maritime Transport Liner Shipping Connectivity Index score. 2007 UNCTAD.
Multimodal
Transport
First principal component of: Air Transport;
Land Transport; Logistics; and Maritime
Transport.
2007 Own calculations
Population Density Population density (population per square
km.).
2007 World Development
Indicators
Tariff Rate Effectively applied tariff, trade weighted
average.
2007 TRAINS via WITS.
4.3 Empirical Results using Aggregate Trade
We start by estimating the gravity model using data on total exports from APEC members to up to
229 overseas markets. Results are in Table 3. The first two columns provide baseline results for
comparative purposes, and exclude data on multimodal transport performance. Column 1 estimates
the gravity model using fixed effects by exporter and by importer, in a way that is fully consistent
with theory (Anderson & Van Wincoop 2003, 2004). Column 2 re-estimates the same model using
fixed effects by importer and random effects by exporter, as discussed above.
Both models give results that accord with the general gravity model literature. The coefficients on
GDP, APEC, common language, and colonial history, are all positive and statistically significant. The
16
common border dummy has a statistically significant coefficient in column 2 only. The coefficients on
distance and tariffs are negatively signed, and both statistically significant in column 1. In column 2,
only distance has a statistically significant coefficient.
Although there are some differences in estimated coefficients between the models in columns 1-2,
they are generally quite minor. The similarity in the two sets of estimates confirms that it is
appropriate to continue with the mixed effects model as an approximation to the true, theoretically-
grounded model. The largest difference between the two sets of estimates is in relation to the APEC
coefficient, which is positive and statistically significant in both specifications, but has a much larger
coefficient in the mixed effects regression. One possible reason for the difference is close correlation
et ee the APEC a ia le a d the fi ed effe ts, si e it is the ultiple of ea h e o o ’s APEC
membership.
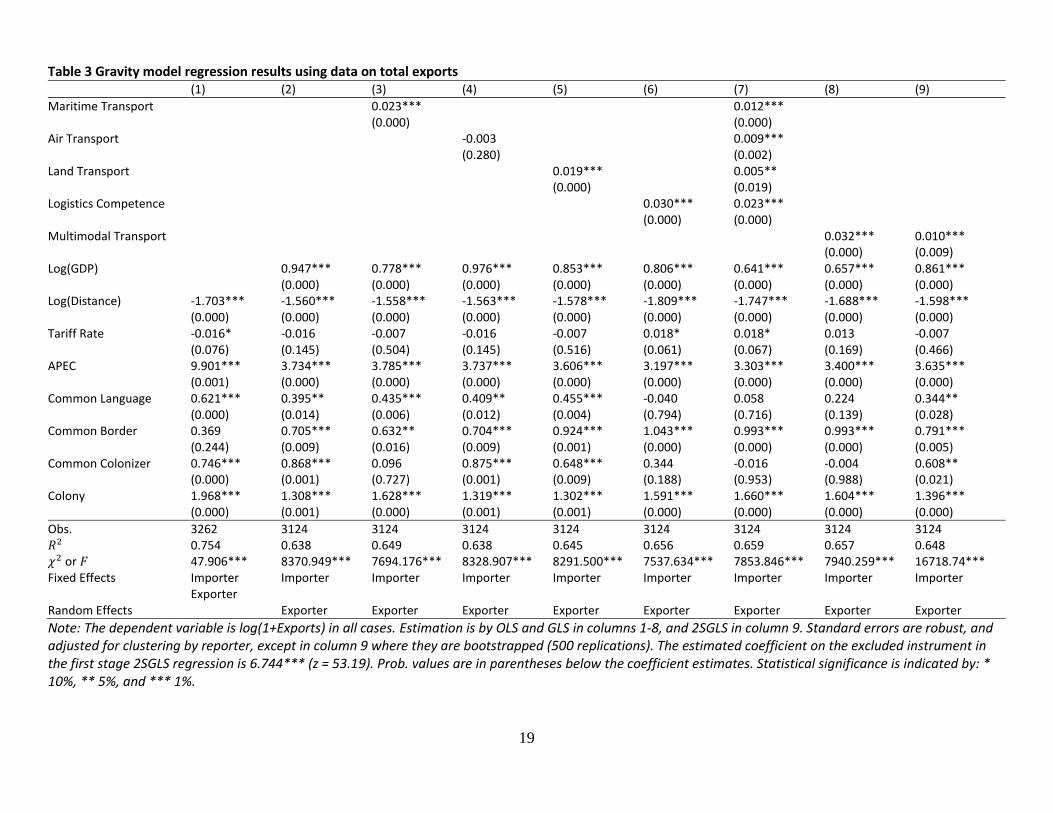
Columns 3-8 present results using the augmented gravity model. Each column introduces a different
variable or set of variables measuring multimodal transport. Column 3 includes maritime transport
only, and the estimated coefficient is positive and statistically significant, which indicates that
i p o ed a iti e li ks ha e the pote tial to oost APEC e e e o o ies’ t ade. Columns 5
and 6 find similar results for land transport, and logistics competence: both estimated coefficients
are positive and statistically significant. In column 4, however, the coefficient on air transport is
positive, as expected, but it is not statistically significant.
Results in columns 3-6 should be interpreted cautiously due to omitted variable bias: in each case,
only one multimodal transport indicator is included in the regression. In column 7, the model is
augmented to include all four multimodal transport indicators simultaneously, and thus avoid the
bias problem in the previous results. Results in this case are similar to columns 3-6 for maritime
transport, land transport, and logistics performance: they all have coefficients that are positive and
at least 5% significant. In addition, the coefficient on air transport is now positive and statistically
17
significant (1%), which is in line with expectations. This result highlights the importance of including
all variables together for all but preliminary, exploratory regressions.
The regression results in column 7 allow us to say something about the relative sensitivity of APEC
trade flows to the various dimensions of multimodal transport performance. The variable with the
strongest impact is logistics competence: a one point increase in our index, where 100 represents
the regional leader, is associated with an impact effect on trade of 2.3%. The variable with the next
strongest impact is maritime transport, however it is around half as strong as that of logistics
competence. A one point increase in the maritime transport index is associated with a trade increase
of just over 1%. Next in line comes air transport, with an effect just slightly weaker than that of
maritime transport. Land transport has the weakest effect, with a one point increase in the index
being associated with a 0.5% increase in trade.
Next, we run an additional regression using the index of multimodal transport discussed above, i.e.,
a principal component weighted average of the other four indices (maritime transport, land
transport, air transport, and logistics competence). The reason for aggregating the indices in this way
for regression purposes is twofold. First, it takes account of the strong correlations among them,
which can lead to inflated standard errors. Second, it provides a more robust basis for counterfactual
simulations (see below), since it eliminates multiple counting of performance improvements that
might otherwise take place due to the strong correlations among indicators.
Results in column 8 are fully in line with expectations. The multimodal transport indicator has a
positive and 1% significant coefficient. Its magnitude is greater than those of any of the individual
transport modes in column 7. Concretely, an improvement in overall multimodal transport
performance that brings an economy one point closer to the regional leader is associated with an
export increase of around 3%. This result again suggests that overall performance is strongly
influenced not just by performance in each mode, but also by the ability to make each mode work
efficiently and effectively with the others.
18
Reverse causality is clearly an issue in this model due to the possibility of a virtuous cycle between
trade and multimodal transport performance. Column 9 confronts this problem using the statistical
methodology of instrumental variables, or two-stage generalized least squares (2SGLS). The 2SGLS
estimator uses an external variable—the instrument—to purge multimodal transport performance
of the causal influence that trade flows might exert on it. The instrument must be strongly
correlated with multimodal transport, but must not affect trade through any other variable in the
model. In this case, we use population density as an instrument. We expect economies with higher
population densities to have better multimodal transport performance because geographical
agglomeration makes it easier for different modes to work together, and also makes infrastructure
development less expensive due to the need to cover less territory. The data strongly support this
contention: the first stage coefficient on population density is 6.744*** (z = 53.19). Since there is no
other way that population density can affect international trade flows, we expect it to satisfy both
criteria for instrument validity.
Column 9 presents results from the second stage of the 2SGLS regression. The coefficient on
multimodal transport is smaller in magnitude, but it remains 1% statistically significant. A fall in the
alue of the oeffi ie t is e a tl hat e ould e pe t f o a i tuous le ausal d a i
involving trade and multimodal transport performance. Based on the 2SGLS results—which are the
most robust ones available—a one point increase in the multimodal transport index is associated
with a trade increase of around 1%.
19
Table 3 Gravity model regression results using data on total exports
(1) (2) (3) (4) (5) (6) (7) (8) (9)
Maritime Transport 0.023*** 0.012***
(0.000) (0.000)
Air Transport -0.003 0.009***
(0.280) (0.002)
Land Transport 0.019*** 0.005**
(0.000) (0.019)
Logistics Competence 0.030*** 0.023***
(0.000) (0.000)
Multimodal Transport 0.032*** 0.010***
(0.000) (0.009)
Log(GDP) 0.947*** 0.778*** 0.976*** 0.853*** 0.806*** 0.641*** 0.657*** 0.861***
(0.000) (0.000) (0.000) (0.000) (0.000) (0.000) (0.000) (0.000)
Log(Distance) -1.703*** -1.560*** -1.558*** -1.563*** -1.578*** -1.809*** -1.747*** -1.688*** -1.598***
(0.000) (0.000) (0.000) (0.000) (0.000) (0.000) (0.000) (0.000) (0.000)
Tariff Rate -0.016* -0.016 -0.007 -0.016 -0.007 0.018* 0.018* 0.013 -0.007
(0.076) (0.145) (0.504) (0.145) (0.516) (0.061) (0.067) (0.169) (0.466)
APEC 9.901*** 3.734*** 3.785*** 3.737*** 3.606*** 3.197*** 3.303*** 3.400*** 3.635***
(0.001) (0.000) (0.000) (0.000) (0.000) (0.000) (0.000) (0.000) (0.000)
Common Language 0.621*** 0.395** 0.435*** 0.409** 0.455*** -0.040 0.058 0.224 0.344**
(0.000) (0.014) (0.006) (0.012) (0.004) (0.794) (0.716) (0.139) (0.028)
Common Border 0.369 0.705*** 0.632** 0.704*** 0.924*** 1.043*** 0.993*** 0.993*** 0.791***
(0.244) (0.009) (0.016) (0.009) (0.001) (0.000) (0.000) (0.000) (0.005)
Common Colonizer 0.746*** 0.868*** 0.096 0.875*** 0.648*** 0.344 -0.016 -0.004 0.608**
(0.000) (0.001) (0.727) (0.001) (0.009) (0.188) (0.953) (0.988) (0.021)
Colony 1.968*** 1.308*** 1.628*** 1.319*** 1.302*** 1.591*** 1.660*** 1.604*** 1.396***
(0.000) (0.001) (0.000) (0.001) (0.001) (0.000) (0.000) (0.000) (0.000)
Obs. 3262 3124 3124 3124 3124 3124 3124 3124 3124 0.754 0.638 0.649 0.638 0.645 0.656 0.659 0.657 0.648 or 47.906*** 8370.949*** 7694.176*** 8328.907*** 8291.500*** 7537.634*** 7853.846*** 7940.259*** 16718.74***
Fixed Effects Importer Importer Importer Importer Importer Importer Importer Importer Importer
Exporter
Random Effects Exporter Exporter Exporter Exporter Exporter Exporter Exporter Exporter
Note: The dependent variable is log(1+Exports) in all cases. Estimation is by OLS and GLS in columns 1-8, and 2SGLS in column 9. Standard errors are robust, and
adjusted for clustering by reporter, except in column 9 where they are bootstrapped (500 replications). The estimated coefficient on the excluded instrument in
the first stage 2SGLS regression is 6.744*** (z = 53.19). Prob. values are in parentheses below the coefficient estimates. Statistical significance is indicated by: *
10%, ** 5%, and *** 1%.
20
4.4 Counterfactual Simulations
To express the regression results in a different way, we also conduct counterfactual simulations. We
look at the trade impacts of improving multimodal transport performance in all APEC member
economies. We assume that each economy implements reforms that improve multimodal transport
performance by 5% from its initial level in 2007. We assume that they act in a concerted way, i.e., all
economies undertake similar reforms simultaneously.
Gravity model counterfactuals need to be conducted carefully to make sure that they properly account
for changes in multilateral resistance. Failure to account for these effects can lead to serious upward
bias in the estimates of gains from reform. We therefore adopt a different technique from previous
work on trade facilitation (e.g., Wilson et al. 2005), which does not account for multilateral resistance in
their counterfactual analysis. We use the estimated 2SGLS parameters from the mixed effects regression
model (Table 3 column 9), but we undertake the counterfactual analysis using the approximation of the
e po te ’s ultilate al esista e te i t odu ed Baie a d Be gst a d 2009 :
Proceeding in this way provides more accurate simulation results for the case of concerted reform than
does applying the regression coefficients directly to counterfactual values of trade facilitation variables.
As Anderson and Van Wincoop (2003) and Baier and Bergstrand (2009) show, the difference can be
quantitatively important. In general, results obtained using the present methodology show smaller trade
gains from a given level of reform than do those obtained using the Wilson et al. (2005) approach.
However, the simulation only takes account of reform and multilateral resistance on the export side. It
does not consider changes in import policies or behavior. The reason for this is that the focus on this
21
paper is on exports, and so the regression models are constructed with importer fixed effects to account
for multimodal transport performance on the import side, rather than including data directly.
Results in Figure 3 show that the trade gains from improving multimodal transport performance can be
substantial. The range for individual member economies is between 2% and 6% of baseline exports. In
dollar terms, this equates to an impact gain of between $850m and $115bn per member economy. On
the whole, exports to the world would increase by nearly $500bn annually or an increase of 4%. High
performers in multimodal transport, like Singapore and Japan, have the most to gain: 5% improvements
in these economies represent substantial performance upgrades. Economies with challenging
multimodal transport environments see smaller, but still significant, gains from reform: at a minimum,
an increase in exports of nearly 2% follows concerted reforms that improve multimodal transport
performance by 5%.
Another feature of the simulation results is that relatively small and open economies stand to realize
significant gains from reform. Although Chile is starting from a transport environment with a certain
number of constraints—its score is less than 40% that of the regional leader—it experiences major
export gains from reform because its starting level of trade exposure is relatively high; its trade to GDP
ratio is just over 40%.
Figure 3 Simulated percentage change in exports from a 5% improvement in multimodal transport
performance, based on the gravity model (Table 3 Column 9)

22
4.5 Empirical Results by Sector
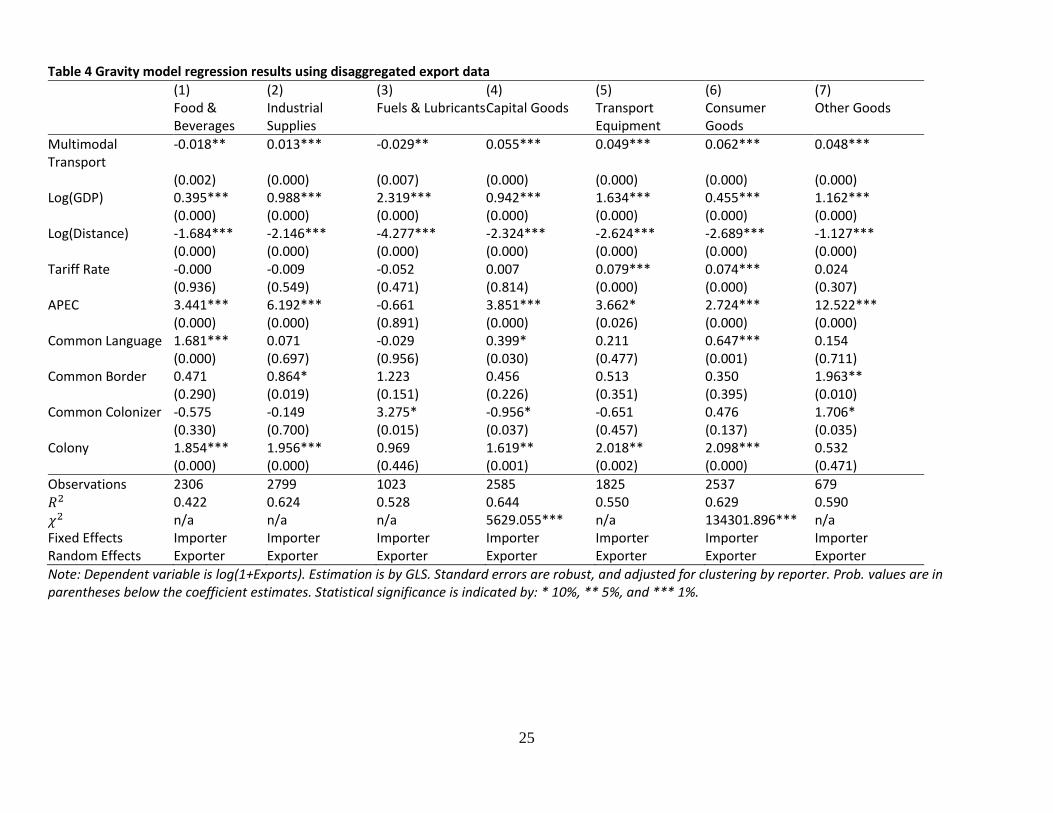
Table 4 presents results for the same gravity model as in column 8 of Table 3, but using data
disaggregated by sector. Although the main thrust of our paper is on the overall links between trade and
multimodal transport connectivity at the aggregate level, it is useful to provide some preliminary
indications as to the way in which that link might change according to sectoral particularities. The
sectoral classification we use follows the one digit level of the Broad Economic Classification system
(BEC). Looking across the columns of Table 4 makes it possible multimodal transport connectivity.
Five of the seven regressions in Table 4 have a multimodal transport coefficient that is positively signed
and statistically significant, which is in line with expectations and with the aggregate results. Only for
fuels and lubricants, and food and beverages, does the coefficient have an unexpected and statistically
significant sign. The reasons for these unexpected results are likely to be a combination of smaller
sample size due to the use of a single sector only, and lack of homogeneity in the product classification.
In addition, trade in agricultural products is subject to a range of non-tariff measures that are not easily
0
1
2
3
4
5
6
7
Cha
nge
in E
xpor
ts (
%)
23
captured in a gravity regression. Similarly, exports of fuels and lubricants are subject to the dynamics of
international commodity markets in a way that is not easily captured in a gravity model framework.
The magnitude of the coefficient on multimodal transport performance varies from one regression to
another. This reflects the fact that different sectors respond differently to improvements. The sensitivity
of trade to multimodal transport is particularly strong in the consumer goods sector, followed by capital
goods, transport equipment, other goods, and industrial supplies.
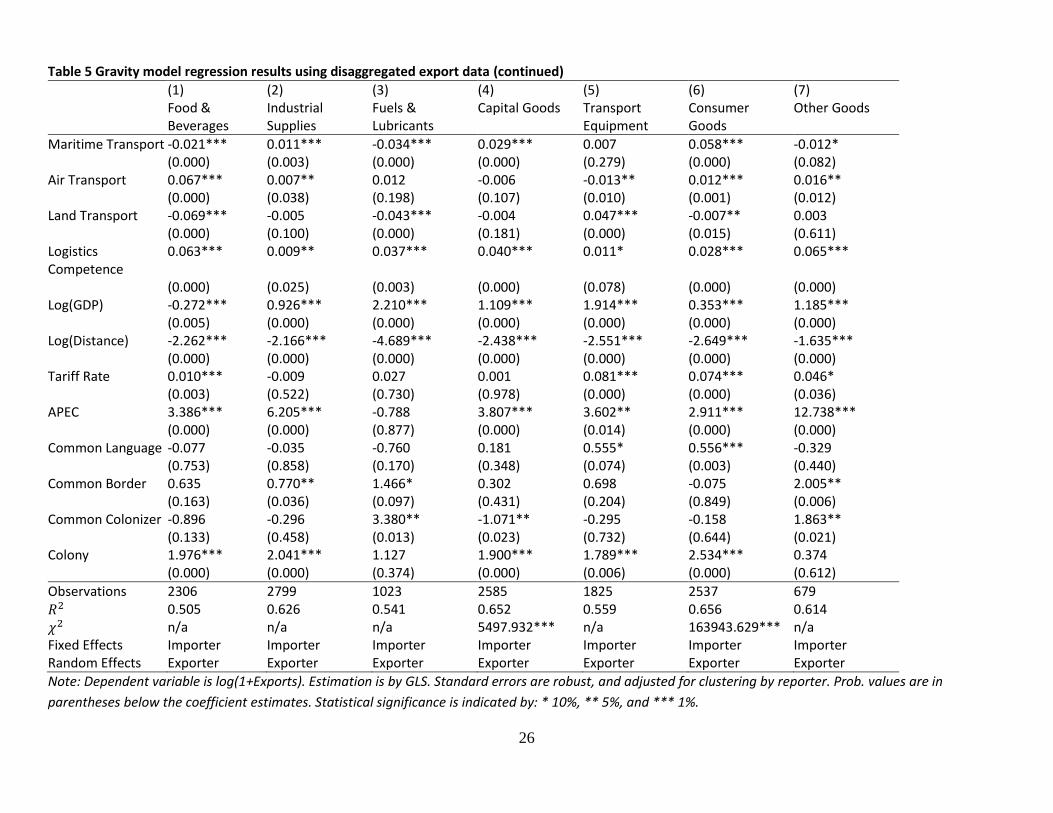
Pushing the data one step further, we can also produce results using data on individual transport modes
(Table 5). The motivation is again to obtain some initial indications as to the sectors that might be most
sensitive to improvements in particular types of transport performance. However, these results should
be taken as indicative only, because the combination of reduced sample size and strong correlation
among the transport variables leads to inflated standard errors, and estimates that are sometimes
difficult to interpret.
Moving across Table 5, maritime transport plays an important role in exports of consumer goods, capital
goods, and industrial supplies. Air transport is especially important for exports of food, and to a lesser
extent consumer and other goods, and industrial products. Land transport appears to be particularly
important for exports of transport equipment. The most consistent results from any of the four
indicators come from logistics competence. It is a significant determinant of trade performance in all
sectors.
A number of results in Table 5 are inconsistent with expectations, however, in that the estimated
coefficients on some of the multimodal transport indicators have coefficients that are negative and, in
some cases, statistically significant. Where coefficients are not significant, the effect of the transport
mode in question can be considered to be negligible for the sector in that regression. Where coefficients
a e sig ifi a t, the e a e t o possi le e pla atio s fo the odel’s poo pe fo a e. Fi st, sa ples a e
24
in some cases very small—as low as 679 observations, compared with over 3,000 for the aggregate
trade regressions. The reason for this change in sample size is that not all economies trade all types of
goods with all other economies. An additional problem with these regressions is that the BEC is a very
broad classification that arguably groups together products that do not necessarily behave the same
way in the context of trade and transport analysis. Future work could explore this point further by using
a different classification system that is more homogeneous, such as ISIC.
25
Table 4 Gravity model regression results using disaggregated export data
(1) (2) (3) (4) (5) (6) (7)
Food &
Beverages
Industrial
Supplies
Fuels & Lubricants Capital Goods Transport
Equipment
Consumer
Goods
Other Goods
Multimodal
Transport
-0.018** 0.013*** -0.029** 0.055*** 0.049*** 0.062*** 0.048***
(0.002) (0.000) (0.007) (0.000) (0.000) (0.000) (0.000)
Log(GDP) 0.395*** 0.988*** 2.319*** 0.942*** 1.634*** 0.455*** 1.162***
(0.000) (0.000) (0.000) (0.000) (0.000) (0.000) (0.000)
Log(Distance) -1.684*** -2.146*** -4.277*** -2.324*** -2.624*** -2.689*** -1.127***
(0.000) (0.000) (0.000) (0.000) (0.000) (0.000) (0.000)
Tariff Rate -0.000 -0.009 -0.052 0.007 0.079*** 0.074*** 0.024
(0.936) (0.549) (0.471) (0.814) (0.000) (0.000) (0.307)
APEC 3.441*** 6.192*** -0.661 3.851*** 3.662* 2.724*** 12.522***
(0.000) (0.000) (0.891) (0.000) (0.026) (0.000) (0.000)
Common Language 1.681*** 0.071 -0.029 0.399* 0.211 0.647*** 0.154
(0.000) (0.697) (0.956) (0.030) (0.477) (0.001) (0.711)
Common Border 0.471 0.864* 1.223 0.456 0.513 0.350 1.963**
(0.290) (0.019) (0.151) (0.226) (0.351) (0.395) (0.010)
Common Colonizer -0.575 -0.149 3.275* -0.956* -0.651 0.476 1.706*
(0.330) (0.700) (0.015) (0.037) (0.457) (0.137) (0.035)
Colony 1.854*** 1.956*** 0.969 1.619** 2.018** 2.098*** 0.532
(0.000) (0.000) (0.446) (0.001) (0.002) (0.000) (0.471)
Observations 2306 2799 1023 2585 1825 2537 679 0.422 0.624 0.528 0.644 0.550 0.629 0.590 n/a n/a n/a 5629.055*** n/a 134301.896*** n/a
Fixed Effects Importer Importer Importer Importer Importer Importer Importer
Random Effects Exporter Exporter Exporter Exporter Exporter Exporter Exporter
Note: Dependent variable is log(1+Exports). Estimation is by GLS. Standard errors are robust, and adjusted for clustering by reporter. Prob. values are in
parentheses below the coefficient estimates. Statistical significance is indicated by: * 10%, ** 5%, and *** 1%.
26
Table 5 Gravity model regression results using disaggregated export data (continued)
(1) (2) (3) (4) (5) (6) (7)
Food &
Beverages
Industrial
Supplies
Fuels &
Lubricants
Capital Goods Transport
Equipment
Consumer
Goods
Other Goods
Maritime Transport -0.021*** 0.011*** -0.034*** 0.029*** 0.007 0.058*** -0.012*
(0.000) (0.003) (0.000) (0.000) (0.279) (0.000) (0.082)
Air Transport 0.067*** 0.007** 0.012 -0.006 -0.013** 0.012*** 0.016**
(0.000) (0.038) (0.198) (0.107) (0.010) (0.001) (0.012)
Land Transport -0.069*** -0.005 -0.043*** -0.004 0.047*** -0.007** 0.003
(0.000) (0.100) (0.000) (0.181) (0.000) (0.015) (0.611)
Logistics
Competence
0.063*** 0.009** 0.037*** 0.040*** 0.011* 0.028*** 0.065***
(0.000) (0.025) (0.003) (0.000) (0.078) (0.000) (0.000)
Log(GDP) -0.272*** 0.926*** 2.210*** 1.109*** 1.914*** 0.353*** 1.185***
(0.005) (0.000) (0.000) (0.000) (0.000) (0.000) (0.000)
Log(Distance) -2.262*** -2.166*** -4.689*** -2.438*** -2.551*** -2.649*** -1.635***
(0.000) (0.000) (0.000) (0.000) (0.000) (0.000) (0.000)
Tariff Rate 0.010*** -0.009 0.027 0.001 0.081*** 0.074*** 0.046*
(0.003) (0.522) (0.730) (0.978) (0.000) (0.000) (0.036)
APEC 3.386*** 6.205*** -0.788 3.807*** 3.602** 2.911*** 12.738***
(0.000) (0.000) (0.877) (0.000) (0.014) (0.000) (0.000)
Common Language -0.077 -0.035 -0.760 0.181 0.555* 0.556*** -0.329
(0.753) (0.858) (0.170) (0.348) (0.074) (0.003) (0.440)
Common Border 0.635 0.770** 1.466* 0.302 0.698 -0.075 2.005**
(0.163) (0.036) (0.097) (0.431) (0.204) (0.849) (0.006)
Common Colonizer -0.896 -0.296 3.380** -1.071** -0.295 -0.158 1.863**
(0.133) (0.458) (0.013) (0.023) (0.732) (0.644) (0.021)
Colony 1.976*** 2.041*** 1.127 1.900*** 1.789*** 2.534*** 0.374
(0.000) (0.000) (0.374) (0.000) (0.006) (0.000) (0.612)
Observations 2306 2799 1023 2585 1825 2537 679 0.505 0.626 0.541 0.652 0.559 0.656 0.614 n/a n/a n/a 5497.932*** n/a 163943.629*** n/a
Fixed Effects Importer Importer Importer Importer Importer Importer Importer
Random Effects Exporter Exporter Exporter Exporter Exporter Exporter Exporter
Note: Dependent variable is log(1+Exports). Estimation is by GLS. Standard errors are robust, and adjusted for clustering by reporter. Prob. values are in
parentheses below the coefficient estimates. Statistical significance is indicated by: * 10%, ** 5%, and *** 1%.
27
5 Conclusion and Policy Implications
The gravity model has been a useful platform in exploring the links between multimodal transport
connectivity and APEC exports. Taking the results from the modeling exercise together, we find strong
evidence that multimodal transport matters for trade. Of course, different types of transport matter
more for some sectors than others. Overall performance, however, is vital in most sectors—and this is
pa ti ula l t ue fo logisti s o pete e, i ludi g the p i ate se to ’s a ilit to a age o ple
international transactions that involve multimodal linkages.
The gains from reform in multimodal transport are potentially significant. The APEC region would
increase exports by around 4%, or between 2% and 6% per member economy. In dollar terms, this
equates to an impact gain of $500bn or between $850m and $115bn per member economy. Economies
that are open, highly integrated into world markets, and with strong multimodal connectivity stand to
gain even more.
Future research could extend our results in a number of ways. First, as new data become available, it will
be possible to improve the gravity model specification by using panel data techniques. This approach
will make it possible to ensure that a wider range of external influences are excluded from the model,
and thus support the robustness of our results.
Second, connectivity in individual transport modes could be assessed using network analysis methods.
The advantage of using network analysis is that such techniques capture the importance of an
e o o ’s positio i the i te atio al t a spo t s ste , ot just the ua tit a d quality of its
infrastructure and logistics performance. However, the data for undertaking this type of analysis are not
yet widely available, and appropriate methodologies are still being developed. Data requirements
include detailed geographical and frequency information on individual sea, air, and land routes. For sea

28
and air connectivity, data can be extracted from industry sources. For land connectivity, use of
geographical information systems modeling (GIS) is required. At the present time, this work has only
been done for a small number of specific regions regarding land transport (e.g., Shepherd and Wilson,
2007, for Eastern Europe and Central Asia).
Third, it will be important to undertake detailed cost-benefit analysis of individual reform projects.
Improving multimodal transport performance often requires substantial investments in infrastructure,
with real economic costs. The balance is generally positive, but each project needs to be evaluated on its
own merits.
In addition, at least four sets of policy implications flow from our findings.
First, infrastructure remains a key constraint in some member economies. Investing in trade- and
transport-related infrastructure such as ports, airports, road, and rail links should remain a priority.
Mobilizing finance for such investments can be challenging in the wake of the Global Financial Crisis, and
there may be scope for economies to work together on a regional or sub-regional basis to help
overcome these constraints. Facilitating trade through regional transit corridors can also be beneficial.
Private-public partnerships can be a key component in building and upgrading infrastructure, as well as
ensuring an appropriate level of maintenance over time (see below). This is a topic being discussed
under the pu ie of APEC’s Se io Fi a e Offi ials Meeti g SFOM .
Second, it is important to set funds aside for infrastructure maintenance in addition to construction.
Depreciation of roads and other infrastructure tends to diminish their usefulness—and their trade
effects—over time. Continuous upgrading is necessary. The return from investment in infrastructure
maintenance can be very high, but setting up sustainable maintenance systems is a challenge for many
economies.
29
Third, a supportive regulatory environment can help improve multimodal transport connectivity. A more
liberal air transport environment is one way of boosting overall air transport performance. Recent work
by the World Bank similarly suggests that a more liberal regulatory environment in distribution services
helps promote higher quality logistics services (Arvis et al., 2010). Regulatory reform based on rigorous
cost-benefit analysis can clearly have major economic benefits in this area. The private sector should of
course be involved as far as possible in the regulatory reform process. The real economic costs of
designing and implementing regulatory reform are very small compared with infrastructure
investments, although the political economy constraints can be significant. Nonetheless, they may
ep ese t lo ha gi g f uit , i the se se of la ge gai s that a e a ui ed elati el i e pe si el .
This is not to understate the technical complexity of reform, however. A whole supply chain approach
means paying attention to the full range of regulatory, contractual, and competition policy issues that
arise.6 Coordination among the various actors is vital.
Finally, private sector development is also a key element of improving multimodal transport
connectivity. Indeed, it may even be the most important part of the overall reform agenda. Our research
shows that the quality and competence of private logistics services can have a stronger effect on trade
performance than the other areas of multimodal transport examined here. Building human and financial
capacity in the logistics sector should remain a priority for member economies. So too should involving
the private sector in infrastructure upgrading, maintenance, and regulatory reform. Civil society is an
important partner in these processes, and appropriate involvement can help ensure adequate
information flows to governments, as well as create an environment of positive compliance and
partnership.
6 The experience of the Australian Competition and Consumer Commission is instructive in this regard: Samuels
(2010).
30
References Anderson, J.E. & Van Wincoop, E., 2003. Gravity with gravitas: a solution to the border puzzle. American
Economic Review, 93(1), 170–192.
Anderson, J. & Van Wincoop, E., 2004. Trade costs. Journal of Economic Literature, 42(3), 691-751.
APEC Transportation Working Group, and the Australian Department of Transport and Regional Services,
2007. Liberalization of air services in the APEC region, 1995-2005. Prepared by the Centre for Asia Pacific
Aviation.
Arvis, J.-F., Mustra, M., Ojala, L., Shepherd, B., & Saslavsky, D., 2010. Connecting to compete 2010: Trade
logistics in the global economy. Washington, D.C.: The World Bank.
Bafoil, François, 2010. Relooking at the role of transport infrastructure in trade, regional growth and
governance: comparing Greater Mekong Subregion (GMS) and Central Eastern Europe (CEE). In: EU
Centre Research Seminar. Singapore, 5 May 2010.
Baier, S., & Bergstrand, J., 2009. Bonus Vetus OLS: a simple method for approximating international
trade cost effects using the Gravity Model. Journal of International Economics, 77(1), 63-76.
Battaglia, Paul, 2007. Modeling intermodal transportation for developing countries. In: The First
European Conference on Management of Technology (EuroMOT), 2006. Available at:
http://www.iamot.org/conference/index.php/ocs/9/schedConf/presentations [Accessed April 2010].
Buys, P., Deichmann, U., & Wheeler, D., 2006. Road network upgrading and overland trade expansion in
Sub-Saharan Africa. Policy Research Working Paper, No. 4097, The World Bank.
Chaney, T., 2008. Distorted Gravity: the intensive and extensive margins of international trade. American
Economic Review, 98(4), 1707-1721.
Carruthers, Robin, Bajpai, Jitendra N., & Hummels, D., 2003. Trade and logistics in East Asia: a
development agenda, EASTR Working Paper, No. 3, Transport Sector Unit, Infrastructure Department,
East Asia and Pacific Region, The World Bank.
The Central Intelligence Agency, 2009. CIA World Factbook. Online. Available at:
https://www.cia.gov/library/publications/the-world-factbook/index.html [Accessed 11 December 2009].
Geloso-Grosso, M., & Shepherd, B., 2009. Liberalizing air cargo services in APEC. GEM Sciences Po.
Working Paper.
Guerrero, P., Lucenti, K., & Galarza, S., 2009. Trade logistics and regional integration in Latin America &
the Caribbean. Inter-American Development Bank working paper series. 148. Available at:
http://idbdocs.iadb.org/wsdocs/getdocument.aspx?docnum=35031936 [Accessed March 2010]
Helpman, E., Melitz, M. & Rubinstein, Y., 2008. Estimating trade flows: trading partners and trading
volumes. Quarterly Journal of Economics, 123(2), 441-487.
Hoekman, B. & Nicita, A., 2008. Trade policy, trade costs, and developing country trade. Policy Research
Working Paper, No. 4797, The World Bank.
31
Hummels, D., Minor, P., Reisman, M., & Endean, E., 2007. Calculating tariff equivalents for time in trade.
Available at:
http://www.tcboostproject.com/_resources/resource/Calculating%20Tariff%20Equivalents%20for%20Time%20in%20Trade.pdf [Accessed March 2010].
Jacoby, David & Hodge Daniel, 2008. Infrastructure investment: the supply chain connection. CSCMP’s Supply Chain Quarterly, Q4.
Limao, N., & Venables, A., 2001. Infrastructure, geographical disadvantage, transport costs, and trade.
World Bank Economic Review, 15(3), 451-479.
MIGA (The Multilateral Investment Guarantee Agency), 2003. Benchmarking FDI competitiveness in
Asia, Snapshot Asia. Washington DC: The World Bank Group/MIGA.
Prentice, Barry E., 2003. Importance of intermodal connectivity and bottleneck elimination. In: Canadian
Transportation Research Forum (CTRF) 38th
Annual Conference.
Samuels, G., 2010. How competition law supports transport and logistics solutions. In: Australian
Logistics Council Forum, Sydney, 2010. Available at:
http://www.accc.gov.au/content/item.phtml?itemId=916863&nodeId=2a3afb3faf8da3cce01d782c701882c7&fn=How [Accessed 27 April 2010].
Shepherd, B., 2010. Trade facilitation in APEC and ASEAN: Delivering the Goods? Working paper,
http://ideas.repec.org/p/pra/mprapa/21531.html.
Shepherd, B., & Wilson, J., 2007. Road infrastructure in Europe and Central Asia: does network quality
affect trade? Journal of Economic Integration, 22(4), 723-747.
Silva, J.M.C.S., & Tenreyro, S., 2006. The log of Gravity. Review of Economics and Statistics, 88(4), 641-
658.
UNCTAD, 2009. Liner shipping connectivity in 2009. UNCTAD Transport Newsletter, 43(2/3), 6-10.
Vickerman, Roger, 2007. Gateways, corridors and competitiveness: an evaluation of Trans-European
networks and lessons for Canada. In: University of British Columbia, Center for Transportation Studies,
Roundtables and International Conference. May 2007.Available at: http://www.gateway-corridor.com/roundconfpapers/ papers.htm [Accessed March 2010].
Wilmsmeier, G., & Hoffmann, J., 2008. Liner shipping connectivity and port infrastructure as
determinants of freight rates in the Caribbean. Maritime Economics and Logistics, 10, 130-151.
Wilson, J., Mann, C. & Otsuki, T., 2005. Assessing the benefits of trade facilitation: a global perspective.
The World Economy, 28(6), 841-871.
World Bank, 2009. World development report 2009: reshaping economic geography. Washington DC:
The World Bank.