the study of flipped-classroom for pre-service science teachers · 2019-01-18 · flipped-classroom...
TRANSCRIPT
education sciences
Article
The Study of Flipped-Classroom for Pre-ServiceScience Teachers
Jin Su Jeong 1,2,* , Florentina Cañada-Cañada 2 and David González-Gómez 2
1 Department of Mechanical Engineering, Chemistry and Industrial Design, School of Engineering andIndustrial Design, Polytechnic University of Madrid, 28012 Madrid, Spain
2 Department of Didactics of Experimental Sciences and Mathematics, University of Extremadura,10003 Cáceres, Spain; [email protected] (F.C.-C.); [email protected] (D.G.-G.)
* Correspondence: [email protected]; Tel.: +34-913-365-620
Received: 16 September 2018; Accepted: 30 September 2018; Published: 2 October 2018�����������������
Abstract: The relatively new methodology, flipped-classroom, is one of blended learning instructionmethodologies in which the traditional-classroom is inverted. This methodology asserts that studentscan participate and engage more successfully in their class and can attain better learning whentheir classroom is flipped. This work presents a two-year study to measure the effects of theflipped-classroom model on the performance, perceptions, and emotions for teacher training studentsin science education. Particularly, this research was carried out during two courses, 2014/2015 and2015/2016, in a general science subject. With a post-task questionnaire, we obtained the informationto assess their performance, perceptions, and emotions, toward the class. The results confirmed thata statistically significant difference was found on all assessments with the flipped-classroom students,performing higher on average, showing favorable perceptions, and demonstrating positive emotionsabout the flipped-classroom model. Thus, the students were ready to take more courses pursuinga flipped-classroom model. The results achieved in this study show a promising inclination aboutthe performance, perceptions, and emotions of students toward the flipped-classroom methodology,and will provide an entirely a new impetus for this relatively new instruction methodology.
Keywords: science education; inverse methodology; pre-service teacher students; performance;perception; emotion; new tendency
1. Introduction
The flipped-classroom intends to engage students more effectively by inverting what traditionallyhas been followed in a classroom. In this new setting, content is delivered outside of the classroom andemploys in-class time on more student-centered activities. The flipped-classroom model, introducedby high-school chemistry teachers Jonathan Bergmann and Aaron Sams, is a relatively new instructionmethodology [1,2]. This relatively new instruction methodology has its foundations in constructivismand the social learning theory [3–5]. For example, in a regular flipped-classroom, lectures and classesare provided to the home by the way of video-lecture materials along with written supplies andon-line quizzes and tasks [2,6]. Therefore, classroom time is more focused on student-centeredlearning activities, such as collaborative exercises, making more interactive courses, and allowing toaddress specific questions as to deliver just-in-time lectures [7,8]. Also, a flipped-classroom modelcan be considered as a mixture for both traditional and online education systems by utilizing in- andout-of-class time, completing more effective learning chances and perspectives [2,9]. Particularly,the main characters of this flipped-classroom instruction methodology are the students, who havemore responsibility in the process of learning [1,10], rather than for instructors. Accordingly, when aflipped-classroom model is respected, their performance, perceptions toward the course and subject,
Educ. Sci. 2018, 8, 163; doi:10.3390/educsci8040163 www.mdpi.com/journal/education
Educ. Sci. 2018, 8, 163 2 of 11
and students’ emotions developed during the learning process must be appraised in order to completelyset this relatively new instruction methodology.
The student-centered instruction design in education makes it more important to evaluatethe performance and achievement of students on the pedagogical methodology [8,11]. In theinstance of the flipped-classroom model, university studies’ evaluation and assessment are stillunder reported and informed, especially in science, technology, engineering, and mathematics (STEM),and numerous preliminary courses [12]. Particularly, Love et al. [12] indicate that the flipped-classroomshowed that the success of students’ performance meaningfully improved in introductory coursesin STEM, which attained better outcomes and increased pleasure. Moreover, the final exam resultsof students who followed the flipped-classroom model were improved and represented students’conceptual and theoretical understanding of the subjects and contents. In an engineering senior class,similar findings were performed and reported [13,14]. In addition, this research denotes that moreteaching materials and resources were used when a flipped-classroom was followed. Comparableresults were explained in a mathematics course [15,16] where the flipped-classroom model improvedthe grades of students. Also, this work suggests that the flipped-classroom model demonstrated itshigher accuracy, especially on moderate complexity items.
In the context of students’ perception, different researchers agreed that students have a positiveperception towards the flipped-classroom model in distinctive educational levels and situations.Specifically, a 2015 study with 142 students in two different classes shows that students favored theflipped-classroom model [17–19]. Butt and Smith [20,21] indicate that students in STEM courses notonly preferred using the flipped-classroom methodology, but also a majority of students specifiedthat the teaching instruments used in the flipped-classroom model were valuable as a learningtool [20,21]. In the same context, Roach [18] also underlines that the capability to watch or re-watchthe flipped materials permitted students to overcome difficulties and complexity, which is relatedwith more multifaceted notions and concepts. Moreover, the nature of the activities achieved in aflipped-classroom model that foster the active participation of students by means of active learningstrategies is positively noticed by students as well [22].
In the teaching and learning process, many research has pointed out a close connection betweenthe cognitive and affective dimensions [23,24]. Emotions perform as a social glue that can interrelateand interconnect individual and collective benefits and actions in students’ learning processes [25].Besides, the constructivism theory points to emotions as significant extents in teaching and learningenvironments [26]. Their conceptual and theoretical change can be limited when instructors ignorethe emotional facets related with the learning process [27]. Specifically, in a STEM course, emotionsperform as a key axis to accomplish substantial learning [28]. In reality, positive emotional conditionsencourage science learning and expand students’ commitment, like active learners, while negativeemotions hinder the learning capability [29,30]. According to various research, the emotional rejectionof students is one of the main causes of failure of courses, especially in a STEM setting, because manystudents feel negative emotions, such as fear, nervousness or concern [30,31]. Therefore, a suitableinstruction methodology, flipped-classroom model, and teaching strategies can increase positiveemotions and/or reduce negative emotions, which could have a positive impact on teaching andlearning process.
2. Objective and Research Questions
The main objective of this research was to measure and assess the students’ performance,perceptions, and emotions when a flipped-classroom model was followed as an instructionmethodology for pre-service science teachers. Thus, the research questions (RQ) that this studyaims to answer are:
• RQ1: How does the flipped-classroom methodology influence learning outcomes in ascience course?
Educ. Sci. 2018, 8, 163 3 of 11
• RQ2: Do students have a positive perception toward a flipped classroom methodology whenused in a science course?
• RQ3: How does the flipped-classroom methodology influence the students’ emotions when aflipped-classroom methodology is followed in a science class? If so, is this influence positiveor negative?
3. Materials and Methods
This research was carried out in a general science course for a sophomore class of the PrimaryEducation bachelor degree of the Teaching Training School of the University of Extremadura,Spain during two courses: 2014/2015 and 2015/2016. A total of 153 students participated in thestudy. The particular subject syllabus for this study contains the matter and the energy of generalscience topic, and it was taught in the second semester 4 hours/week and was compulsory forall students.
3.1. Flipped-CClassroom Instructinal Design
At the beginning of the semester, the flipped-classroom paradigm was presented to the studentsalong with the class flowchart, which contained all the important dates and class activities programmed.The course structure consisted of theoretical and laboratory contents (3 sessions of 50 min weekly and1 session of 50 min weekly per groups, respectively). Specifically, it had five sections according to thecontents and learning difficulties. Here, all students used a Moodle virtual interface of the universityfor delivering the flipped-classroom contents.
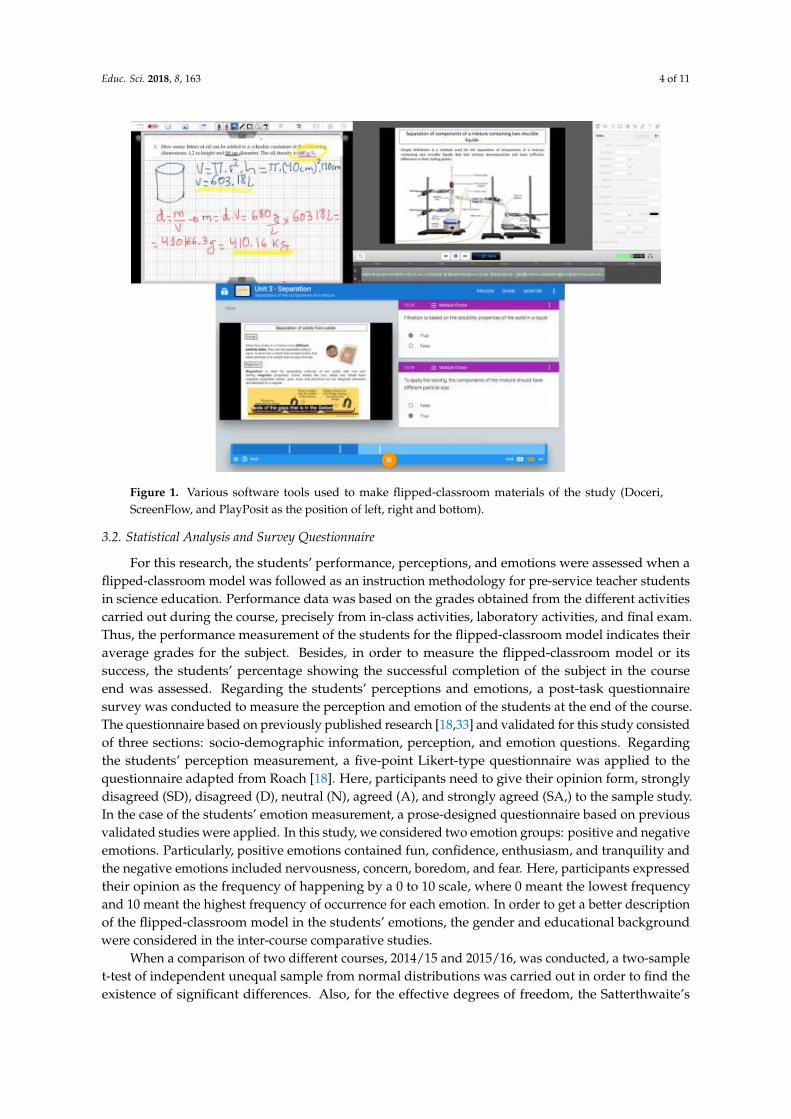
As shown in Figure 1, Doceri and ScreenFlow software tools were utilized for elaboratingasynchronous video lectures. Particularly, Doceri software was a very useful alternative tool, which candeliver science classes to multiple distance campuses with synchronous and asynchronous onlineinstruction [32]. The instructors encouraged the students watching the video lectures before theclass based on the class schedule. Besides, eduCanon and PlayPosit, which are online learningenvironments, were utilized to make the video-lecture materials more appealing and to createinteractive lessons for the students. Here, quiz questionnaires were included in the video lectures,which could provide additional emphasis and information in difficult parts of the content and providefeedback to the instructors before the class, increasing the students’ engagement and deliveringjust-in-time lectures required.
Taking the lecture out of the classroom, the students participated more actively in the in-classtime, rather than being passively note-taking and listening to the lectures. With this instructionstructure, the students consumed in-class time working on various problem sets such as numericaland non-numerical tasks developed by the instructors, together with lab demonstrations. Furthermore,they worked on published materials, small group discussion and case studies, where the instructorsgave to the students a real-world problematic and tricky conditions related with the class contentreviewed in the video lessons. The instructor’s role in these sessions was to observe situations,address concerns, and distribute clarifications when they were required.
Educ. Sci. 2018, 8, 163 4 of 11
Educ. Sci. 2018, 8, x FOR PEER REVIEW 4 of 11
Figure 1. Various software tools used to make flipped-classroom materials of the study (Doceri,
ScreenFlow, and PlayPosit as the position of left, right and bottom).
3.2. Statistical Analysis and Survey Questionnaire
For this research, the students’ performance, perceptions, and emotions were assessed when a
flipped-classroom model was followed as an instruction methodology for pre-service teacher
students in science education. Performance data was based on the grades obtained from the different
activities carried out during the course, precisely from in-class activities, laboratory activities, and
final exam. Thus, the performance measurement of the students for the flipped-classroom model
indicates their average grades for the subject. Besides, in order to measure the flipped-classroom
model or its success, the students’ percentage showing the successful completion of the subject in the
course end was assessed. Regarding the students’ perceptions and emotions, a post-task
questionnaire survey was conducted to measure the perception and emotion of the students at the
end of the course. The questionnaire based on previously published research [18,33] and validated
for this study consisted of three sections: socio-demographic information, perception, and emotion
questions. Regarding the students’ perception measurement, a five-point Likert-type questionnaire
was applied to the questionnaire adapted from Roach [18]. Here, participants need to give their
opinion form, strongly disagreed (SD), disagreed (D), neutral (N), agreed (A), and strongly agreed
(SA,) to the sample study. In the case of the students’ emotion measurement, a prose-designed
questionnaire based on previous validated studies were applied. In this study, we considered two
emotion groups: positive and negative emotions. Particularly, positive emotions contained fun,
confidence, enthusiasm, and tranquility and the negative emotions included nervousness, concern,
boredom, and fear. Here, participants expressed their opinion as the frequency of happening by a 0
to 10 scale, where 0 meant the lowest frequency and 10 meant the highest frequency of occurrence
for each emotion. In order to get a better description of the flipped-classroom model in the students’
emotions, the gender and educational background were considered in the inter-course
comparative studies.
When a comparison of two different courses, 2014/15 and 2015/16, was conducted, a two-sample
t-test of independent unequal sample from normal distributions was carried out in order to find the
existence of significant differences. Also, for the effective degrees of freedom, the Satterthwaite’s
Figure 1. Various software tools used to make flipped-classroom materials of the study (Doceri,ScreenFlow, and PlayPosit as the position of left, right and bottom).
3.2. Statistical Analysis and Survey Questionnaire
For this research, the students’ performance, perceptions, and emotions were assessed when aflipped-classroom model was followed as an instruction methodology for pre-service teacher studentsin science education. Performance data was based on the grades obtained from the different activitiescarried out during the course, precisely from in-class activities, laboratory activities, and final exam.Thus, the performance measurement of the students for the flipped-classroom model indicates theiraverage grades for the subject. Besides, in order to measure the flipped-classroom model or itssuccess, the students’ percentage showing the successful completion of the subject in the courseend was assessed. Regarding the students’ perceptions and emotions, a post-task questionnairesurvey was conducted to measure the perception and emotion of the students at the end of the course.The questionnaire based on previously published research [18,33] and validated for this study consistedof three sections: socio-demographic information, perception, and emotion questions. Regardingthe students’ perception measurement, a five-point Likert-type questionnaire was applied to thequestionnaire adapted from Roach [18]. Here, participants need to give their opinion form, stronglydisagreed (SD), disagreed (D), neutral (N), agreed (A), and strongly agreed (SA,) to the sample study.In the case of the students’ emotion measurement, a prose-designed questionnaire based on previousvalidated studies were applied. In this study, we considered two emotion groups: positive and negativeemotions. Particularly, positive emotions contained fun, confidence, enthusiasm, and tranquility andthe negative emotions included nervousness, concern, boredom, and fear. Here, participants expressedtheir opinion as the frequency of happening by a 0 to 10 scale, where 0 meant the lowest frequencyand 10 meant the highest frequency of occurrence for each emotion. In order to get a better descriptionof the flipped-classroom model in the students’ emotions, the gender and educational backgroundwere considered in the inter-course comparative studies.
When a comparison of two different courses, 2014/15 and 2015/16, was conducted, a two-samplet-test of independent unequal sample from normal distributions was carried out in order to find theexistence of significant differences. Also, for the effective degrees of freedom, the Satterthwaite’s
Educ. Sci. 2018, 8, 163 5 of 11
approximation was utilized. All calculations and computations were completed with differentopen-code toolboxes written for MATLAB and available on the MATLAB official website.
4. Results
4.1. Sample Description
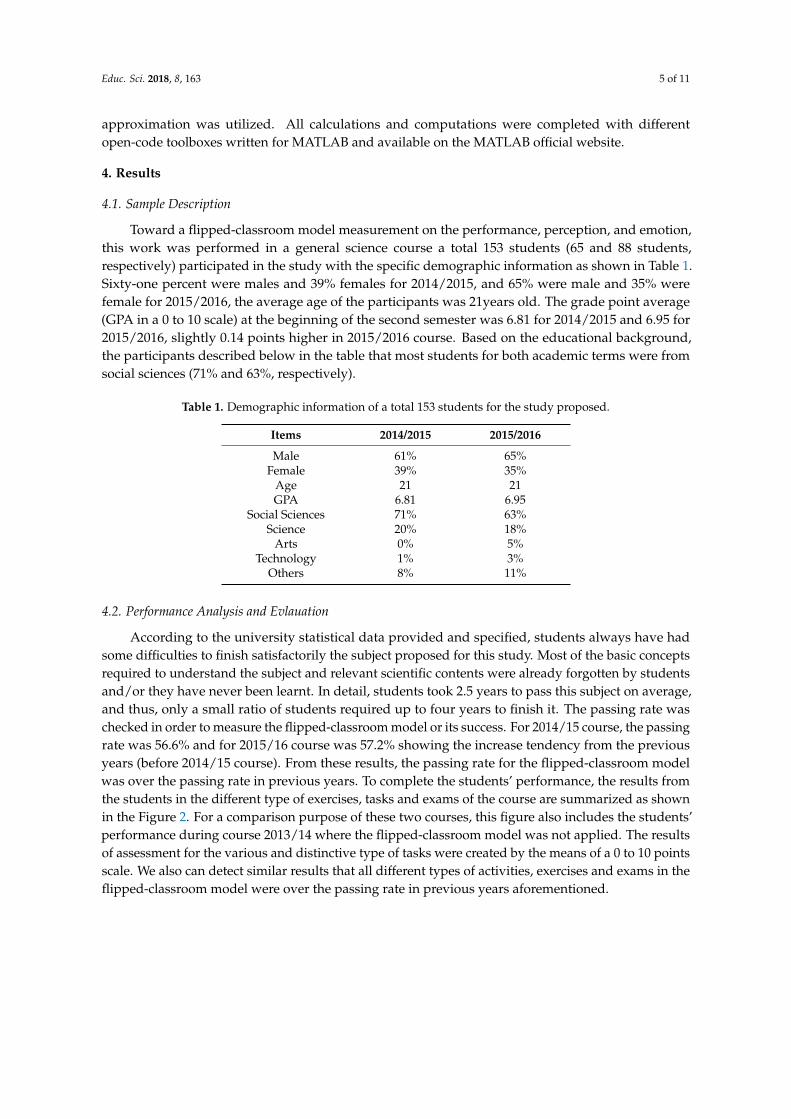
Toward a flipped-classroom model measurement on the performance, perception, and emotion,this work was performed in a general science course a total 153 students (65 and 88 students,respectively) participated in the study with the specific demographic information as shown in Table 1.Sixty-one percent were males and 39% females for 2014/2015, and 65% were male and 35% werefemale for 2015/2016, the average age of the participants was 21years old. The grade point average(GPA in a 0 to 10 scale) at the beginning of the second semester was 6.81 for 2014/2015 and 6.95 for2015/2016, slightly 0.14 points higher in 2015/2016 course. Based on the educational background,the participants described below in the table that most students for both academic terms were fromsocial sciences (71% and 63%, respectively).
Table 1. Demographic information of a total 153 students for the study proposed.
Items 2014/2015 2015/2016
Male 61% 65%Female 39% 35%
Age 21 21GPA 6.81 6.95
Social Sciences 71% 63%Science 20% 18%
Arts 0% 5%Technology 1% 3%
Others 8% 11%
4.2. Performance Analysis and Evlauation
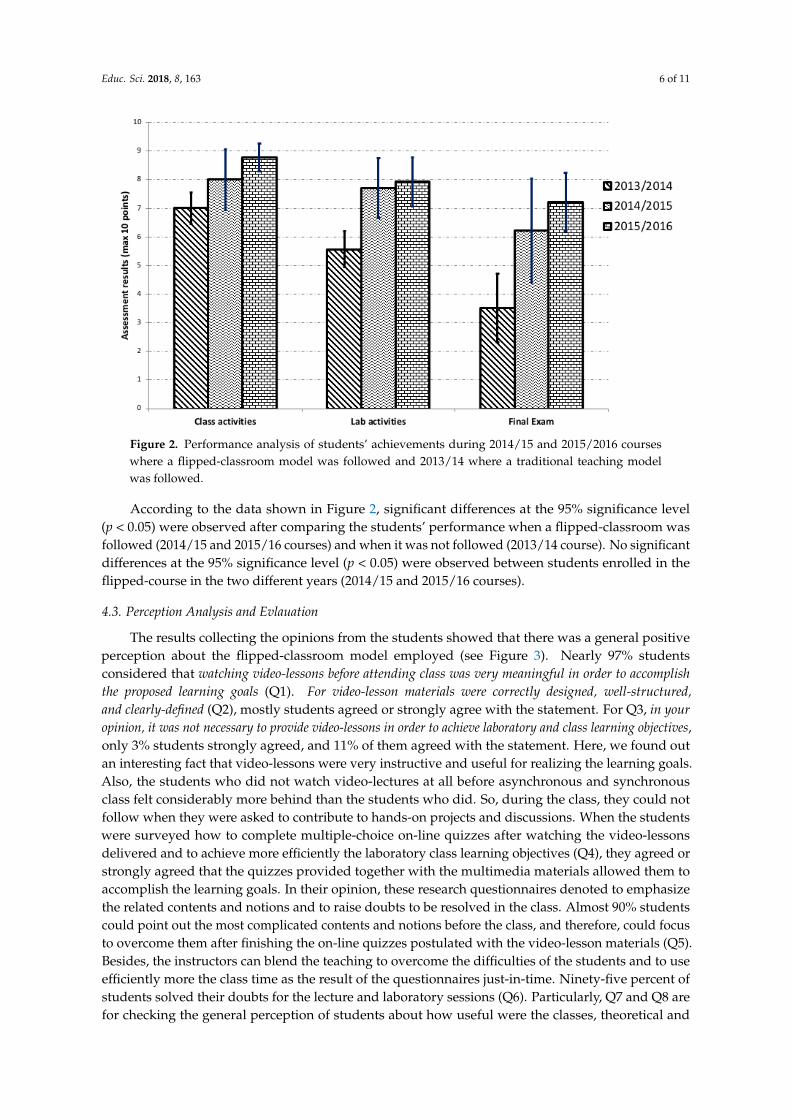
According to the university statistical data provided and specified, students always have hadsome difficulties to finish satisfactorily the subject proposed for this study. Most of the basic conceptsrequired to understand the subject and relevant scientific contents were already forgotten by studentsand/or they have never been learnt. In detail, students took 2.5 years to pass this subject on average,and thus, only a small ratio of students required up to four years to finish it. The passing rate waschecked in order to measure the flipped-classroom model or its success. For 2014/15 course, the passingrate was 56.6% and for 2015/16 course was 57.2% showing the increase tendency from the previousyears (before 2014/15 course). From these results, the passing rate for the flipped-classroom modelwas over the passing rate in previous years. To complete the students’ performance, the results fromthe students in the different type of exercises, tasks and exams of the course are summarized as shownin the Figure 2. For a comparison purpose of these two courses, this figure also includes the students’performance during course 2013/14 where the flipped-classroom model was not applied. The resultsof assessment for the various and distinctive type of tasks were created by the means of a 0 to 10 pointsscale. We also can detect similar results that all different types of activities, exercises and exams in theflipped-classroom model were over the passing rate in previous years aforementioned.
Educ. Sci. 2018, 8, 163 6 of 11Educ. Sci. 2018, 8, x FOR PEER REVIEW 6 of 11
Figure 2. Performance analysis of students’ achievements during 2014/15 and 2015/2016 courses
where a flipped-classroom model was followed and 2013/14 where a traditional teaching model
was followed.
According to the data shown in Figure 2, significant differences at the 95% significance level
(p < 0.05) were observed after comparing the students’ performance when a flipped-classroom was
followed (2014/15 and 2015/16 courses) and when it was not followed (2013/14 course). No significant
differences at the 95% significance level (p < 0.05) were observed between students enrolled in the
flipped-course in the two different years (2014/15 and 2015/16 courses).
4.3. Perception Analysis and Evlauation
The results collecting the opinions from the students showed that there was a general positive
perception about the flipped-classroom model employed (see Figure 3). Nearly 97% students
considered that watching video-lessons before attending class was very meaningful in order to accomplish the
proposed learning goals (Q1). For video-lesson materials were correctly designed, well-structured, and clearly-
defined (Q2), mostly students agreed or strongly agree with the statement. For Q3, in your opinion, it
was not necessary to provide video-lessons in order to achieve laboratory and class learning objectives, only
3% students strongly agreed, and 11% of them agreed with the statement. Here, we found out an
interesting fact that video-lessons were very instructive and useful for realizing the learning goals.
Also, the students who did not watch video-lectures at all before asynchronous and synchronous
class felt considerably more behind than the students who did. So, during the class, they could not
follow when they were asked to contribute to hands-on projects and discussions. When the students
were surveyed how to complete multiple-choice on-line quizzes after watching the video-lessons
delivered and to achieve more efficiently the laboratory class learning objectives (Q4), they agreed or
strongly agreed that the quizzes provided together with the multimedia materials allowed them to
accomplish the learning goals. In their opinion, these research questionnaires denoted to emphasize
the related contents and notions and to raise doubts to be resolved in the class. Almost 90% students
could point out the most complicated contents and notions before the class, and therefore, could focus
to overcome them after finishing the on-line quizzes postulated with the video-lesson materials (Q5).
Besides, the instructors can blend the teaching to overcome the difficulties of the students and to use
efficiently more the class time as the result of the questionnaires just-in-time. Ninety-five percent of
students solved their doubts for the lecture and laboratory sessions (Q6). Particularly, Q7 and Q8 are
for checking the general perception of students about how useful were the classes, theoretical and
laboratory class, for their professional training as a future primary teacher and whether the course
Figure 2. Performance analysis of students’ achievements during 2014/15 and 2015/2016 courseswhere a flipped-classroom model was followed and 2013/14 where a traditional teaching modelwas followed.
According to the data shown in Figure 2, significant differences at the 95% significance level(p < 0.05) were observed after comparing the students’ performance when a flipped-classroom wasfollowed (2014/15 and 2015/16 courses) and when it was not followed (2013/14 course). No significantdifferences at the 95% significance level (p < 0.05) were observed between students enrolled in theflipped-course in the two different years (2014/15 and 2015/16 courses).
4.3. Perception Analysis and Evlauation
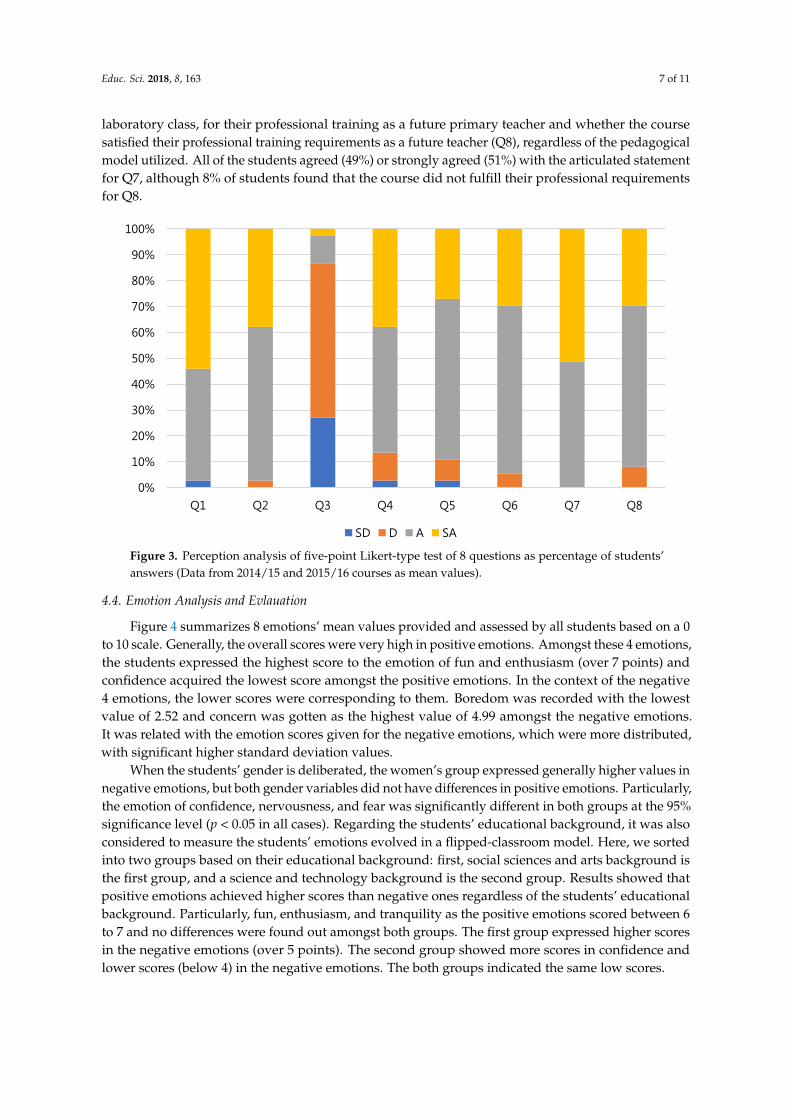
The results collecting the opinions from the students showed that there was a general positiveperception about the flipped-classroom model employed (see Figure 3). Nearly 97% studentsconsidered that watching video-lessons before attending class was very meaningful in order to accomplishthe proposed learning goals (Q1). For video-lesson materials were correctly designed, well-structured,and clearly-defined (Q2), mostly students agreed or strongly agree with the statement. For Q3, in youropinion, it was not necessary to provide video-lessons in order to achieve laboratory and class learning objectives,only 3% students strongly agreed, and 11% of them agreed with the statement. Here, we found outan interesting fact that video-lessons were very instructive and useful for realizing the learning goals.Also, the students who did not watch video-lectures at all before asynchronous and synchronousclass felt considerably more behind than the students who did. So, during the class, they could notfollow when they were asked to contribute to hands-on projects and discussions. When the studentswere surveyed how to complete multiple-choice on-line quizzes after watching the video-lessonsdelivered and to achieve more efficiently the laboratory class learning objectives (Q4), they agreed orstrongly agreed that the quizzes provided together with the multimedia materials allowed them toaccomplish the learning goals. In their opinion, these research questionnaires denoted to emphasizethe related contents and notions and to raise doubts to be resolved in the class. Almost 90% studentscould point out the most complicated contents and notions before the class, and therefore, could focusto overcome them after finishing the on-line quizzes postulated with the video-lesson materials (Q5).Besides, the instructors can blend the teaching to overcome the difficulties of the students and to useefficiently more the class time as the result of the questionnaires just-in-time. Ninety-five percent ofstudents solved their doubts for the lecture and laboratory sessions (Q6). Particularly, Q7 and Q8 arefor checking the general perception of students about how useful were the classes, theoretical and
Educ. Sci. 2018, 8, 163 7 of 11
laboratory class, for their professional training as a future primary teacher and whether the coursesatisfied their professional training requirements as a future teacher (Q8), regardless of the pedagogicalmodel utilized. All of the students agreed (49%) or strongly agreed (51%) with the articulated statementfor Q7, although 8% of students found that the course did not fulfill their professional requirementsfor Q8.
Educ. Sci. 2018, 8, x FOR PEER REVIEW 7 of 11
satisfied their professional training requirements as a future teacher (Q8), regardless of the
pedagogical model utilized. All of the students agreed (49%) or strongly agreed (51%) with the
articulated statement for Q7, although 8% of students found that the course did not fulfill their
professional requirements for Q8.
Figure 3. Perception analysis of five-point Likert-type test of 8 questions as percentage of students’
answers (Data from 2014/15 and 2015/16 courses as mean values).
4.4. Emotion Analysis and Evlauation
Figure 4 summarizes 8 emotions’ mean values provided and assessed by all students based on
a 0 to 10 scale. Generally, the overall scores were very high in positive emotions. Amongst these 4
emotions, the students expressed the highest score to the emotion of fun and enthusiasm (over 7
points) and confidence acquired the lowest score amongst the positive emotions. In the context of the
negative 4 emotions, the lower scores were corresponding to them. Boredom was recorded with the
lowest value of 2.52 and concern was gotten as the highest value of 4.99 amongst the negative
emotions. It was related with the emotion scores given for the negative emotions, which were more
distributed, with significant higher standard deviation values.
0%
10%
20%
30%
40%
50%
60%
70%
80%
90%
100%
Q1 Q2 Q3 Q4 Q5 Q6 Q7 Q8
SD D A SA
Figure 3. Perception analysis of five-point Likert-type test of 8 questions as percentage of students’answers (Data from 2014/15 and 2015/16 courses as mean values).
4.4. Emotion Analysis and Evlauation
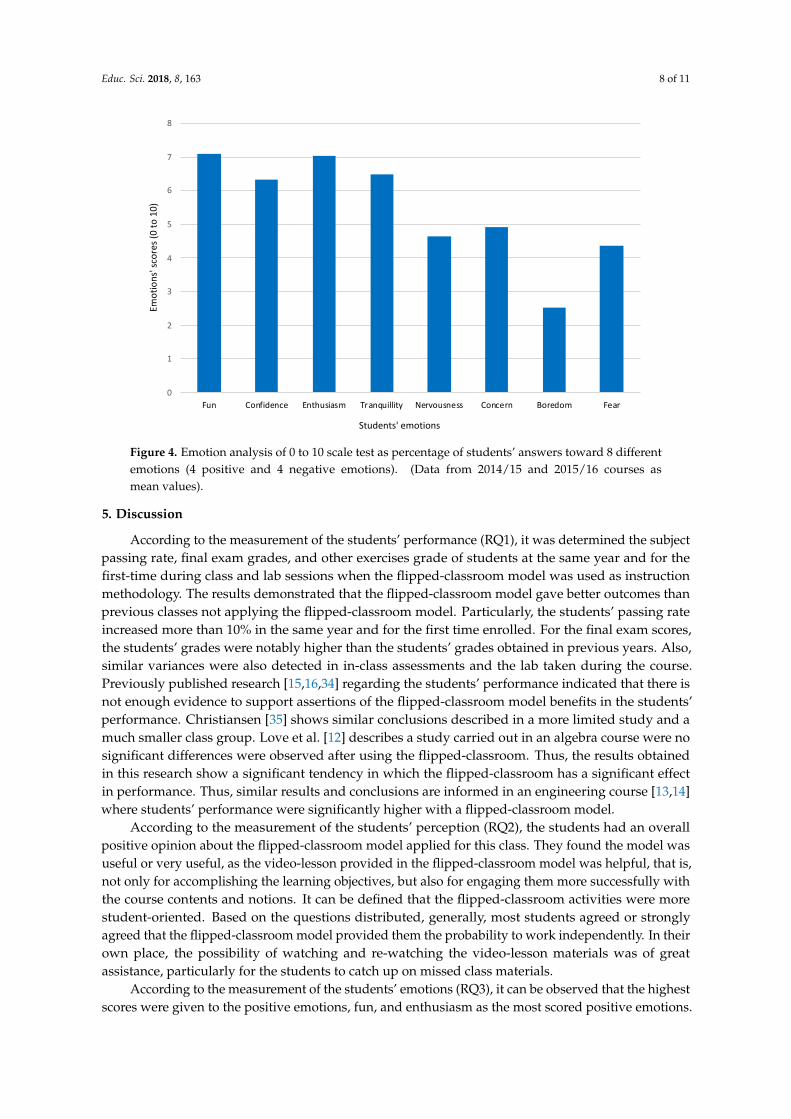
Figure 4 summarizes 8 emotions’ mean values provided and assessed by all students based on a 0to 10 scale. Generally, the overall scores were very high in positive emotions. Amongst these 4 emotions,the students expressed the highest score to the emotion of fun and enthusiasm (over 7 points) andconfidence acquired the lowest score amongst the positive emotions. In the context of the negative4 emotions, the lower scores were corresponding to them. Boredom was recorded with the lowestvalue of 2.52 and concern was gotten as the highest value of 4.99 amongst the negative emotions.It was related with the emotion scores given for the negative emotions, which were more distributed,with significant higher standard deviation values.
When the students’ gender is deliberated, the women’s group expressed generally higher values innegative emotions, but both gender variables did not have differences in positive emotions. Particularly,the emotion of confidence, nervousness, and fear was significantly different in both groups at the 95%significance level (p < 0.05 in all cases). Regarding the students’ educational background, it was alsoconsidered to measure the students’ emotions evolved in a flipped-classroom model. Here, we sortedinto two groups based on their educational background: first, social sciences and arts background isthe first group, and a science and technology background is the second group. Results showed thatpositive emotions achieved higher scores than negative ones regardless of the students’ educationalbackground. Particularly, fun, enthusiasm, and tranquility as the positive emotions scored between 6to 7 and no differences were found out amongst both groups. The first group expressed higher scoresin the negative emotions (over 5 points). The second group showed more scores in confidence andlower scores (below 4) in the negative emotions. The both groups indicated the same low scores.
Educ. Sci. 2018, 8, 163 8 of 11Educ. Sci. 2018, 8, x FOR PEER REVIEW 8 of 11
Figure 4. Emotion analysis of 0 to 10 scale test as percentage of students’ answers toward 8 different
emotions (4 positive and 4 negative emotions). (Data from 2014/15 and 2015/16 courses as mean values).
When the students’ gender is deliberated, the women’s group expressed generally higher values
in negative emotions, but both gender variables did not have differences in positive emotions.
Particularly, the emotion of confidence, nervousness, and fear was significantly different in both
groups at the 95% significance level (p < 0.05 in all cases). Regarding the students’ educational
background, it was also considered to measure the students’ emotions evolved in a flipped-classroom
model. Here, we sorted into two groups based on their educational background: first, social sciences
and arts background is the first group, and a science and technology background is the second group.
Results showed that positive emotions achieved higher scores than negative ones regardless of the
students’ educational background. Particularly, fun, enthusiasm, and tranquility as the positive
emotions scored between 6 to 7 and no differences were found out amongst both groups. The first
group expressed higher scores in the negative emotions (over 5 points). The second group showed
more scores in confidence and lower scores (below 4) in the negative emotions. The both groups
indicated the same low scores.
5. Discussion
According to the measurement of the students’ performance (RQ1), it was determined the
subject passing rate, final exam grades, and other exercises grade of students at the same year and
for the first-time during class and lab sessions when the flipped-classroom model was used as
instruction methodology. The results demonstrated that the flipped-classroom model gave better
outcomes than previous classes not applying the flipped-classroom model. Particularly, the students’
passing rate increased more than 10% in the same year and for the first time enrolled. For the final
exam scores, the students’ grades were notably higher than the students’ grades obtained in previous
years. Also, similar variances were also detected in in-class assessments and the lab taken during the
course. Previously published research [15,16,34] regarding the students’ performance indicated that
there is not enough evidence to support assertions of the flipped-classroom model benefits in the
students’ performance. Christiansen [35] shows similar conclusions described in a more limited study
and a much smaller class group. Love et al. [12] describes a study carried out in an algebra course
were no significant differences were observed after using the flipped-classroom. Thus, the results
obtained in this research show a significant tendency in which the flipped-classroom has a significant
effect in performance. Thus, similar results and conclusions are informed in an engineering course
[13,14] where students’ performance were significantly higher with a flipped-classroom model.
0
1
2
3
4
5
6
7
8
Fun Confidence Enthusiasm Tranquillity Nervousness Concern Boredom Fear
Emo
tio
ns'
sco
res
(0 t
o 1
0)
Students' emotions
Figure 4. Emotion analysis of 0 to 10 scale test as percentage of students’ answers toward 8 differentemotions (4 positive and 4 negative emotions). (Data from 2014/15 and 2015/16 courses asmean values).
5. Discussion
According to the measurement of the students’ performance (RQ1), it was determined the subjectpassing rate, final exam grades, and other exercises grade of students at the same year and for thefirst-time during class and lab sessions when the flipped-classroom model was used as instructionmethodology. The results demonstrated that the flipped-classroom model gave better outcomes thanprevious classes not applying the flipped-classroom model. Particularly, the students’ passing rateincreased more than 10% in the same year and for the first time enrolled. For the final exam scores,the students’ grades were notably higher than the students’ grades obtained in previous years. Also,similar variances were also detected in in-class assessments and the lab taken during the course.Previously published research [15,16,34] regarding the students’ performance indicated that there isnot enough evidence to support assertions of the flipped-classroom model benefits in the students’performance. Christiansen [35] shows similar conclusions described in a more limited study and amuch smaller class group. Love et al. [12] describes a study carried out in an algebra course were nosignificant differences were observed after using the flipped-classroom. Thus, the results obtainedin this research show a significant tendency in which the flipped-classroom has a significant effectin performance. Thus, similar results and conclusions are informed in an engineering course [13,14]where students’ performance were significantly higher with a flipped-classroom model.
According to the measurement of the students’ perception (RQ2), the students had an overallpositive opinion about the flipped-classroom model applied for this class. They found the model wasuseful or very useful, as the video-lesson provided in the flipped-classroom model was helpful, that is,not only for accomplishing the learning objectives, but also for engaging them more successfully withthe course contents and notions. It can be defined that the flipped-classroom activities were morestudent-oriented. Based on the questions distributed, generally, most students agreed or stronglyagreed that the flipped-classroom model provided them the probability to work independently. In theirown place, the possibility of watching and re-watching the video-lesson materials was of greatassistance, particularly for the students to catch up on missed class materials.
According to the measurement of the students’ emotions (RQ3), it can be observed that the highestscores were given to the positive emotions, fun, and enthusiasm as the most scored positive emotions.
Educ. Sci. 2018, 8, 163 9 of 11
Amongst the negative emotions, boredom got a lower score. Therefore, the students attended to aflipped-classroom model had a more positive and less negative emotions. Particularly, the women’sgroup provided higher scores to negative emotions. Regarding the students’ educational background,a science and technology background postulated lower scores to the negative emotions evaluated inthis study, but the positive emotions were in the same order as a social sciences and art background.
6. Conclusions
This research aimed to assess students’ performance, perceptions, and emotions when aflipped-classroom setting was followed as an instruction methodology for teacher training studentsin science education. Particularly, this research was carried out during two courses: 2014/2015 and2015/2016 in a general science subject previously mentioned. With the post-task questionnaires,we obtained the information and measurement to assess their performance, perceptions, and emotionstoward the class.
Considering the research questions established for this work, we can conclude better learningoutcomes are achieved when a flipped classroom methodology is applied in a science course. The studyconducted during two different courses indicate that this effect is consistent. In addition, when themajority of students were satisfied with the class setting, they agreed to consider that the coursewas a valuable learning experience in general, and they perceived the flipped materials adequate toachieve the learning goals. Furthermore, the results suggest that a flipped learning method fosteredstudents’ participation more effectively than traditional teaching formats. With regard to the emotionsassessments, this research reveals that the flipped-classroom methodology had a significant influenceon students’ emotions toward the science course. Positive emotions were highly scored by the students.Especially, they attended class in a more confident and tranquilly way. The flipped methodology madea great positive impact, in terms of emotions toward the course, when students did not have a scienceeducational background. That is especially relevant since the majority of students that participated inthis study did not take sciences in the previous years (middle and high school).
Author Contributions: This work is the result of the collaboration between all authors. All authors have equallycontributed, reviewed, and improved the manuscript. All authors have revised and approved the final manuscript.
Funding: This work was financed by Research Project EDU2016-77007-R (AEI/FEDER, UE) of the Ministry ofEconomy and Competitiveness of Spain.
Acknowledgments: We acknowledge that this research is supported by the Juan de la Cierva-Formación of theMinistry of Economy and Competitiveness of Spain (ref. JDC-2015). The authors are very grateful to the programthat made this work possible.
Conflicts of Interest: The authors declare no conflict of interest.
References
1. Tucker, B. The Flipped classroom. Online instruction at home frees class for learning. Educ. Next 2012, 12,82–83.
2. Munir, M.T.; Baroutian, S.; Young, B.R.; Carter, S. Flipped classroom with cooperative learning as acornerstone. Educa. Chem. Eng. 2018, 23, 25–33. [CrossRef]
3. Hill, J.R.; Song, L.; West, R.E. Social learning theory and web-based learning environments: A review ofresearch and discussion of implications. Am. J. Distance Educ. 2009, 23, 88–103. [CrossRef]
4. Sams, A.; Bergmann, J. Flip your students’ learning. Technol. Rich Learn. 2013, 70, 16–20.5. González-Gómez, D.; Jeong, J.S.; Gallego Picó, A.; Cañada, F. Influencia de la metodología flipped en las
emociones sentidas por estudiantes del Grado de Educación Primaria en clases de ciencias dependiendo delbachillerato cursado. Educ. Quím. 2018, 29, 77–88.
6. Tourón, J.; Santiago, R. Flipped learning model and the development of talent at school. Revista Educ. 2015,368, 33–65.
7. Mohamed, H.; Lamina, M. Implementing flipped classroom that used an intelligent tutoring system intolearning process. Comput. Educ. 2018, 124, 62–76. [CrossRef]
Educ. Sci. 2018, 8, 163 10 of 11
8. Moraros, J.; Islam, A.; Yu, S.; Banow, R.; Schindelka, B. Flipping for success: Evaluating the effectiveness of anovel teaching approach in a graduate level setting. BMC Med. Educ. 2015, 15, 1–10. [CrossRef] [PubMed]
9. Young, J.R. “Hybrid” teaching seeks to end the divide between traditional and online instruction.Chron. High. Educ. 2002, 48, A33–A34.
10. O’Flaherty, J.; Phillips, C. The use of flipped classrooms in higher education: A scoping review.Internet High. Educ. 2015, 25, 85–95. [CrossRef]
11. Isikoglu, N.; Basturk, R.; Karaca, F. Assessing in-service teachers’ instructional beliefs about student-centerededucation: A Turkish perspective. Teach. Teach. Educ. 2009, 25, 350–356. [CrossRef]
12. Love, B.; Hodge, A.; Grandgenett, N.; Swift, A.W. Student learning and perceptions in a flipped linearalgebra course. Int. J. Math. Educ. Sci. Technol. 2013, 45, 317–324. [CrossRef]
13. Rupakheti, C.R.; Hays, M.; Mohan, S.; Chenoweth, S.; Stouder, A. On a pursuit for perfecting anundergraduate requirements engineering course. J. Syst. Softw. 2018, 144, 366–381. [CrossRef]
14. Mason, G.S.; Rutar, T.S.; Cook, K.E. Comparing the effectiveness of an inverted classroom to a traditionalclassroom in an upper-division engineering course. IEEE Trans. Educ. 2013, 56, 430–435. [CrossRef]
15. Sun, Z.; Xie, K.; Anderman, L.H. The role of self-regulated learning in students’ success in flippedundergraduate math courses. Internet High. Educ. 2018, 36, 41–53. [CrossRef]
16. Mattis, K.V. Flipped classroom versus traditional textbook instruction: Assessing accuracy and mental effortat different levels of mathematical complexity. Technol. Knowl. Learn. 2014, 20, 231–248. [CrossRef]
17. Gilboy, M.B.; Heinerichs, S.; Pazzaglia, G. Enhancing student engagement using the flipped classroom.J. Nutr. Educ. Behav. 2015, 47, 109–114. [CrossRef] [PubMed]
18. Roach, T. Student perceptions toward flipped learning: new methods to increase interaction and activelearning in economics. Int. Rev. Econ. Educ. 2014, 17, 74–84. [CrossRef]
19. González-Gómez, G.; Airado Rodríguez, D.; Cañada-Cañada, F.; Jeong, J.S. A comprehensive applicationto assist in acid−base titration self-learning: an approach for high school and undergraduate students.J. Chem. Educ. 2015, 92, 855–863. [CrossRef]
20. Butt, A. Student views on the use of a flipped classroom approach: Evidence from Australia.Bus. Educ. Accredit. 2014, 6, 33–43.
21. Smith, T.R.; Rama, P.S.; Helms, J.R. Teaching critical thinking in a GE class: A flipped model.Think. Skill. Creat. 2018, 28, 73–83. [CrossRef]
22. Handelsman, J.; Ebert-May, D.; Beichner, R.; Bruns, P.; Chang, A.; DeHaan, R.; Gentile, J.; Lauffer, S.; Steart, J.;Tilghman, S.M.; et al. Policy forum: Scientific teaching. Science 2004, 304, 521–522. [CrossRef] [PubMed]
23. Hargreaves, A. Mixed emotions: Teachers’ perceptions of their interactions with students. Teach. Teach. Educ.2000, 16, 811–826. [CrossRef]
24. Sutton, R.E.; Wheatley, K.F. Teachers’ emotions and teaching: a review of the literature and directions forfuture research. Educ. Psychol. Rev. 2003, 15, 327–358. [CrossRef]
25. Tobin, K. Reproducir y transformar la didáctica de las ciencias en un ambiente colaborativo. Enseñanza delas Ciencias 2010, 28, 301–313.
26. Ross, A.A.G. Coming in from the cold: Constructivism and emotions. European J. Int. Relations 2012, 12,197–222. [CrossRef]
27. Moffatt, K.; Todd, S.; Barnoff, L.; Pyne, J.; Panitch, M.; Parada, H.; McLeod, S.; Young, N.H. Worry aboutprofessional education: Emotions and affect in the context of neoliberal change in postsecondary education.Emot. Space Soc. 2018, 26, 9–15. [CrossRef]
28. Pintrich, P.R.; Marx, R.W.; Boyle, R.A. Beyond cold conceptual change: The role of motivational beliefsand classroom contextual factors in the process of conceptual change. Eur. J. Int. Relat. 1993, 63, 167–199.[CrossRef]
29. Vázquez, A.; Manassero, M.A. En defensa de las actitudes y emociones en la educación científica (I):Evidencias y argumentos generales. Revista Eureka sobre Enseñanza y Divulgación de las Ciencias 2007, 4,247–271. [CrossRef]
30. Aydogan, H.; Bozkurt, F.; Coskun, H. An assessment of brain electrical activities of students toward teacher’sspecific emotions. Int. J. Soc. Behav. Educ. Econ. Bus. Ind. Eng. 2015, 9, 1977–2000.
31. Solbes, J. ¿Por qué disminuye el alumnado de ciencias? Alambique 2011, 67, 53–61.32. Silverberg, L.J.; Tierney, J.; Bodek, M.J. Use of Doceri software for iPad in online delivery of chemistry
content. J. Chem. Educ. 2014, 91, 1999–2001. [CrossRef]

Educ. Sci. 2018, 8, 163 11 of 11
33. González-Gómez, D.; Jeong, J.S.; Cañada-Cañada, F.; Gallego-Picó, A. La enseñanza de contenidos científicosa través de un modelo “Flipped”: Propuesta de instrucción para estudiantes del Grado de EducaciónPrimaria. Enseñanza de las Ciencias 2017, 35, 71–87.
34. Blair, E.; Maharaj, C.; Primus, S. Performance and perception in the flipped classroom. Educ. Inf. Technol.2016, 21, 1465–1482. [CrossRef]
35. Christiansen, M.A. Inverted teaching: Applying a new pedagogy to a university organic chemistry class.J. Chem. Educ. 2014, 91, 1845–1850. [CrossRef]
© 2018 by the authors. Licensee MDPI, Basel, Switzerland. This article is an open accessarticle distributed under the terms and conditions of the Creative Commons Attribution(CC BY) license (http://creativecommons.org/licenses/by/4.0/).