the structure of depression and anxiety symptoms in diabetic
TRANSCRIPT
University of IowaIowa Research Online
Theses and Dissertations
2008
The Structure of depression and anxiety symptomsin diabetic patient and community adult samplesElizabeth Anne McDade-MontezUniversity of Iowa
Copyright 2008 Elizabeth Anne McDade-Montez
This dissertation is available at Iowa Research Online: http://ir.uiowa.edu/etd/209
Follow this and additional works at: http://ir.uiowa.edu/etd
Part of the Psychology Commons
Recommended CitationMcDade-Montez, Elizabeth Anne. "The Structure of depression and anxiety symptoms in diabetic patient and community adultsamples." PhD (Doctor of Philosophy) thesis, University of Iowa, 2008.http://ir.uiowa.edu/etd/209.
THE STRUCTURE OF DEPRESSION AND ANXIETY SYMPTOMS IN DIABETIC PATIENT AND COMMUNITY ADULT SAMPLES
by
Elizabeth Anne McDade-Montez
An Abstract
Of a thesis submitted in partial fulfillment of the requirements for the Doctor of Philosophy degree
in Psychology in the Graduate College of The University of Iowa
December 2008
Thesis Supervisor: Professor David Watson
ABSTRACT Delineating and diagnosing depression and anxiety in the presence of a medical
condition, such as diabetes, is complicated by the presence of overlapping symptoms that,
therefore, are etiologically ambiguous. These overlapping symptoms include feelings of
fatigue, concentration difficulties, restlessness, changes in appetite, irritability and
autonomic arousal. The difficulty in understanding these overlapping symptoms has been
proposed to lead to an underdiagnosis of depression and anxiety disorders among adults
with diabetes, which is problematic given that such disorders are associated with poorer
health outcomes. The goal of the current study is to test whether or not these overlapping
symptoms are affected by the presence of diabetes by comparing structural models of
these symptoms in adults with diabetes versus those free of major medical conditions.
Participants include 226 adults with diabetes and 379 adults free of diabetes who
completed a series of questionnaires assessing symptoms of depression, anxiety and
health status. In addition, for adults with diabetes, the most recent hemoglobin A1c lab
result was collected from patient medical records. Results indicate that overlapping
symptoms were strongly related to mood for adults with and without diabetes. In
conclusion, it is recommended that when these overlapping symptoms are present in
adults with diabetes, depression and anxiety should be considered as possible contributors
to their presence.
Abstract Approved: _____________________________________ Thesis Supervisor ___________________________________ Title and Department ____________________________________
Date
1
THE STRUCTURE OF DEPRESSION AND ANXIETY SYMPTOMS IN DIABETIC PATIENT AND COMMUNITY ADULT SAMPLES
by
Elizabeth Anne McDade-Montez
A thesis submitted in partial fulfillment of the requirements for the Doctor of Philosophy degree
in Psychology in the Graduate College of The University of Iowa
December 2008
Thesis Supervisor: Professor David Watson

Copyright by
ELIZABETH ANNE MCDADE-MONTEZ
2008
All Rights Reserved

Graduate College The University of Iowa
Iowa City, City
CERTIFICATE OF APPROVAL ______________________________
PH.D. THESIS
_________________
This is to certify that the Ph. D. thesis of
Elizabeth Anne McDade-Montez has been approved by the Examining Committee for the thesis requirement for the Doctor of Philosophy degree in Psychology at the December 2008 graduation. Thesis Committee: _____________________________________ David Watson, Thesis Supervisor _____________________________________ Lee Anna Clark _____________________________________ Michael O’Hara _____________________________________ Jerry Suls _____________________________________ Carolyn Turvey

ii
To Hazel
iii
ACKNOWLEDGMENTS
Funding for this project was received from NIMH Grant R01-MH068472 to
David Watson and from UISG Research Grant Program to Elizabeth McDade-
Montez. I would like to thank Thomas O’Dorisio, M.D., William Sivitz, M.D. and
the Endocrinology faculty and staff at the University of Iowa Hospitals and Clinics
for their support of this project and participation. I would also like to thank John Ely,
M.D. and the Family Medicine faculty and staff at the University of Iowa Hospitals
and Clinics for their support and participation in this project. Thank you also to the
staff of the Iowa City VA Medical Center for their participation in and assistance with
this study. I am especially grateful to all the patients and community members who
agreed to participate in this study.
Thank you to the members of my dissertation committee, Lee Anna Clark,
Michael O’Hara, Jerry Suls, and Carolyn Turvey, for their guidance and feedback on
this project. A very special thank you is due to my advisor, David Watson, for his
ongoing support and assistance with my dissertation and graduate studies.
Finally, I would like to thank my husband for his continuous support, kindness
and patience throughout my graduate training.
iv
TABLE OF CONTENTS
LIST OF TABLES………………………………………………………………….........iv
INTRODUCTION ...............................................................................................................1 The Comorbidity of Anxiety and Depression...................................................3 Structural Models of Anxiety and Depression..................................................4
The Two Factor Model..............................................................................4 The Tripartite Model .................................................................................5 Integrative Hierarchical Model of Anxiety and Depression......................6
Examining Structural Models of Anxiety and Depression in Medical Patients..............................................................................................................8 Pathophysiology of Diabetes ..........................................................................11 Studies of Specific and Nonspecific Symptoms of Depression and Anxiety in Diabetes Samples..........................................................................17
Depressive Disorders, Anxiety Disorders and Correlates in Diabetes Patients .....................................................................................17 Summary..................................................................................................26 Self-Report Measures of Depression and Anxiety and Their Correlates.................................................................................................27 Summary and Conclusions ......................................................................32
CURRENT STUDY...........................................................................................................35 Goals ...............................................................................................................35 Hypotheses......................................................................................................39 Methods ..........................................................................................................44
Participants ..............................................................................................44 Measures..................................................................................................47 Procedure.................................................................................................63 Overview of Analyses .............................................................................64 Summary..................................................................................................68
RESULTS ………………………………………………………………………………70 Descriptive Statistics ......................................................................................70 Test for Mean Level Differences in................................................................72 Depression and Anxiety Symptoms................................................................72 Structural Analyses.........................................................................................73
Elimination of Poor Markers ...................................................................73 Preliminary Correlational Analyses ........................................................74 Exploratory Factor Analyses ...................................................................76 Initial Confirmatory Factor Analysis.......................................................77 Testing Model Constraints Within Samples............................................81
DISCUSSION....................................................................................................................85 Limitations......................................................................................................96 Future Directions ............................................................................................98
APPENDIX A: TABLES................................................................................................101

v
APPENDIX B: SELECTED MEASURES.....................................................................139
REFERENCES ................................................................................................................175
vi
LIST OF TABLES
Table
A1. Specified indicators of the factor model to be tested 102 A2. Specified Hypotheses and Models in Analyses 104 A3. Patient and Community Demographic Characteristics 105 A4. Self-Reported Diabetes Characteristics 107 A5. Self-Reported Medical Conditions 109 A6. Self-Reported Diabetes Symptoms from SCPO 110 A7. Scale Means & Standard Deviations 111 A8. Scale Internal Consistency Reliabilities 115 A9. Correlations among Symptom Scales 118 A10. Fit Indices for CFA Models 120 A11. 9-Factor EFA in Diabetes Sample 123 A12. 8-Factor EFA in Community Sample, Promax Rotation 124 A13. 8-Factor EFA in Diabetes Sample, Promax Rotation 125 A14. 8-Factor EFA in Community Sample, Varimax Rotation 126 A15. 8-Factor EFA in Diabetes Sample, Varimax Rotation 127 A16. Specified indicators of the final factor model (Model 3) 128 A17. Correlations among Symptom Factors for Model 3 130 A18. CFA Factor Loadings for Model 3, Diabetes Sample 131 A19. Factor Loadings for Model 3, Community Sample 132 A20. Correlations among Symptom Factors for Model 3, Multiple Sample 133 A21. Factor Loadings for Model 3, Multiple Sample CFA, Diabetes Sample 134
vii
A22. Factor Loadings for Model 3, Multiple Sample CFA, Community Sample 135 A23. Correlations among Symptom Factors for Model 3, Multiple Sample Constrained 136 A24. Factor Loadings for Model 3, Multiple Sample Constrained CFA, Diabetes Sample 137 A25. Factor Loadings for Model 3, Multiple Sample Constrained CFA, Community Sample 138
1
INTRODUCTION
An estimated 18.2 million Americans have diabetes and the prevalence is
expected to increase, affecting 324 million people worldwide by 2025 (Permutt, Wasson
& Cox, 2005). Among adults aged 65 and older, diabetes is 10 times as common
compared with younger adults, and minority racial groups (including Hispanics, African
Americans and Native Americans) are affected at a rate of 2 to 4 times that for white
individuals (Permutt et al., 2005). Diabetes was the 6th leading cause of death in the U.S.
in 2002 and individuals with diabetes have a two-fold risk of death compared with same-
aged non-diabetics (Centers for Disease Control and Prevention [CDC], 2005).
Although causal mechanisms are unknown, significant evidence exists suggesting
that diabetes is a considerable risk factor for the development of psychiatric problems
such as anxiety and depression. Rates of depression among individuals with diabetes are
estimated to be 21-24% of patients or twice as high as general population estimates
(Anderson, Freedland, Clouse & Lustman, 2001). This two-fold increased risk of
depression is generally robust whether depression is measured via structured interview or
self-report (Eaton, 2002). Research has also found that the course of depression among
patients with diabetes is more severe and has a high relapse rate following initial episodes
(Gonder-Frederick, Cox & Ritterband, 2002).
Some anxiety disorders have also been found to be more prevalent among
diabetes patients than among non-diabetics. In a review of 18 studies with a total of 4076
participants (2584 diabetic patients, 1492 control participants), Grigsby, Anderson,
Freedland, Clouse and Lustman (2002) examined the prevalence of anxiety disorders and
anxiety symptoms in Type 1 and Type 2 diabetes patients. The review found that 14% of
2
diabetes patients had any current anxiety disorder (as defined by either point prevalence
in most studies or in the past 2-, 6- or 12-month intervals preceding the study in 4 studies)
and identified the following additional current prevalence rates: Anxiety Disorder Not
Otherwise Specified = 26.5%, Simple Phobia = 21.6%, Generalized Anxiety Disorder
(GAD) = 13.5%, Social Phobia = 7.3%, Agoraphobia = 4.6%, Panic = 1.3%, Obsessive
Compulsive Disorder (OCD) = 1.3% and Post-Traumatic Stress Disorder (PTSD) =
1.2%. Although the rates of panic disorder, OCD, PTSD and agoraphobia were
comparable to those found in community samples, rates of GAD and any phobia were
considerably higher than those found in community samples (e.g. Kessler, Chiu, Demler,
& Walters, 2005). In addition, 40% of diabetes patients were found to have elevated
anxiety symptoms on self-report measures.
The presence of depression and anxiety among diabetes patients is associated with
multiple behaviors that have a negative impact on disease management. These include
increased smoking, alcohol or other drug abuse; poorer eating and appetite dysregulation;
and poorer self-managed metabolic control (Gonder-Frederick et al., 2002). These
behaviors, in turn, are associated with poorer health outcomes and greater diabetes-
related complications (Gonder-Frederick et al., 2002). A recent meta-analysis of the
impact of depression on diabetes complications found a moderate overall effect size
across 27 studies. The review found that depression was significantly associated with
diabetic retinopathy, nephropathy, neuropathy, macrovascular complications and sexual
dysfunction (De Groot, Anderson, Freedland, Clouse, & Lustman, 2001). Thus the
identification and treatment of clinically significant anxiety and depression should be a
priority in the treatment of diabetes.

3
The Comorbidity of Anxiety and Depression
Clinicians and researchers have noted the comorbidity of anxiety and depression
for some time, and in particular since the release of the DSM-III-R (American Psychiatric
Association [APA], 1987), which removed exclusionary rules prohibiting the diagnosis of
both a mood and anxiety disorder. With the removal of this exclusionary rule,
comorbidity between mood and anxiety disorders was found to be high. A review by
Clark (1989) indicated that 57% of patients meeting criteria for major depression also
met criteria for one or more anxiety disorders. In addition, 56% of patients meeting
criteria for an anxiety disorder also met criteria for depression (Clark, 1989). This
finding was replicated by the National Comorbidity Survey (NCS; Kessler et al., 1996),
which found that 58% of patients with MDE met criteria for an anxiety disorder. This
overlap in depression and anxiety symptoms has also been found in studies using self-
report and clinician-rated measures. For example, Clark and Watson’s (1991) review
found correlations in the .5 to .6 range between measures of self-reported depression and
anxiety for both patient and nonpatient samples. Their review also established an
approximate correlation of .4 to .45 between clinician ratings of anxious and depressed
symptomatology among both patients and nonpatients. Mineka, Watson and Clark’s
(1998) review of comorbidity found similar rates of diagnostic and self-reported
comorbidity in other studies and samples (e.g. children and adolescents). Comorbidity of
mood and anxiety disorders in the studies reviewed by Mineka et al. (1998) ranged from
30 to 75%.
Similar rates have been identified among diabetes patients. In a recent study of
403 Type 2 diabetes patients, Thomas, Jones, Scarinci and Brantley (2003) found that
4
46% of diabetes patients meeting criteria for a depressive disorder also met criteria for an
anxiety disorder. In addition, 46% of patients meeting criteria for an anxiety disorder
also met criteria for a depressive disorder.
Structural Models of Anxiety and Depression
The Two Factor Model
Structural models of anxiety and depression have proven useful in understanding
the nature of the comorbidity between these disorders. One prominent model was based
originally on the 2-factor structure of affect, consisting of the general dimensions of
negative and positive affect (NA and PA, respectively; Watson & Tellegen, 1985). These
dimensions are generally unipolar and largely independent of one another. Negative
affect is typically characterized by various negative mood states, for example, guilt,
sadness, anxiety and hostility. Positive affect is typically characterized by a variety of
positive mood states such as feeling happy, energetic and strong. This model suggests
that the various negative mood states associated with NA will generally be highly
correlated with one another. In addition, the positive mood states linked to PA will also
tend to be highly correlated with one another. This model has been robustly supported
across multiple samples including students, psychiatric patients and community
members, with high correlations (e.g. .5 and higher) typically found between different
negative mood states such as sadness and fear (e.g. Watson, 2005). Thus the 2-factor
model of NA and PA explains, in part, the overlap in the mood and anxiety disorders.
Subsequent research has sought to use this structural model to improve the
discriminability of the mood and anxiety disorders. Additional studies of the 2-factor
model found that low PA is specific to depressed mood and symptomatology (e.g.

5
Watson, Clark, & Carey, 1988). That is, low PA tends to be moderately related to
indicators of depression, but more weakly associated with measures of anxiety. This
finding has been found repeatedly, with correlations between anxious symptoms and PA
typically ranging from 0 to -.2 and correlations between depressed symptoms and PA
generally significantly higher, ranging from -.3 to -.45 (Watson, 2005).
The Tripartite Model
The tripartite model built upon this two-factor model and added an additional
specific component to explicate the nature of the mood and anxiety disorders and
improve discriminability between them (Clark & Watson, 1991). The tripartite model
groups symptoms of anxiety and depression into three general types: (1) those that are
robust markers of nonspecific distress and NA, (2) those that are unique to depression
and (3) those that are unique to anxiety. Those symptoms that are general indicators of
NA are referred to as nonspecific symptoms and include both sad and anxious mood, as
well as other nonspecific symptoms such as restlessness, irritability, appetite disturbance
and others. Those symptoms that are unique to depression include anhedonia, or low PA.
Finally, the tripartite model introduced autonomic arousal (AA) as a symptom dimension
specific to anxiety. This dimension is defined by markers of somatic arousal, such as
feeling short of breath, dizzy, shaky and having a racing heart (Watson et. al, 1995).
The tripartite model has received considerable support (see Mineka et al., 1998,
for a review). For example, Brown, Chorpita and Barlow (1998) examined the tripartite
model in a sample of 350 outpatients with diagnoses of mood or anxiety disorders (major
depression, generalized anxiety disorder [GAD], social phobia, obsessive compulsive
disorder [OCD] and panic disorder). The authors tested multiple structural models of the
6
relationships among these disorders, as well as their associations with NA, PA and AA.
They found that the tripartite model was the best fit for the data: NA was nonspecifically
related to all of these disorders, whereas PA had the strongest link to depression (r = -
.53), and AA was specifically related to panic disorder. Contrary to the predictions of
the model, however, AA was not broadly related to the other anxiety disorders.
The results of this study and others suggested areas for refinement of the tripartite
model. First, the findings of Brown et al. (1998) indicate that AA is specifically linked to
panic disorder/agoraphobia, rather than being more broadly characteristic of the anxiety
disorders. In addition, a substantial negative association between PA and social phobia
was found in Brown et al. (1998) and has been replicated in subsequent studies (e.g.
Watson, Gamez & Simms, 2005). Thus the tripartite model provides a useful framework
yet does not fully account for the specificity of anxiety symptoms.
Integrative Hierarchical Model of Anxiety and Depression
Additional structural models have been proposed to explain the nature of
depressive and anxiety symptoms and have expanded upon the specific symptoms of the
anxiety disorders. Barlow (1991) proposed a model based on a hierarchical structure of
anxiety disorder symptoms. This model proposes a higher order general factor of anxious
apprehension (i.e., NA), which distinguishes anxiety disorder patients from non-patients.
In addition, several specific symptoms are proposed that distinguish among anxiety
disorders such as OCD, GAD, panic disorder, social phobia, agoraphobia and specific
phobia (see also Zinbarg & Barlow, 1996). Zinbarg and Barlow (1996) found strong
support for this model in a study of 432 anxiety disorder clinic patients using self-report
measures modeling both specific and nonspecific symptoms of anxiety disorders.
7
Mineka et al. (1998) subsequently proposed the integrative hierarchical model
that incorporates elements from the tripartite model as well as from Barlow’s hierarchical
model. The integrative hierarchical model proposes that different disorders characterized
by negative affect have both common and unique components. This model differs from
previous models in three ways. First, the relative size of these general and specific
components are acknowledged to vary across disorders. More specifically, the model
proposes that disorders such as depression and GAD, which are marked by pervasive
distress, have a greater NA component than other disorders. Second, the model is argued
to be broadly applicable to virtually all types of psychopathology; that is, Mineka et al.
(1998) hypothesize that the nonspecific NA dimension is not confined to the mood and
anxiety disorders but also characterizes almost all forms of psychopathology. Third, the
model proposes that there likely are no absolute specific components; rather, all specific
components are relative. In other words, the model assumes that a symptom will rarely
be unique to any single disorder, but rather will characterize a limited range of disorders,
relative to others. In addition, the model proposes that AA is not specific to all anxiety
disorders but rather is unique to some of them, with particularly strong links to panic
disorder and post-traumatic stress disorder (PTSD).
Several specific symptoms have been proposed from these structural models (e.g.
Mineka et al., 1998; Watson et al., 1995) including panic attacks, agoraphobic avoidance
and autonomic symptoms, all of which are specific to certain anxiety disorders. Suicidal
behavior, early-morning wakening and pessimism have been proposed as symptoms
specific to mood disorders. In addition, several symptoms related to low PA may be
specific to depression. These include loss of interest or pleasure, apathy, hopelessness,
8
fatigue and lethargy, and psychomotor retardation. Proposed nonspecific symptoms of
mood and anxiety disorders including the following: NA, depressed mood, anxious
mood, loss of libido, loss of appetite, feelings of worthlessness or guilt, insomnia,
irritability, concentration difficulties and psychomotor agitation. In addition, Clark and
Watson (1991) point out that low-self esteem may be a nonspecific symptom related to
general distress, although further research has shown self-esteem to be reasonably
specific to depressed rather than anxious mood (Watson, Suls, & Haig, 2002).
Examining Structural Models of Anxiety and
Depression in Medical Patients
Although these structural models, in particular the integrative hierarchical model,
have repeatedly received support in the literature from multiple studies, little research has
applied the model to medical patients. In general, most research has been conducted on
young, healthy adults or on psychiatric patients. Very little is known regarding the
generalizability of the integrative hierarchical model to specific medical samples.
Structural examinations of depression and anxiety symptoms are significant for two
primary reasons. First, a lack of such research on medical patient samples allows for
ambiguity concerning the structural nature of depression and anxiety in such samples. In
other words, the associations between some symptom dimensions, for example appetite
loss and negative affect, are unclear. Although research on non-medical samples shows
strong associations between appetite loss and negative affect, for example, it is unclear if
similar associations would emerge among medical samples as well. On a related note,
the ability of specific symptoms of depression and anxiety (e.g. fatigue and PA) to
differentiate between these disorders also remains unclear. In turn, this lessens our
9
ability to discriminate among depression and anxiety disorders among medical samples.
Second, the integrative model’s specification of specific and nonspecific symptoms of
anxiety and depression may be of particular use in samples in which some symptoms
have an uncertain etiology, such as in diabetes patients. Currently, the diagnostic utility
of some common symptom dimensions of anxiety and depression (e.g. dizziness, fatigue,
increased appetite), which typically have been studied in healthy samples, are unclear in
diabetes samples (see “Pathophysiology of Diabetes,” below, for more detail). Common
practice among many health care providers excludes these symptoms from diagnostic
criteria in the presence of a medical illness (e.g. Cavanaugh, 1995). In fact, the DSM-IV
criteria for major depressive episode exclude any such symptom “due to the direct
physiologic effects of . . . a general medical condition,” (p. 356, APA, 1994) although
the means by which to determine a symptom’s etiology are not stated. As a result, such
symptoms are often eliminated from the criteria, even though they have not been
empirically established as unrelated to depression or anxiety among medical samples.
Thus depression and anxiety continue to be under-recognized in diabetes patients, with
estimates that 2 out of 3 depression cases are not identified (Lustman, Griffith & Crouse,
1997). A structural test of depression and anxiety symptoms helps resolve the nature of
relations among such symptom dimensions.
A review of the literature revealed one study examining a structural model of
depression and anxiety symptoms in a medical sample. D. A. Clark, Cook and Snow
(1998) sought to determine if depression symptom presentation differences are present
among medical patients. Investigators compared 75 medical in-patients, 52 psychiatric
in-patients and 25 normal controls on symptoms of depression and anxiety based on the

10
tripartite model. The authors administered several broad measures of anxiety and
depression, including the Beck Depression Inventory (BDI; Beck & Steer, 1993), the
Hamilton Rating Scales of Depression and Anxiety (HRSD; Hamilton, 1960, & HARS;
Hamilton, 1959, respectively), the Hospital Anxiety and Depression Scale (HADS;
Zigmond & Snaith, 1983) and the Mood and Anxiety Symptom Questionnaire (MASQ;
Watson & Clark, 1991). To summarize the authors’ main findings, a one-factor solution
of a principal-components analysis revealed that all measures loaded |.66| or higher on
this single factor in the medical sample, and |.22| or higher in the psychiatric patient
sample. In addition, affective and negative cognition symptoms of depression best
discriminated the psychiatric patients from the medical patients. Among medical
patients, the somatic and behavioral symptoms of depression and anxiety (i.e. anhedonia,
low PA, and physiological hyperarousal) best discriminated the depressed from the
nondepressed medical patients. However, the authors performed a discriminant function
analysis that indicated that the symptoms of anhedonia and hyperarousal may also be
influenced by the presence of a medical condition. Therefore, these symptoms may not
be pure markers of depression and anxiety in a medical population. Based on their
results, the authors concluded that the most significant differences between the
psychiatric patients and the medical patients were differences in severity rather than type
of depression symptoms.
Several limitations of this study are worth noting. First, the group sizes were
relatively small, which minimized the ability to find significant differences between
samples. Second, several of the measures selected were poor discriminators of
depression and anxiety and generally were highly correlated across most other measures,
11
particularly in the medical sample. In addition, some of the specific and nonspecific
lower order symptoms of anxiety and depression were not well modeled in the measures
the authors used. In addition, the authors recruited a heterogeneous medical sample with
a wide range of illnesses and disease severity. The heterogeneity of the medical patient
group confuses the meaning of certain lower order symptoms, such as fatigue and
concentration difficulties, which may or may not be present in some medical conditions.
Nevertheless, the study addresses an important issue and suggests ways to make
meaningful improvements in future research, such as by using a homogeneous sample
and controlling for disease-related differences as well as modeling the specific and
nonspecific symptoms of depression and anxiety more thoroughly. The use of a diabetes
sample, in which similar symptoms are commonly experienced by most patients, would
eliminate many of the problems in the D. A. Clark et al. (1998) study and yield clearer,
more interpretable results.
Pathophysiology of Diabetes
Diabetes mellitus is a chronic endocrinological disorder which arises as a result of
problems in the body’s production and/or uptake of the hormone insulin. Insulin is
produced by the pancreas, in the pancreatic beta cells, and allows cells to utilize glucose
in the bloodstream so that it can be transformed into essential nutrients and energy.
Without the presence or proper utilization of insulin, blood glucose levels rise, which can
cause damage in small blood vessels throughout the body. Diabetes mellitus is diagnosed
by the presence of abnormally high blood glucose levels, which is also known as
hyperglycemia, typically through a fasting blood or oral glucose test. Once an individual
has been diagnosed with diabetes, blood glucose levels are generally measured using
12
hemoglobin A1c (HbA1c) levels. HbA1c is accepted as the best measure of recent
glycemic control (i.e., past 120 days) and is generally measured at least 2 times per year
for diabetes patients. The American Diabetes Association (ADA) recommends HbA1c
levels of less than 7% for most diabetes patients. An HbA1c level of 5% is typical for
individuals without diabetes (ADA, 2007).
There are three major types of diabetes including type 1, type 2 and gestational
diabetes. Type 1 diabetes mellitus (T1DM) appears to have a genetic link that results in
an autoimmune-mediated elimination of the pancreatic beta cells. As a result, the
pancreas produces little to no insulin which results in blood glucose accumulation,
resulting in hyperglycemia and possible subsequent damage to small blood vessels. This
inability to utilize blood glucose leads to the breakdown of fat for use as energy, which
results in a build up of ketone acids. The treatment for T1DM consists of delivery of
subcutaneous injections or an insulin pump, which deliver insulin, to reduce
hyperglycemia and prevent death in such patients. T1DM is typically diagnosed in
childhood or early adulthood (CDC, 2005).
Type 2 diabetes mellitus (T2DM), also known as adult onset diabetes, is the most
common form of diabetes and affects approximately 90 to 95% of diabetes patients
(CDC, 2005). In T2DM, the cells do not use insulin properly as a result of either
insufficient insulin production, insulin resistance or both. As this insulin deficiency
increases over time, the pancreas eventually loses its ability to produce insulin. Type 2
diabetes is associated with older age, obesity, inactivity, family history of diabetes,
personal history of gestational diabetes, impaired glucose metabolism and ethnicity.
Type 2 is more common among African Americans, Hispanics, Native Americans, Native

13
Hawaiians and some Asian Americans. In addition, T2DM is being diagnosed in
children and adolescents more frequently in recent years with the population-wide
increase in obesity and inactivity (CDC, 2005). Individuals with T2DM are treated in a
variety of ways, including changes in diet and exercise, oral medications for
hyperglycemia reduction (i.e. antihyperglycemic medication), insulin injections, weight
loss or a combination of these.
Gestational diabetes is a type of glucose intolerance that is diagnosed during
pregnancy, typically during the third trimester of pregnancy, as a result of insufficient
insulin produced by the pancreas. Like T2DM, gestational diabetes is more common
among African Americans, Hispanics, and Native Americans, as well as among obese
women and those with a family history of diabetes. Gestational diabetes requires
treatment during pregnancy in order to normalize blood glucose levels and to avoid
complications in the fetus. Typically, 90 to 95% of women with gestational diabetes
return to normal blood glucose levels after pregnancy, yet they are at a much higher risk
of developing T2DM in the future.
Proper management of diabetes is essential to the prevention of serious long-term
complications resulting from excessive blood glucose levels. The most common
complications include cardiovascular disease and stroke, high blood pressure, retinopathy
and blindness, renal disease and failure, nervous system damage, amputations and
periodontal disease. In all forms of diabetes, the treatment goal is to keep blood glucose
levels as close to normal as possible in order to prevent or reduce these complications.
Despite this goal, only a small percentage of diabetes patients are able to obtain normal
blood glucose levels. Approximately 50% of patients with diabetes are able to achieve

14
HbA1c levels of less than 8%, and very few are able to achieve levels of less than 7%
(Anderson et al., 2002). The Diabetes Control and Complications Trial (DCCT: DCCT
Research Group, 1993) found that intensive treatment aimed at controlling blood glucose
levels in T1DM can delay or prevent the onset of some of these complications. However,
the DCCT also found that, even with the intensive support of the intervention trial, only
5% of T1DM patients maintained normal blood glucose levels.
Short-term complications of poorly controlled blood glucose levels include
hyperglycemia (excessive blood glucose) and hypoglycemia (insufficient blood glucose).
Hypoglycemia occurs as a result of excessive insulin in the presence of insufficient blood
glucose, such as with a delay or decrease in food consumption, exercise or other physical
activity or alcohol consumption. Hypoglycemia occurs more often in individuals taking
either oral or injection insulin medication who have inconsistent diet and exercise
regimens, a long duration of diabetes or autonomic neuropathy. Severe hypoglycemia
typically occurs when more moderate signs of hypoglycemia are either ignored or not
recognized and can cause loss of consciousness (Gonder-Frederick et al., 2002; Gullege
& Beard, 1999). In hypoglycemia, patients commonly experience a rapid onset of
symptoms (i.e. within minutes), which are typically mild in severity and easily treated by
the patient. These symptoms include confusion, perspiration, dizziness, headache,
hunger, irritability, paleness, increased heart rate, shallow breathing, restlessness, blurred
vision and fatigue (Gullege & Beard, 1999).
As stated previously, hyperglycemia is the result of insulin deficiency leading to a
build up of blood glucose. Hyperglycemia typically has a slower onset than
hypoglycemia and occurs over the course of hours or days. Severe hyperglycemia may
15
result in diabetic ketoacidosis (DKA) in T1DM or in hyperosmolar hyperglycemic
nonketotic coma (HHNC), which more typically occurs in T2DM. DKA is a serious
condition that can lead to coma or death. It occurs as the result of the usage of fat for
metabolic energy, resulting in dangerously high levels of ketones in the blood. High
levels of ketones are toxic, leading to low blood pH, or acidosis. Signs of DKA can
include thirst, dry mouth, frequent urination, fatigue, dry or flushed skin, nausea,
vomiting, abdominal pain, shortness of breath, fruity breath odor, concentration
difficulties and confusion. In HHNC, the body attempts to rid itself of high levels of
blood glucose by passing the excess through urine. This leads to increases in urine
production which can lead to severe dehydration. The dehydration can result in seizures,
coma and death if untreated. HHNC can take days or weeks to develop. Signs of HHNC
include dry mouth, extreme thirst, warm and dry skin, fever, sleepiness, confusion, loss
of vision, hallucinations and weakness on one side of the body. Symptoms of lower
levels of hyperglycemia are similar and include appetite loss, nausea, vomiting, hot and
dry skin, frequent urination and weight loss (Gullege & Beard, 1999).
Although diabetes mellitus includes a number of disorders (T1DM, T2DM, and
gestational diabetes), the disorders share several common characteristics. Each disorder
is characterized by similar symptoms related to both hyperglycemia and hypoglycemia,
as described above. In addition, the disorders have the same management goals for
glycemic control (HbA1c <7.0%), regardless of the type of diabetes, and the most recent
standards of care prefer insulin therapy for T2DM as well as T1DM given insulin
therapy’s effectiveness (ADA, 2007). In addition, all diabetes disorders share the same
medical nutrition therapy recommendations (i.e., managing weight and obesity, limiting
16
fat intake and monitoring carbohydrate intake), exercise recommendations (although
these programs need to be tailored to each patient depending on level of glycemic
control) and guidelines for the prevention and management of diabetes-related
complications. Thus, although on a pathophysiological level there are differences
between these diabetes disorders, on a clinical level there are a considerable number of
similarities between disorders.
As stated previously, most patients have difficulties maintaining normal blood
glucose levels, and as a result, hypo- and/or hyperglycemia are experienced at some time
by most patients. Several of the above stated hypo- and hyperglycemia symptoms are
also specific and nonspecific symptoms of anxiety and depression. For example,
perspiration, dizziness, increased heart rate, shallow breathing, nausea, abdominal pain
and shortness of breath are all signs of panic disorder. In addition, hunger, irritability,
restlessness, concentration difficulties, appetite loss and weight loss are all nonspecific
symptoms of depression and anxiety. Fatigue and sleepiness are associated with low PA
and, therefore, are relatively specific symptoms of depression. This overlap in
symptomatology has led to uncertainty in identifying anxiety and depression among
diabetes patients, as well as among other medical patients who may also experience these
symptoms for multiple reasons. In addition, some research has found that the
relationship between these symptoms and objective measures of glucose control are
weak, creating even more confusion in understanding the nature of these symptoms
(Ciechanowski, Katon, Russo, & Hirsch, 2003; Lustman, 1988).
This overlap in symptomatology also has generated considerable research with
diabetes patients in order to understand the nature of such symptoms. Studying this

17
overlap within the context of a structural model, such as the integrative model, allows for
better understanding of these symptoms. However, no tests of the integrative model have
been conducted in patients with diabetes, and as such I will focus the following review of
research on correlational studies of specific symptoms of depression and panic disorder,
as well as nonspecific symptoms of depression and anxiety.
Studies of Specific and Nonspecific Symptoms of
Depression and Anxiety in Diabetes Samples
Researchers have used a number of methods in order to understand the role of
depression and anxiety symptoms in medical patients. The following review will focus
on two different study designs with diabetes patients that have been used to understand
these symptoms: (1) studies examining depressive disorders and/or anxiety disorders and
correlates and (2) studies assessing only self-reported symptoms of depression and/or
anxiety and their correlates. Although the following studies do not test the integrative
model specifically, an examination of the correlates of the components of the integrative
model allows for some understanding of the model, as well as for the generation of
hypotheses for the model within a diabetes sample.
Depressive Disorders, Anxiety Disorders and Correlates in
Diabetes Patients
Lustman, Freedland, Carney, Hong & Clouse, 1992. Lustman, Freedland,
Carney, Hong and Clouse (1992) examined the symptom profile of depression in diabetic
(T1DM & T2DM) and psychiatric out-patients. The authors diagnosed depression with
the Diagnostic Interview Schedule – Version Three (DIS; Robins, Helzer & Croughan,
1981) using DSM-III-R criteria and assessed depression symptomatology with the BDI in
18
both the diabetic and psychiatric groups. The authors identified 41 depressed diabetic
patients, 63 depressed psychiatric patients, and 58 non-depressed diabetics using the DIS.
The authors then compared (1) mean level differences of total scores on the BDI, (2)
prevalence differences of individual items of the BDI and (3) differences in reported
severity of the individual items. The authors found significant differences in mean level
scores on the BDI between the depressed diabetic patients (mean = 24.2) and non-
depressed diabetic patients (mean = 4.8), as well as between the depressed psychiatric
patients (mean = 22.5) and the non-depressed diabetic patients. There was no significant
difference on total score between the depressed diabetic and depressed psychiatric
patients. Thus, the BDI total score did not appear to be inflated due to the presence of
diabetes.
An examination of item prevalence differences between the three groups revealed
significant differences. First, the depressed diabetic patients had a greater prevalence of
the following items when compared with the psychiatric patients: decreased interest in
people, fatigue, health worries and decreased interest in sex. The presence of diabetes
may have influenced the prevalence of fatigue and health worries, yet differences in
interest in people and sex would not typically be expected due to the presence of diabetes.
The authors interpret this to suggest that an interaction may occur with the presence of
both depression and diabetes, causing some symptoms to be present at a greater rate than
would be expected by either disorder on its own. When compared with the non-
depressed diabetic patients, both the depressed diabetic patient group and depressed
psychiatric patient group had a greater prevalence of all items except weight loss.
Weight loss was reported at a low prevalence for both depressed and non-depressed
19
diabetic patients. The psychiatric patient group had a significantly greater prevalence of
weight loss when compared with the non-depressed diabetic patient group. Thus the
prevalence of each of the 21 items of the BDI, with the exception of weight loss, was
influenced more heavily by the presence of depression than by the presence of diabetes.
Similar patterns were found for the severity of the items. More specifically,
depressed patients, including both diabetic and psychiatric, endorsed items at a higher
severity than the non-depressed diabetic patients. In addition, depressed diabetic patients
reported higher severity on the following items when compared with depressed
psychiatric patients: decreased interest in people, decreased interest in sex and health
worries. The weight loss item was, again, similar between the two diabetes groups, with
no significant differences in severity reported between groups. There was a significant
difference between the psychiatric patient group and the non-depressed diabetic patient
group on the weight loss item, with psychiatric patients reporting a higher severity of
weight loss when compared with non-depressed diabetic patients.
The results of this study suggest several conclusions. First, the authors found a
general similarity in the symptom profile of depressed individuals regardless of diabetes
illness status. This would suggest that most symptoms measured by the BDI that overlap
with symptoms of hypo- or hyperglycemia (e.g. appetite loss and irritability) will
demonstrate similar patterns of correlations in a diabetes sample. Results of this study
also suggest that weight loss may be a poorer indicator of depression in diabetes patients.
This may be due, in part, to the diabetes self-care regimen that often targets diet and
weight loss in order to prevent diabetes complications, particularly among T2DM
patients. In addition, fatigue may be reported at higher than expected levels among
20
depressed diabetes patients, and does not appear to be as common among non-depressed
diabetes patients.
Ludman et al., 2004. Ludman and colleagues (2004) examined the relationship
between a diagnosis of major depression and diabetes symptom reporting in 4,186
patients with diabetes with an average age of 63.5 years. Investigators used the Patient
Health Questionnaire (PHQ; Spitzer, Kroenke, & Williams, 2001), a self-report measure
of depressive symptoms, to obtain a dichotomous indicator of major depressive disorder
(based on DSM-IV criteria) as well as a continuous severity score of depression for each
participant. In addition, diabetes patients completed the Self-Completion Patient
Outcome instrument (SCPO; Whitty, Steen, & Eccles, 1997), a 9-item measure of
diabetes symptoms including the following: (1) cold hands and feet, (2) numb hands and
feet, (3) polyuria, (4) excessive hunger, (5) abnormal thirst, (6) shakiness, (7) blurred
vision, (8) feeling faint and (9) feeling sleepy. On this instrument, participants indicated
the frequency of experiencing each of the symptoms using a Likert-scale from “never” to
“everyday.” Investigators added one new item to the inventory, namely, pain in hands
and feet. They also measured the severity of diabetes using medical records from the past
1.5 year period based on the following considerations: (1) diabetes complications, (2)
treatment intensity and (3) glycemic control as measured with HbA1c.
The investigators performed two sets of analyses. First, they performed
ANCOVAs to determine if the number of reported diabetes symptoms was related to the
presence of major depression or to the number of reported depression symptoms.
Second, they ran logistic regression analyses to determine the relative strengths of
relationships between individual diabetes symptoms and (1) the presence of major
21
depression, (2) HbA1c levels greater than 8% and (3) two or more diabetes
complications. Results of ANCOVAs suggested that individuals with major depression
or with higher numbers of depression symptoms reported significantly greater numbers of
diabetes symptoms, even after controlling for objective measures of diabetes severity,
medical comorbidity and demographic characteristics such as age.
Results of logistic regression analyses found that each of the 9 diabetes symptoms
of the SCPO were significantly related to the presence of major depression, after
adjusting for number of complications and HbA1c levels. Patients with major depression
were 2 to 5 times more likely to report such symptoms. In addition, 4 of the 9 diabetes
symptoms were significantly related to HbA1c levels of 8% or greater, including
polyuria, abnormal thirst, blurred vision and daytime sleepiness, even when controlling
for depression and number of diabetes complications. Patients with HbA1c levels of 8%
or greater were 1.17 to 1.34 times as likely to report these four symptoms. Lastly,
logistic regression analyses found that all but 1 of the 9 diabetes symptoms (excessive
hunger was the exception) were significantly related to the presence of 2 or more diabetes
complications, after controlling for depression and HbA1c levels, and that patients with
complications were 1.27 to 2 times as likely to report these 8 diabetes symptoms.
Several conclusions can be drawn from these findings. First, the presence of
major depression appears to be a better predictor of reporting diabetes symptoms than are
objective measures of diabetes, including HbA1c levels and number of diabetes
complications. In addition, some diabetes symptoms appear to be unrelated to objective
measures of diabetes severity (HbA1c), although they are significantly related to the
presence of major depression, including coldness, pain and numbness in the hands and
22
feet, excessive hunger, shakiness and feeling faint. Second, excessive hunger is not
significantly related to either HbA1c levels or number of diabetes symptoms, suggesting
that this symptom is more related to mood than to diabetes. Finally, daytime sleepiness
was found to be significantly related to both major depression and to objective measures
of diabetes, although the odds of reporting daytime sleepiness were approximately 5
times greater for those with major depression, compared with 1.17 and 1.26 times greater
risk for patients with HbA1c levels of 8% or greater or with 2 or more complications,
respectively. Thus, fatigue was related to both disease and depression, yet appears to be
more strongly related to depression. Although these results are consistent to some extent
with those of Lustman et al., 1992, one major short-coming of the study is the lack of a
control group to aid in the interpretation of the findings.
Friedman, Vila, Timsit, Boitard, & Mouren-Simeoni, 1998. Friedman and
colleagues (1998) examined relationships between anxiety and depressive disorders and
disease severity indicators (e.g. compliance, glycemic control and diabetes
complications) in a sample of 69 T1DM patients and a control group of 99 non-diabetic
outpatients and nursing students. Anxiety and depressive disorders were diagnosed using
a French version of the Schedule for Affective Disorders and Schizophrenia (SADS;
Leboyer et al., 1991) based on DSM-III-R criteria. In addition, patients completed the
BDI and the 58-item Hopkins Symptom CheckList (SCL-58; Pichot, Lacassin, &
Dreyfuss, 1978; depression & anxiety scales), also in French. The SCL consists of
psychological symptoms that are rated on a 5-point Likert scale of distress, where 0 =
“not at all” and 4 = “extremely.” Mean HbA1c over the past 6 months, compliance with
regimen and frequency and type of diabetes complications were obtained from
23
participants’ medical records. Investigators sought to (1) examine the prevalence of
anxiety and depressive disorders among diabetes patients (2) compare anxiety and
depressive symptoms between groups and (3) examine the relationship of these disorders
and symptoms to disease severity indicators.
Investigators identified the following current (i.e. past 2-months) prevalence rates
of anxiety disorders: anxiety disorder NOS = 37%; simple phobia = 27%; social phobia
= 22%; agoraphobia = 10%; PTSD, panic disorder and agoraphobia with panic disorder =
2.4% each; no cases of GAD were found. Current prevalence of depressive disorders
among diabetes patients were: dysthymia = 7%; depressive disorder NOS and
cyclothymia = 2.4% each; no cases of major depression were identified. In comparing
mean differences on self-report measures of depression and anxiety, investigators found
that participants in the control group (in particular, the medical outpatients) had higher
BDI and SCL-58 scores than diabetes patients. Investigators did not find a significant
correlation between either BDI or SCL-58 scores and HbA1c levels. However, findings
did suggest significant differences in HbA1c values for diabetes patients with versus
without current social phobia and current depression (i.e. non-specified depression,
dysthymic type and dysthmia). Those individuals with current social phobia or
depression had higher HbA1c levels, which may indicate poorer compliance with the
diabetes regimen among these patients. In regression analyses, neither BDI or SCL-58
scores, or anxiety or depressive disorder diagnoses, predicted diabetes complications.
Instead, HbA1c levels and duration of diabetes were the only significant predictors of
diabetes complications.
24
Several prevalence rates of anxiety and depressive disorders were considerably
higher than those found in the Epidemiologic Catchment Area study (ECA; Reiger et al.,
1984) and NCS, including simple and social phobia, agoraphobia and dysthymia. These
findings are similar to those of other studies of diabetes (e.g. Anderson et al., 2001;
Grigsby et al., 2002), which often find higher than expected rates of mood and anxiety
disorders among diabetes patients. In contrast, however, prevalence rates of GAD and
major depression were lower in the diabetes sample than typically expected in both
population-based studies and diabetes-specific studies. The authors propose that this
finding may be due to their particular diabetes sample, which they characterized as
physically healthier than those in other studies. However, these results are limited by the
lack of diagnostic data from the control group, which makes interpreting the diabetes
prevalence rates from this particular sample difficult. Results of correlation and
regression analyses suggest that the presence of diabetes is not associated with self-
reported depression and anxiety symptoms, as the control group endorsed higher levels of
depression and anxiety on questionnaires. However, the medical outpatients of the
comparison group were poorly defined and may had higher BDI scores due to
overlapping symptoms from their medical condition, which makes interpreting this
finding difficult. In addition, the study included a relatively small sample of diabetes
patients (N = 69), which limited their ability to detect significant differences and effects
in their analyses.
Anderson et al., 2002. Anderson and colleagues (2002) performed a meta-
analytic review of the literature to determine the relationship between anxiety and
glycemic control in T1DM and T2DM. Investigators located all studies published from
25
1975 to 2002 that examined either self-reported anxiety symptoms and/or anxiety
disorders and glycemic control in diabetes patients. Their review identified 11 studies
meeting criteria for inclusion in the meta-analysis, for a total of 1413 participants. Self-
report inventories included the SCL, 90-item version (SCL-90; Derogatis, Lipman, &
Covis, 1973), the Zung Self-Rating Anxiety Inventory (ZSRA; Zung, 1971), the HADS,
the State Trait Anxiety Inventory (STAI; Spielberger, Gorsuch, & Lorshene, 1970) and
the Taylor Manifest Anxiety Scale (TMAS; Taylor, 1953). Investigators converted study
findings to a common metric, examining both the overall association between anxiety and
HbA1c, as well as associations broken down by various categories, such as inclusion of
diagnostic interviews.
The meta-analysis yielded a non-significant effect size across all 11 studies,
suggesting that anxiety was not reliably associated with HbA1c levels. Among those
studies using diagnostic interviews to assess anxiety disorders, a significant effect size
was found for the association between anxiety disorders and HbA1c. Analysis of studies
of self-report measures of anxiety did not yield a significant effect size for the association
between anxiety and HbA1c levels. No other analyses of potential moderators (e.g. type
of diabetes, age, gender, severity of diabetes) yielded significant effect sizes.
The significant effect size for the association between anxiety disorders and
HbA1C can be interpreted in two primary ways. First, patients with anxiety disorders
may have greater difficulty adhering to their self-care regimen and managing their
diabetes, thus leading to higher blood glucose levels. Or, conversely, the higher levels of
blood glucose may contribute to the patient’s anxiety symptoms, given the overlap in
autonomic arousal and nonspecific anxiety/depression symptoms, thereby making these

26
patients more likely to receive a diagnosis of anxiety disorders. The investigators also
hypothesize that anxiety could contribute to hyperglycemia directly, through activation of
the sympathetic nervous system and hypothalamic-pituitary adrenal axis, although this
link has been more thoroughly established in animal models than in human models of
diabetes. In fact, more evidence has accumulated suggesting that anxiety and acute stress
do not reliably affect glucose in humans (Lustman, 1988). The finding that self-report
assessment of anxiety symptoms is not associated with hyperglycemia suggests that
certain anxiety symptoms typically associated with hyperglycemia are more strongly
related to anxiety than to blood glucose levels. In addition, these findings are consistent
with those of Friedman et al., 1998, suggesting a stronger relationship between diagnoses
of anxiety disorders and HbA1c levels than between self-reported anxiety symptoms and
HbA1c levels.
Summary
Results of studies using diagnostic measures of depression and anxiety suggest
some similarities and differences between diabetes samples and various control groups.
First, most symptoms of depression that overlap with symptoms of diabetes appear to
perform similarly for depressed individuals with diabetes compared with depressed non-
diabetics, including low mood/NA, irritability and concentration problems. Weight loss,
however, has been found to be less related to depression in one study (Lustman et al.,
1992). In addition, fatigue was found to be reported at higher levels among depressed
patients with diabetes when compared with depressed non-diabetic patients (Lustman et
al., 1992). Also, one review found a significant association between anxiety disorder
diagnoses (but not self-reported symptoms) and HbA1c levels, which suggests a possible
27
different relationship between anxiety and diabetes, depending upon the anxiety severity.
Anxiety captured by self-report measures did not appear to be a significantly affected by
the level of control of diabetes. Thus, based on these diagnostic studies, it does not
appear that the presence of diabetes affects the presentation of depression, although some
individual symptoms (i.e. weight loss and fatigue) may be influenced by the disease. In
addition, anxiety disorders may be influenced by the presence of diabetes or, conversely,
may influence the disease process.
Self-Report Measures of Depression and Anxiety and Their
Correlates
Ciechanowski, Katon, Russo and Hirsch, 2003. Ciechanowski and colleagues
(2003) examined the relationship between depressive symptoms, diabetes symptoms,
adherence to the diabetes regimen and HbA1c levels in 276 T1DM and 199 T2DM
patients. The authors were interested in examining the impact of depression on self-care
and health outcomes among individuals with diabetes and predicted that the presence of
depressive symptoms would be significantly associated with poorer diabetes outcomes,
particularly among T1DM patients. Participants completed a 20-item version of the SCL
(SCL-20) assessing depression symptoms in addition to scales assessing (1) number of
diabetes-related symptoms (e.g. fatigue, hunger), (2) number of diabetes-related
complications, (3) number of comorbid medical conditions (e.g. heart disease), (4)
physical functioning and (5) adherence. Data were analyzed using multiple regression
with demographic characteristics, diabetes-complications and number of comorbid
medical conditions as control variables; depression symptoms as predictors; and HbA1c
levels, diabetes symptoms, adherence and physical functioning as dependent variables.
28
In addition, analyses were conducted using the interaction between diabetes type and
depression symptoms (dichotomized based on clinical cut offs on the SCL-20).
In predicting HbA1c levels, there was a significant interaction between
depression symptoms and diabetes type: T1DM patients with high SCL-20 scores had
significantly higher HbA1c levels. Depression symptoms on their own were not a
significant predictor of HbA1c levels. However, depression symptoms were a significant
predictor of diabetes symptoms, even after controlling for number of diabetes-related
complications; thus, the results suggest that individuals with higher depression scores
report greater numbers of diabetes symptoms. Depression was also a significant
predictor of adherence, with higher depression associated with poorer adherence. Finally,
increased depression was also predictive of poorer physical functioning, even after
controlling for medical comorbidity and diabetes-related complications.
The primary conclusion to be drawn from this study is that depression appears to
be related to diabetes symptoms, even when controlling for diabetes severity indicators
(e.g. number of complications). This finding was reflected previously in Ludman et al.
(2004), using HbA1c levels as an indicator of diabetes severity, who found that
depression was a greater predictor of some diabetes symptoms than HbA1c levels. Thus,
diabetes symptoms may be more related to the presence of depression than to objective
measures of diabetes. However, as in Ludman (2004), no control group was included by
which to compare findings. In addition, these investigators did not include measures of
individual symptoms of depression, which makes it difficult to examine relationships
between symptoms and to identify overlapping item content across depression and
diabetes symptom measures.

29
Lustman, Clouse, & Carney (1988). Lustman, Clouse and Carney (1988)
investigated the relationship between depressive and diabetes symptoms in a sample of
114 T1DM and T2DM patients. Investigators measured hyperglycemic symptoms
including thirst, frequent urination and losing weight, as well as hypoglycemic symptoms
including hunger, sweating, trembling, fainting/dizziness, confused thoughts and loss of
consciousness. In addition, they assessed fatigue and fever/malaise, which they classified
as nonspecific symptoms of poor control. Each diabetes symptom was assessed with a
single item in which participants indicated the extent to which they were bothered by
these symptoms over the past week. Depression was assessed using the BDI and
investigators also examined HbA1c levels. Correlational analyses were run between
diabetes symptoms and BDI scores, as well as between diabetes symptoms and HbA1c
scores.
Results indicated that all of the diabetes symptoms except loss of weight and loss
of consciousness were moderately and significantly correlated with total BDI score and
only loss of consciousness was significantly correlated with the objective measure of
metabolic control – HbA1c. As seen previously, many diabetes symptoms appear to be
more strongly related to depression than to objective measures of diabetes. However, this
finding may be an artifact of the means of assessing these symptoms. Using the words
“bothered by” may tap negative affect and distress more so than a question assessing
frequency of presence of the symptoms, as is more commonly used. In addition, several
BDI items overlap with the measured diabetes symptoms, making conclusions somewhat
difficult to interpret, particularly in the absence of a control group.
30
Lustman, 1988. In a separate report on Lustman et al.’s (1988) sample of 114
T1DM and T2DM patients, Lustman (1988) examined the associations between self-
reported anxiety (as measured with the SCL-90 anxiety scale), HbA1c levels and 11
diabetes symptoms. The 11 assessed diabetes symptoms again included 3 hyperglycemic
symptoms (thirst, frequent urination and weight loss), 6 hypoglycemic symptoms
(hunger, sweating, trembling, faintness or dizziness, confused thoughts and loss of
consciousness) and 2 nonspecific diabetes symptoms (fatigue and fever/malaise). The
study’s objective was to examine the association between anxiety and diabetes symptom
reporting as well as between HbA1c levels and diabetes symptom reporting.
Results of these analyses were similar to those seen earlier: most diabetes
symptoms, with the exception of weight loss and loss of consciousness, were more
strongly related to anxiety than to HbA1c levels. Loss of consciousness correlated
similarly with anxiety (r = .27) and HbA1c levels (.26). Weight loss was not related to
anxiety or to HbA1c levels. Again, one major limitation of the study is the means of
measuring diabetes symptoms. Patients were asked to indicate how much they were
“bothered by” the diabetes symptoms, which likely relates more to general
distress/negative affect than a question assessing frequency of the symptoms. In addition,
the overlap in content on both the anxiety questionnaire and diabetes symptom
questionnaire may also have contributed to the higher correlations between anxiety and
diabetes symptoms. In general, these results are congruent with those stated previously
which have not found that the presence of diabetes affects the associations between
individual depression and anxiety symptoms. However, conclusions are somewhat
limited from this particular study by methodological issues.
31
Hermanns, Kubiak, Kulzer & Haak, 2003. Hermann and colleagues examined the
effects of experimentally-induced hypoglycemia on mood in a sample of 22 T1DM
patients. Participants were randomly assigned to either the experimental or control
group, with 11 participants in each, and all were blind to group status. All participants
received two antecubital venous tubes, one for measuring current blood glucose levels
and one for controlling blood glucose levels. Hypoglycemia was induced in the
experimental group and euglycemia was maintained throughout the study in the control
group. Participants were administered the UWIST Mood Adjective Checklist, which
contains a list of adjectives that assess energy (i.e., high or low PA), tension (i.e., high or
low NA), and hedonic tone (i.e., pleasure versus displeasure, based on J. A. Russell’s
model of affect – see Matthews, Jones and Chamberlain, 1990, for more detail), as well
as a series of adjectives assessing anger, at three time points: before inducing
hypoglycemia, during hypoglycemia and after hypoglycemia. Mood measurements were
taken at the same times in the control group. Investigators ran ANOVAs to compare for
group differences in the effect of hypoglycemia on affect.
Results indicated an effect for phase (pre-, during or post-hypoglycemia) as well
as group (experimental vs. control). The experimental group experienced greater NA
(e.g. “tense,” “anxious,” “stressed”) overall compared with the control group. In
addition, experimental participants reported higher anger (e.g. “angry,” “annoyed,”
“irritated”) and NA and lower PA (e.g. “idle,” “sluggish,” “dull”) during the
hypoglycemic phase than during the pre- and post-hypoglycemic phases. There was no
significant effect for phase or group on hedonic tone (e.g. “pleased,” “depressed”).
Although the similarity in subjective experience between experimentally induced
32
hypoglycemia and in vivo hypoglycemia is unclear, results suggest that hypoglycemia
does induce a dysphoric mood, including higher NA (i.e. tension), anger and lower PA
(i.e. sluggishness and fatigue). These experimental results suggest that some symptoms
of anxiety and depression are affected by the complications associated with diabetes,
although the clinical significance of this effect is unclear. In addition, although
hypoglycemia may affect mood, it is unclear if it would affect the structure of mood and
relationships among symptom dimensions.
Summary and Conclusions
With the exception of Hermanns et al., (2003), the studies of self-report
symptoms of depression and anxiety generally have found that most overlapping
symptoms of depression and diabetes appear more strongly related to mood than to
objective measures of disease. One symptom appears to be less related to mood,
however, namely weight loss. The data suggest that weight loss is unrelated to either
depression/anxiety or diabetes. Hermanns et al. (2003), however, obtained contrary
results in their experimental study of hypoglycemia. This study suggests that
hypoglycemia may directly lead to feelings of tension, irritability and low energy/fatigue.
One possible explanation for this discrepancy is that the study’s findings may be less
relevant to the in vivo experience of diabetes symptoms, given the controlled, artificial
setting. In addition, although hypoglycemia may be directly related to these symptoms,
the associations among these symptoms may be similar to those obtained in physically
healthy samples.
Although the general consistency of results suggests a robust association between
most depression/anxiety and overlapping diabetes symptoms, several steps could be taken
33
to further clarify the nature of the relations between symptoms, improve discriminability
between disorders and assist in diagnostic questions. Here I will highlight a few key
areas for improvement. First, most studies, including self-report and diagnostic/interview
studies, use single items as measures of individual symptoms, which obviously decreases
the reliability and validity of measurement. Adding additional reliable markers (i.e. in
well-defined scales) of the symptoms of interest would greatly improve their
measurement. In addition, modeling these symptoms as latent factors will increase the
reliability of measurement.
Second, several studies measure depression/anxiety and diabetes symptoms by
using scales with overlapping items and content. This increases correlations between
measures and makes it difficult to interpret findings. Although many symptoms are
strongly correlated (e.g. irritability and sad mood) and belong on similar scales, referring
to scales as “depression” or “anxiety” scales versus “diabetes” scales when they have
very similar content is an artificial distinction that is not easily justified. Instead,
measuring unique content individually and then allowing for differences in relationships
among symptoms to emerge between different samples (i.e. diabetes patients vs.
nondiabetics) would improve our understanding of these overlapping symptoms.
Third, an array of analytic approaches have been used to determine whether a
symptom is related to depression or anxiety. For example, some studies use depression
as the dependent variable and diabetes symptoms as independent variables, while some
predict diabetes symptoms from depression, and others still examine correlations among
all symptoms. To date, there have been no structural analyses of symptoms with which
to examine more fundamental associations among specific and nonspecific symptoms of

34
depression and anxiety. In addition, most studies do not test a particular model of
depression or anxiety and the studies are generally atheoretical in approach. Most studies
fail to discuss larger issues within the study of depression and anxiety, such as the
nonspecificity of many symptoms or the problem of comorbidity of depression and
anxiety. Examining depression and anxiety symptoms among diabetes patients in the
context of structural analyses of the integrative model—using confirmatory factor
analysis in particular—will help to address these last three concerns. Again, structural
analyses will allow for robust modeling of the symptoms of interest, will eliminate the
difficulty of comparing across studies due to different assessment/analytic approaches,
and will allow for the test of the integrative model.
35
CURRENT STUDY
Goals
Understanding the structure of anxiety and depression symptoms is an important
step for the identification, discrimination and treatment of such disorders in diabetes
patients. This study provides the first examination of the integrative model within a
specific, homogeneous medical sample (i.e. diabetes patients). As stated previously,
testing this model in medical populations, such as diabetes patients, is important for two
primary reasons. First, this will allow for an examination of the replicability of the
integrative model’s proposed symptom structure. This will help determine if those
symptoms that have been shown to be nonspecific and strongly associated with general
distress and NA are nonspecific in a diabetes sample as well. In addition, it allows for a
test of relationships among relatively specific symptoms (i.e. AA, PA and fatigue) in a
diabetes sample, which in turn allows for improved discrimination among depression and
anxiety disorders.
The second (and related) reason for examining the structure of anxiety and
depression symptoms in a diabetes sample is that this approach will help address the
uncertainty surrounding overlapping symptoms. Often times when diabetes patients
present with symptoms such as fatigue, irritability, concentration problems, psychomotor
agitation, autonomic arousal, appetite gain or appetite loss, these symptoms are
considered reflections of diabetes rather than of depression or anxiety. Some researchers
have suggested that this leads to the under-diagnosis of such disorders (Lustman et al.,
1997; D.A. Clark et al., 1998). Failing to identify and treat such disorders, as stated
previously, can have severe negative consequences, such as poorer self-care behaviors,
36
increased diabetes-related complications and overall poorer health outcomes (Gonder-
Frederick et al., 2002). Thus, this study’s ultimate aim is to improve the identification
and discrimination of such disorders, which will improve both mental and physical health
outcomes among diabetes patients. Even though multiple studies, as described above,
have studied the relationship of depression and anxiety symptoms in the presence of
diabetes, none have done so within the context of a theoretical model, such as the
integrative model; moreover, the proposed study incorporates several improved
methodological features, which are discussed below. By examining depression and
anxiety within the context of a structural model and with the inclusion of several
improved design considerations, this study will uniquely contribute to our understanding
of such symptoms among diabetes patients.
The current study tests the structure of specific and nonspecific symptoms of
depression and anxiety, based on the integrative model, in a diabetes and community
adult sample. More specifically, the following study examines six nonspecific symptoms
including NA (i.e. dysphoria), irritability, concentration difficulties, appetite loss,
appetite gain and psychomotor agitation. In addition, three relatively specific symptom
dimensions are examined, including fatigue, PA and AA. With the exception of PA and
dysphoria, these symptoms have been selected based on their presence in both diabetes
(e.g. hypo- or hyperglycemia) and depression and/or anxiety. Dysphoria and PA have
been included in order to more fully model the common and unique components of the
integrative model and to maximize the possibility for this model to emerge. Symptom
dimensions are assessed with a minimum of two markers per construct (see Table 1). For
those measures that contain multiple symptom dimensions, content is divided within
37
measures in order to reduce overlap between constructs (see “Measures,” below). Given
these nine hypothesized symptom dimensions, the study examines (1) whether or not a
nine-factor structure emerges in an community adult and diabetes sample given selected
measures, (2) whether the same underlying factors emerge in both samples and (3)
whether or not the same factor correlations emerge in a diabetes group compared with
community adults. These tests will be conducted using multiple group confirmatory
factor analyses (see “Analyses” for more detail). In addition, the study tests for mean
level differences between samples.
Although no single study can address every possible methodological concern, the
present study represents a significant improvement upon existing research of depression
and anxiety symptoms in diabetes patients in several ways. First, the use of reliable
measures of individual symptoms, rather than single items, is a more psychometrically
sound measurement method. The use of well-validated measures of symptom dimensions
improves the validity and reliability of the measurement model and allows for greater
assurance in findings.
Second, symptoms are examined individually, rather than as overlapping content
within similar measures, in order to better understand the nature of—and relations
between—such symptoms. Overlapping content has been removed from broad measures
of “depression” and “anxiety,” which will reduce the chance of artificially inflated
correlations among different symptom dimensions. In addition, multiple markers of each
symptom dimension of interest are included in the study, which allows for an increased
probability that unique factors emerge in analyses.
38
Third, the present study uses a structural approach to study symptom relationships
by using the integrative model as a basis of understanding. Symptom markers (i.e.
measures) will be subjected to factor analyses in order to identify latent factors that
capture the symptom dimensions (see “Analyses” for more detail). This will further
improve the robustness of measurement. In addition, using multiple group confirmatory
factor analyses allows for testing of group differences on multiple levels, rather than just
comparing correlational differences between groups.
Fourth, the use of a comparison group significantly aids in the interpretation of
findings. The use of a community adult sample by which to compare the diabetes sample
allows this study to (1) relate to previous studies of the integrative model in non-medical
samples (e.g. community adults) to test for consistency of results and (2) attribute any
findings unique to the diabetes sample to the presence of the medical condition rather
than to this study’s methodology.
Fifth, the present study measures depression and anxiety symptoms within the
specific context of the integrative model. One key feature of this model is its recognition
that the concepts of “depression” and “anxiety” actually are less distinct than previous
studies might suggest.
Finally, the present study focuses on those symptoms that are of specific interest
in a diabetes sample. Rather than examining “somatic” symptoms broadly among
diabetes patients, this study targets specific symptoms which are also recognized
manifestations of hypo- or hyperglycemia. This design is ideal for increasing the
probability of differences to emerge between diabetes samples and a comparison group.
“Somatic” symptoms more broadly include sleep disturbance and psychomotor
39
retardation, which are not typical symptoms of diabetes and would not conceptually be
expected to behave differently in diabetes patients. These design characteristics allow for
a significant contribution to our understanding of the nature of depression and anxiety
symptoms among diabetes patients.
Hypotheses
Diabetes-related model. This study measures 6 nonspecific symptom dimensions
including: (1) NA/dysphoria, (2) irritability, (3) concentration problems, (4) appetite loss,
(5) appetite gain and (6) psychomotor agitation/restlessness. In addition, the study
measures two specific depression symptom dimensions (PA and fatigue) as well as one
specific anxiety symptom (AA). In making hypotheses regarding the nature of
relationships among diabetes patients, there are several competing explanatory models
that one can use as a framework for predictions. One model, which will be referred to as
the diabetes-related model, predicts that those symptoms of diabetes that overlap with
symptoms of depression and anxiety are more related to the disease than to mood or
affect. This model would suggest significant differences in the relationships among
symptoms between the diabetes group and community adult group. More specifically,
the overlapping symptoms (e.g. irritability, concentration problems, etc.) would be
expected to be less related to NA and PA among the diabetes group. As stated
previously, this model has been suggested to prevail in many medical settings.
Affect-related model. A second model, which will be referred to as the affect-
related model, hypothesizes that the specific and nonspecific symptom dimensions will
relate similarly within both groups, regardless of differences in disease status. This
model, based on the integrative hierarchical model, has considerable support from
40
general population studies (e.g. Mineka et al., 1998) and appears likely to be at least
partially supported among diabetes patients as well, given the above review as well as the
general robustness of structural models across other types of samples (e.g. Watson, 2005;
O’Connor, 2002). Nonspecific symptom dimensions are expected to correlate
significantly with one another, reflective of the influence of a more general negative
affect factor, and specific symptom dimensions (i.e. PA, fatigue and AA) are expected to
demonstrate some level of specificity in their correlations based on this model.
Recent research has demonstrated notable differences in the relative strength of
relationships among some specific and nonspecific symptoms of depression and anxiety
(Watson et al., 2007). Consistent with the model proposed by Mineka et al. (1998), this
research has shown that certain nonspecific symptoms are more highly intercorrelated
than others; dysphoria, irritability, concentration problems and psychomotor agitation
show particularly strong interrelations. Other nonspecific symptoms—such as appetite
loss and appetite gain—have been shown to correlate in the moderate to low range with
other symptoms. In addition, positive affect, although it relates significantly with other
symptoms of depression and anxiety, is more moderately correlated with other symptoms
of depression/anxiety.
For example, Watson et al. (2007), in the development of the Inventory of
Depression and Anxiety Symptoms (IDAS), found correlations between scales measuring
dysphoric mood, irritability, concentration difficulties and psychomotor
agitation/retardation ranging from .65 to .72. In contrast, scales tapping appetite changes
had correlations ranging from .26 to .43 with scales measuring dysphoric mood and
irritability. Finally, Watson et al. (2007) found that correlations between the IDAS Well-
41
Being and Dysphoria scales ranged from -.47 to -.50. Thus, although all of these
symptom dimensions are significantly correlated with one another, the magnitude of
these correlations has been found to differ widely and systematically in previous
research.
Based on this model of affect, one would hypothesize similar patterns of
correlations to emerge in both samples. More specifically, dysphoria, irritability,
concentration problems and psychomotor agitation are expected to correlate highly with
one another, whereas appetite loss, appetite gain and positive affect are expected to
correlate significantly—yet more moderately—with the other symptom dimensions. In
addition, based on the relative specificity of some symptoms, fatigue and PA are
expected to demonstrate some specificity to depression and to correlate more strongly
with dysphoria than with AA. Furthermore, as was found previously (Watson et al.,
2007), fatigue is expected to correlate more strongly with nonspecific symptoms such as
dysphoria than is PA. For the purposes of this study, the hypotheses will focus on some
of these expected correlational differences among specific and nonspecific symptoms,
rather than testing every possible pair of correlations (see “Hypotheses” for more detail).
Interaction model. Finally, results of some studies (e.g. Lustman et al., 1992;
D.A. Clark et al., 1998) suggest what will be referred to as an interaction model. This
model predicts that the presence of diabetes will lead to even higher correlations among
symptom dimensions in the diabetes group when compared with the community adult
participants, with a larger general distress factor emerging as seen in D.A. Clark et al.
(1998). Given the general support found thus far, most of the following hypotheses are
based on the affect-related and interaction models of symptom dimensions.
42
Formal hypotheses. Since much research has found higher prevalence rates of
depression and anxiety disorders among diabetes patients, I predict significant mean level
differences between the diabetes sample and community adult sample on measures of the
symptom dimensions.
Hypothesis 1: Diabetes patients will score significantly higher on measures of
dysphoria, irritability, concentration problems, appetite loss, appetite gain, psychomotor
agitation, fatigue and AA than the community adult sample.
Hypothesis 2: I predict that the diabetes sample will score significantly lower on
measures of PA than the community adult sample.
Given the plethora of evidence suggesting that structural models are generally
robust across samples (e.g. O’Connor, 2002), and given that at least two markers of each
factor will be included in analyses to maximize the probability of its emergence, the
study also predicts the following within-sample hypotheses:
Hypothesis 3a: In following with the affect-related model of symptoms, I predict
that the a priori measurement model of the nine latent factors (dysphoria, irritability,
concentration problems, appetite loss, appetite gain, psychomotor agitation, PA, fatigue
and AA) will fit the data for the selected measures (see Table 1 for more detail) in the
community adult sample.
Hypothesis 3b: I predict that the a priori measurement model of the nine latent
factors (dysphoria, irritability, concentration problems, appetite loss, appetite gain,
psychomotor agitation, PA, fatigue and AA) will fit the data for the selected measures
(see Table 1) in the diabetes sample.
43
Hypothesis 4a: Given previous support for the integrative model and in following
with the affect-related model of symptoms, I predict that among the community adult
sample, all of the nonspecific and specific symptoms of depression and anxiety—
including dysphoria, irritability, concentration problems, appetite loss, appetite gain,
psychomotor agitation, fatigue, PA and AA—will correlate significantly with one
another. However, given the observed variability in the magnitude of correlations among
these symptom dimensions, as discussed above, I predict some substantial differences in
the strength of correlations in this sample. Rather than hypothesize specific differences
for each possible combination of pairs of correlations, I will limit the hypotheses to the
following: dysphoria will correlate significantly more highly with irritability than with
appetite loss, appetite gain and PA.
Hypothesis 4b: In addition, given that (1) the studies reviewed above have found
symptoms of depression (such as appetite loss, appetite gain and NA) to be more related
to depression/anxiety than to diabetes and, (2) considerable support exists for the
integrative model, I predict that among the diabetes sample, all of the nonspecific and
specific symptoms of depression and anxiety including dysphoria, irritability,
concentration problems, appetite loss, appetite gain, psychomotor agitation, fatigue, PA
and AA will be significantly correlated with one another. Again, given the predicted
variability in the size of correlations among these symptoms, as previously discussed, I
predict some significant differences in the strength of correlations in this sample. Rather
than hypothesize specific differences for each possible combination of pairs of
correlations, I will limit the hypotheses to the following in the diabetes sample as well:
44
dysphoria will correlate significantly more strongly with irritability than with appetite
loss, appetite gain and PA, although all will correlate significantly with one another.
In addition, I predict the following between sample differences.
Hypothesis 5a: Before specific differences can be tested, I predict that an
adequate fitting common 9-factor model will emerge for both groups. Once this common
model is determined for both samples, Hypothesis 5b can be tested.
Hypothesis 5b: Two findings in support of the interaction model of symptoms
lead me to predict differences in the strength of correlations between samples. First,
depression and anxiety symptoms are more prevalent among diabetes patients compared
with other samples (e.g. Lustman et al., 1992), which leads to increased variance in
diabetes patient scores. Second, correlations among depression and anxiety scales in D.
A. Clark et al. (1998) were generally higher among medical patients than among
psychiatric patients (e.g., correlations between PA and dysphoria and between BDI
somatic items and BDI cognitive items). Therefore, I expect correlations among factors
in the diabetes sample to be greater than those seen in the community adult sample.
Methods
Participants
Diabetes Participants. 225 adults with Type 1 or Type 2 diabetes were recruited
from January to May 2007 during clinic visits and through announcements and flyers.
Given the similarities between T1DM and T2DM as described above, it was decided to
include both disorders in the study. Patients were approached by a researcher during
their visit to the University of Iowa Hospitals and Clinics Endocrinology Clinic or Family
Practice Clinic or during their visit to the Iowa City VA Medical Center for a diabetes

45
appointment or educational group meeting. The study was briefly described to patients
identified by their nurse or physician as having Type 1 or Type 2 diabetes and over age
18. Those patients who were interested in participating were consented in person and
sent home with a questionnaire to complete at their convenience and return by mail. 313
patients expressed interest in participating during a clinic visit and 171 of these returned
packets (55% return rate). Approximately 53% of patients recruited during clinic visits
were recruited from the Endocrinology Clinic, approximately 27% were recruited from
the Family Practice Clinic and approximately 20% were recruited from the VA Medical
Center. Thirty three diabetes patients were recruited by mailing 250 patients seen in the
past 12 months at the Family Practice Clinic who had been diagnosed with Type 1 or
Type 2 diabetes (13% return rate). In addition, 21 patients were recruited through flyers
and an announcement in the University of Iowa Hospitals and Clinics daily news sheet.
Packets were received on average 10 days after they were given to patients. Participants
received $20 for their participation. Two participants indicated in their returned
questionnaire that they did not have diabetes, and thus were eliminated from the diabetes
sample and transferred to the community sample, and one participant was eliminated for
a large amount of incomplete data in the returned questionnaire. In addition, four
community participants indicated that they had diabetes (see below), and thus were
transferred to the diabetes sample, for a final n of 226. Diabetes patients included 113
males and 113 females (50% each), with an average age of 52.7 years. Most patients
were Caucasian (92.5%), and educational level ranged from 7.5% with less than a high
school diploma, to 3.5% with a doctorate degree. The majority of participants had either
a high school diploma (20.4%), some college (31.4%) or a bachelor’s degree (15%). The
46
majority of patients were married (54%), and total annual household income was on
average between $40,000 to $49,999. See Table 3 for complete demographic
information.
Community Adult Participants. 382 community adults were recruited from
February to May of 2007 through announcements made in the University of Iowa
Hospitals and Clinics daily news sheet, email announcements to University of Iowa
employees, and a statewide newspaper ad printed in Friday, Saturday and Sunday
editions of the Des Moines Register. Adults were eligible to participate if they were 35
or older and did not have diabetes or other major health conditions such as recent cancer
treatment or other hospitalizations. 546 community adults responded to the
announcements, ads and emails and 382 completed the study (70% return rate). Four of
these participants indicated that they had diabetes in their return questionnaires and thus
were transferred to the diabetes sample and eliminated from the community sample. In
addition, as stated previously, two participants from the diabetes sample were transferred
to the community sample, for a final n of 380.
Community adults included 78 males (20.5%) and 301 females (79.2%), with the
gender unknown for one participant, and an average age of 51.1 years. Most community
adults were Caucasian (97.4%), and educational level ranged from .8% with less than a
high school diploma, to 5% with a doctorate degree. The majority of participants had
either some college (19.4%), a bachelor’s degree (33.7%), or a master’s degree (20.5%).
The majority of patients were married (67%), and total annual household income was on
average between $60,000 to $69,999. See Table 3 for complete demographic
information. Missing data were replaced for those diabetes patients and community
47
adults who were missing less than 10% of data; data were replaced using regression
analysis computed with the SPSS linear trend at a point function.
Measures
Inventory of Depression and Anxiety Symptoms (IDAS; Watson et al., 2007) The
IDAS contains 10 specific symptom scales that were created from a series of factor
analyses: 8-item measures of Well-Being (e.g. “I felt optimistic”) and Panic (e.g. “I felt
faint”); 6-item measures of Suicidality (e.g. “I thought about hurting myself”), Insomnia
(e.g. “I slept less than usual”) and Lassitude (“I felt exhausted”); 5-item measures of
Social Anxiety (“I felt self-conscious knowing that others were watching me”) and Ill-
Temper (e.g. “I felt like breaking things”); a 4-item measure of Traumatic Intrusions (e.g.
“I had memories of something scary that happened”); and 3-item measures of Appetite
Loss (e.g. “I felt like eating less than usual”) and Appetite Gain (e.g. “I ate more often
then usual”). In addition, the IDAS contains two broader scales: General Depression (20
items) includes overlapping items that also are contained in other scales, whereas
Dysphoria (10 items) does not. Participants read a series of statements and indicate the
extent to which they have experienced each symptom in the past two weeks. Responses
are marked on a 5-point Likert scale, ranging from “not at all” to “extremely.”
The specific and broader scales of the IDAS have been shown to have excellent
internal consistency across multiple samples, with most showing coefficient alphas above
.80 across college student, psychiatric patient, postpartum, young adult, community adult
and high school student samples. In addition, the scales demonstrate good convergent
validity with other self-report inventories such as the Beck Depression Inventory 2 (BDI-

48
II; Beck, Steer, and Brown, 1996) and Beck Anxiety Inventory (BAI; Beck & Steer,
1990), as well as with interview measures of depression and anxiety.
The IDAS was included in order to provide a marker/scale for all nine of the
symptoms of interest including: dysphoria, irritability, fatigue, concentration difficulties,
restlessness, appetite loss, appetite gain, positive affect and autonomic arousal. Extra
items were retained in this version of the IDAS that reflect four of the DSM-IV symptom
criteria for Major Depression, which were developed from the original pool based on
agreement among 18 out of 23 expert raters (see Watson et al., 2007, for more detail).
These retained items include 5 additional items for criterion 8 (Cognitive Problems). In
addition, items were retained to capture the multiple aspects of criterion 3 (Appetite
Disturbance), resulting in 2 additional items for Appetite Loss and 2 additional items for
Appetite Gain for criterion 3. Also, criterion 5 (Psychomotor Agitation/Retardation) was
captured with 3 retained items related to agitation only. In addition, 2 new appetite gain
items were written for this study to allow for additional markers of the symptom. These
14 additional items allow for expanded modeling of the specific symptoms of interest for
this study. In addition, items within the Dysphoria scale related to psychomotor agitation
and concentration problems were removed from the Dysphoria score and instead
combined with these additional items of similar content. This version of the IDAS
contains 78 items. In this study, the IDAS scales and modified scales demonstrated good
to excellent internal reliability, ranging from .70 (agitation items) to .94 (concentration
items) in the diabetes sample, and from .77 (agitation items) to .94 (concentration items)
in the community sample. The IDAS was used with permission from the authors.
49
Beck Depression Inventory-II (BDI-II; Beck, Steer, and Brown, 1996). The BDI-
II is a well-known and well-validated measure of depression that consists of 23 items (to
increase clarity, the sleep and appetite disturbance items are divided into 2 items in this
version; however, responses to these items ultimately are combined into a single score).
Each item consists of four statements reflecting varying degrees to which a participant
may have been experiencing a particular symptom of depression. Participants circle the
statement within each item that best reflects how they have felt in the past two weeks.
Each item is scored between 0 and 3, for a maximum possible score of 63. Scores over
20 are typically considered to be in the clinical range for depressed mood. The BDI-II
has been shown to have high internal consistency and to converge well with other
measures of depressed and negative mood (Beck et al., 1996). The BDI-II was included
in this study in order to provide a marker/scale for the symptom of dysphoria. Given the
diverse content within the BDI-II, including items tapping fatigue, appetite change,
concentration difficulty, loss of energy, irritability and psychomotor agitation, several
items were removed from scoring, leaving the other 15 items tapping low mood, negative
cognitions, etc. in the total score. In this sample, the 15 item version of the BDI-II
demonstrated excellent internal consistency, with a coefficient alpha of .92 in both the
diabetes sample and in the community sample.
Center for Epidemiological Studies Depression Scale (CES-D; Radloff, 1977).
The CES-D consists of 20 items that are scored on a scale of 0 (rarely or hardly ever) to 3
(most or all of the time). The item content assesses depressed mood, in addition to some
positive affect and interpersonal difficulty-related items. The CES-D has been shown to
have high internal consistency (e.g. alpha = .85 in a general population sample) and
50
correlate strongly with other measures of depression (Radloff, 1977). Scores over 16 are
typically considered in the clinical range. The CES-D was included in the study in order
to provide a measure for the following symptoms of interest: dysphoria, concentration
difficulties, appetite loss, and positive affect. The scale includes one appetite loss item
(“I did not feel like eating; my appetite was poor,” which was split into two items) and
one concentration difficulty item. Two additional appetite loss items and two additional
concentration difficulty items were added to the CES-D to provide additional
measurement of these constructs. This content was scored separately from the other
items of the CES-D as measures of appetite loss and concentration difficulty,
respectively. In addition, the 4 items tapping positive affect were also scored separately
as a measure of positive affect. The CES-D scales demonstrated excellent internal
consistency reliability in both samples, ranging from .85 (appetite items and positive
affect items) to .89 (concentration items and dysphoria items) in the diabetes sample, and
from .87 (appetite items) to .92 (dysphoria items) in the community sample. This scale is
in the public domain and free to use without permission.
Hospital Anxiety and Depression Scale (HADS; Zigmond & Snaith, 1983). The
HADS was developed for use in medical settings to screen for depression and anxiety
among medical patients. It consists of 14 items of depression (e.g. “I have lost interest in
my appearance.”) and anxiety (e.g. “I get a sort of frightened feeling like something
awful is about to happen.”) that are rated on a scale of 0 to 3. Each number from 0 to 3
corresponds with a statement varying in either frequency or severity, such as “much of
the time” or “yes, but not too badly.” Evidence suggests that the HADS scores correlate
highly with interview measures of anxiety and depression and that the depression and
51
anxiety scales are internally consistent (average alpha = .82 to .83, respectively; Bjelland,
Dahl, Haug, & Neckelmann, 2002). The HADS was included in the study in order to
provide a marker for the restlessness factor. The HADS was originally developed to
measure depression and anxiety with 7 items scored for each subscale, although recent
research suggests the presence of three factors: (1) low positive affect and anhedonia, (2)
tension and somatic arousal and (3) psychomotor agitation (Friedman, Samuelian,
Lancrenon, Even, & Chiarelli, 2001). For the purposes of this study, these three factors
were scored as subscales in order to measure psychomotor agitation/restlessness. The
low positive affect/anhedonia and tension/somatic arousal scales of the HADS were not
included in analyses given the inclusion of several other well-validated scales in this
study to measure these constructs. The restlessness items demonstrated acceptable
internal consistency of .72 in the diabetes sample and .74 in the community sample.
The Expanded Form of the Positive and Negative Affect Schedule (PANAS –X;
Watson & Clark, 1999). The PANAS-X is an expanded version of the original PANAS
(Watson, Clark & Tellegen, 1988) that includes lower-order affect scales for
measurement of specific affects. The PANAS-X contains 60 items that can be scored for
the following scales: Fear, Sadness, Guilt, Hostility, Shyness, Fatigue, Surprise,
Joviality, Self-Assurance, Attentiveness and Serenity, in addition to two higher order
scales (PA and NA), which were included in the original PANAS. The PANAS-X scales
were derived from factor analyses of both student and adult samples (see Watson &
Clark, 1999).
The PANAS-X was included in this study to provide indicators for the following
symptoms of interest: dysphoria, irritability, fatigue and positive affect. For the purposes

52
of this study, the following scales were used to allow for measurement of the variables of
interest: (1) Sadness (5 items, e.g. “blue”), (2) Guilt (6 items, e.g. “ashamed”), (3)
Hostility (6 items, e.g. “scornful”), (4) Fatigue (4 items, e.g. “sleepy”), (5) Joviality (8
items, e.g. “happy”) and (6) Self-Assurance (6 items, e.g. “confident”), for a total of 35
items. “Past two weeks” instructions were given to participants. Participants completed
the PANAS-X by responding to items on a five-point Likert scale ranging from 1 (“very
slightly or not at all”) to 5 (“extremely”). The PANAS-X scales have high internal
consistency, including median alphas of Sadness = .87, Guilt = .88, Hostility = .86,
Fatigue = .88, Joviality = .93 and Self-Assurance = .83 (Watson & Clark, 1999). In
addition, the scales show strong convergent validity with other measures of specific
affect, as well as with peer ratings of affect (Watson & Clark, 1999). In this study,
similar alphas were demonstrated in each sample, ranging from .86 (Hostility) to .95
(Guilt and Joviality) in the diabetes sample, and from .86 (Self-Assurance) to .95
(Joviality) in the community sample. The PANAS-X was used with permission from the
authors.
Mood and Anxiety Symptom Questionnaire (MASQ; Watson & Clark, 1991). The
MASQ is a 90-item, factor-analytically derived self-report measure of depression and
anxiety symptoms. The MASQ was rationally constructed in order to test the Tripartite
Model by measuring the following scales: Anxious Arousal (MASQ-AA), Anhedonic
Depression (MASQ-AD) – which can be further divided into Loss of Interest (MASQ-LI)
and High Positive Affect (MASQ-PA)—General Distress-Depressed (MASQ-GD-D),
General Distress-Anxious (MASQ-GD-A) and General Distress-Mixed (MASQ-GD-M).
These scales have been shown to have high coefficient alpha reliabilities, ranging from
53
.86 to .93. The MASQ scales were included in this study in order to provide indicators
for the following symptoms of interest: dysphoria, positive affect and autonomic arousal.
In order to test the hypotheses of this study, the following scales of the MASQ were
administered: (1) General Depression – Depressive Symptoms (9 items, e.g. “Was
disappointed in myself”), (2) Anhedonic Depression – Positive Affectivity (14 items, e.g.
“Felt really “up” or lively) and (3) Anxious Arousal (17 items, e.g. “Had hot or cold
spells”), for a total of 43 items. These scales demonstrated excellent internal consistency
reliabilities, ranging from .88 (Anxious Arousal) to .97 (Anhedonic Depression – Positive
Affectivity) in the diabetes sample, and from .87 (Anxious Arousal) to .97 (Anhedonic
Depression – Positive Affectivity) in the community sample. The MASQ was used with
permission from the authors.
The Multiple Affect Adjective Check List, Revised (MAACL-R; Zuckerman &
Lubin, 1985). The MAACL-R assesses both state and trait affect, depending on the
instructions used, and contains five scales: Anxiety, Depression, Hostility, Positive Affect
and Sensation Seeking. The scale consists of 132 adjectives reflecting different moods
and feelings. Participants put a mark next to those words that reflect how they have been
feeling lately, or in general, depending on the version administered. The MAACL-R has
generally good internal consistency and test-retest reliabilities (Zuckerman & Lubin,
1985). The MAACL-R was included in this study in order to measure two symptoms of
interest: irritability and positive affect. For this study, the state version of the following
MAACL-R scales were administered: (1) Positive Affect (e.g. “Affectionate”) and (2)
Hostility (e.g. “Complaining”). In addition, instructions were modified so that
participants indicated the extent to which they have felt each of the adjectives in the past

54
two weeks on a scale of 1 (not at all) to 5 (extremely), rather than just marking those
adjectives that describe them. These items were combined with the PANAS-X items to
create a single questionnaire. Items that repeat among both the MAACL-R and PANAS-
X were listed only once and were scored for only one scale, rather than for both. This
resulted in the removal of 2 items from the MAACL-R Positive Affect scale and 5 items
from the Hostility scale, for a total of 19 Positive Affect items and 10 Hostility items.
For both samples, the MAACL-R scales demonstrated excellent internal consistency
reliabilities, including .93 (Hostility) and .97 (Positive Affect) in the diabetes sample, and
.90 (Hostility) and .96 (Positive Affect) in the community sample.
The Profile of Mood States (POMS; McNair, Lorr and Droppleman, 1971). The
POMS consists of 65 adjectives that are rated on a 4- or 5-point scale and has the
following six scales: Anger-Hostility, Vigor-Activity, Fatigue-Inertia, Confusion-
Bewilderment, Tension-Anxiety and Depression-Dejection. Evidence suggests that the
POMS scales (a) have acceptable internal consistency reliabilities and moderate short-
term stability, (b) are sensitive to changes due to therapy and (c) show good concurrent
and predictive validity (Lane & Lane, 2002; McNair & Lorr, 1964; Payne, 2001). The
POMS was included in this study to provide additional indicators of the following three
symptoms of interest: irritability, fatigue and positive affect. In order to test the
hypotheses of this study, the following scales were included: (1) Vigor/Activity (e.g.
“Active”), (2) Fatigue/Inertia (e.g. “Listless”) and (3) Anger/Hostility (e.g. “Bitter”).
These items were also combined with the MAACL-R and PANAS-X to create a single
questionnaire using past two week instructions and a 5-point Likert scale. Again, items
that repeated among any two measures (e.g. POMS and MAACL-R) were listed once and
55
scored for only one scale. This resulted in the removal of 3 Vigor/Activity items, 1
Fatigue/Inertia item and 1 Anger/Hostility item, for a total of 5 Vigor/Activity items, 6
Fatigue/Inertia items and 11 Anger/Hostility items. The 3 POMS scales used in this
study demonstrated excellent internal consistency reliabilities ranging from .90
(Vigor/Activity) to .93 (Fatigue/Inertia) in the diabetes sample, and from .89
(Vigor/Activity) to .95 (Joviality) in the community sample.
Beck Anxiety Inventory (BAI; Beck & Steer, 1990). The BAI consists of 21 items
assessing symptoms of anxiety, and particularly symptoms of autonomic arousal and
panic. Participants indicate the extent to which they have been bothered by each of the
21 symptoms on a scale of 1 to 4, with 1 indicating not being bothered by the symptom at
all, and 4 indicating being severely bothered by the symptom. This scale was included in
the study to measure autonomic arousal. For the purposes of this study, the more
physiological items (e.g. “dizzy or lightheaded”) were summed for a somatic total and the
more cognitive or affective items (e.g. “unable to relax”) were removed from the total
score. The physiological items include: 1, 2, 3, 6, 7, 8, 11, 12, 13, 15, 18, 19, 20 and 21,
for a total of 14 items, while the cognitive/affective items include: 4, 5, 9, 10, 14, 16 and
17 (see Appendix 1 for all scales and items). The entire BAI was administered, for a total
of 21 items. The 14 somatic items demonstrated good internal consistency reliabilities of
.88 in both samples.
Cognitive Failures Questionnaire (CFQ; Broadbent, Cooper, FitzGerald &
Parkes, 1982). The CFQ measures self-reported errors in memory, perception and motor
functioning. The questionnaire consists of 25 questions about common cognitive
mistakes (e.g. “Do you find you forget appointments?”). Instructions ask participants to
56
read each question and indicate the frequency of occurrence of the mistake in the past 6
months. Responses are indicated on a 0 to 4 Likert scale, with 4 indicating very often
and 0 indicating never. Evidence suggests that the scale is internally consistent, with an
alpha coefficient of .89 and item intercorrelations ranging from .23 to .53 (with the
exception of 2 items). In addition, the scale total score has been found to correlate .57 to
.62 with other self-report measures of attention and memory problems (Broadbent et al.,
1982). The CFQ was included in the questionnaire packet to measure
concentration/cognitive difficulties. For this study, CFQ instructions were modified to
indicate problems over the past 2 weeks, rather than the past 6 months, to maintain a
general consistency of time frame across measures. The 25-item scale demonstrated
excellent internal consistency reliabilities of .96 in the diabetes sample and .94 in the
community sample.
The Indecisiveness Scale (IDS; Germeijs & De Boeck, 2002). The IDS is a factor-
analytically derived scale containing 22 items that assess indecisiveness in general, across
all situations. The content of the scale includes both positively and negatively framed
items tapping multiple areas of indecision, such as difficulty deciding (e.g. “I find it easy
to make decisions”), not knowing how to make decisions (e.g. “I don’t know how to
make decisions”) and feeling uncertain about decisions (e.g. “I often reconsider my
decision”). Participants read each statement and respond on a 7-point Likert scale,
indicating the extent of agreement with each statement (e.g. 0 = strongly disagree, 6 =
strongly agree). Principal components analyses determined a 1 factor solution for the
items, with all but one item loading .40 or higher on the factor. Internal consistency
reliability was found to be .91 and 4-month test-retest reliability on the scale was .67 for a
57
sample of 30 students (Germeijs & De Boeck, 2002). The scale has been found to
correlate .41 with a measure of self-esteem (Germeijs & De Boeck, 2002). The IDS was
included in the study to provide an additional marker of concentration/cognitive
difficulties. For the purposes of this study, instructions and items were modified to
measure indecisiveness as a state rather than as a trait-like characteristic. Participants
responded to items indicating the extent to which the item was true for them in the past 2
weeks (e.g. 1 = not at all true, 5 = extremely true). An abbreviated, 12-item version of
the IDS was administered to participants. This 12-item version demonstrated excellent
internal consistency reliabilities of .94 in each sample.
The Multifactorial Memory Questionnaire (MMQ; Troyer & Rich, 2002) The
MMQ assesses three dimensions of self-reported memory including satisfaction with
memory (Contentment), memory ability (Ability) and memory strategies (Strategies).
The MMQ was included in the study questionnaire as an indicator of cognitive
difficulties. For the purposes of this study, only the Ability scale was included; it
consists of 20 items measuring everyday memory situations (e.g. “How often do you
forget to pay a bill on time?”). Participants read 20 questions and respond to the
frequency of occurrence of the event over the past month, using a 5-point Likert scale
(e.g. 1 = all of the time, 2 = often, 3 = sometimes, 4 = rarely or 5 = never). Higher scores
indicate better subjective memory. Factor analyses of the MMQ found a 3 factor
solution, with item loadings of .45 to .74 for all Ability items, and a mean loading of .59.
The Ability scale also showed a 4-week retest correlation of .86 and a Cronbach’s alpha
coefficient of .93. In this study, the MMQ Ability scale demonstrated excellent

58
coefficient alphas of .96 in the diabetes sample and .95 in the community scale. The
MMQ was used with permission from the author.
Mehrabian Fidgety Scale (MFS; Mehrabian & Friedman, 1986). The MFS is a
40-item measure of fidgeting tendency and assesses behavioral agitation such as feelings
of physical restlessness and fidgeting involving, for example, the hands, legs, feet and
clothing. The scale was found to have good internal consistency (coefficient alpha = .89)
and correlates moderately with a peer version and with observer ratings of fidgeting.
This scale was included as an indicator of restlessness. For the purposes of this study,
those items assessing more general psychomotor agitation and restlessness were included,
for a total of 6 items. The 6-item scale demonstrated good coefficient alphas of .86 in the
diabetes sample and .87 in the community sample. The MFS was used with permission
from the author.
Epworth Sleepiness Scale (ESS; Johns, 1991). The ESS is an 8-item measure of
sleepiness and fatigue for use in adults. Each item consists of a different everyday
situation such as “sitting & reading,” “watching t.v.” or “stopped for a few minutes in
traffic while driving.” Next to each situation, participants indicate the likelihood of
dozing off in that situation on a 4-point Likert scale, with 0 = would never doze off, 1 =
slight chance of dozing or sleeping, 2 = moderate chance of dozing or sleeping and 3 =
high chance of dozing or sleeping. The ESS was included as a marker of fatigue in this
study. The ESS has been found to have high internal consistency (Cronbach’s alpha =
.88) and 5-month retest reliability (r = .82). Factor analysis of the items revealed a one-
factor solution, with all item loadings of .53 or higher among sleep apnea patients, and all
but one item loading .37 or higher in a sample of medical students (Johns, 1991). The
59
ESS demonstrated acceptable internal consistency reliabilities in both samples, including
.79 in the diabetes sample and .78 in the community sample. This scale was used with
permission from the author.
Motivation to Eat Questionnaire. (MEQ; Hill & Blundell, 1986). The MEQ is a 4-
item measure of appetite developed to assess changes in appetite for use in obesity and
eating disorder research. The MEQ consists of 4 questions assessing appetite and
fullness (e.g. “How strong is your desire to eat?”) that are followed by a 100mm line with
opposite anchors (e.g. “very weak” vs. “very strong”) at each end. Participants indicate
their responses by marking an “X” on the line that best reflects how they feel at the
moment. The scale is designed to assess immediate appetite following or preceding
meals and at other times throughout the day. No psychometric data have been reported
on the scale, but the items were found to correlate |.6| to |.8| with one another. In
addition, the scale has been found to be sensitive to the effects of palatability of food, the
administration of appetite-suppressant medication and differences in nutrition content on
appetite (Hill & Blundell, 1986).
The MEQ was included in this study as a measure of appetite disturbance. For the
purposes of this study, questions were reframed to assess appetite over the past two
weeks (e.g. “How strong has your desire to eat been?”). In addition, participants were
given multiple choice responses, rather than a 100mm line, with which to indicate their
response. For example, instead of the two anchors “very weak” or “very strong” in
response to the question “How strong has your desire to eat been?,” participants circled
either (1) very weak, (2) somewhat weak, (3) somewhat strong or (4) very strong to
indicate their desire over the past two weeks. This measure is initially listed in Table 1 as
60
an indicator of both appetite loss and appetite gain due to the uncertain nature of how it
will perform in relation to other measures of appetite disturbance. I will report
subsequent analyses to determine the appropriate placement of this scale in the structural
models. In this study, the MEQ items demonstrated acceptable internal consistency
reliabilities of .86 in the diabetes sample and .78 in the community sample.
RAND 36-Item Short Form Health Survey (RAND SF-36; McHorney, War, Lu, &
Sherbourne, 1993). The RAND SF-36 is a 36-item measure of eight general health
concepts including physical functioning (10 items), role limitations due to physical health
problems (4 items), bodily pain (2 items), general health perceptions (5 items),
vitality/energy (4 items), social functioning (2 items), role limitations due to emotional
problems (3 items) and mental health/emotional well being (5 items). For physical
functioning, participants read a series of activities (e.g. lifting or carrying groceries,
climbing one flight of stairs) and indicate the extent to which their health has limited the
ability to engage in the activities on a scale of 1 (yes, limited a lot) to 3 (no, not limited at
all). For role limitations – physical health, participants indicate whether or not (yes or
no) poor physical health has led to problems such as “accomplished less than you would
like” or “were limited in the kind of work or other activities” in the past 4 weeks. Bodily
pain includes 2 items for which participants indicate both extent of physical pain (1 =
none, 6 = very severe) over the past 4 weeks, as well as extent of interference in daily life
(1 = not at all, 5 = extremely) over the past 4 weeks. General health includes a series of
statements (e.g. my health is excellent) for which participants indicate how true the
statement is on a scale of 1 (definitely true) to 5 (definitely false). Vitality/energy is
measured with 4 statements (e.g., did you have a lot of energy?”) for which participants
61
indicate the extent of time over the past 4 weeks that he/she has felt this way on a scale of
1 (all of the time) to 6 (none of the time). The social functioning scale consists of 2 items
which ask participants to indicate the extent of time their social activities over the past 4
weeks have been limited by physical or emotional health problems on a scale of 1 (all of
the time) to 5 (none of the time) for one item, and on a scale of 1 (not at all) to 5
(extremely) for the other item. The role limitations – emotional health scale consists of 3
statements for which participants indicate whether or not (yes or no) their emotional
health has led to problems (e.g., accomplished less than you would like) in the past 4
weeks. The mental health scale consists of 5 questions (e.g., have you been a very
nervous person?) to which participants respond on a 1 (all of the time) to 6 (none of the
time) scale for the past 4 weeks.
The scales have been found to have good internal consistency reliabilities, ranging
from .82 (bodily pain) to .93 (physical functioning). In this study, coefficient alphas
ranged from .83 (emotional well being) to .95 (physical functioning) in the diabetes
sample, and from .80 (general health) to .89 (physical functioning) in the community
sample. This scale is in the public domain.
Medical Questionnaire. A 15-item self-report medical comorbidity scale was
created for use in this study that assessed both (a) the presence of 13 medical conditions
and (b) treatment for these medical conditions. The 13 conditions included heart disease,
high blood pressure, high cholesterol, lung disease, stroke, diabetes, ulcer or stomach
disease, kidney disease, liver disease, cancer in the past 3 years, arthritis, depression and
anxiety. Participants indicated whether or not they had the condition (yes or no), as well
as whether or not they received treatment for the condition.
62
Demographics. Participants completed 6 demographic questions including the
date of completing the questionnaire, age, gender, Hispanic/Latino status, race, current
marital status, highest level of education and approximate total annual household income.
Measures of Diabetes Control
Hemoglobin A1C (HbA1c). As stated previously, HbA1c is a measure of average
blood glucose control over the past 2 months that is typically assessed at least two times
per year. This measure is generally agreed upon to be the best reflection of glucose
control and thus diabetes control and self-care. All diabetes patients were asked to report
their most recent HbA1c result, as well as the date of the lab, and HbA1c values were
obtained from medical records as well when possible. The optimal range of HbA1c for
an adult with diabetes is 5 to 7%.
In addition, individuals were asked to indicate the number of days they were
hospitalized in the past two months, the number of days of missed work or school due to
diabetes-related illness in the past two months and the date of their diabetes diagnosis, in
order to obtain a relatively objective measure of disease severity. Patients also selected
from a list any diabetes-related health complications that they had experienced, such as
retinopathy, neuropathy, amputations, etc. These complications are additional indicators
of disease severity and help characterize participants. Diabetes medication/treatment
were reported by patients as well, chosen from a list of common medications. Finally,
patients were asked to indicate the extent to which they had difficulties with hypo- or
hyperglycemia in the past two weeks.
Self-Reported Diabetes Symptoms. In keeping with previous research on diabetes
and depression/anxiety symptoms, participants completed a commonly used measure of
63
self-reported diabetes symptoms, the Self-Completion Patient Outcome instrument
(SCPO; Whitty et al., 1997). The SCPO assesses nine common symptoms of diabetes
including blurred vision, thirst, polyuria, excessive hunger, shakiness, fatigue, cold hands
and feet, parathesias and feeling faint; each symptom is assessed using a single statement
(e.g., “In the past month, on how many days have you felt abnormally thirsty?”).
Participants respond on a five-point Likert scale where 1 = never and 5 = everyday. As
stated previously, the scale has been found to correlate with both depression/anxiety
symptoms as well as objective diabetes indicators (i.e. HbA1c; Ludman et al., 2004;
Ciechanowski et al., 2003). Three-week retest reliability was found to have a 95%
confidence interval of .9 to .96 and Cronbach’s alpha was found to be .78. In addition,
the measure has been found to be sensitive to expected changes in symptom reporting
with the commencement of diabetes treatment such as insulin. Although these items
overlap with other symptoms of interest, the inclusion of this measure allows for
continuity with previous diabetes research.
Procedure
Community adults received questionnaires in the mail and completed
questionnaires at home at their convenience and returned the packet by mail. Individuals
with diabetes recruited in person received the questionnaires in person, completed them
at home, and returned the packet through the mail. The 21 diabetes patients who were
recruited through flyers and ads received the questionnaires through the mail, completed
them at home and returned the packet by mail. HbA1c values were collected from the
medical records of adults with diabetes at the time they returned their packets.
Community adult participants completed a total of 431 items, which includes the
64
symptom dimension measures (365 items), diabetes questionnaire (SCPO; 9 items),
RAND SF-36 and medical questionnaire (51 items total) and 6 demographic questions.
Individuals with diabetes completed a total of 442 items, including the symptom
dimension measures (365 items), diabetes questionnaire (SCPO; 9 items), RAND SF-36
and medical questionnaire (51 items total), 6 demographic questions and 11 questions
characterizing disease severity.
Overview of Analyses
Elimination of Poor Markers. In order to compare factor structures between
groups, reliable markers of the proposed factors must emerge. Thus, the first step in the
analyses will be to identify psychometrically poor markers of the proposed factors
(dysphoria, PA, irritability, concentration problems, appetite/weight loss, appetite gain,
psychomotor agitation, fatigue and autonomic arousal), such as those with a poor
coefficient alpha (e.g. less than .75). Scales with poor alphas will be subjected to
exploratory factor analyses in order to identify any items which load lower than |.35|.
These items will be eliminated in subsequent analyses.
Test for Mean Level Differences. In order to test hypotheses 1 and 2, mean
comparison analyses will be conducted to test for mean level differences on each of the
symptom scales between the diabetes and community samples. As stated previously, the
diabetes sample is expected to have higher mean scores on the six nonspecific symptoms
of depression and anxiety, as well as higher mean scores on fatigue and autonomic
arousal. In contrast, the diabetes sample is expected to have lower mean scores on
measures of PA.
65
Measurement Model Preliminary Analyses. Before running confirmatory factor
analyses, some preliminary analyses will be conducted to test for any gross problems in
the a priori measurement model. First, correlations between scales of the same symptom
dimension will be examined. Any scale with low correlations (i.e. less than |.40|) with
other putative indicators of the same symptom dimension in either sample will be
considered for elimination from subsequent analyses. In addition, exploratory factor
analyses will be conducted in each sample to eliminate any scales that do not load (or
load poorly, such as a primary loading of less than .35) with other markers of the
hypothesized symptom dimension. It is possible that one or more factors will not be
modeled adequately in these data and will need to be dropped from subsequent
consideration.
Initial Confirmatory Factor Analysis. Multiple group confirmatory factor
analysis (CFA) allows for the testing of a pre-established model or structural theory and
for the comparison of this model across samples. Nine correlated factors are proposed in
this model (i.e. dysphoria, PA, irritability, concentration problems, appetite loss, appetite
gain, psychomotor agitation, fatigue and AA), and proposed indicators or markers of
these factors have been described earlier under “Measures” (see Table 1 for proposed
indicators). Ideally, each factor is marked by at least three indicators, although two
indicators would be the minimum possible to identify a factor. The initial CFAs will be
conducted separately within each sample to identify first if the a priori measurement
model (9 correlated factors based on the Table 1 indicators; Hypotheses 3a and 3b) fits
the data for each sample before comparing the model across samples.
66
If a factor does not emerge based on a priori hypotheses, adjustments will be
made to eliminate poor markers (e.g. measures loading less than |.40|). CFA will be re-
run with these changes. If a hypothesized factor still fails to emerge even after these
modifications, it will be dropped from the measurement model.
In order to test the a priori measurement model described in Table 1 (i.e.
Hypotheses 3a and 3b), the models will be tested for fit within each sample, separately,
using covariance matrices and the maximum likelihood estimation method with EQS.
Before testing for differences between samples, adequate-fitting models must be
identified within each sample. Six different fit indices will be examined to determine the
fit of the model within each sample: the overall model chi-square (χ2), normed fit index
(NFI), comparative fit index (CFI), goodness-of-fit index (GFI), standardized root-mean-
square residual (SRMR) and root-mean-square error of approximation (RMSEA). There
are no exact guidelines for interpreting the fit indices, yet there are generally agreed upon
criteria. NFI, CFI, and GFI values of >.9 are generally considered a good fit, and >.95 is
considered an excellent fit. In addition, SRMR values of <.1 are a good fit, and <.08 are
an excellent fit. Finally, RMSEA values of <.08 are a good fit, and <.06 are an excellent
fit (Simms, Watson, & Doebbeling, 2002). Again, if an adequate fitting model does not
emerge in each sample, adjustments will be made to the model to improve fit and to
retain as many proposed factors as possible.
Once an adequate fitting model has been determined for each sample (see Table 2
for a list of specific models), further within sample tests will be conducted on each of
these models. In order to test hypotheses 4a and 4b (i.e. significant correlations that will
vary in magnitude among symptom dimensions), correlations among factors will be

67
examined within each sample. Rather than test every possible pair of correlations for
differences in relative size, analyses will be limited to a few select correlations.
Specifically, I will test whether or not dysphoria correlates more highly with irritability
than with appetite loss and positive affect (which will be transformed for these analyses
to reflect low positive affect). These correlations will be tested by running models that
constrain the following pairs of factor correlations to be equivalent in each sample:
1. rdysphoria/irritability = rdysphoria/appetite loss,
2. rdysphoria/irritability = rdysphoria/PA,
with the expectation that they are not equivalent and that:
rdysphoria/irritability > rdysphoria/appetite loss & rdysphoria/PA.
In order to test this hypothesis, I will compare the fit indices from each of these
constrained models (1 and 2) with the fit indices of the initial models within each sample.
If the constrained models prove to be a worse fit as indicated by fit indices, this will
indicate that factor correlations are not equivalent.
Testing for Sample Differences using Confirmatory Factor Analysis. Before
testing for differences, an adequate fitting, common structure will be determined for both
groups by running an unconstrained, multiple sample nine-factor model and examining fit
indices. Hypothesis 5a proposes that an adequate fitting common model will be found
given the general robustness of structural models across samples (e.g., O’Connor, 2002).
Factor correlation differences (Hypothesis 5b) will be tested by comparing a 9-factor
model that is constrained to have equivalent factor correlations across samples with the
unconstrained model, again using the chi-square difference test and examining the fit
indices of the constrained model. As described above, I expect factor correlations among
68
some symptoms to be higher among diabetes patients and thus expect a constrained
model to perform more poorly than an unconstrained model. If non-equivalence across
samples is found for this parameter, I will identify specific constraints which decrease the
fit of the model as indicated by the multi-group CFA program (i.e. the cumulative
multivariate statistics).
Summary
These analyses allow for a comparison of the structure of depression and anxiety
symptoms among diabetes patients and community adults by testing 5 specific
hypotheses. First, tests for mean level differences in the two samples will reveal if adults
with diabetes evidence greater levels of depression and anxiety, as suggested by
prevalence and incidence data discussed above (Hypotheses 1 and 2). Second,
preliminary correlational analyses and exploratory factor analyses will allow for a test of
any gross problems with the proposed measurement model of the 9 symptoms of
depression and anxiety. Third, Hypotheses 3a and 3b will be tested using single sample
CFA to test for the presence of 9 symptoms of depression and anxiety within each
sample. Fourth, key aspects of the integrative model will be tested (Hypothesis 4a and
4b) by running constrained within sample CFAs and examining changes in fit indices
within each sample when certain correlations are constrained to be equivalent with one
another. Finally, the replicability of the 9 factor model of depression and anxiety
symptoms will be examined with both samples by running a multiple sample CFA and
examining fit indices (Hypothesis 5a). In addition, all of the symptom correlations will
be constrained to be equivalent across the 2 groups and the chi square will be examined
to test for a decrease in model fit (Hypothesis 5b) given these equality constraints. In

69
conclusion, results of these analyses will reveal the presence or absence of structural
differences between the 2 samples in the specified symptoms of depression and anxiety.
70
RESULTS
Descriptive Statistics
Demographics. As seen in Table 3, differences between groups in demographic
characteristics were examined with chi square tests, and several significant differences (p
< .05) were noted. Gender, ethnicity, marital status, education and income frequency
distributions were significantly different between groups, with the community sample
more likely to be female, white and married, and reporting more education and greater
annual income than the diabetes sample. A significant difference was not found for age (t
=1.53, p = .13).
Health Information. Diabetes information was available only for those diabetes
patients who completed the diabetes questionnaires. As seen in Table 4, participants had
been diagnosed with diabetes an average of 13 years, and 64.2% of participants had
T2DM, 27% with T1DM, and 1.3% with gestational. Although T1DM typically
represents only 5-10% of adults with diabetes nationwide, the number of T1DM recruited
for this study is much higher, most likely because of the recruitment sites (i.e., diabetes
and endocrinology clinics.) Although only 27% of participants had T1DM, 59.3% were
on insulin, which likely reflects the changing treatment practices for adults with T2DM.
Participants endorsed a range of complications from their diabetes, with the most
common complication being high blood pressure (44.2%), followed by skin problems
(38.1%) and neuropathy (29.2%). The least common complications included blindness
(1.3%) and kidney failure (1.8%).
125 patients reported their HbA1c (56%), and 120 reported the date (year and
month) of their most recent HbA1c (54%). In addition, lab results from medical records
71
were returned for 184 patients (83%). The average HbA1c results based on medical
records for this sample was 7.7%. As stated previously, the ADA recommends HbA1c
levels of less than 7%, with 5% representing the normal range. Consequently, this
sample’s average of 7.7% reflects less than optimal control over blood glucose levels.
There was an average of 36.6 days between the time the patient had his/her most recent
HbA1c lab and completed the questionnaire. The correlation between self-reported
HbA1c and medical records was .93 (n = 67 observations from the same month). In
addition, 45 patients reported an HbA1c lab result from a lab test date earlier than that
returned from the medical records (e.g., a lab result from January was reported by patient,
and a lab result from April was returned from medical records). The correlation between
these two values at different time points was .82. Thus, even at 2 different time points,
HbA1c self-report and medical records were highly concordant with one another. Table
4 includes HbA1c from medical records alone.
Self-reported medical conditions also were examined and are reported in Table 5.
Significant differences were found between samples for most self-reported medical
conditions and medical treatments. Adults with diabetes were more likely than
community adults to report the presence of all conditions except anxiety and arthritis.
Adults with diabetes were also more likely than community adults to report receiving
treatment for all conditions except anxiety.
Self-reported diabetes symptoms from the SCPO were examined and are reported
in Table 6; as expected, significant differences were noted between the two groups across
all 9 items of the SCPO. Diabetes patients were more likely than community adults to
report experiencing all nine symptoms/items of the SCPO.
72
In summary, diabetes patients on average reported a greater number of physical
comorbidities and more frequent treatment for these conditions. Diabetes patients were
also more likely to experience the symptoms measured by the SCPO, presumably due to
the presence of diabetes. Descriptive statistics suggest that diabetes patients in general
had a higher number of medical conditions, medical treatments and physical symptoms
than community adults.
Test for Mean Level Differences in
Depression and Anxiety Symptoms
Hypotheses 1 and 2 proposed higher means for the diabetes patients across
dysphoria, irritability, concentration problems, restlessness, fatigue, appetite loss, appetite
gain and AA symptom scales, and lower means on PA scales for diabetes patients
compared with community adults. To test these hypotheses, independent samples t-tests
were conducted on each of the symptom scales between the diabetes and community
adult samples; several significant differences in scale means were noted (see Table 7).
Diabetes patients had significantly higher means on 4 out of 6 dysphoria scales, 2 out of 3
appetite loss scales, 4 out of 5 concentration difficulties scales, 2 out of 3 restlessness
scales, one of the 2 appetite gain scales, 4 out of 4 fatigue scales and 3 of 3 AA scales.
Community adults had higher means on 6 out of 7 PA scales and on all 8 RAND SF-36
scales. No significant differences were found between samples for irritability scales.
Thus, Hypotheses 1 and 2 were generally confirmed, with diabetes patients exhibiting
higher levels of symptoms and community adults demonstrating higher levels of PA.
Cohen’s d effect sizes are shown on Table 7; they generally were small in
magnitude (Cohen, 1992), with values ranging from a low of .01 to a high of .40 for most
73
symptoms of depression and anxiety. However, the notable exceptions are the effect
sizes for the AA scales, which range from .51 to .57; these indicate moderate effects
(Cohen, 1992). In addition, the effect sizes for the RAND SF-36 scales varied from .23
to 1.24. Thus, mean levels of general physical health were quite different between the
two samples, with the greatest differences seen on levels of Physical Functioning (d =
0.96) and General Health (d = 1.24); these scales showed large effect sizes (Cohen,
1992).
Structural Analyses
Elimination of Poor Markers
In order to compare factor structures between groups, reliable markers of the
proposed factors must be included in factor analyses. Thus, steps were taken to identify
any poor markers of the 9 proposed factors (dysphoria, PA, irritability, concentration
problems, appetite/weight loss, appetite gain, psychomotor agitation, fatigue and
autonomic arousal), such as those with a poor coefficient alpha (e.g. less than .75).
Scales with poor alphas were subjected to exploratory factor analyses in order to identify
any items which load lower than |.35| on the first unrotated factor, in order to eliminate
these items from subsequent analyses. As seen in Table 8, two scales in the diabetes
sample had coefficient alphas of less than .75 including the IDAS agitation items (.70)
and the HADS restlessness items (.72). In the community sample, only the HADS
restlessness items had a poor coefficient alpha of .74. Thus, exploratory analyses
(principal axis factor analyes) were run on these two scales in both samples. The weakest
item factor loading in one-factor solutions for the HADS restlessness items was .54 in the
diabetes sample and .53 in the community sample. Thus, no items were eliminated from
74
the HADS restlessness items scale. The weakest item factor loading in one-factor
solutions for the IDAS agitation items was .56 in the diabetes sample and .65 in the
community sample. Again, no items were eliminated at this stage of analyses from the
IDAS agitation items scale.
Preliminary Correlational Analyses
Before running confirmatory factor analyses, additional preliminary analyses
were conducted to test for any gross problems in the a priori measurement model. First,
correlations between putative scales of the same symptom dimension were examined to
identify any scales with low correlations (i.e. less than .40) with other hypothesized
markers of the same symptom dimension in either sample. These scales could then be
considered for elimination in subsequent analyses. Table 9 contains correlations among
scales measuring the same symptom dimension.
For the positive affect, dysphoria, concentration difficulties, irritability and
autonomic arousal scales, all correlations were .60 and greater. Among the PA scales, the
average correlation among scales was .75 in the diabetes sample and .73 in the
community sample. Among the dysphoria scales, the average correlation among scales
was .84 in the diabetes sample and .83 in the community sample. The average correlation
among concentration difficulties scales was .72 in the diabetes sample and .71 in the
community sample. For irritability, average correlations were .82 in the diabetes sample
and .84 in the community sample. Average correlations for the autonomic arousal scales
were .85 in the diabetes sample and .86 in the community sample. Thus, for these 5
symptom dimensions, the candidate scales were generally highly correlated with one
another.
75
Among the restlessness and appetite gain scales, correlations were lower. The
restlessness scales correlated .64 on average in the diabetes sample and .55 in the
community sample. The appetite gain scales correlated .48 with one another in the
diabetes sample and .57 with one another in the community sample. Among the appetite
loss scales, correlations varied from a low -.51 in both samples and a high of .71 in the
diabetes sample and .77 in the community sample. The average correlation was .60 in
both samples. The MEQ scale in particular was less related to the other two appetite loss
scales (IDAS Appetite Loss and the CES-D appetite loss items). The fatigue scales also
demonstrated variability in correlations, ranging from a low of .42 to a high of .88 in the
diabetes sample, and a low of .38 and a high of .87 in the community sample. The
average correlation among fatigue scales was .58 in the diabetes sample and .56 in the
community sample. However, the Epworth Sleepiness Scale demonstrated consistently
lower correlations with the other three fatigue scales, with coefficients ranging from .42
to .44 in the diabetes sample and from .38 to .44 in the community sample.
Although the symptom dimension scales demonstrated variable correlations, and
appetite loss, appetite gain and restlessness showed consistently lower correlations
among their respective scales, these preliminary analyses did not suggest any gross
problems with the model. All correlations were above .40, with the exception of a .38
correlation between the Epworth Sleepiness Scale and POMS Fatigue/Inertia in the
community sample. Thus, no scales were eliminated from subsequent analyses based on
these correlational results.

76
Exploratory Factor Analyses
Next, exploratory factor analyses were conducted in each sample to eliminate any
scales that did not load (or loaded poorly, such as a primary loading of less than .35) with
other scales of the hypothesized symptom dimension. In each sample, a principal factor
analysis was conducted on the proposed set of indicators for each symptom factor. One-
factor solutions were examined for each of the nine symptoms. Across most symptom
dimensions, exploratory analyses revealed that loadings in single-factor analyses were
generally between .74 and .96 in both samples. A few scales had loadings less than .74,
however. In the diabetes sample, these included the MEQ on the appetite loss and
appetite gain factors (loadings of -.65 and .69, respectively), the Epworth Sleepiness
Scale on the fatigue factor (.47), and IDAS Appetite Gain on the appetite gain factor
(.69). Within the community sample, scales with the lowest loadings included the MFS
on the restlessness factor (.67), the MEQ on the appetite loss factor (-.58) and the
Epworth Sleepiness Scale on the fatigue factor (.47). Although these scales were
identified as potentially less related to the symptom factors of interest, no scales were
eliminated at this stage given that all scales loaded well above .35 in both samples.
However, this stage of analyses helped identify potential problems with the proposed
model given the relatively low factor loadings of the MEQ, Epworth Sleepiness Scale,
IDAS Appetite Gain and MFS on their related factors. Results from this series of
preliminary analyses suggested that the next stage of analyses, CFA, could proceed using
the originally specified model without any modifications.
77
Initial Confirmatory Factor Analysis
As stated previously, multiple group confirmatory factor analysis (CFA) allows
for the testing of a pre-established model or structural theory and for the comparison of
this model across samples. Nine correlated factors were proposed in this model (i.e.,
dysphoria, PA, irritability, concentration problems, appetite loss, appetite gain,
psychomotor agitation, fatigue and AA), and proposed indicators or markers of these
factors have been described above under “Measures” (see Table 1 for proposed
indicators). Ideally, each factor is marked by at least three indicators, although two
indicators are the minimum possible to identify a factor. The initial CFAs were
conducted separately within each sample to identify whether the a priori measurement
model (9 correlated factors with Table 1 indicators; Hypotheses 3a and 3b) fits the data
for each sample before attempting to compare the model across samples.
To test Hypotheses 3a and 3b, this nine-factor CFA was run in each sample using
all specified markers described previously, and is labeled Model 1 in Table 10. Again, no
markers were removed from this initial CFA model based on preliminary analyses.
Using the criteria described above for interpreting the fit indices, the fit indices for this
nine-factor model were not in the adequate range. As seen in Table 10, only one of the fit
indices for Model 1 for the diabetes sample was in the adequate range (SRMR). For the
community sample, only two of the five fit indices were in the adequate range (SRMR
and CFI). Thus, the results of the nine-factor CFAs did not fully support hypotheses 3a
and 3b.
Steps were then taken to improve the model by examining a nine-factor
exploratory principal factor analysis with Varimax rotation in each sample. Results of
78
these analyses in the diabetes sample revealed an eight-factor solution, with an
uninterpretable ninth factor (i.e., loadings on this factor were all less than .20). As seen
in Table 11, the eight identifiable factors in this nine-factor solution were (in this order):
Positive Affect, Irritability, Cognitive Difficulties, Autonomic Arousal, Fatigue,
Dysphoria, a combined Appetite Loss and Gain factor (with loss scales loading positively
on the factor and gain scales loading negatively), and Agitation/Restlessness. In the
community sample, the 9-factor solution failed to converge and extraction was
automatically terminated by SPSS after 50 iterations. Given that the diabetes EFA
suggested an 8 factor solution, the EFA was re-run in the community sample extracting 8
rather than 9 factors. Both Varimax and Promax rotations were examined; the Promax
rotation revealed the most interpretable solution in the community sample and is
presented in Table 12. The factors in this solution, in order, were: Positive Affect,
Irritability, Autonomic Arousal, Cognitive Difficulties (plus the Epworth Sleepiness
Scale, which also loaded with the Fatigue factor), Fatigue, Dysphoria, another bipolar
Appetite Loss and Gain factor (with positive loadings for loss scales and negative
loadings for gain scales), and a combination of the Restlessness scales and Concentration
Difficulties scales. An 8-factor EFA (using principal axis factoring, examining Promax
and Varimax rotations) was then run in the diabetes sample as well to compare 8-factor
structures, and the Promax solution is presented in Table 13. The 8-factor solution was
very similar to that of the community sample 8-factor solution, using both Varimax and
Promax rotations. The 8-factor Varimax solutions for the community and diabetes
samples are presented in Tables 14 and 15, respectively.
79
These EFA results therefore suggested that an 8-factor solution may provide an
improved fit for the data compared with the hypothesized 9-factor model. Thus, the next
series of CFAs were based on an 8-factor rather than 9-factor model. The eight-factor
model included all of the following proposed symptoms: Positive Affect, Dysphoria,
Irritability, Concentration Difficulties, Restlessness, Fatigue and Autonomic Arousal. In
addition, the 8-factor model included a bipolar Appetite factor, based on EFA results; this
included both the appetite loss and gain scales, which were free to load positively or
negatively on this factor. The fit indices for the 8 factor solution are displayed under
Model 2 in Table 10. As seen in the table, the fit indices were worse for this model than
for Model 1, and only one index was in the adequate range (the SRMR for the
community sample).
Steps were taken to improve the fit for this model by examining the standardized
residual matrix output. These data revealed that the appetite gain scales, particularly
IDAS Appetite Gain, were generally contributing the largest residuals to the model, and
thus were the greatest contributors to the poor fit in both the diabetes and community
samples. Based on these results, the decision was made to eliminate the appetite gain
scales (IDAS Appetite Gain and the MEQ) and the Appetite Gain factor from the model.
In addition to the appetite gain scales, several other scales with large residuals
were identified and eliminated as well. These included: CES-D negative affect, CES-D
positive affect, Multifactorial Memory Questionnaire, MEQ (on the appetite loss factor as
well), HADS restlessness, and Epworth Sleepiness Scale.
Accordingly, Model 3 was created by eliminating the appetite gain variables
(MEQ & IDAS Appetite Gain) and these 6 scales from other factors (Dysphoria, Positive
80
Affect, Concentration Difficulties, Appetite Loss, Restlessness and Fatigue, respectively).
As seen in Table 10, the fit indices were significantly improved in this revised model.
Four of the 5 fit indices were in the adequate or excellent range from the community
sample, and 2 of the 5 fit indices were in the adequate or excellent range for the diabetes
sample; moreover, 2 additional fit indices were close to being adequate in the latter
sample, with only GFI appearing to be problematic.
Although this model appeared to provide an adequate fit for the data, several other
models were run to examine potential improvements in the model fit. Specifically,
standardized residuals were examined and markers contributing the largest residuals to
the model were eliminated. Model 4 is identical to Model 3 except that PANAS Guilt
and PANAS Self Assurance were eliminated from the Dysphoria and PA factors,
respectively. This resulted in slightly improved fit indices. Model 5 was based on Model
4 but also eliminated the PANAS Hostility scale from the Irritability factor. This
adjustment also lead to a modest improvement in fit indices. Similar steps were taken
with Model 6, which eliminated the MAACL-PA scale from the Positive Affect factor,
and Model 7, which eliminated IDAS Ill Temper from the Irritability factor. Again,
modest improvements in fit were seen for each of these subsequent model adjustments.
Although eliminating more and more factor indicators improved the fit slightly,
each adjustment also resulted in fewer degrees of freedom for the model, as well as
greater changes from the originally hypothesized model. Thus, the decision was made to
proceed with Model 3, which eliminates the Appetite Gain factor and related scales, as
well as the 6 other previously specified scales contributing the largest residuals to the
model. Consequently, the next sets of analyses were conducted using Model 3 as
81
specified in Table 16. Correlations among symptom factors for Model 3 may be seen for
both samples in Table 17. Factor loadings of this model for the diabetes and community
sample are in Tables 18 and 19, respectively.
Testing Model Constraints Within Samples
Using Model 3, further within sample tests were conducted in order to test
hypotheses 4a and 4b, that is, whether or not correlations between factors varied in
magnitude. As stated previously, instead of comparing every possible pair of
correlations, analyses were limited to a few select correlations. That is, the correlation
between Dysphoria and Irritability was compared to those between Dysphoria and (1)
Appetite Loss and (2) Positive Affect. Again, the Positive Affect factor was transformed
for these analyses given that the hypotheses concerned whether or not correlations varied
in magnitude, not sign. Two separate models were run constraining these pairs of
correlations to be equivalent with one another (e.g., rdysphoria/irritability = rdysphoria/appetite
loss) and fit indices were compared with those from the initial Model 3 in each sample.
First, a model with constraint 1 (rdysphoria/irritability = rdysphoria/appetite loss) was run
in each sample; the chi square difference was significant in the community sample (chi
square difference (1) = 17.33, p < .001), but not in the diabetes sample (chi square
difference (1) = .485, p = .486, ns). The correlations (as seen in Table 20) in the
community sample were .81 (rdysphoria/irritability) vs. .53 (rdysphoria/appetite loss) whereas in the
diabetes sample the corresponding values were .70 (rdysphoria/irritability) vs. .63
(rdysphoria/appetite loss). Next, the second constraint (rdysphoria/irritability = rdysphoria/low PA) was
run in each sample, with transformed correlations of .72 (rdysphoria/low PA) in each sample.
82
The difference in chi square was significant in both the community sample (chi square
difference (1) = 61.006, p < .001) and the diabetes sample (chi square difference (1) =
40.498, p < .001).
Thus, hypothesis 4a, comparing these symptom correlations within the
community sample, was confirmed. Constraining these pairs of correlations to be
equivalent significantly decreased the fit of the model, indicating that the correlation
between Dysphoria and Irritability (.81) was not equivalent to the correlations between
Dysphoria and Appetite Loss (.53) or Dysphoria and low Positive Affect (.72). However,
hypothesis 4b, which compares these same symptom correlations in the diabetes sample,
was not confirmed. Although the correlation between Dysphoria and Irritability (.70)
was somewhat higher than the correlation between Dysphoria and Appetite Loss (.63),
constraining these correlations to be equivalent did not significantly decrease the fit of
the model. In addition, constraining the correlation between Dysphoria and Irritability
(.70) to be equivalent to the correlation between Dysphoria and low Positive Affect (.72)
did significantly decrease the fit of the model, yet the difference between correlations was
not in the expected direction. That is, the correlation between Dysphoria and Positive
Affect was not predicted to be greater than that between Dysphoria and Irritability.
Testing for Sample Differences using
Confirmatory Factor Analysis
The last hypothesis (hypothesis 5) was tested in two steps. First, an adequate
fitting, common structure had to be determined for both groups by running an
unconstrained, multiple sample model and examining fit indices. The original hypothesis
for an adequate fitting multiple sample 9-factor model had to be adjusted based on earlier
83
failures to identify such a model within each sample. As stated previously, the Appetite
Gain factor was removed from single sample CFAs due to its significant contribution to a
poor model fit. Thus, hypothesis 5 was revised to test for the presence of an adequate
fitting 8-factor multiple sample model. As stated above, Model 3 was selected for final
analyses within each sample given its adequate fit indices, closeness to the hypothesized
model and greater degrees of freedom. This model was used to test the first step of
hypothesis 5 by running a multiple sample CFA of Model 3.
As seen in Table 10, this multiple sample CFA of Model 3 was found to have fit
indices in the excellent range for 2 out of 5 indices (SRMR and RMSEA) and in the
adequate range for one out of 5 indices (CFI). In addition, NFI (.893) was close to being
adequate. Thus, the multiple sample 8-factor CFA generally provided a good fit for the
data and confirmed this revised hypothesis. See Table 20 for symptom factor correlations
for this model in both samples. Factor loadings for the diabetes and community samples
are seen in Tables 21 and 22, respectively.
The second component of hypothesis 5 examined whether or not this common
model, when constrained to have equivalent factor correlations across both samples,
proved to be a worse fit for the data. The original hypothesis proposed that constraining
these factor correlations to be equivalent across samples would decrease the fit of the
model. Specifically, it was proposed that that factor correlations among some symptoms
would be higher among diabetes patients than among community adults. Thus, a
multiple sample CFA of Model 3 was run that constrained all 28 possible pairs of
correlations to be equivalent across samples. As seen in Table 10 (under Model 3,
Multisample Constr.), fit indices for this CFA largely were in the adequate to excellent
84
range. In order to compare the fit with the unconstrained multiple sample CFA, chi-
squares were compared; the difference in chi squares (8.175, 28 d.f.) was not significant.
Thus, contrary to hypotheses, constraining factor correlations to be equivalent across
groups did not reduce the fit of the model. This result indicates that factor correlations
were generally equivalent across the two samples. The presence of diabetes does not
appear to decrease or increase correlations among these 8 symptoms of depression and
anxiety when compared with a community sample. See Table 23 for symptom factor
correlations for this model and Tables 24 and 25 for factor loadings for this model in the
diabetes and community samples, respectively.
85
DISCUSSION
This study tested the replicability of structural models of depression and anxiety
symptoms among adults with diabetes and an age-matched community sample. The
purpose of this study was twofold. First, it helped to determine if those symptoms that
have been shown to be nonspecific or specific in nonmedical samples demonstrate similar
nonspecificity or specificity in a diabetes sample as well, as proposed by the integrative
model. Second, this study helped address the uncertainty surrounding overlapping
symptoms of depression/anxiety and diabetes. Symptoms such as fatigue, irritability,
concentration problems, psychomotor agitation, autonomic arousal, appetite gain and
appetite loss are at times considered reflections of diabetes rather than of depression or
anxiety. As stated previously, researchers have suggested that this leads to the under-
diagnosis of such disorders (Lustman et al., 1997; D.A. Clark et al., 1998), which can
have severe negative consequences for diabetes patients (Gonder-Frederick et al., 2002).
Thus, this study’s ultimate aim was to improve the identification and discrimination of
depression and anxiety disorders by examining the nature of several etiologically
ambiguous symptoms.
Three competing explanatory models were described for predicting and
interpreting results. First, the diabetes-related model suggested that those overlapping
symptoms of both diabetes and depression/anxiety would be more strongly related to the
presence of diabetes than to mood. Thus, the diabetes-related model suggests that
significant differences in the correlations among symptoms would emerge between
samples and that the overlapping symptoms mentioned above would be less related to
mood within the diabetes group. This model has been suggested to predominate in many
86
medical settings but was not predicted to be reflected in results from this study given
previous research examining symptom correlations among adults with diabetes (e.g.,
Lustman et al., 1992; Ciechanowski et al., 2003).
The second explanatory model hypothesized that the symptoms of interest would
relate similarly in both groups despite differences in health status, and was referred to as
the affect-related model. As described previously, this model is based on the integrative
hierarchical model, which has been validated in general population studies (Mineka et al.,
1998); it was predicted to be at least partially supported in this study given the general
replicability of structural models across various samples (e.g. Watson, 2005; O’Connor,
2002). The affect-related model predicted that the nonspecific symptoms of depression
and anxiety that also overlap with diabetes (e.g., irritability, concentration problems and
restlessness) would correlate strongly with one another and with mood. In addition, this
model predicted that the relatively specific symptom dimension (i.e. PA, fatigue and AA)
would demonstrate specificity in their correlations with other symptoms.
The third and final explanatory model has been referred to as the interaction
model and is based on results of a few studies (e.g., Lustman et al., 1992; D.A. Clark et
al., 1998) that have found that the presence of diabetes or medical conditions leads to
even higher correlations among symptom dimensions when compared with non-medical
samples. Thus, this model proposed that the presence of diabetes would lead to
significantly higher correlations among symptoms in the diabetes sample compared with
the community sample.
This study examined 5 specific hypotheses (generally based on the affect-related
model and the interaction model) to address the two goals described above. Hypothesis
87
1, based on higher prevalence rates of depression and anxiety among adults with diabetes,
proposed that the diabetes sample would have higher means than the community sample
on scales measuring dysphoria, irritability, concentration problems, appetite loss, appetite
gain, psychomotor agitation, fatigue and AA. This hypothesis was generally confirmed
across these symptom scales, with diabetes patients demonstrating significantly higher
means across most scales, with one exception: On measures of irritability, means were
not significantly different across the two groups. Hypothesis 2, based on the same
prevalence rate differences, proposed that the community adult sample would
demonstrate significantly higher means on positive affect scales, which also was
confirmed. As hypothesized, the adults with diabetes endorsed higher levels of
depression and anxiety symptoms and lower levels of positive affect compared with an
age-matched community sample, with the exception of irritability, which did not differ
significantly across the two groups.
Hypothesis 3 proposed that an adequate fitting 9-factor model of depression and
anxiety symptoms would be identified within each sample, based on the affect-related
explanatory model of depression/anxiety symptoms. This hypothesis was not entirely
confirmed, as one of the 9 symptoms (appetite gain) failed to emerge as a reliable factor;
adjustments were then made to this original factor model in order to test additional
hypotheses. Although appetite gain did not emerge, 8 of the 9 proposed symptoms were
able to be reliably modeled within each sample using the indicators (scales) included in
this study. The adequate fitting model, as described in Table 14, included the following 8
factors: Dysphoria, Appetite Loss, Irritability, Concentration Difficulties, Psychomotor
88
Agitation/Restlessness, Positive Affectivity, Fatigue and Autonomic Arousal. Thus, the
originally hypothesized model and proposed indicators proved to be reasonably accurate.
This broad support for Hypothesis 3 allowed for the examination of subsequent
hypotheses, yet also provided valuable information of its own. First, evidence supporting
this hypothesis suggests that the subsequent Hypothesis 5a, which proposed a well-fitting
common model for both groups, was more likely to be confirmed. Put differently,
identifying 8-factor models within each sample was essential to finding a common 8-
factor model. Second, the confirmation of Hypothesis 3 suggests that depression and
anxiety symptoms that overlap with diabetes symptoms (e.g., appetite loss, autonomic
arousal and concentration problems) can be reliably distinguished from one another and,
therefore, can be modeled as individual symptoms, rather than forming a broader,
diabetes-related factor. In other words, the identification of a well-fitting 8-factor model
in the diabetes sample suggests that these symptoms are not necessarily representative of
a more heterogeneous phenomenon such as hyperglycemia, which, as was discussed in
the Introduction, can cause many of the 8 modeled symptoms. Thus, this finding
provides initial support for the affect-related model of these overlapping symptoms,
rather than supporting the diabetes-related model of symptoms.
Hypothesis 4 tested specific aspects of the integrative model by constraining pairs
of correlations among symptom factors to be equivalent with one another within each
sample. Specifically, Hypothesis 4 proposed that the correlation between Dysphoria and
Irritability would not be equivalent to the correlations between Dysphoria and Positive
Affect, Dysphoria and Appetite Loss and Dysphoria and Appetite Gain, given that 1)
Dysphoria and Irritability are both components of the broader factor of negative affect,
89
whereas 2) Appetite Loss, Appetite Gain and Positive Affect are distinct and relatively
specific symptoms of depression (Watson et al. 1995).
Given that Appetite Gain did not emerge as a reliable factor, the comparison
between Dysphoria/Irritability vs. Dysphoria/Appetite Gain was not carried out in either
sample; consequently, analyses were limited to comparisons of the 2 other pairs of
correlations: Dysphoria/Irritability vs. 1) Dysphoria/(low) Positive Affect and 2)
Dysphoria/Appetite Loss. Hypothesis 4 was confirmed in community sample but,
contrary to expectations, was not confirmed in the diabetes sample. Results indicated
that constraining the correlations between Dysphoria/Irritability vs. 1) Dysphoria/(low)
Positive Affect and 2) Dysphoria/Appetite Loss to be equivalent in the community
sample significantly reduced the fit of the model. Examination of the correlation matrix
(Table 15) revealed that the correlation between Dysphoria and Irritability was greater
than that between Dysphoria and (low) Positive Affect and Dysphoria and Appetite Loss
in this group. These results provide support for the integrative model within the
community sample by indicating a stronger correlation between components of negative
affect than between Dysphoria and the relatively specific symptoms of Positive Affect
and Appetite Loss.
However, in the diabetes sample, this same pattern of results did not emerge.
Constraining the correlations between Dysphoria/Irritability and Dysphoria/Appetite Loss
to be equivalent did not significantly reduce the fit of the model, suggesting that these
correlations are not significantly different from one another. Constraining the
correlations between Dysphoria/Irritability and Dysphoria/(low) Positive Affect to be
equivalent with one another did significantly reduce the fit of the model. However, an
90
examination of the correlation matrix (Table 15) indicates that the correlation between
Dysphoria and (low) Positive Affect actually was greater than the correlation between
Dysphoria and Irritability in this sample.
One possible explanation for the difference between samples in the equivalence of
the Dysphoria/Irritability vs. Dysphoria/Appetite Loss is the difference in sample size
between the two groups. The community sample is substantially larger than the diabetes
sample (n = 380 and n = 226, respectively); therefore, analyses in this group had more
power to detect significant differences in the chi-square. However, it is unclear why the
Dysphoria/(low) Positive Affect correlation was significantly greater in the diabetes
sample relative to the Dysphoria/Irritability correlation. One may initially assume that
this is related to differences in the overall magnitude of symptom correlations, as
hypothesized (Hypothesis 5b) based on the interaction model. However, as discussed
below, subsequent analyses testing Hypothesis 5b revealed that the two samples had
generally equivalent correlations across all symptom factors. This difference between
samples may reflect a unique characteristic of this particular diabetes sample or could
indicate that Positive Affect is more strongly related to Dysphoria among adults with
diabetes. Addressing this issue will require further research to examine the replicability
of this finding.
The final set of analyses (Hypotheses 5a and 5b) tested whether or not a well-
fitting common model would emerge; as seen in Table 10, an adequate fitting
multisample 8-factor model was found. Thus, the presence (or absence) of diabetes did
not affect the replicability of the 8-factor model in this study. Contrary to the diabetes-
related model of the 6 overlapping symptoms of depression and anxiety (Appetite Loss,
91
Fatigue, Irritability, Concentration Difficulties, Restlessness, and Autonomic Arousal),
the presence of diabetes did not alter the structure of these symptoms when compared
with an age-matched community sample. This finding provides support for the affect-
related model of depression and anxiety symptoms, suggesting that regardless of the
presence of the diabetes, these overlapping symptoms have a similar structure and form
relatively distinct yet related symptoms.
The second aspect of this set of analyses (Hypothesis 5b) tested whether or not
constraining the 28 factor correlations of the 8-factor model to be equivalent across
samples significantly reduced the fit of the model. It was hypothesized, based on the
interaction model, that results may reveal higher correlations among these symptoms in a
diabetes sample, given the greater prevalence of depression and anxiety in diabetes
samples and the larger general distress factor found in previous research (i.e., D.A. Clark
et al., 1998). Therefore, it was expected that constraining equivalence across samples
would lead to a reduced fit in the model. Contrary to expectations, this hypothesis was
not confirmed and constraining equivalence in correlations across samples did not reduce
the fit of the model. Thus, results indicate that correlations between these 8 symptoms of
depression and anxiety are essentially equivalent with one another in these two samples.
This finding suggests that the presence of diabetes does not affect the strength of
correlations among these symptoms and provides further support for the affect-related
model of depression and anxiety symptoms.
This finding, although contrary to hypotheses, does provide overall support for
the one of study’s primary objectives. That is, this equivalence in correlations indicates
that these 6 overlapping symptoms (Appetite Loss, Fatigue, Irritability, Concentration

92
Difficulties, Restlessness, and Autonomic Arousal) do not appear to be significantly
affected by the presence of diabetes. This suggests that these symptoms, when present
among adults with diabetes, should not be immediately attributed to the disease process
(i.e., hyperglycemia or hypoglycemia). Rather, as indicated by the results of this study,
these 6 overlapping symptoms are as strongly correlated with mood in the diabetes
sample as in the age-matched community sample, with correlations with Dysphoria
ranging from .59 to .81 in the diabetes sample (M = .69), versus .59 to .82 in the
community sample (M = .71).
In examining the factor correlations for the final model (Model 3, Table 15),
certain patterns can be seen across the two samples that provide some support for the
integrative model. For example, Dysphoria demonstrates the highest correlations on
average with the other factors in the diabetes and community samples, with mean
coefficients of .70 and .73, respectively. Cognitive Difficulties demonstrates the second
highest correlations on average across the two groups, with a mean correlation of .67 with
other symptoms in the diabetes sample, and a corresponding value of .72 in the
community sample. This observation makes sense given the broad, relatively nonspecific
negative affect component of both Dysphoria and Cognitive Difficulties, contributing to
their overall higher correlations with the other symptoms of depression and anxiety, as
would be predicted based on the integrative model (Mineka et al., 1998). Another
commonality between samples is the generally lower correlations demonstrated between
the Appetite Loss and Positive Affect factors and the other 6 symptom factors. Average
correlations with Appetite Loss were .50 and .49 in the diabetes and community samples,
respectively. For Positive Affect, average correlations were .51 and .53 in the diabetes
93
and community samples, respectively. Thus, these symptoms demonstrated relative
specificity, as would be predicted based on Mineka et al. (1998) and Watson et al. (2007).
Irritability and Fatigue had high correlations on average with the other symptoms, yet
demonstrated their highest correlations with Dysphoria in both samples, with correlations
of .76 and .78 in the diabetes and community samples, respectively (although Fatigue
also correlated .78 with Cognitive Difficulties in the community sample). Restlessness
demonstrated generally high correlations, particularly with other nonspecific symptoms
such as Dysphoria and Cognitive Difficulties, yet also demonstrated high correlations
with Autonomic Arousal in both samples.
Thus, certain aspects of the integrative model appeared to have replicated in this
study in both samples, such as the nonspecificity of Dysphoria and Cognitive Difficulties,
and the relative specificity of Appetite Loss and Positive Affect. However, other aspects
of the integrative model were not as clearly replicated in both samples. In particular,
Irritability was not as clear an indicator of a broad negative affect factor as would have
been expected based on the integrative model. Irritability correlated .65 on average with
other symptoms in the community sample, but only .52 on average in the diabetes
sample, which is close to the average correlations for Positive Affect (.51) and Appetite
Loss (.50). In addition, Autonomic Arousal, thought to be relatively specific, proved to
correlate fairly strongly with the other symptoms and had a relatively high average
correlation in both the diabetes (.60) and community (.64) samples. Fatigue also proved
to be relatively nonspecific and had an average correlation of .64 and .65 in the diabetes
and community samples, on average. In summary, Irritability proved to be somewhat
less related to a broad negative affect factor in the diabetes sample, and Autonomic
94
Arousal and Fatigue proved to be more nonspecific than expected in both samples.
Although several characteristics of the integrative model were replicated, a few
symptoms did not relate with other symptoms depression and anxiety as expected.
Importantly, however, all symptoms correlated strongly with Dysphoria in both samples.
Although previous research also has suggested that these overlapping symptoms
are more correlated with mood than with diabetes (e.g., Lustman et al., 1992;
Ciechanowski et al., 2003), results from this study improve on earlier studies in a number
of ways. First, this study included reliable, multiple-item measures of the individual
symptoms of interest, which allowed for greater validity and reliability of the
measurement model, as well as greater assurance in its findings. A second significant
and related improvement is the examination of symptoms individually without
overlapping content across distinct constructs. In other words, this study removed
relatively heterogeneous content from broad measures of “depression” such as the BDI.
In addition, each symptom was modeled with a minimum of two separate
indicators/scales. Third, the use of structural models to measure the symptoms of interest
not only improved the robustness of measurement but also allowed for the quantification
of differences (or lack thereof) between samples in the structure of these symptoms.
Fourth, this study included an age-matched comparison group of 380 community
adults, which improved the interpretability of results. Although significant differences
emerged between the samples on demographic variables other than age (see below for
more discussion of this topic), the results indicated replicability of the structural model
and factor correlations across samples, emphasizing the overall similarity of these
symptoms despite demographic differences between groups. Fifth, this study examined a
95
very practical question (i.e., does depression/anxiety differ in the presence of diabetes?)
within the theoretical framework of the integrative model. This theoretical model
emphasizes the importance of considering the constructs of depression and anxiety as
inherently related, as well as highlighting the relative specificity of distinct symptoms of
depression and anxiety. Finally, this study represents an improvement upon previous
research by attempting to model several symptoms of interest that are specifically related
to hypo- or hyperglycemia. Although Appetite Gain did not emerge as a reliable factor,
all 6 other symptoms of interest were modeled and replicated across groups. The
inclusion of these design characteristics helps this study make a significant contribution
to our understanding of depression and anxiety symptoms among diabetes patients and
increases confidence in the results.
The major findings from this study are the following. First, 8 distinct symptoms
of depression and anxiety were able to be reliably measured within each sample. Second,
one element of the integrative model, the higher correlation among symptoms that share a
common underlying factor (Negative Affect), was confirmed within the community
sample, but not in the diabetes sample. Third, a well-fitting 8-factor common model
emerged, indicating that the structure of depression and anxiety symptoms did not
significantly vary across these two distinct samples. Fourth, and possibly most
importantly, correlations among symptom factors did not differ significantly across the
two groups. In other words, the correlations between the 6 overlapping symptoms (e.g.
Fatigue, Autonomic Arousal) and Dysphoria were not significantly different across the
two samples. In this regard, it is noteworthy that these similar correlations were found
despite the presence of diabetes and the diabetes sample’s generally high levels of
96
hyperglycemia (as indicated by overall high means of HbA1c), as well as higher levels of
general medical conditions compared with the community sample. Thus although the
two samples were significantly different on a number of medical indicators, these
differences did not impact the strength of correlations across samples.
Limitations
One limitation of the current study is the significant demographic differences
between groups, with the community sample being predominantly female, and also
having higher education and income levels. These differences may have emerged as a
result of the specific recruitment methods undertaken for this study. Specifically, 20% of
diabetes patients were recruited from the VA hospital, which resulted in a smaller
percentage of female participants relative to the community sample, and may have
contributed to other socioeconomic differences between the groups. Similarly, 27% of
diabetes patients were recruited from the University of Iowa Hospitals and Clinics Family
Practice Clinic, which serves low income patients with Medicaid and Medicare
healthcare coverage. In addition, the community sample was recruited in part through
announcements to employees of the University of Iowa, which may also have contributed
to the socioeconomic differences between groups. Finally, the significant differences in
health status, as seen in Table 5, may also have contributed to the economic differences
between samples, given that individuals with multiple medical problems may be less
likely to be employed. These demographic differences could have proven problematic if
significant differences emerged in the CFAs between the two samples. Such differences
could then have been interpreted as either reflections in differences in disease status,
demographics or both. However, as stated previously, the measurement model proved
97
reliable and robust across the two groups despite both the planned and unplanned
differences between samples.
In addition, it should be noted that the structural invariance between these two
groups is consistent with previous research establishing factor structure replicability
across groups despite clinical and demographic differences. For example, O’Connor
(2002) conducted a statistical review comparing factor structures between clinical and
nonclinical samples for a number of personality and psychopathology inventories. He
concluded that structures were highly similar in terms of both the number of factors that
emerged as well as factor patterns across both types of samples. Similarly, Watson et al.
(1995) replicated the tripartite model of depression and anxiety using the MASQ across
five different samples, including college students, community adults and male patients.
The factor structure of the Anxiety Sensitivity Index (Peterson & Reiss, 1992) was tested
across samples of male and female students (Stewart, Taylor and Baker, 1997) and the
results indicated that both lower- and higher-order structures replicated well across
gender groups. Finally, V.A. Clark, Aneshensel and Frerichs (1981) compared the factor
structure of the CES-D across male and female community adults and found that a similar
underlying depression dimension emerged in both sexes. Thus, the findings from the
current study fit in well with previous research that has identified structural invariance
across samples that vary in clinical and demographic characteristics.
A second limitation of the current study is the failure to model appetite gain in the
main analyses. This symptom can be related to depression/anxiety as well as diabetes
and can also be of clinical concern to patients and providers when present. Thus,
improving our understanding of this symptom represents an important goal at a

98
theoretical as well as practical level. Appetite gain’s failure to emerge as a reliable factor
is likely due at least in part to the limited availability of measures of this symptom. Thus,
future research would benefit from the development and subsequent inclusion of
additional valid measures of appetite gain.
Additional limitations inherent to the design of the present study include the
exclusive use of self-report measures as well as the use of cross-sectional data. Including
multimodal assessment (e.g., interview, peer-report) of the symptoms of interest would
potentially strengthen the measurement model considerably in future research. Assessing
the symptoms of interest with more than one method would allow for a potentially more
valid modeling of the symptoms as factors. Assessing depression and anxiety symptoms
at multiple time points would also strengthen the findings of this study in a number of
ways. First, longitudinal comparisons of structural models would allow for a test of the
replicability of the models within the same samples across time. Second, collecting this
data at multiple time points would allow for an examination of potential changes in the
symptom structure as the disease progresses, improves or remains stable. For example,
longitudinal assessment would allow for a test of potential differences in symptom
structure with changes in HbA1c levels and blood glucose control. Although the current
study provides a strong test of the structure of these symptoms of depression and anxiety,
conclusions from this study are limited by the use of cross-sectional and self-report data
only.
Future Directions
The research questions of this study could be expanded in future research in a
number of directions. First, this study used a combination of T1DM and T2DM patients.
99
Although this study provides additional support for the general robustness of structural
models, testing for potential differences across different types of diabetes patients would
be an obvious extension of this project. Future research that examined similar issues
comparing these two groups would likely be of considerable interest to diabetes
researchers. As stated in the Results section, this sample of patients had a range of
HbA1c values, and, on average, HbA1c values were high. Future research could extend
this project by comparing structural models across participants with different HbA1c lab
results. This design would allow any potential effects of hyper- or hypoglycemia on the
symptoms of interest to emerge and would likely be of interest to diabetes researchers as
well.
This study examined the nature of depression and anxiety symptoms among
adults with diabetes and a natural extension of this project would be to examine this issue
in adults with other medical conditions. Several other medical conditions present a
similar dilemma of etiologically ambiguous symptoms such as various types of cancer,
coronary artery disease, hepatitis C, HIV, multiple sclerosis and chronic fatigue
syndrome. The structural approach taken in this study could be applied to other samples
of medical patients to address the same issue and determine whether or not the nature of
these overlapping depression and anxiety symptoms is affected by the presence of
physical disease.
An important clinical extension of this project is to examine the impact of these
findings on patient outcomes. In other words, it would be helpful to examine the current
clinical practice in the identification of depression and anxiety among diabetes patients to
determine how often overlapping symptoms are identified (or disqualified) as indicators
100
of depression/anxiety. Results of this study suggest that depression and anxiety may be
underdiagnosed in diabetes patients, particularly among those with poorly controlled
diabetes. In addition, these results have implications for the DSM-IV medical exclusion
rule that excludes a symptom criterion from a potential psychiatric diagnosis if it is due to
the physiological effects of a medical condition. That is, the results of this study suggest
that although these overlapping symptoms can be due to physiological changes associated
with diabetes (i.e., hyper- or hypoglycemia), they nevertheless are strongly related to
mood and distress. These findings therefore suggest that such symptoms should not be
excluded from a diagnosis of depression or anxiety for adults with diabetes. Along these
lines, researchers could examine whether or not including these etiologically ambiguous
symptoms in the diagnosis of depression/anxiety leads to improved identification of these
disorders among diabetes patients. Similarly, it would be interesting to determine if
informing medical providers of the connection between these overlapping symptoms and
dysphoria would lead to an increase in screening for depression/anxiety when a patient
presents with, for example, complaints of fatigue or irritability. If such symptoms are
often attributed to diabetes rather than to mood, results of this study could help change
clinical practice and improve patient outcomes.

101
APPENDIX A: TABLES

102
Table A1 Specified indicators of the factor model to be tested ________________________________________________________________________
Non-Specific Symptoms of Depression and Anxiety & Corresponding Measures
1. Dysphoria – 57 items
a. PANAS-X Sadness – 5 items
b. PANAS-X Guilt – 6 items
c. IDAS Dysphoria (minus 3 agitation & concentration items) – 7 items
d. MASQ GD – Depression – 12 items
e. BDI (minus 8 items of fatigue, appetite change, concentration problems, loss
of energy, irritability and psychomotor agitation) – 15 items
f. CES-D (minus 4 PA items, 1 appetite loss item, 1 concentration problems
item, and 2 repeating items) – 12 items
2. Loss of appetite* - 13 items
a. IDAS Appetite Loss (plus 2 added items) - 5 items
b. Motivation to Eat – 4 items
c. CES-D appetite items (plus 2 new items) – 4 items
3. Irritability* - 32 items
a. IDAS Ill Temper – 5 items
b. PANAS-X Hostility – 6 items
c. MAACL-R Hostility (minus 5 repeating items) - 10 items
d. POMS Anger/Hostility (minus 1 repeating items) – 11 items
4. Concentration difficulties* - 67 items
a. Indecisiveness scale (abbreviated) – 12 items
b. Cognitive Failures Questionnaire – 25 items
c. Multifactorial Memory Questionnaire, Ability scale – 20 items
d. CES-D items (plus 2 new items) – 3 items
e. IDAS Concentration items – 7 items
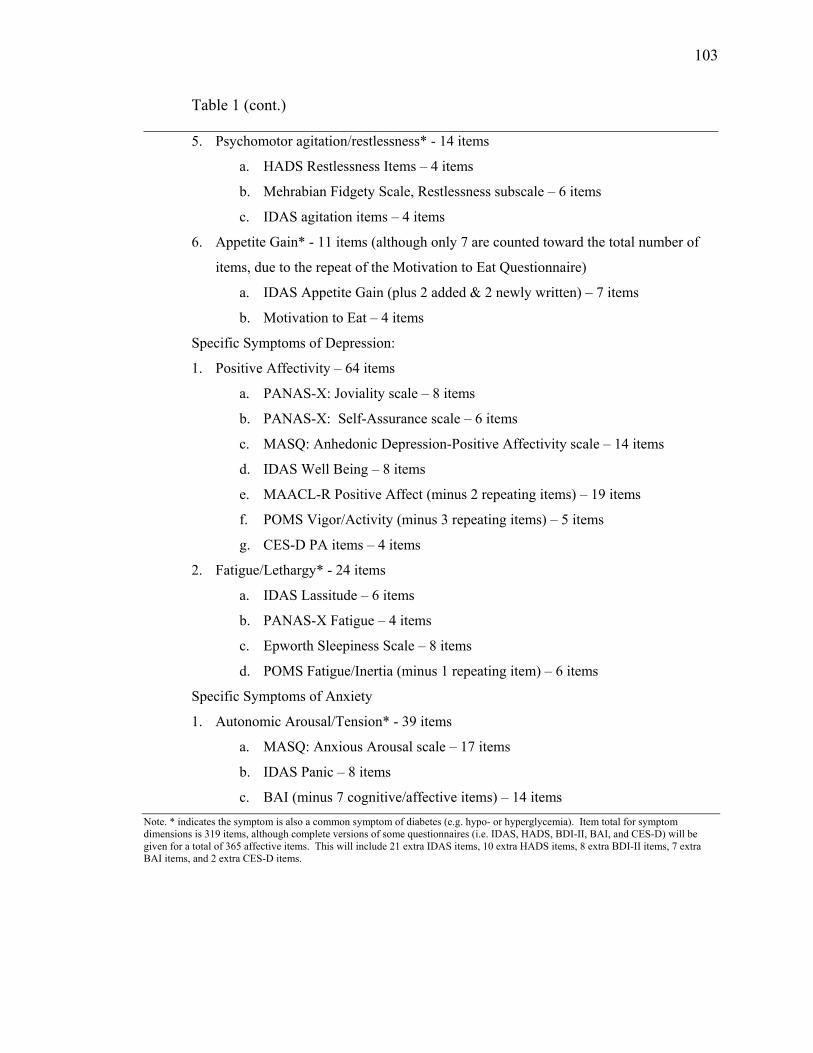
103
Table 1 (cont.) ________________________________________________________________________
5. Psychomotor agitation/restlessness* - 14 items
a. HADS Restlessness Items – 4 items
b. Mehrabian Fidgety Scale, Restlessness subscale – 6 items
c. IDAS agitation items – 4 items
6. Appetite Gain* - 11 items (although only 7 are counted toward the total number of
items, due to the repeat of the Motivation to Eat Questionnaire)
a. IDAS Appetite Gain (plus 2 added & 2 newly written) – 7 items
b. Motivation to Eat – 4 items
Specific Symptoms of Depression:
1. Positive Affectivity – 64 items
a. PANAS-X: Joviality scale – 8 items
b. PANAS-X: Self-Assurance scale – 6 items
c. MASQ: Anhedonic Depression-Positive Affectivity scale – 14 items
d. IDAS Well Being – 8 items
e. MAACL-R Positive Affect (minus 2 repeating items) – 19 items
f. POMS Vigor/Activity (minus 3 repeating items) – 5 items
g. CES-D PA items – 4 items
2. Fatigue/Lethargy* - 24 items
a. IDAS Lassitude – 6 items
b. PANAS-X Fatigue – 4 items
c. Epworth Sleepiness Scale – 8 items
d. POMS Fatigue/Inertia (minus 1 repeating item) – 6 items
Specific Symptoms of Anxiety
1. Autonomic Arousal/Tension* - 39 items
a. MASQ: Anxious Arousal scale – 17 items
b. IDAS Panic – 8 items
c. BAI (minus 7 cognitive/affective items) – 14 items Note. * indicates the symptom is also a common symptom of diabetes (e.g. hypo- or hyperglycemia). Item total for symptom dimensions is 319 items, although complete versions of some questionnaires (i.e. IDAS, HADS, BDI-II, BAI, and CES-D) will be given for a total of 365 affective items. This will include 21 extra IDAS items, 10 extra HADS items, 8 extra BDI-II items, 7 extra BAI items, and 2 extra CES-D items.
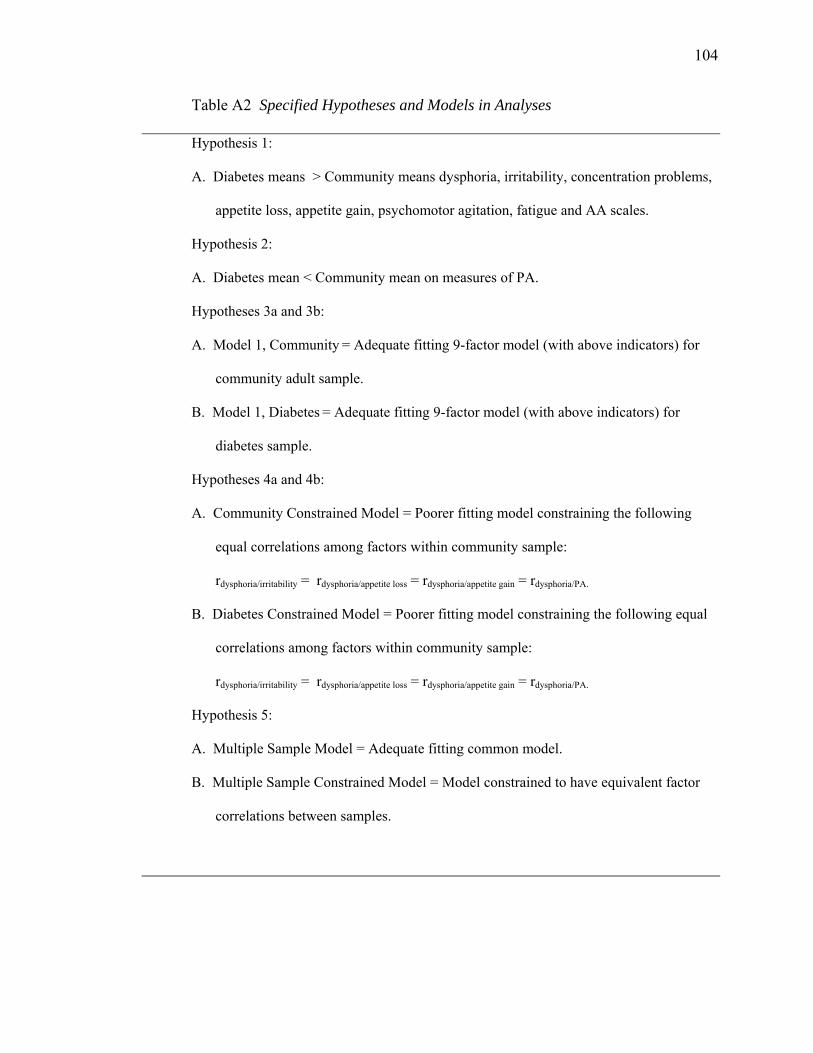
104
Table A2 Specified Hypotheses and Models in Analyses Hypothesis 1:
A. Diabetes means > Community means dysphoria, irritability, concentration problems,
appetite loss, appetite gain, psychomotor agitation, fatigue and AA scales.
Hypothesis 2:
A. Diabetes mean < Community mean on measures of PA.
Hypotheses 3a and 3b:
A. Model 1, Community = Adequate fitting 9-factor model (with above indicators) for
community adult sample.
B. Model 1, Diabetes = Adequate fitting 9-factor model (with above indicators) for
diabetes sample.
Hypotheses 4a and 4b:
A. Community Constrained Model = Poorer fitting model constraining the following
equal correlations among factors within community sample:
rdysphoria/irritability = rdysphoria/appetite loss = rdysphoria/appetite gain = rdysphoria/PA.
B. Diabetes Constrained Model = Poorer fitting model constraining the following equal
correlations among factors within community sample:
rdysphoria/irritability = rdysphoria/appetite loss = rdysphoria/appetite gain = rdysphoria/PA.
Hypothesis 5:
A. Multiple Sample Model = Adequate fitting common model.
B. Multiple Sample Constrained Model = Model constrained to have equivalent factor
correlations between samples.
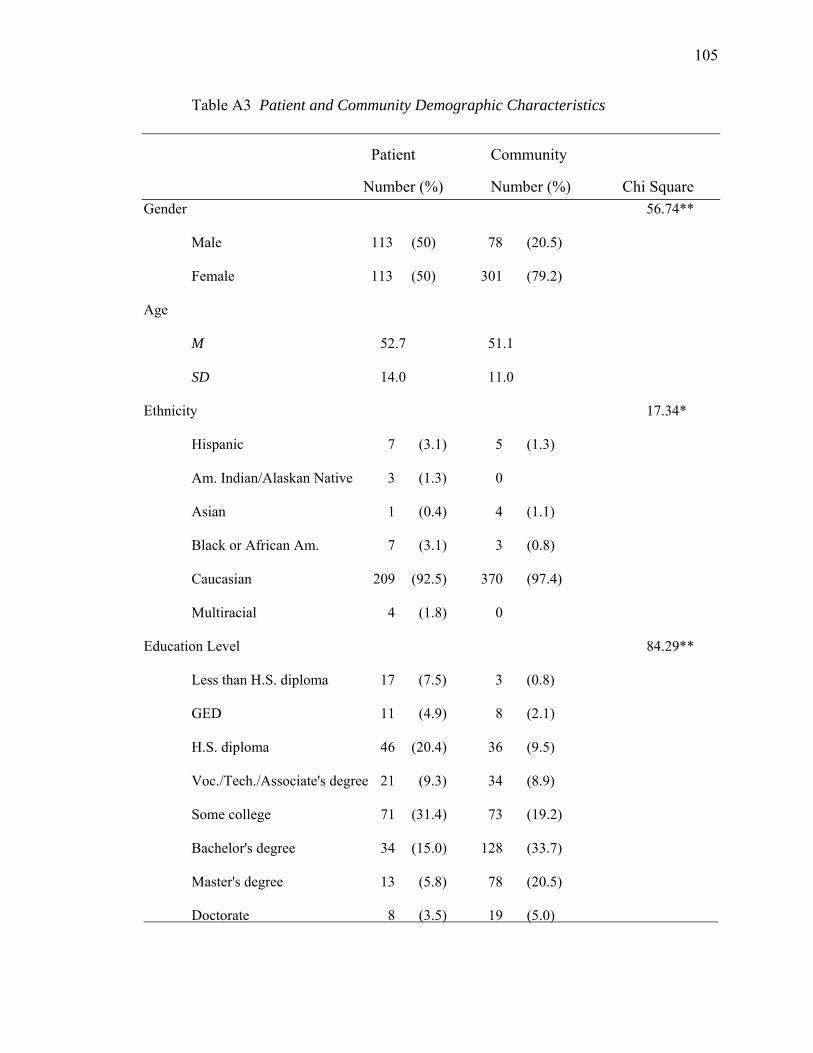
105
Table A3 Patient and Community Demographic Characteristics
Patient Community
Number (%) Number (%) Chi Square Gender 56.74**
Male 113 (50) 78 (20.5)
Female 113 (50) 301 (79.2)
Age
M 52.7 51.1
SD 14.0 11.0
Ethnicity 17.34*
Hispanic 7 (3.1) 5 (1.3)
Am. Indian/Alaskan Native 3 (1.3) 0
Asian 1 (0.4) 4 (1.1)
Black or African Am. 7 (3.1) 3 (0.8)
Caucasian 209 (92.5) 370 (97.4)
Multiracial 4 (1.8) 0
Education Level 84.29**
Less than H.S. diploma 17 (7.5) 3 (0.8)
GED 11 (4.9) 8 (2.1)
H.S. diploma 46 (20.4) 36 (9.5)
Voc./Tech./Associate's degree 21 (9.3) 34 (8.9)
Some college 71 (31.4) 73 (19.2)
Bachelor's degree 34 (15.0) 128 (33.7)
Master's degree 13 (5.8) 78 (20.5)
Doctorate 8 (3.5) 19 (5.0)
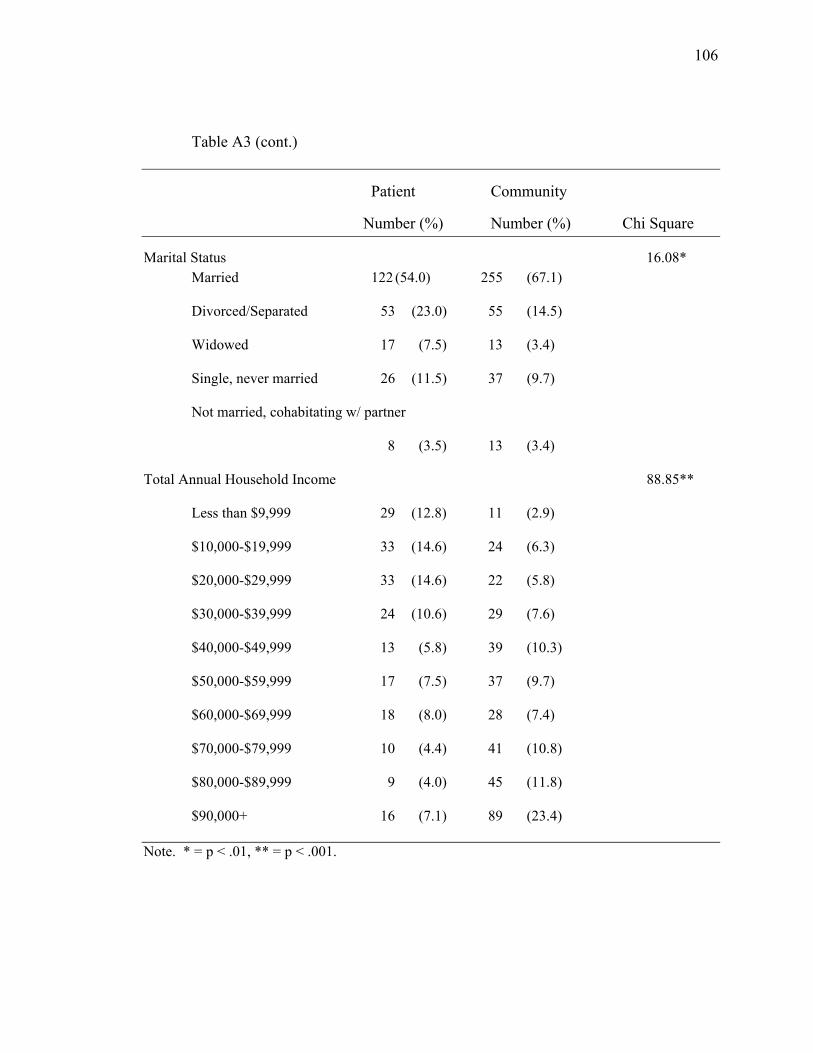
106
Table A3 (cont.)
Patient Community
Number (%) Number (%) Chi Square
Marital Status 16.08* Married 122 (54.0) 255 (67.1)
Divorced/Separated 53 (23.0) 55 (14.5)
Widowed 17 (7.5) 13 (3.4)
Single, never married 26 (11.5) 37 (9.7)
Not married, cohabitating w/ partner
8 (3.5) 13 (3.4)
Total Annual Household Income 88.85**
Less than $9,999 29 (12.8) 11 (2.9)
$10,000-$19,999 33 (14.6) 24 (6.3)
$20,000-$29,999 33 (14.6) 22 (5.8)
$30,000-$39,999 24 (10.6) 29 (7.6)
$40,000-$49,999 13 (5.8) 39 (10.3)
$50,000-$59,999 17 (7.5) 37 (9.7)
$60,000-$69,999 18 (8.0) 28 (7.4)
$70,000-$79,999 10 (4.4) 41 (10.8)
$80,000-$89,999 9 (4.0) 45 (11.8)
$90,000+ 16 (7.1) 89 (23.4)
Note. * = p < .01, ** = p < .001.
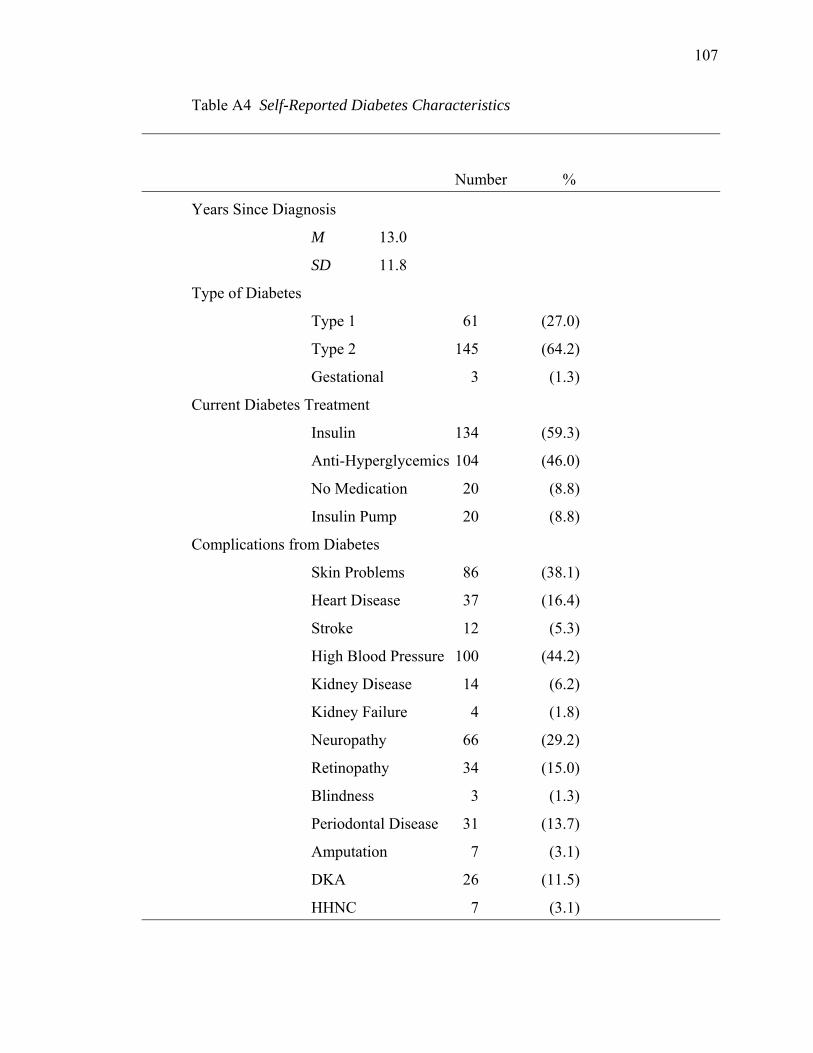
107
Table A4 Self-Reported Diabetes Characteristics
Number %
Years Since Diagnosis
M 13.0
SD 11.8
Type of Diabetes
Type 1 61 (27.0)
Type 2 145 (64.2)
Gestational 3 (1.3)
Current Diabetes Treatment
Insulin 134 (59.3)
Anti-Hyperglycemics 104 (46.0)
No Medication 20 (8.8)
Insulin Pump 20 (8.8)
Complications from Diabetes
Skin Problems 86 (38.1)
Heart Disease 37 (16.4)
Stroke 12 (5.3)
High Blood Pressure 100 (44.2)
Kidney Disease 14 (6.2)
Kidney Failure 4 (1.8)
Neuropathy 66 (29.2)
Retinopathy 34 (15.0)
Blindness 3 (1.3)
Periodontal Disease 31 (13.7)
Amputation 7 (3.1)
DKA 26 (11.5)
HHNC 7 (3.1)

108
Table A4 (cont.)
Number %
Days of Missed Work (past 2 mo.s)
M 1.97
SD 9.43
Days of Hospitalization (past 2 mo.s)
M 0.19
SD 1.11
Number of Health Care Visits (past 2 mo.s)
M 1.12
SD 1.08
Days Since Most Recent HbA1c
M 36.6
SD 72.9
HbA1c Lab Result
< 6.0 25 (11.1)
6.0-7.0 67 (29.6)
7.1-8.0 52 (23.0)
> 8.0 65 (28.8)
M 7.7
SD 1.8
Range 5.0-14.3 Note. N = 226 diabetes patients.

109
Table A5 Self-Reported Medical Conditions
Patient Community Cohen’s
Condition Number % Number % d
Heart Disease 58** (25.7) 12 (3.2) .72
Treatment 53** (23.5) 11 (2.9) 1.02
High Blood Pressure 150** (66.4) 57 (15.0) 1.11
Treatment 136** (60.2) 54 (14.2) 1.24
High Cholesterol 142** (62.8) 84 (22.1) .87
Treatment 111** (49.1) 44 (11.6) 1.08
Lung Disease/Problems 35* (15.5) 34 (8.9) .22
Treatment 32* (14.2) 32 (8.4) .39
Stroke 18** (8.0) 6 (1.6) .31
Treatment 17** (7.5) 4 (1.1) .54
Ulcer/Stomach Disease 44** (19.5) 20 (5.3) .49
Treatment 42** (18.6) 21 (5.5) .64
Kidney Disease 17** (7.5) 2 (0.5) .40
Treatment 16** (7.1) 3 (0.8) .52
Liver Disease 10** (4.4) 2 (0.5) .21
Treatment 4** (1.8) 1 (0.3) .30
Cancer (past 3 yrs.) 14* (6.2) 7 (1.8) .22
Treatment 15** (6.6) 6 (1.6) .40
Depression 85** (37.6) 100 (26.3) .26
Treatment 67** (29.6) 67 (17.6) .50
Anxiety 53 (23.5) 80 (21.1) .07
Treatment 40 (17.7) 43 (11.3) .38
Arthritis 74 (32.7) 101 (26.6) .13
Treatment 39* (17.3) 54 (14.2) .21 Note. N = 226 diabetes patients, 380 community adults. Mean differences between samples significant * p<.05, ** p<.01.

110
Table A6 Self-Reported Diabetes Symptoms from SCPO
Patient Community Cohen’s
Item Mean SD Mean SD d
1. Felt abnormally thirsty 2.50** (1.21) 1.74 (0.92) .72
2. Had blurred vision 1.96** (1.09) 1.36 (0.77) .64
3. Passed a lot of water 2.70** (1.24) 2.01 (1.11) .59
4. Felt unusually hungry 2.33** (1.12) 1.90 (0.95) .42
5. Felt shaky 1.72** (0.88) 1.31 (0.68) .53
6. Cold hands & feet 2.31** (1.30) 2.02 (1.10) .24
7. Felt sleepy during day 2.84** (1.22) 2.42 (1.04) .37
8. Feeling pins & needles 2.03** (1.27) 1.33 (0.75) .68
9. Felt faint, fainted, passed out 1.27* (0.59) 1.18 (0.52) .18
Note. N = 222-220 diabetes patients, 382-381 community adults. * = p <.05, ** = p< .01.
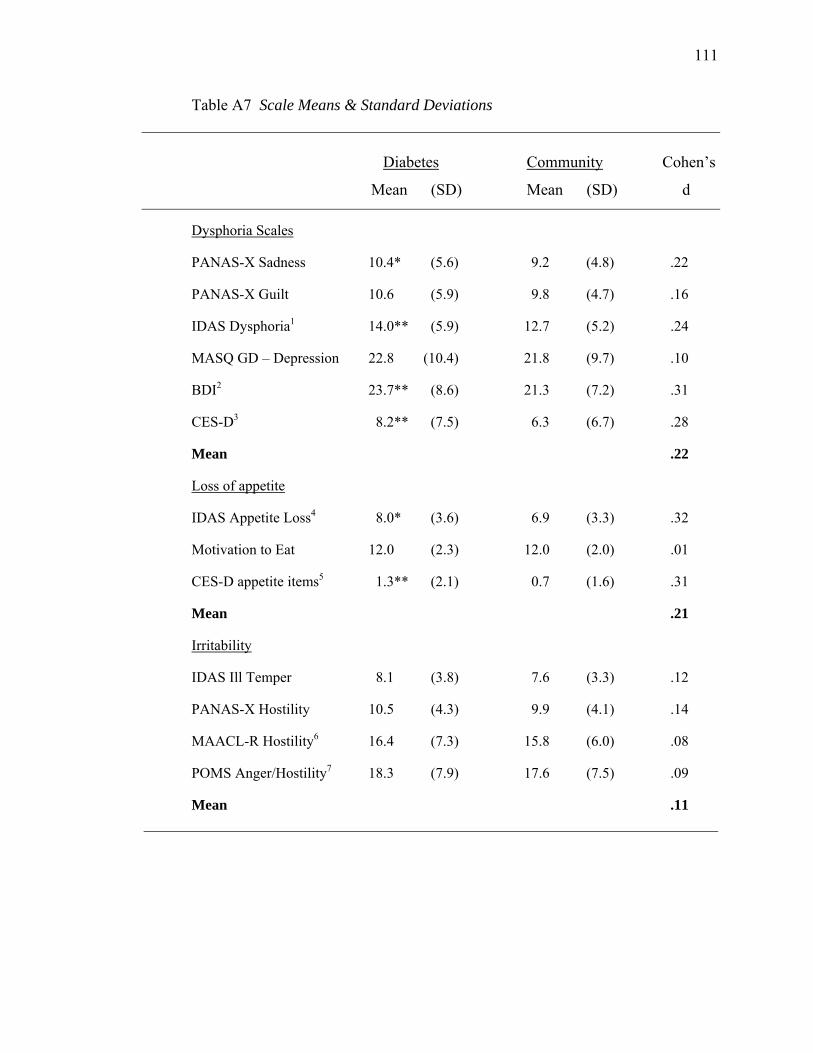
111
Table A7 Scale Means & Standard Deviations
Diabetes Community Cohen’s
Mean (SD) Mean (SD) d
Dysphoria Scales
PANAS-X Sadness 10.4* (5.6) 9.2 (4.8) .22
PANAS-X Guilt 10.6 (5.9) 9.8 (4.7) .16
IDAS Dysphoria1 14.0** (5.9) 12.7 (5.2) .24
MASQ GD – Depression 22.8 (10.4) 21.8 (9.7) .10
BDI2 23.7** (8.6) 21.3 (7.2) .31
CES-D3 8.2** (7.5) 6.3 (6.7) .28
Mean .22
Loss of appetite
IDAS Appetite Loss4 8.0* (3.6) 6.9 (3.3) .32
Motivation to Eat 12.0 (2.3) 12.0 (2.0) .01
CES-D appetite items5 1.3** (2.1) 0.7 (1.6) .31
Mean .21
Irritability
IDAS Ill Temper 8.1 (3.8) 7.6 (3.3) .12
PANAS-X Hostility 10.5 (4.3) 9.9 (4.1) .14
MAACL-R Hostility6 16.4 (7.3) 15.8 (6.0) .08
POMS Anger/Hostility7 18.3 (7.9) 17.6 (7.5) .09
Mean .11
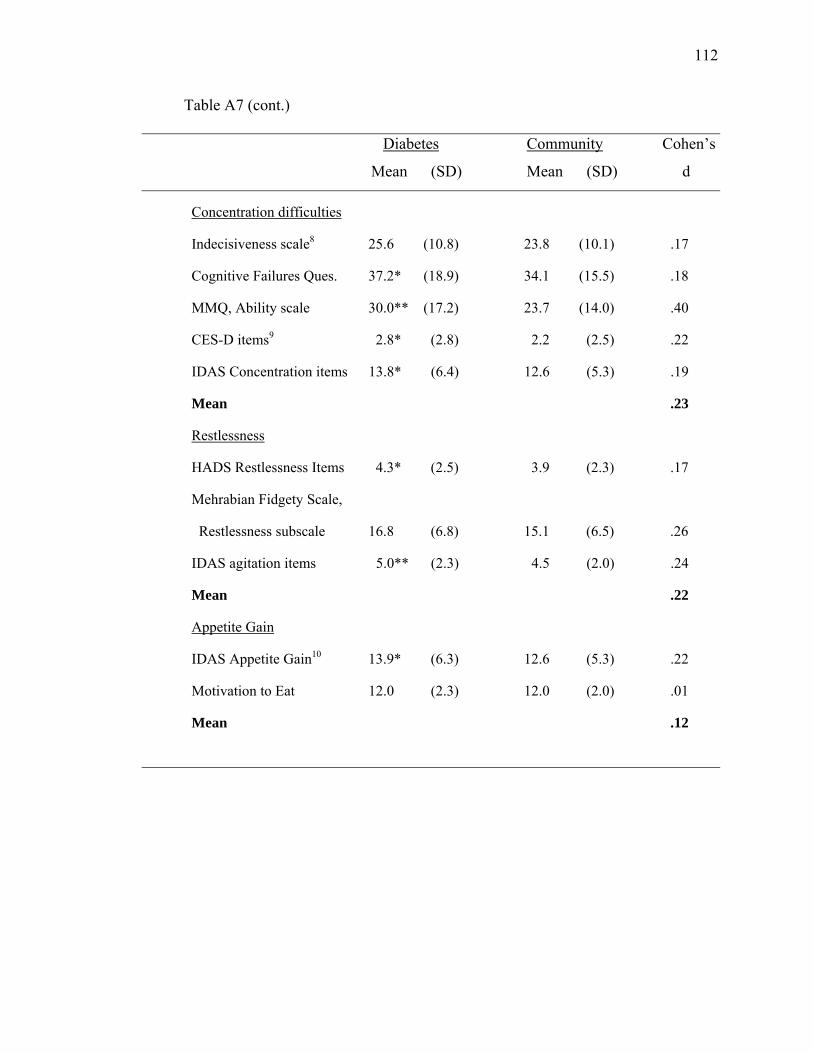
112
Table A7 (cont.)
Diabetes Community Cohen’s
Mean (SD) Mean (SD) d
Concentration difficulties
Indecisiveness scale8 25.6 (10.8) 23.8 (10.1) .17
Cognitive Failures Ques. 37.2* (18.9) 34.1 (15.5) .18
MMQ, Ability scale 30.0** (17.2) 23.7 (14.0) .40
CES-D items9 2.8* (2.8) 2.2 (2.5) .22
IDAS Concentration items 13.8* (6.4) 12.6 (5.3) .19
Mean .23
Restlessness
HADS Restlessness Items 4.3* (2.5) 3.9 (2.3) .17
Mehrabian Fidgety Scale,
Restlessness subscale 16.8 (6.8) 15.1 (6.5) .26
IDAS agitation items 5.0** (2.3) 4.5 (2.0) .24
Mean .22
Appetite Gain
IDAS Appetite Gain10 13.9* (6.3) 12.6 (5.3) .22
Motivation to Eat 12.0 (2.3) 12.0 (2.0) .01
Mean .12
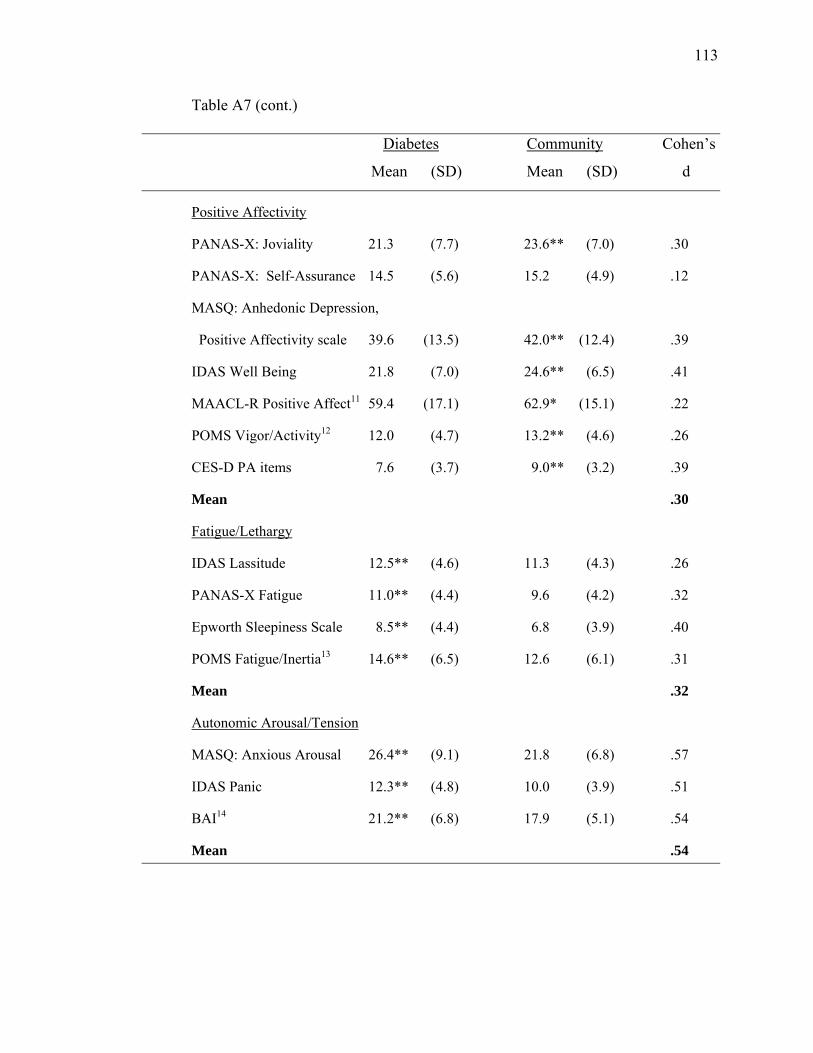
113
Table A7 (cont.)
Diabetes Community Cohen’s
Mean (SD) Mean (SD) d
Positive Affectivity
PANAS-X: Joviality 21.3 (7.7) 23.6** (7.0) .30
PANAS-X: Self-Assurance 14.5 (5.6) 15.2 (4.9) .12
MASQ: Anhedonic Depression,
Positive Affectivity scale 39.6 (13.5) 42.0** (12.4) .39
IDAS Well Being 21.8 (7.0) 24.6** (6.5) .41
MAACL-R Positive Affect11 59.4 (17.1) 62.9* (15.1) .22
POMS Vigor/Activity12 12.0 (4.7) 13.2** (4.6) .26
CES-D PA items 7.6 (3.7) 9.0** (3.2) .39
Mean .30
Fatigue/Lethargy
IDAS Lassitude 12.5** (4.6) 11.3 (4.3) .26
PANAS-X Fatigue 11.0** (4.4) 9.6 (4.2) .32
Epworth Sleepiness Scale 8.5** (4.4) 6.8 (3.9) .40
POMS Fatigue/Inertia13 14.6** (6.5) 12.6 (6.1) .31
Mean .32
Autonomic Arousal/Tension
MASQ: Anxious Arousal 26.4** (9.1) 21.8 (6.8) .57
IDAS Panic 12.3** (4.8) 10.0 (3.9) .51
BAI14 21.2** (6.8) 17.9 (5.1) .54
Mean .54
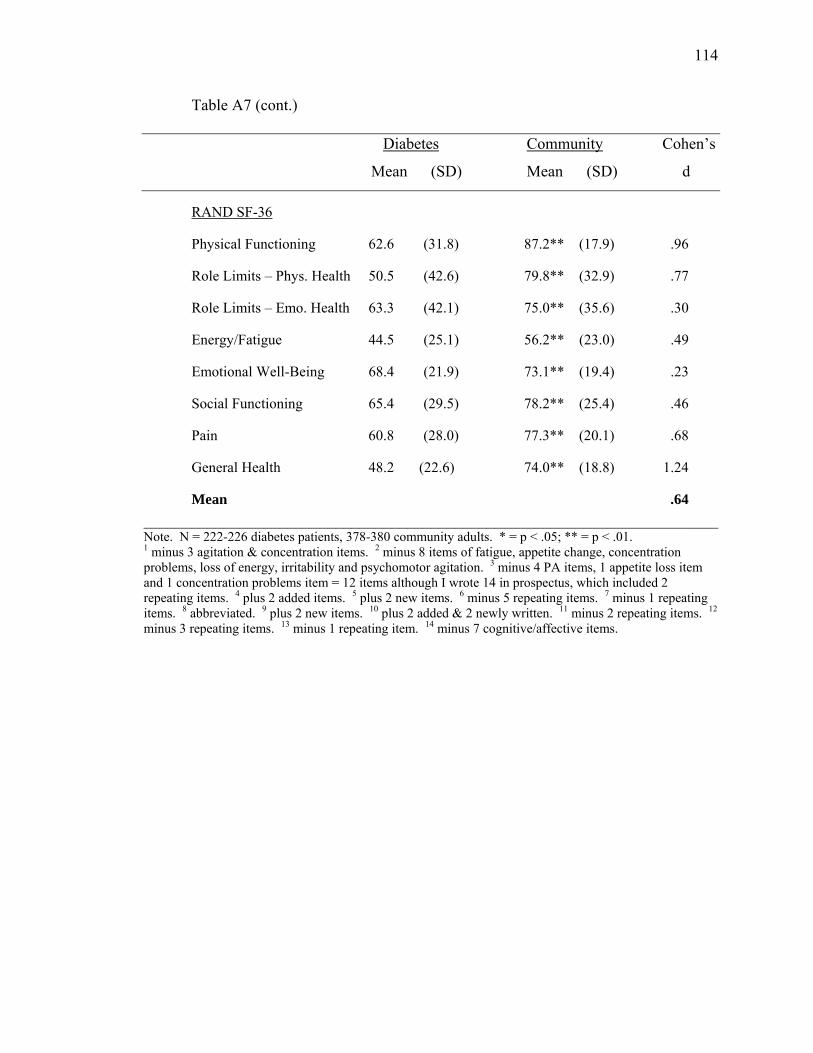
114
Table A7 (cont.)
Diabetes Community Cohen’s
Mean (SD) Mean (SD) d
RAND SF-36
Physical Functioning 62.6 (31.8) 87.2** (17.9) .96
Role Limits – Phys. Health 50.5 (42.6) 79.8** (32.9) .77
Role Limits – Emo. Health 63.3 (42.1) 75.0** (35.6) .30
Energy/Fatigue 44.5 (25.1) 56.2** (23.0) .49
Emotional Well-Being 68.4 (21.9) 73.1** (19.4) .23
Social Functioning 65.4 (29.5) 78.2** (25.4) .46
Pain 60.8 (28.0) 77.3** (20.1) .68
General Health 48.2 (22.6) 74.0** (18.8) 1.24
Mean .64 ________________________________________________________________________Note. N = 222-226 diabetes patients, 378-380 community adults. * = p < .05; ** = p < .01. 1 minus 3 agitation & concentration items. 2 minus 8 items of fatigue, appetite change, concentration problems, loss of energy, irritability and psychomotor agitation. 3 minus 4 PA items, 1 appetite loss item and 1 concentration problems item = 12 items although I wrote 14 in prospectus, which included 2 repeating items. 4 plus 2 added items. 5 plus 2 new items. 6 minus 5 repeating items. 7 minus 1 repeating items. 8 abbreviated. 9 plus 2 new items. 10 plus 2 added & 2 newly written. 11 minus 2 repeating items. 12 minus 3 repeating items. 13 minus 1 repeating item. 14 minus 7 cognitive/affective items.
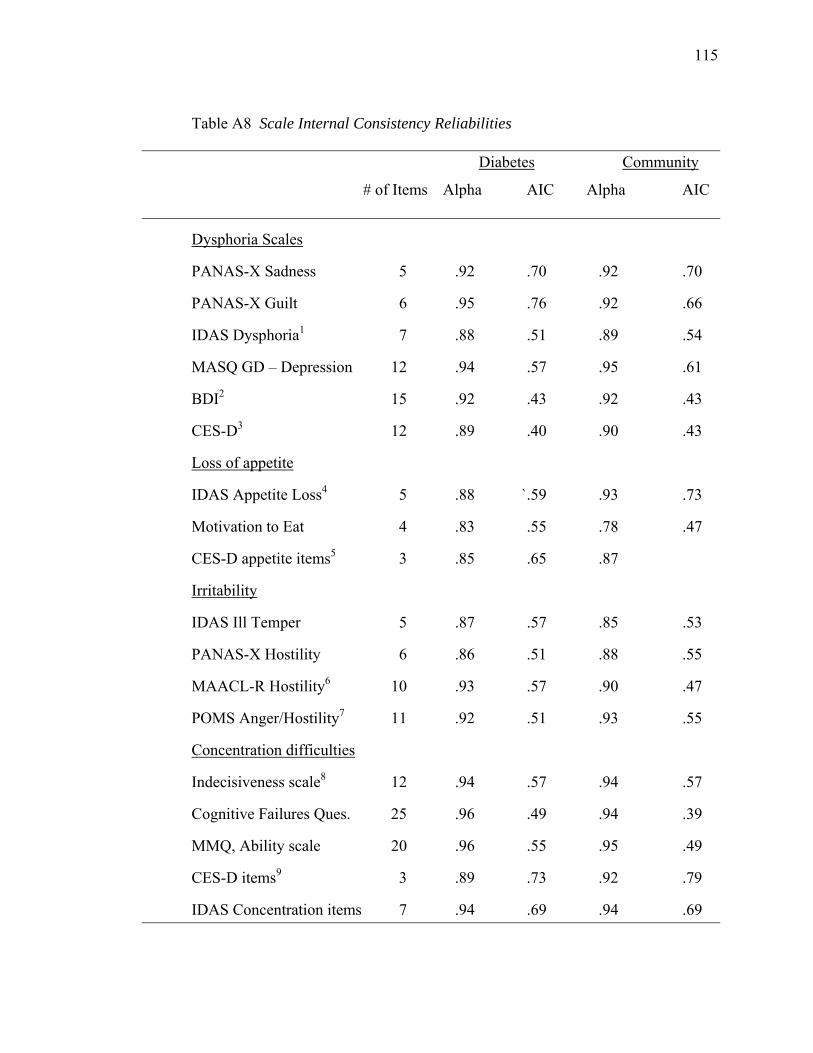
115
Table A8 Scale Internal Consistency Reliabilities
Diabetes Community
# of Items Alpha AIC Alpha AIC
Dysphoria Scales
PANAS-X Sadness 5 .92 .70 .92 .70
PANAS-X Guilt 6 .95 .76 .92 .66
IDAS Dysphoria1 7 .88 .51 .89 .54
MASQ GD – Depression 12 .94 .57 .95 .61
BDI2 15 .92 .43 .92 .43
CES-D3 12 .89 .40 .90 .43
Loss of appetite
IDAS Appetite Loss4 5 .88 `.59 .93 .73
Motivation to Eat 4 .83 .55 .78 .47
CES-D appetite items5 3 .85 .65 .87
Irritability
IDAS Ill Temper 5 .87 .57 .85 .53
PANAS-X Hostility 6 .86 .51 .88 .55
MAACL-R Hostility6 10 .93 .57 .90 .47
POMS Anger/Hostility7 11 .92 .51 .93 .55
Concentration difficulties
Indecisiveness scale8 12 .94 .57 .94 .57
Cognitive Failures Ques. 25 .96 .49 .94 .39
MMQ, Ability scale 20 .96 .55 .95 .49
CES-D items9 3 .89 .73 .92 .79
IDAS Concentration items 7 .94 .69 .94 .69
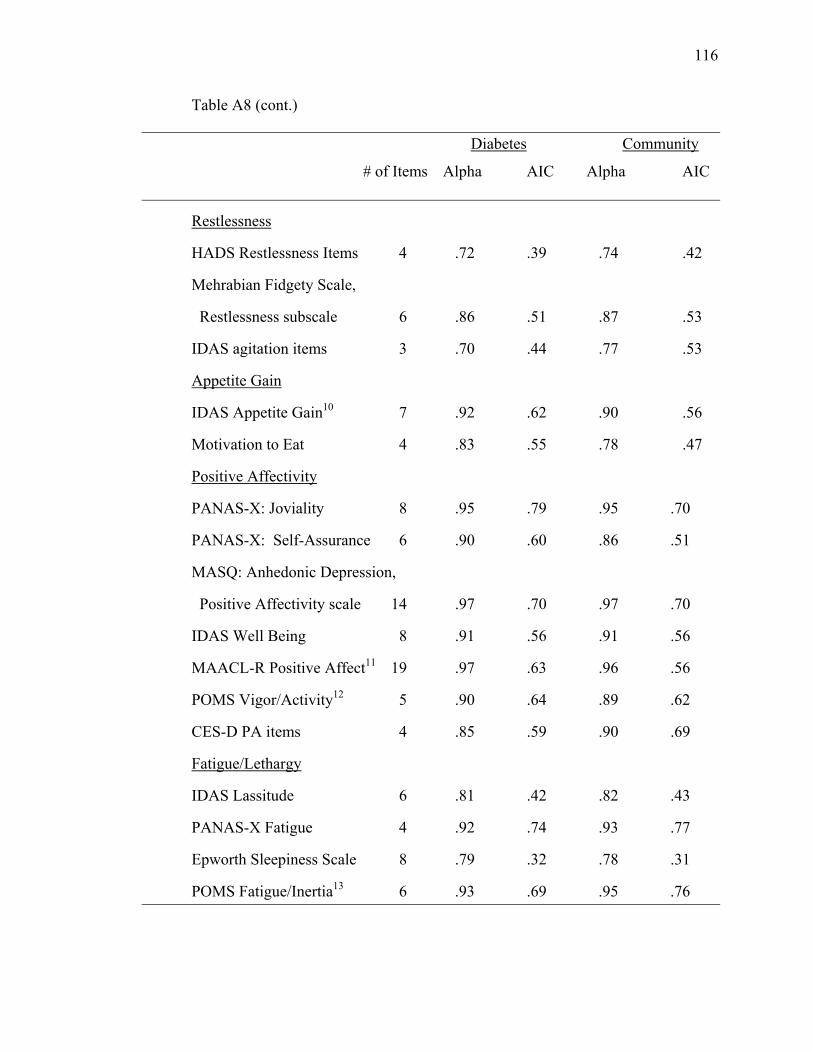
116
Table A8 (cont.)
Diabetes Community
# of Items Alpha AIC Alpha AIC
Restlessness
HADS Restlessness Items 4 .72 .39 .74 .42
Mehrabian Fidgety Scale,
Restlessness subscale 6 .86 .51 .87 .53
IDAS agitation items 3 .70 .44 .77 .53
Appetite Gain
IDAS Appetite Gain10 7 .92 .62 .90 .56
Motivation to Eat 4 .83 .55 .78 .47
Positive Affectivity
PANAS-X: Joviality 8 .95 .79 .95 .70
PANAS-X: Self-Assurance 6 .90 .60 .86 .51
MASQ: Anhedonic Depression,
Positive Affectivity scale 14 .97 .70 .97 .70
IDAS Well Being 8 .91 .56 .91 .56
MAACL-R Positive Affect11 19 .97 .63 .96 .56
POMS Vigor/Activity12 5 .90 .64 .89 .62
CES-D PA items 4 .85 .59 .90 .69
Fatigue/Lethargy
IDAS Lassitude 6 .81 .42 .82 .43
PANAS-X Fatigue 4 .92 .74 .93 .77
Epworth Sleepiness Scale 8 .79 .32 .78 .31
POMS Fatigue/Inertia13 6 .93 .69 .95 .76
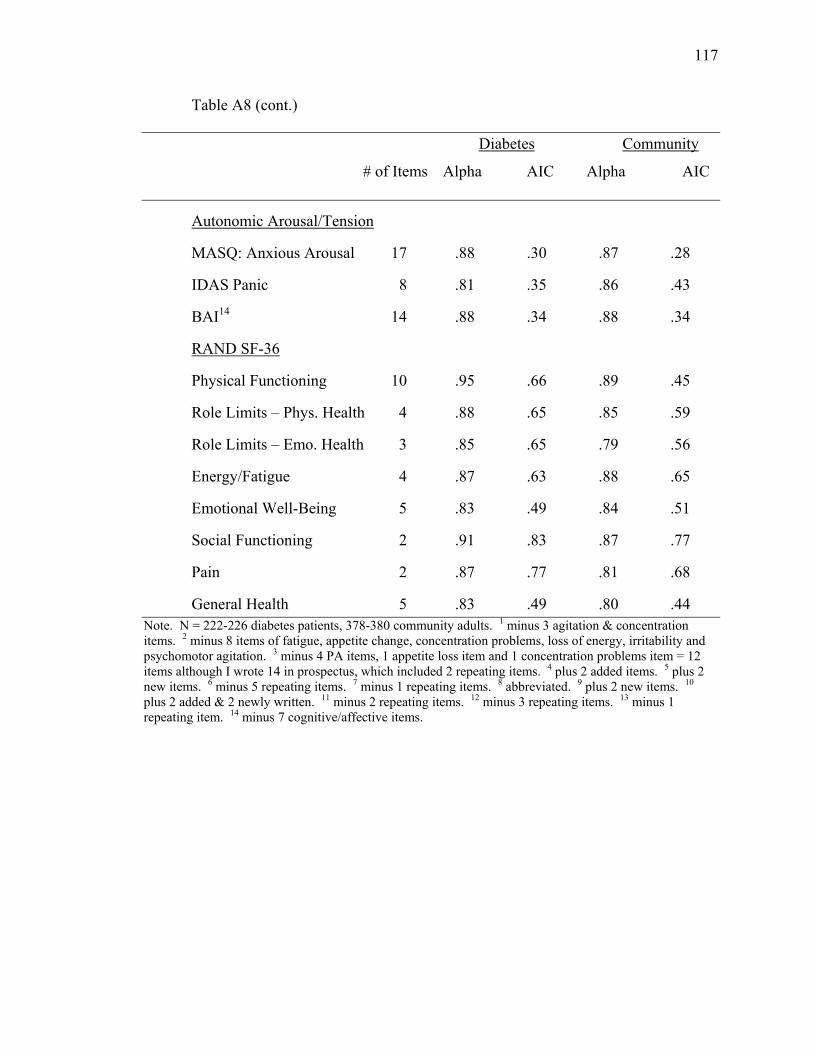
117
Table A8 (cont.)
Diabetes Community
# of Items Alpha AIC Alpha AIC
Autonomic Arousal/Tension
MASQ: Anxious Arousal 17 .88 .30 .87 .28
IDAS Panic 8 .81 .35 .86 .43
BAI14 14 .88 .34 .88 .34
RAND SF-36
Physical Functioning 10 .95 .66 .89 .45
Role Limits – Phys. Health 4 .88 .65 .85 .59
Role Limits – Emo. Health 3 .85 .65 .79 .56
Energy/Fatigue 4 .87 .63 .88 .65
Emotional Well-Being 5 .83 .49 .84 .51
Social Functioning 2 .91 .83 .87 .77
Pain 2 .87 .77 .81 .68
General Health 5 .83 .49 .80 .44 Note. N = 222-226 diabetes patients, 378-380 community adults. 1 minus 3 agitation & concentration items. 2 minus 8 items of fatigue, appetite change, concentration problems, loss of energy, irritability and psychomotor agitation. 3 minus 4 PA items, 1 appetite loss item and 1 concentration problems item = 12 items although I wrote 14 in prospectus, which included 2 repeating items. 4 plus 2 added items. 5 plus 2 new items. 6 minus 5 repeating items. 7 minus 1 repeating items. 8 abbreviated. 9 plus 2 new items. 10 plus 2 added & 2 newly written. 11 minus 2 repeating items. 12 minus 3 repeating items. 13 minus 1 repeating item. 14 minus 7 cognitive/affective items.
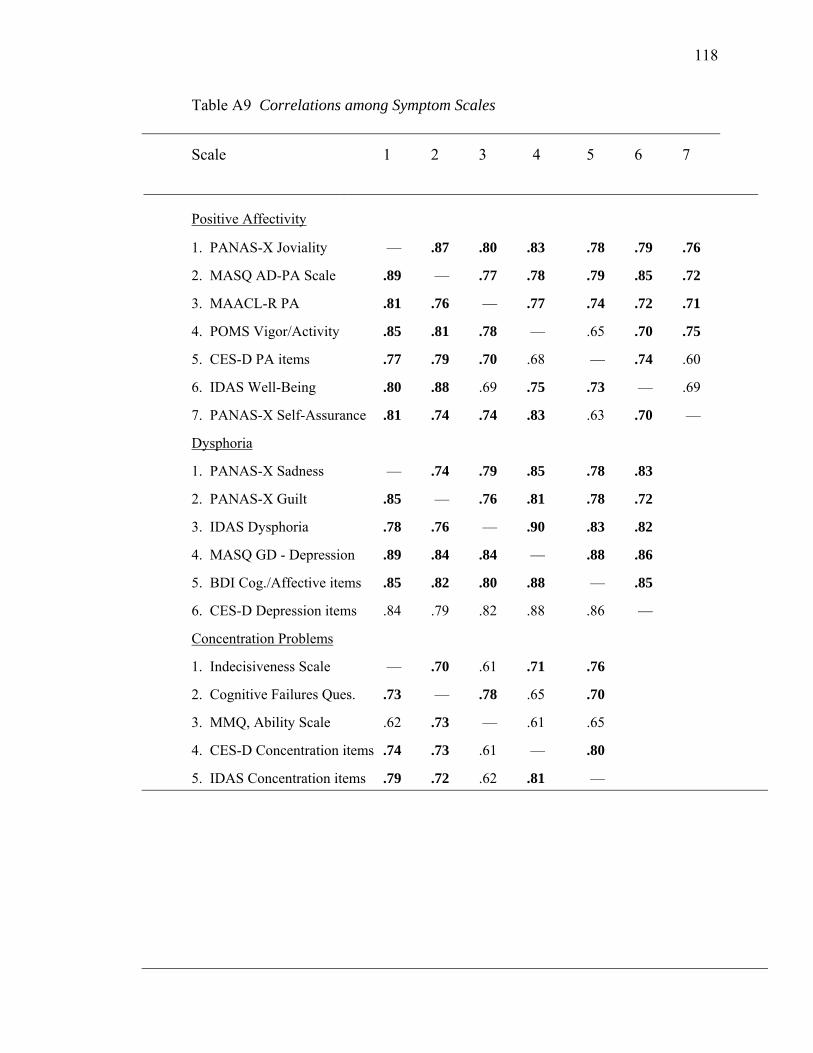
118
Table A9 Correlations among Symptom Scales
Scale 1 2 3 4 5 6 7
_____________________________________________________________________________
Positive Affectivity
1. PANAS-X Joviality .— .87 .80 .83 .78 .79 .76
2. MASQ AD-PA Scale .89 .— .77 .78 .79 .85 .72
3. MAACL-R PA .81 .76 .— .77 .74 .72 .71
4. POMS Vigor/Activity .85 .81 .78 .— .65 .70 .75
5. CES-D PA items .77 .79 .70 .68 .— .74 .60
6. IDAS Well-Being .80 .88 .69 .75 .73 .— .69
7. PANAS-X Self-Assurance .81 .74 .74 .83 .63 .70 .—
Dysphoria
1. PANAS-X Sadness .— .74 .79 .85 .78 .83
2. PANAS-X Guilt .85 .— .76 .81 .78 .72
3. IDAS Dysphoria .78 .76 .— .90 .83 .82
4. MASQ GD - Depression .89 .84 .84 .— .88 .86
5. BDI Cog./Affective items .85 .82 .80 .88 .— .85
6. CES-D Depression items .84 .79 .82 .88 .86 .—
Concentration Problems
1. Indecisiveness Scale .— .70 .61 .71 .76
2. Cognitive Failures Ques. .73 .— .78 .65 .70
3. MMQ, Ability Scale .62 .73 .— .61 .65
4. CES-D Concentration items .74 .73 .61 .— .80
5. IDAS Concentration items .79 .72 .62 .81 .—
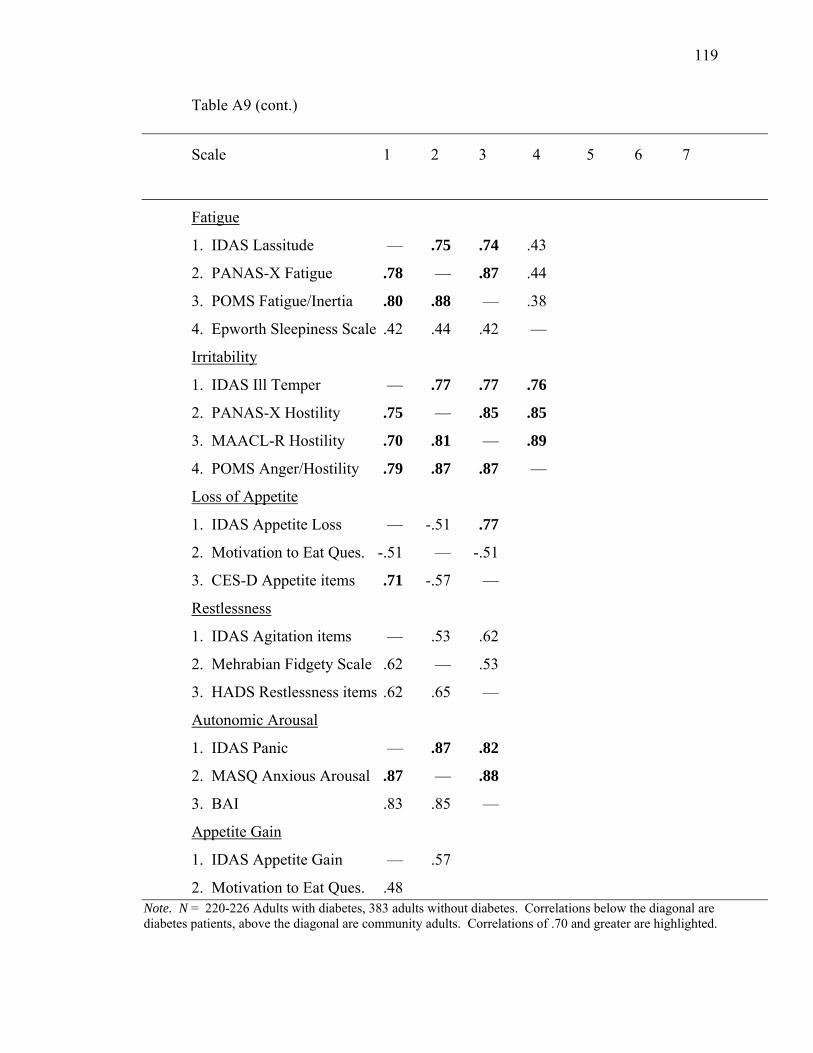
119
Table A9 (cont.)
Scale 1 2 3 4 5 6 7
Fatigue
1. IDAS Lassitude .— .75 .74 .43
2. PANAS-X Fatigue .78 .— .87 .44
3. POMS Fatigue/Inertia .80 .88 .— .38
4. Epworth Sleepiness Scale .42 .44 .42 .—
Irritability
1. IDAS Ill Temper .— .77 .77 .76
2. PANAS-X Hostility .75 .— .85 .85
3. MAACL-R Hostility .70 .81 .— .89
4. POMS Anger/Hostility .79 .87 .87 .—
Loss of Appetite
1. IDAS Appetite Loss .— -.51 .77
2. Motivation to Eat Ques. -.51 .— -.51
3. CES-D Appetite items .71 -.57 .—
Restlessness
1. IDAS Agitation items .— .53 .62
2. Mehrabian Fidgety Scale .62 .— .53
3. HADS Restlessness items .62 .65 .—
Autonomic Arousal
1. IDAS Panic .— .87 .82
2. MASQ Anxious Arousal .87 .— .88
3. BAI .83 .85 .—
Appetite Gain
1. IDAS Appetite Gain .— .57
2. Motivation to Eat Ques. .48 Note. N = 220-226 Adults with diabetes, 383 adults without diabetes. Correlations below the diagonal are diabetes patients, above the diagonal are community adults. Correlations of .70 and greater are highlighted.
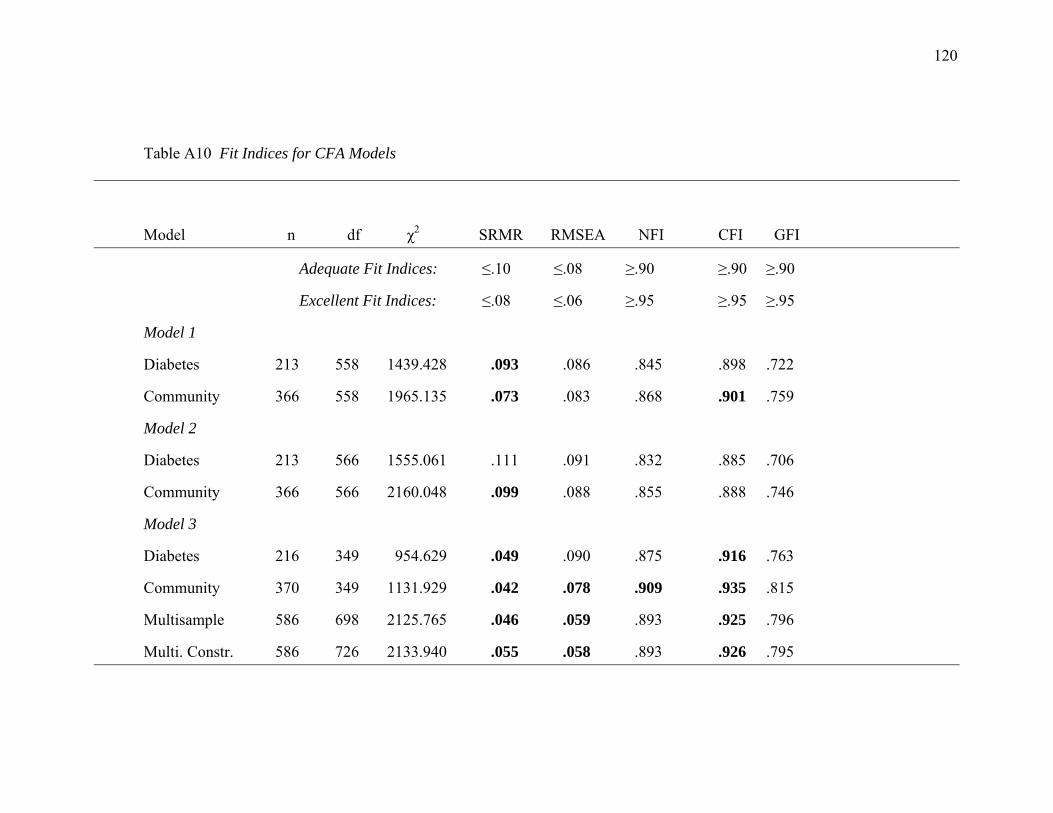
120
Table A10 Fit Indices for CFA Models
Model n df χ2 SRMR RMSEA NFI CFI GFI
Adequate Fit Indices: ≤.10 ≤.08 ≥.90 ≥.90 ≥.90
Excellent Fit Indices: ≤.08 ≤.06 ≥.95 ≥.95 ≥.95
Model 1
Diabetes 213 558 1439.428 .093 .086 .845 .898 .722
Community 366 558 1965.135 .073 .083 .868 .901 .759
Model 2
Diabetes 213 566 1555.061 .111 .091 .832 .885 .706
Community 366 566 2160.048 .099 .088 .855 .888 .746
Model 3
Diabetes 216 349 954.629 .049 .090 .875 .916 .763
Community 370 349 1131.929 .042 .078 .909 .935 .815
Multisample 586 698 2125.765 .046 .059 .893 .925 .796
Multi. Constr. 586 726 2133.940 .055 .058 .893 .926 .795
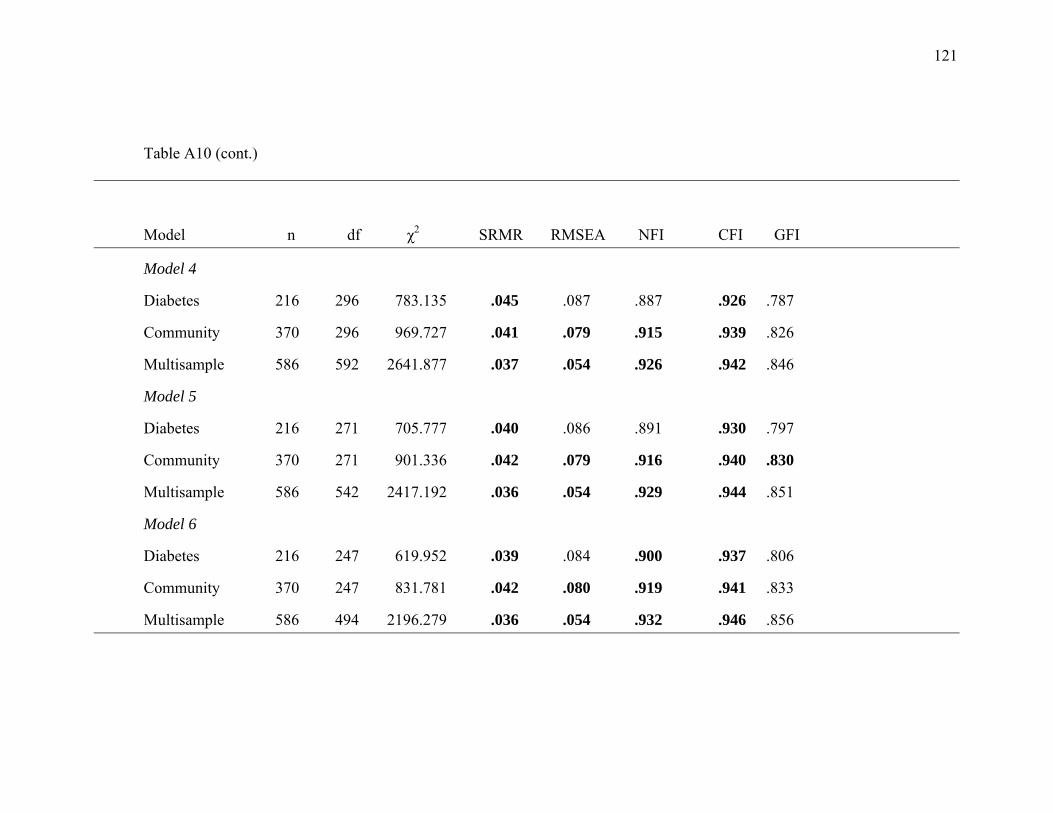
121
Table A10 (cont.)
Model n df χ2 SRMR RMSEA NFI CFI GFI
Model 4
Diabetes 216 296 783.135 .045 .087 .887 .926 .787
Community 370 296 969.727 .041 .079 .915 .939 .826
Multisample 586 592 2641.877 .037 .054 .926 .942 .846
Model 5
Diabetes 216 271 705.777 .040 .086 .891 .930 .797
Community 370 271 901.336 .042 .079 .916 .940 .830
Multisample 586 542 2417.192 .036 .054 .929 .944 .851
Model 6
Diabetes 216 247 619.952 .039 .084 .900 .937 .806
Community 370 247 831.781 .042 .080 .919 .941 .833
Multisample 586 494 2196.279 .036 .054 .932 .946 .856

122
Table A10 (cont.)
Model n df χ2 SRMR RMSEA NFI CFI GFI
Model 7
Diabetes 216 224 540.420 .037 .081 .908 .944 .826
Community 370 224 718.585 .039 .077 .927 .948 .852
Multisample 586 448 1931.080 .033 .053 .938 .951 .872
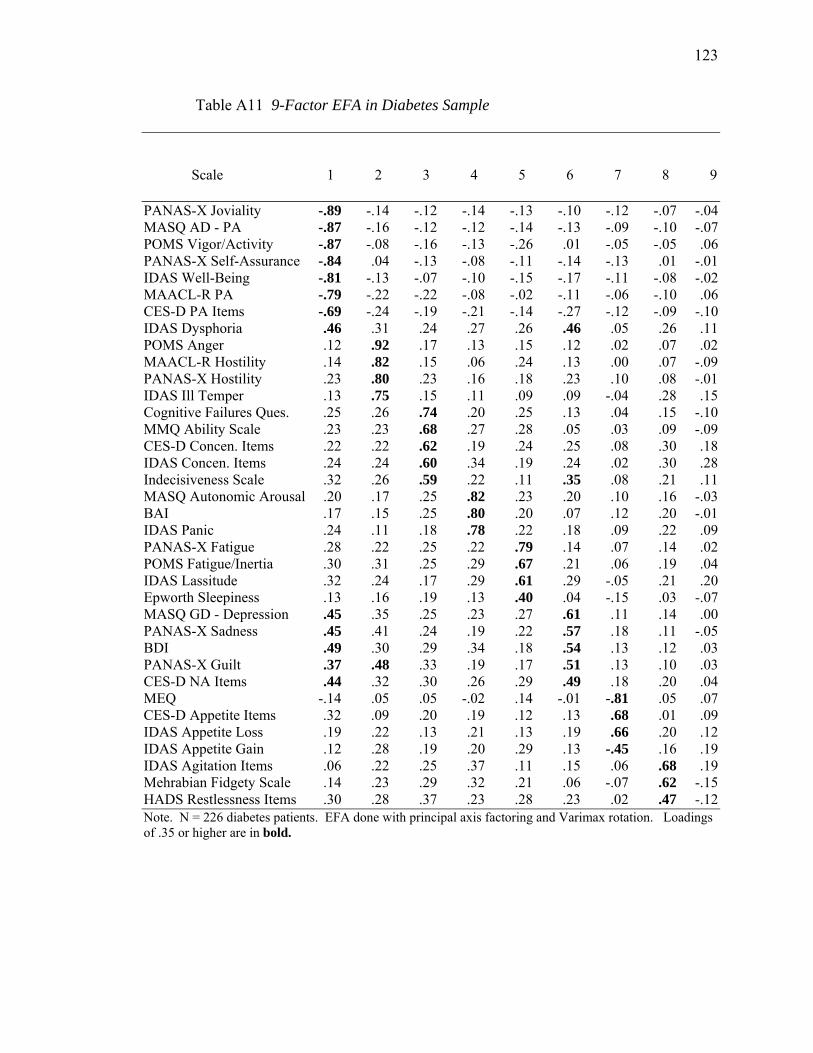
123
Table A11 9-Factor EFA in Diabetes Sample
Scale .1 .2 .3 .4 .5 .6 .7 .8 .9
PANAS-X Joviality -.89 -.14 -.12 -.14 -.13 -.10 -.12 -.07 -.04 MASQ AD - PA -.87 -.16 -.12 -.12 -.14 -.13 -.09 -.10 -.07 POMS Vigor/Activity -.87 -.08 -.16 -.13 -.26 .01 -.05 -.05 .06 PANAS-X Self-Assurance -.84 .04 -.13 -.08 -.11 -.14 -.13 .01 -.01 IDAS Well-Being -.81 -.13 -.07 -.10 -.15 -.17 -.11 -.08 -.02 MAACL-R PA -.79 -.22 -.22 -.08 -.02 -.11 -.06 -.10 .06 CES-D PA Items -.69 -.24 -.19 -.21 -.14 -.27 -.12 -.09 -.10 IDAS Dysphoria .46 .31 .24 .27 .26 .46 .05 .26 .11 POMS Anger .12 .92 .17 .13 .15 .12 .02 .07 .02 MAACL-R Hostility .14 .82 .15 .06 .24 .13 .00 .07 -.09 PANAS-X Hostility .23 .80 .23 .16 .18 .23 .10 .08 -.01 IDAS Ill Temper .13 .75 .15 .11 .09 .09 -.04 .28 .15 Cognitive Failures Ques. .25 .26 .74 .20 .25 .13 .04 .15 -.10 MMQ Ability Scale .23 .23 .68 .27 .28 .05 .03 .09 -.09 CES-D Concen. Items .22 .22 .62 .19 .24 .25 .08 .30 .18 IDAS Concen. Items .24 .24 .60 .34 .19 .24 .02 .30 .28 Indecisiveness Scale .32 .26 .59 .22 .11 .35 .08 .21 .11 MASQ Autonomic Arousal .20 .17 .25 .82 .23 .20 .10 .16 -.03 BAI .17 .15 .25 .80 .20 .07 .12 .20 -.01 IDAS Panic .24 .11 .18 .78 .22 .18 .09 .22 .09 PANAS-X Fatigue .28 .22 .25 .22 .79 .14 .07 .14 .02 POMS Fatigue/Inertia .30 .31 .25 .29 .67 .21 .06 .19 .04 IDAS Lassitude .32 .24 .17 .29 .61 .29 -.05 .21 .20 Epworth Sleepiness .13 .16 .19 .13 .40 .04 -.15 .03 -.07 MASQ GD - Depression .45 .35 .25 .23 .27 .61 .11 .14 .00 PANAS-X Sadness .45 .41 .24 .19 .22 .57 .18 .11 -.05 BDI .49 .30 .29 .34 .18 .54 .13 .12 .03 PANAS-X Guilt .37 .48 .33 .19 .17 .51 .13 .10 .03 CES-D NA Items .44 .32 .30 .26 .29 .49 .18 .20 .04 MEQ -.14 .05 .05 -.02 .14 -.01 -.81 .05 .07 CES-D Appetite Items .32 .09 .20 .19 .12 .13 .68 .01 .09 IDAS Appetite Loss .19 .22 .13 .21 .13 .19 .66 .20 .12 IDAS Appetite Gain .12 .28 .19 .20 .29 .13 -.45 .16 .19 IDAS Agitation Items .06 .22 .25 .37 .11 .15 .06 .68 .19 Mehrabian Fidgety Scale .14 .23 .29 .32 .21 .06 -.07 .62 -.15 HADS Restlessness Items .30 .28 .37 .23 .28 .23 .02 .47 -.12 Note. N = 226 diabetes patients. EFA done with principal axis factoring and Varimax rotation. Loadings of .35 or higher are in bold.

124
Table A12 8-Factor EFA in Community Sample, Promax Rotation
Scale .1 .2 .3 .4 .5 .6 .7 .8
PANAS-X Joviality -.93 -.03 -.01 .08 -.06 .01 -.01 .02 PANAS-X Self-Assurance -.92 .00 -.05 -.08 .19 .03 .01 .05 MASQ-AD PA -.91 -.03 .07 .04 -.04 .01 .00 -.06 POMS Vigor/Activity -.86 .13 -.05 -.13 -.17 .14 .00 .07 IDAS Well-Being -.85 .00 -.12 .11 .03 -.02 .04 -.05 MAACL-R PA -.79 -.09 .02 -.06 .01 -.06 -.06 .08 CES-D PA Items -.53 -.06 .10 .06 -.03 -.38 -.03 -.08 MAACL-R Hostility .09 .91 -.01 .04 -.02 -.08 -.04 .07 POMS Anger .03 .87 -.02 -.07 -.02 .02 -.01 .16 PANAS-X Hostility -.01 .78 -.05 .08 .12 .18 .01 -.13 IDAS Ill Temper -.07 .66 .19 .02 -.06 .06 .03 .08 MASQ Autonomic Arousal .00 .01 .95 .02 .04 -.07 -.03 .00 IDAS Panic .02 -.01 .89 -.03 .02 .09 -.02 -.08 BAI .06 .04 .89 .03 -.02 -.15 -.01 .11 Cognitive Failures Ques. .01 .00 .00 .91 .03 .09 .07 -.07 MMQ Ability Scale .10 .00 .06 .66 -.04 -.03 .06 .15 Epworth Sleepiness -.09 .13 .06 .36 .35 -.13 -.06 -.08 PANAS-X Fatigue .05 -.01 -.04 .09 .96 -.03 -.01 -.07 POMS Fatigue/Inertia .06 .00 .01 -.07 .81 .10 .02 .05 IDAS Lassitude .00 .00 .27 .05 .57 .05 .00 .00 MASQ GD - Depression .01 .08 .00 -.04 .04 .99 -.03 -.13 PANAS-X Sadness .11 .12 -.10 -.10 .02 .86 .02 -.05 PANAS-X Guilt .01 .23 -.03 .16 -.09 .81 -.05 -.19 IDAS Dypshoria .04 -.01 .08 -.05 .03 .80 -.02 .08 BDI .13 .10 .12 .08 -.01 .67 -.01 -.07 CES-D NA Items .08 .09 .09 -.07 .13 .57 .02 .13 Indecisiveness Scale .11 .00 -.02 .28 -.06 .41 -.07 .24 MEQ -.03 .04 .11 -.11 .01 .11 -.86 -.06 IDAS Appetite Gain -.07 .02 .17 .08 .01 .21 -.66 .18 IDAS Appetite Loss -.10 .03 .24 .00 .01 .25 .60 .01 CES-D Appetite Items -.03 .08 .19 -.03 .00 .12 .59 .10 IDAS Agitation Items -.03 .13 .19 -.03 -.13 -.15 .03 .84 CES-D Concentration Items .08 -.15 -.03 .15 .08 .22 .01 .55 Mehrabian Fidgety Scale -.06 .13 -.08 .31 .09 -.26 .01 .51 HADS Restlessness Items .01 .12 -.13 .08 .31 .04 .01 .50 IDAS Concentration Items .00 -.12 .10 .20 -.06 .33 .00 .49 Note. N = 380 community adults. EFA done with principal axis factoring and Promax rotation. Loadings of ≥ .35 are in bold.
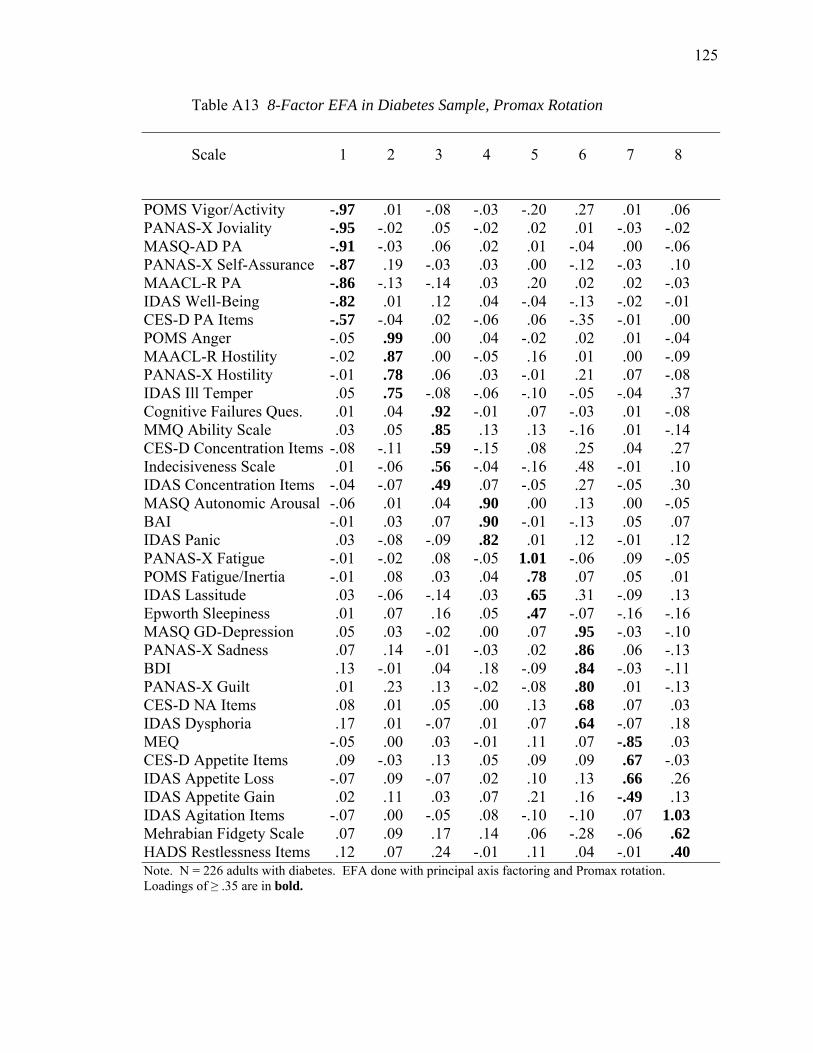
125
Table A13 8-Factor EFA in Diabetes Sample, Promax Rotation
Scale .1 .2 .3 .4 .5 .6 .7 .8
POMS Vigor/Activity -.97 .01 -.08 -.03 -.20 .27 .01 .06 PANAS-X Joviality -.95 -.02 .05 -.02 .02 .01 -.03 -.02 MASQ-AD PA -.91 -.03 .06 .02 .01 -.04 .00 -.06 PANAS-X Self-Assurance -.87 .19 -.03 .03 .00 -.12 -.03 .10 MAACL-R PA -.86 -.13 -.14 .03 .20 .02 .02 -.03 IDAS Well-Being -.82 .01 .12 .04 -.04 -.13 -.02 -.01 CES-D PA Items -.57 -.04 .02 -.06 .06 -.35 -.01 .00 POMS Anger -.05 .99 .00 .04 -.02 .02 .01 -.04 MAACL-R Hostility -.02 .87 .00 -.05 .16 .01 .00 -.09 PANAS-X Hostility -.01 .78 .06 .03 -.01 .21 .07 -.08 IDAS Ill Temper .05 .75 -.08 -.06 -.10 -.05 -.04 .37 Cognitive Failures Ques. .01 .04 .92 -.01 .07 -.03 .01 -.08 MMQ Ability Scale .03 .05 .85 .13 .13 -.16 .01 -.14 CES-D Concentration Items -.08 -.11 .59 -.15 .08 .25 .04 .27 Indecisiveness Scale .01 -.06 .56 -.04 -.16 .48 -.01 .10 IDAS Concentration Items -.04 -.07 .49 .07 -.05 .27 -.05 .30 MASQ Autonomic Arousal -.06 .01 .04 .90 .00 .13 .00 -.05 BAI -.01 .03 .07 .90 -.01 -.13 .05 .07 IDAS Panic .03 -.08 -.09 .82 .01 .12 -.01 .12 PANAS-X Fatigue -.01 -.02 .08 -.05 1.01 -.06 .09 -.05 POMS Fatigue/Inertia -.01 .08 .03 .04 .78 .07 .05 .01 IDAS Lassitude .03 -.06 -.14 .03 .65 .31 -.09 .13 Epworth Sleepiness .01 .07 .16 .05 .47 -.07 -.16 -.16 MASQ GD-Depression .05 .03 -.02 .00 .07 .95 -.03 -.10 PANAS-X Sadness .07 .14 -.01 -.03 .02 .86 .06 -.13 BDI .13 -.01 .04 .18 -.09 .84 -.03 -.11 PANAS-X Guilt .01 .23 .13 -.02 -.08 .80 .01 -.13 CES-D NA Items .08 .01 .05 .00 .13 .68 .07 .03 IDAS Dysphoria .17 .01 -.07 .01 .07 .64 -.07 .18 MEQ -.05 .00 .03 -.01 .11 .07 -.85 .03 CES-D Appetite Items .09 -.03 .13 .05 .09 .09 .67 -.03 IDAS Appetite Loss -.07 .09 -.07 .02 .10 .13 .66 .26 IDAS Appetite Gain .02 .11 .03 .07 .21 .16 -.49 .13 IDAS Agitation Items -.07 .00 -.05 .08 -.10 -.10 .07 1.03 Mehrabian Fidgety Scale .07 .09 .17 .14 .06 -.28 -.06 .62 HADS Restlessness Items .12 .07 .24 -.01 .11 .04 -.01 .40 Note. N = 226 adults with diabetes. EFA done with principal axis factoring and Promax rotation. Loadings of ≥ .35 are in bold.
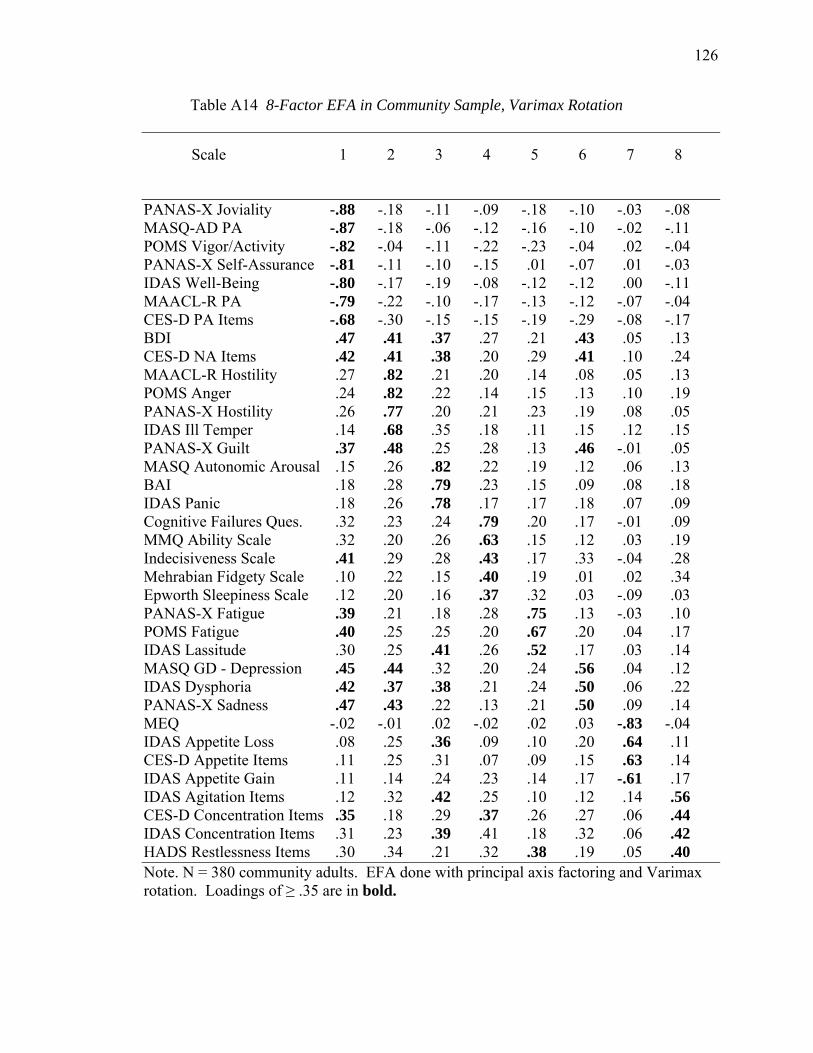
126
Table A14 8-Factor EFA in Community Sample, Varimax Rotation
Scale .1 .2 .3 .4 .5 .6 .7 .8
PANAS-X Joviality -.88 -.18 -.11 -.09 -.18 -.10 -.03 -.08 MASQ-AD PA -.87 -.18 -.06 -.12 -.16 -.10 -.02 -.11 POMS Vigor/Activity -.82 -.04 -.11 -.22 -.23 -.04 .02 -.04 PANAS-X Self-Assurance -.81 -.11 -.10 -.15 .01 -.07 .01 -.03 IDAS Well-Being -.80 -.17 -.19 -.08 -.12 -.12 .00 -.11 MAACL-R PA -.79 -.22 -.10 -.17 -.13 -.12 -.07 -.04 CES-D PA Items -.68 -.30 -.15 -.15 -.19 -.29 -.08 -.17 BDI .47 .41 .37 .27 .21 .43 .05 .13 CES-D NA Items .42 .41 .38 .20 .29 .41 .10 .24 MAACL-R Hostility .27 .82 .21 .20 .14 .08 .05 .13 POMS Anger .24 .82 .22 .14 .15 .13 .10 .19 PANAS-X Hostility .26 .77 .20 .21 .23 .19 .08 .05 IDAS Ill Temper .14 .68 .35 .18 .11 .15 .12 .15 PANAS-X Guilt .37 .48 .25 .28 .13 .46 -.01 .05 MASQ Autonomic Arousal .15 .26 .82 .22 .19 .12 .06 .13 BAI .18 .28 .79 .23 .15 .09 .08 .18 IDAS Panic .18 .26 .78 .17 .17 .18 .07 .09 Cognitive Failures Ques. .32 .23 .24 .79 .20 .17 -.01 .09 MMQ Ability Scale .32 .20 .26 .63 .15 .12 .03 .19 Indecisiveness Scale .41 .29 .28 .43 .17 .33 -.04 .28 Mehrabian Fidgety Scale .10 .22 .15 .40 .19 .01 .02 .34 Epworth Sleepiness Scale .12 .20 .16 .37 .32 .03 -.09 .03 PANAS-X Fatigue .39 .21 .18 .28 .75 .13 -.03 .10 POMS Fatigue .40 .25 .25 .20 .67 .20 .04 .17 IDAS Lassitude .30 .25 .41 .26 .52 .17 .03 .14 MASQ GD - Depression .45 .44 .32 .20 .24 .56 .04 .12 IDAS Dysphoria .42 .37 .38 .21 .24 .50 .06 .22 PANAS-X Sadness .47 .43 .22 .13 .21 .50 .09 .14 MEQ -.02 -.01 .02 -.02 .02 .03 -.83 -.04 IDAS Appetite Loss .08 .25 .36 .09 .10 .20 .64 .11 CES-D Appetite Items .11 .25 .31 .07 .09 .15 .63 .14 IDAS Appetite Gain .11 .14 .24 .23 .14 .17 -.61 .17 IDAS Agitation Items .12 .32 .42 .25 .10 .12 .14 .56 CES-D Concentration Items .35 .18 .29 .37 .26 .27 .06 .44 IDAS Concentration Items .31 .23 .39 .41 .18 .32 .06 .42 HADS Restlessness Items .30 .34 .21 .32 .38 .19 .05 .40 Note. N = 380 community adults. EFA done with principal axis factoring and Varimax rotation. Loadings of ≥ .35 are in bold.
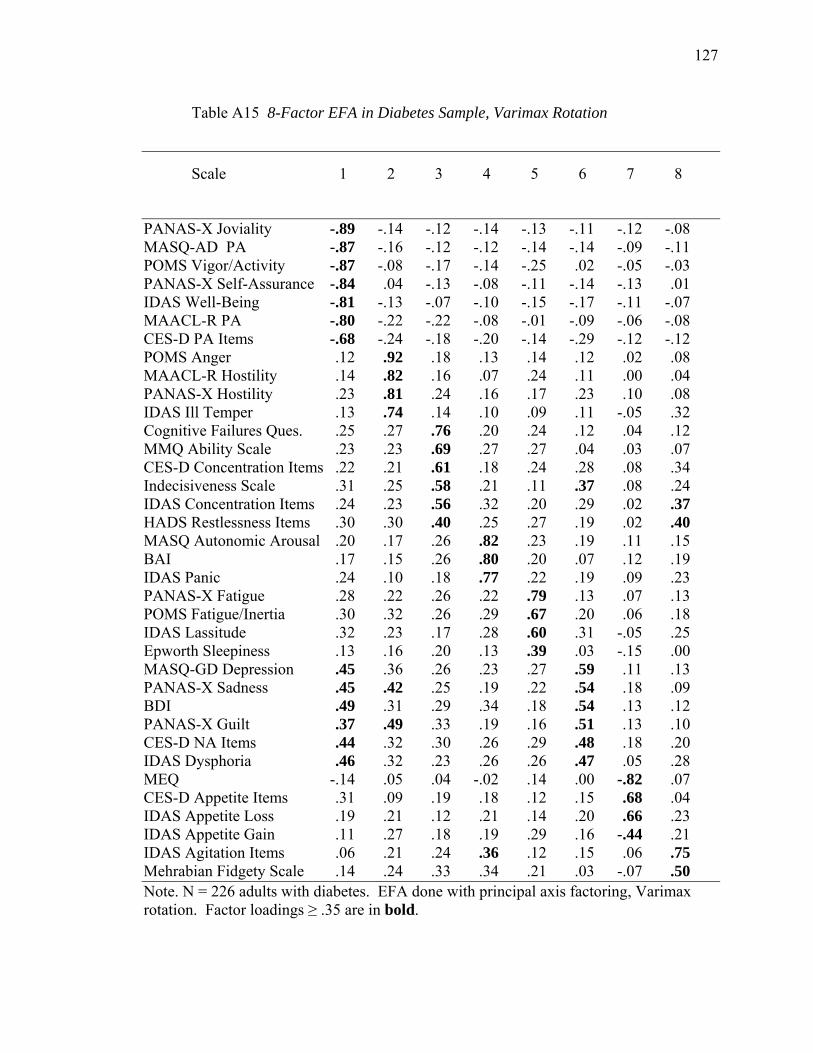
127
Table A15 8-Factor EFA in Diabetes Sample, Varimax Rotation
Scale .1 .2 .3 .4 .5 .6 .7 .8
PANAS-X Joviality -.89 -.14 -.12 -.14 -.13 -.11 -.12 -.08 MASQ-AD PA -.87 -.16 -.12 -.12 -.14 -.14 -.09 -.11 POMS Vigor/Activity -.87 -.08 -.17 -.14 -.25 .02 -.05 -.03 PANAS-X Self-Assurance -.84 .04 -.13 -.08 -.11 -.14 -.13 .01 IDAS Well-Being -.81 -.13 -.07 -.10 -.15 -.17 -.11 -.07 MAACL-R PA -.80 -.22 -.22 -.08 -.01 -.09 -.06 -.08 CES-D PA Items -.68 -.24 -.18 -.20 -.14 -.29 -.12 -.12 POMS Anger .12 .92 .18 .13 .14 .12 .02 .08 MAACL-R Hostility .14 .82 .16 .07 .24 .11 .00 .04 PANAS-X Hostility .23 .81 .24 .16 .17 .23 .10 .08 IDAS Ill Temper .13 .74 .14 .10 .09 .11 -.05 .32 Cognitive Failures Ques. .25 .27 .76 .20 .24 .12 .04 .12 MMQ Ability Scale .23 .23 .69 .27 .27 .04 .03 .07 CES-D Concentration Items .22 .21 .61 .18 .24 .28 .08 .34 Indecisiveness Scale .31 .25 .58 .21 .11 .37 .08 .24 IDAS Concentration Items .24 .23 .56 .32 .20 .29 .02 .37 HADS Restlessness Items .30 .30 .40 .25 .27 .19 .02 .40 MASQ Autonomic Arousal .20 .17 .26 .82 .23 .19 .11 .15 BAI .17 .15 .26 .80 .20 .07 .12 .19 IDAS Panic .24 .10 .18 .77 .22 .19 .09 .23 PANAS-X Fatigue .28 .22 .26 .22 .79 .13 .07 .13 POMS Fatigue/Inertia .30 .32 .26 .29 .67 .20 .06 .18 IDAS Lassitude .32 .23 .17 .28 .60 .31 -.05 .25 Epworth Sleepiness .13 .16 .20 .13 .39 .03 -.15 .00 MASQ-GD Depression .45 .36 .26 .23 .27 .59 .11 .13 PANAS-X Sadness .45 .42 .25 .19 .22 .54 .18 .09 BDI .49 .31 .29 .34 .18 .54 .13 .12 PANAS-X Guilt .37 .49 .33 .19 .16 .51 .13 .10 CES-D NA Items .44 .32 .30 .26 .29 .48 .18 .20 IDAS Dysphoria .46 .32 .23 .26 .26 .47 .05 .28 MEQ -.14 .05 .04 -.02 .14 .00 -.82 .07 CES-D Appetite Items .31 .09 .19 .18 .12 .15 .68 .04 IDAS Appetite Loss .19 .21 .12 .21 .14 .20 .66 .23 IDAS Appetite Gain .11 .27 .18 .19 .29 .16 -.44 .21 IDAS Agitation Items .06 .21 .24 .36 .12 .15 .06 .75 Mehrabian Fidgety Scale .14 .24 .33 .34 .21 .03 -.07 .50 Note. N = 226 adults with diabetes. EFA done with principal axis factoring, Varimax rotation. Factor loadings ≥ .35 are in bold.
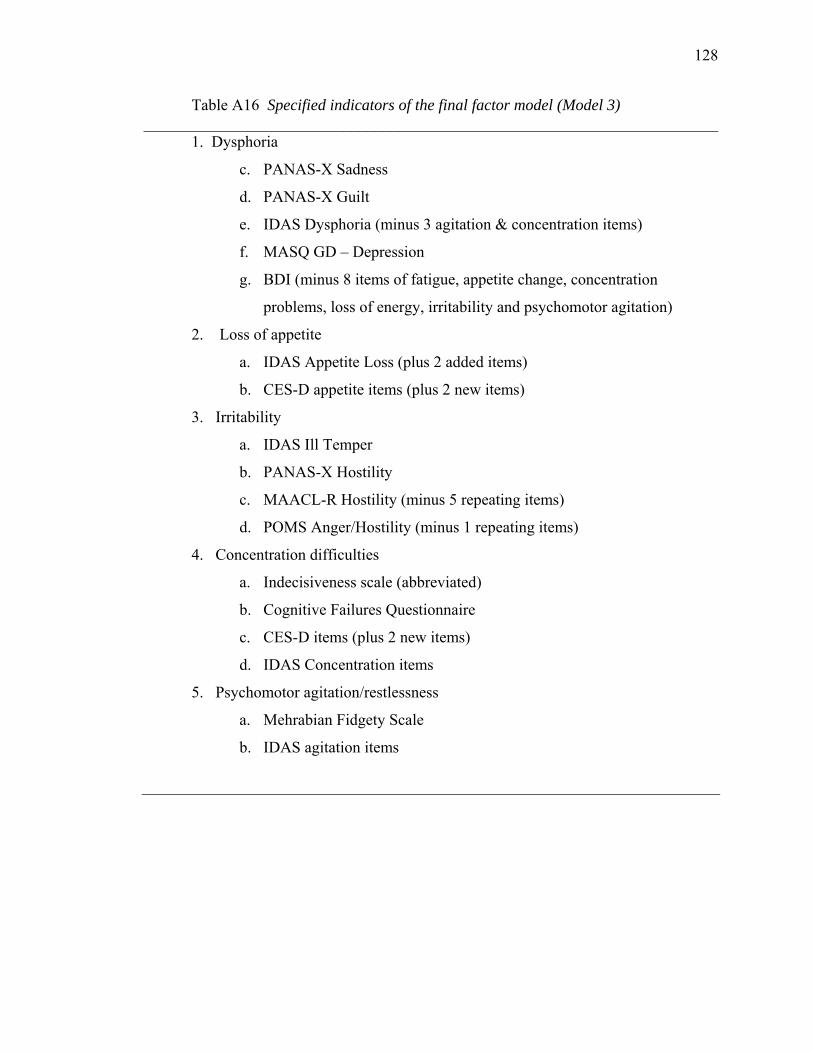
128
Table A16 Specified indicators of the final factor model (Model 3) ________________________________________________________________________
1. Dysphoria
c. PANAS-X Sadness
d. PANAS-X Guilt
e. IDAS Dysphoria (minus 3 agitation & concentration items)
f. MASQ GD – Depression
g. BDI (minus 8 items of fatigue, appetite change, concentration
problems, loss of energy, irritability and psychomotor agitation)
2. Loss of appetite
a. IDAS Appetite Loss (plus 2 added items)
b. CES-D appetite items (plus 2 new items)
3. Irritability
a. IDAS Ill Temper
b. PANAS-X Hostility
c. MAACL-R Hostility (minus 5 repeating items)
d. POMS Anger/Hostility (minus 1 repeating items)
4. Concentration difficulties
a. Indecisiveness scale (abbreviated)
b. Cognitive Failures Questionnaire
c. CES-D items (plus 2 new items)
d. IDAS Concentration items
5. Psychomotor agitation/restlessness
a. Mehrabian Fidgety Scale
b. IDAS agitation items

129
Table A16 (cont.) ________________________________________________________________________
6. Positive Affectivity
a. PANAS-X: Joviality scale
b. PANAS-X: Self-Assurance scale
c. MASQ: Anhedonic Depression-Positive Affectivity scale
d. IDAS Well Being
e. MAACL-R Positive Affect (minus 2 repeating items)
f. POMS Vigor/Activity (minus 3 repeating items)
7. Fatigue/Lethargy
a. IDAS Lassitude
b. PANAS-X Fatigue
c. POMS Fatigue/Inertia (minus 1 repeating item)
8. Autonomic Arousal/Tension
a. MASQ: Anxious Arousal scale
b. IDAS Panic
c. BAI (minus 7 cognitive/affective items)

130
Table A17 Correlations among Symptom Factors for Model 3
Factor .1 .2 .3 .4 .5 .6 .7 .8
__________________________________________________________________________
1. Dysphoria .— .72 .81 .87 .69 .53 -.72 .78
2. Autonomic Arousal .67 .— .65 .74 .76 .58 -.42 .63
3. Irritability .70 .44 .— .70 .68 .54 -.53 .65
4. Cognitive Difficulties .81 .69 .60 .— .82 .49 -.66 .78
5. Restlessness .62 .74 .53 .79 .— .56 -.40 .61
6. Appetite Loss .63 .53 .39 .54 .42 .— -.30 .40
7. Positive Affect -.72 -.45 -.39 -.55 -.36 -.51 .— -.68
8. Fatigue .76 .68 .60 .74 .66 .49 -.58 .—
Note. Correlations below the diagonal are diabetes patients, above the diagonal are community adults.
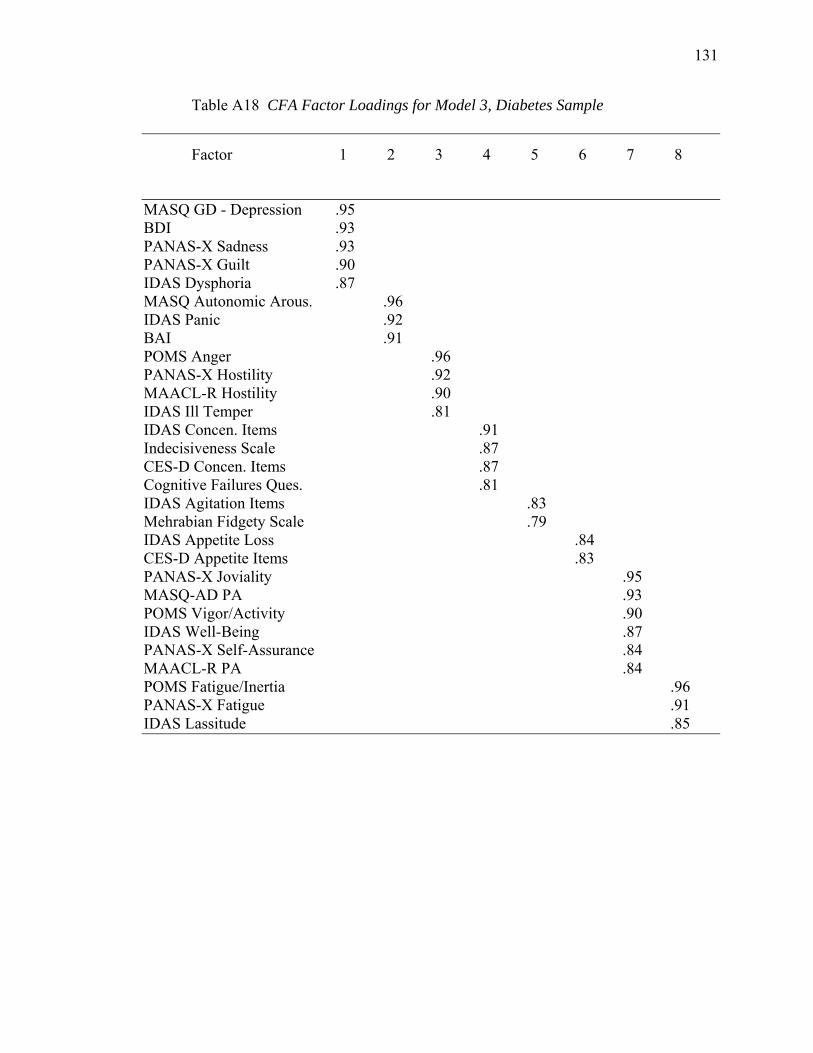
131
Table A18 CFA Factor Loadings for Model 3, Diabetes Sample
Factor .1 .2 .3 .4 .5 .6 .7 .8
MASQ GD - Depression .95 BDI .93 PANAS-X Sadness .93 PANAS-X Guilt .90 IDAS Dysphoria .87 MASQ Autonomic Arous. .96 IDAS Panic .92 BAI .91 POMS Anger .96 PANAS-X Hostility .92 MAACL-R Hostility .90 IDAS Ill Temper .81 IDAS Concen. Items .91 Indecisiveness Scale .87 CES-D Concen. Items .87 Cognitive Failures Ques. .81 IDAS Agitation Items .83 Mehrabian Fidgety Scale .79 IDAS Appetite Loss .84 CES-D Appetite Items .83 PANAS-X Joviality .95 MASQ-AD PA .93 POMS Vigor/Activity .90 IDAS Well-Being .87 PANAS-X Self-Assurance .84 MAACL-R PA .84 POMS Fatigue/Inertia .96 PANAS-X Fatigue .91 IDAS Lassitude .85
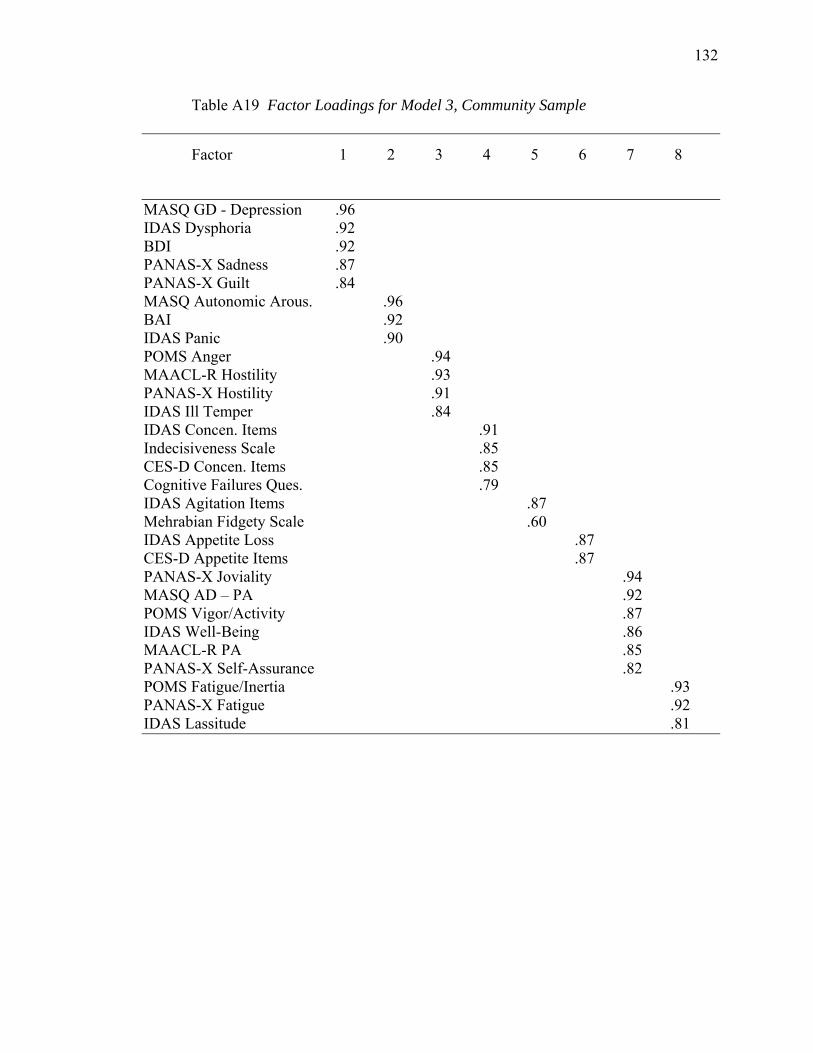
132
Table A19 Factor Loadings for Model 3, Community Sample
Factor .1 .2 .3 .4 .5 .6 .7 .8
MASQ GD - Depression .96 IDAS Dysphoria .92 BDI .92 PANAS-X Sadness .87 PANAS-X Guilt .84 MASQ Autonomic Arous. .96 BAI .92 IDAS Panic .90 POMS Anger .94 MAACL-R Hostility .93 PANAS-X Hostility .91 IDAS Ill Temper .84 IDAS Concen. Items .91 Indecisiveness Scale .85 CES-D Concen. Items .85 Cognitive Failures Ques. .79 IDAS Agitation Items .87 Mehrabian Fidgety Scale .60 IDAS Appetite Loss .87 CES-D Appetite Items .87 PANAS-X Joviality .94 MASQ AD – PA .92 POMS Vigor/Activity .87 IDAS Well-Being .86 MAACL-R PA .85 PANAS-X Self-Assurance .82 POMS Fatigue/Inertia .93 PANAS-X Fatigue .92 IDAS Lassitude .81
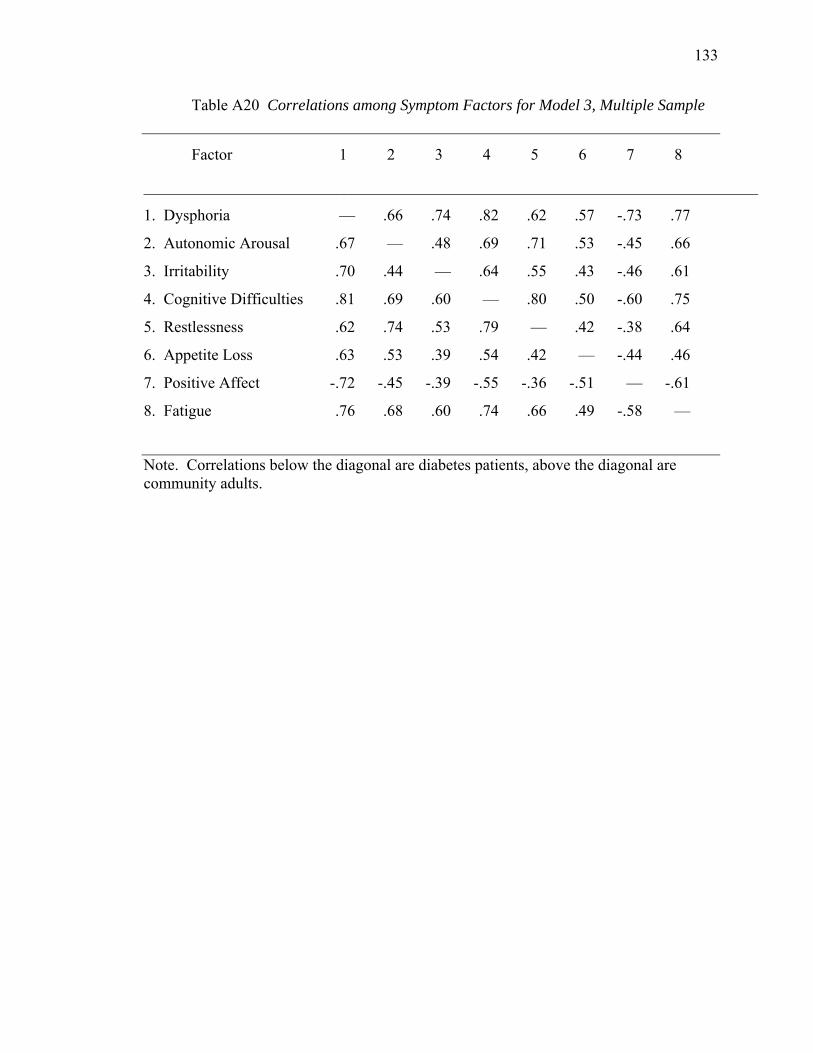
133
Table A20 Correlations among Symptom Factors for Model 3, Multiple Sample
Factor .1 .2 .3 .4 .5 .6 .7 .8
_____________________________________________________________________________
1. Dysphoria .— .66 .74 .82 .62 .57 -.73 .77
2. Autonomic Arousal .67 .— .48 .69 .71 .53 -.45 .66
3. Irritability .70 .44 .— .64 .55 .43 -.46 .61
4. Cognitive Difficulties .81 .69 .60 .— .80 .50 -.60 .75
5. Restlessness .62 .74 .53 .79 .— .42 -.38 .64
6. Appetite Loss .63 .53 .39 .54 .42 .— -.44 .46
7. Positive Affect -.72 -.45 -.39 -.55 -.36 -.51 .— -.61
8. Fatigue .76 .68 .60 .74 .66 .49 -.58 .—
Note. Correlations below the diagonal are diabetes patients, above the diagonal are community adults.
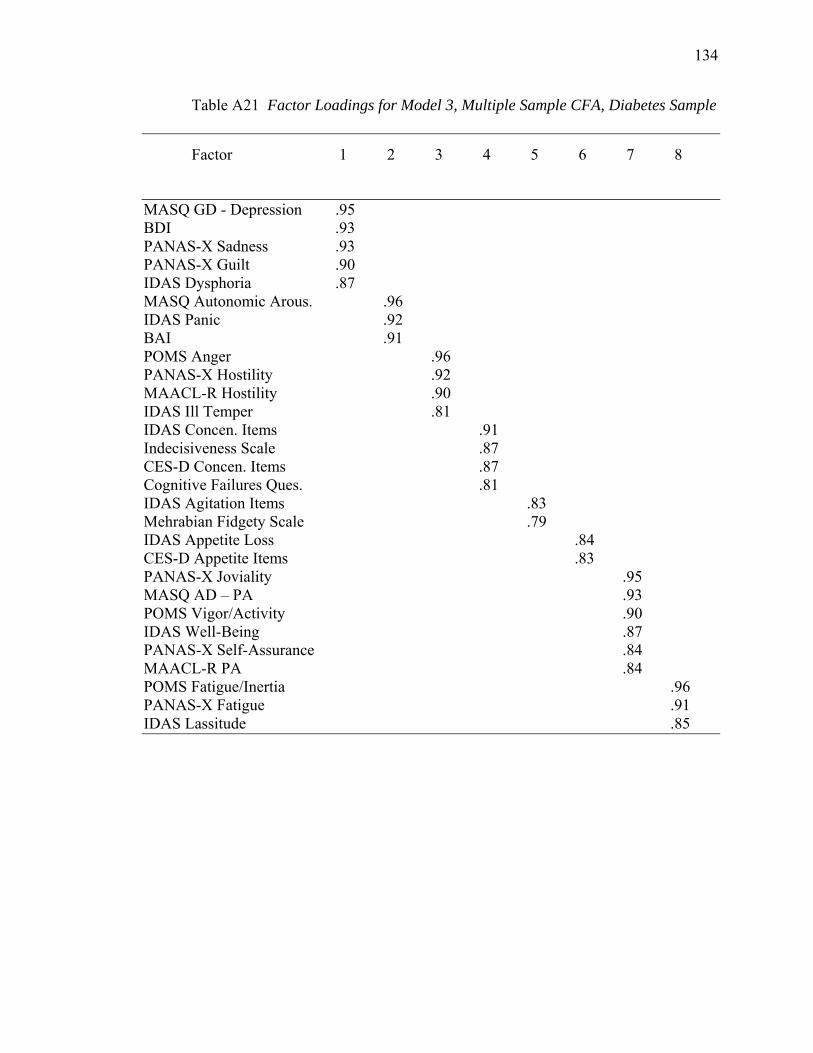
134
Table A21 Factor Loadings for Model 3, Multiple Sample CFA, Diabetes Sample
Factor .1 .2 .3 .4 .5 .6 .7 .8
MASQ GD - Depression .95 BDI .93 PANAS-X Sadness .93 PANAS-X Guilt .90 IDAS Dysphoria .87 MASQ Autonomic Arous. .96 IDAS Panic .92 BAI .91 POMS Anger .96 PANAS-X Hostility .92 MAACL-R Hostility .90 IDAS Ill Temper .81 IDAS Concen. Items .91 Indecisiveness Scale .87 CES-D Concen. Items .87 Cognitive Failures Ques. .81 IDAS Agitation Items .83 Mehrabian Fidgety Scale .79 IDAS Appetite Loss .84 CES-D Appetite Items .83 PANAS-X Joviality .95 MASQ AD – PA .93 POMS Vigor/Activity .90 IDAS Well-Being .87 PANAS-X Self-Assurance .84 MAACL-R PA .84 POMS Fatigue/Inertia .96 PANAS-X Fatigue .91 IDAS Lassitude .85

135
Table A22 Factor Loadings for Model 3, Multiple Sample CFA, Community Sample
Factor .1 .2 .3 .4 .5 .6 .7 .8
MASQ GD - Depression .95 BDI .93 PANAS-X Sadness .90 IDAS Dysphoria .88 PANAS-X Guilt .87 MASQ Autonomic Arous. .96 BAI .92 IDAS Panic .92 POMS Anger .95 PANAS-X Hostility .91 MAACL-R Hostility .90 IDAS Ill Temper .82 IDAS Concen. Items .91 CES-D Concen. Items .88 Indecisiveness Scale .87 Cognitive Failures Ques. .81 IDAS Agitation Items .82 Mehrabian Fidgety Scale .75 IDAS Appetite Loss .87 CES-D Appetite Items .86 PANAS-X Joviality .93 MASQ AD – PA .93 POMS Vigor/Activity .88 IDAS Well-Being .88 MAACL-R PA .85 PANAS-X Self-Assurance .83 POMS Fatigue/Inertia .94 PANAS-X Fatigue .92 IDAS Lassitude .84
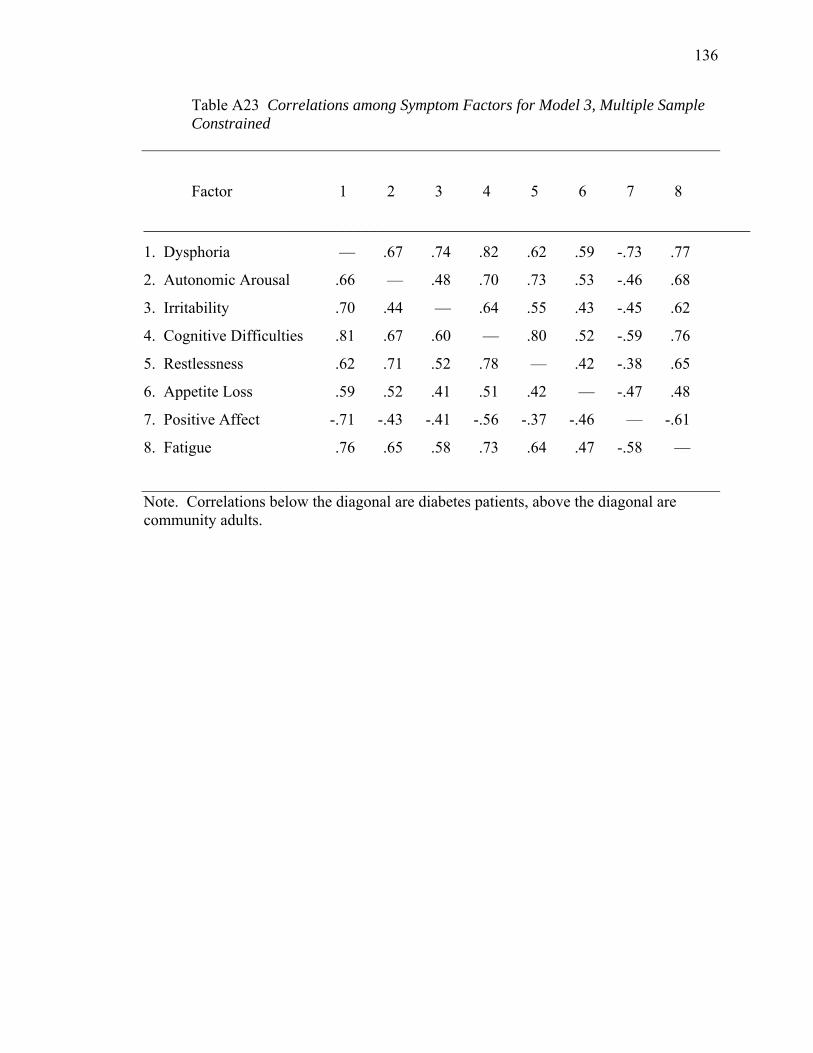
136
Table A23 Correlations among Symptom Factors for Model 3, Multiple Sample Constrained
Factor .1 .2 .3 .4 .5 .6 .7 .8
____________________________________________________________________________
1. Dysphoria .— .67 .74 .82 .62 .59 -.73 .77
2. Autonomic Arousal .66 .— .48 .70 .73 .53 -.46 .68
3. Irritability .70 .44 .— .64 .55 .43 -.45 .62
4. Cognitive Difficulties .81 .67 .60 .— .80 .52 -.59 .76
5. Restlessness .62 .71 .52 .78 .— .42 -.38 .65
6. Appetite Loss .59 .52 .41 .51 .42 .— -.47 .48
7. Positive Affect -.71 -.43 -.41 -.56 -.37 -.46 .— -.61
8. Fatigue .76 .65 .58 .73 .64 .47 -.58 .—
Note. Correlations below the diagonal are diabetes patients, above the diagonal are community adults.

137
Table A24 Factor Loadings for Model 3, Multiple Sample Constrained CFA, Diabetes Sample Factor .1 .2 .3 .4 .5 .6 .7 .8
MASQ GD - Depression .95 PANAS-X Sadness .93 BDI .92 PANAS-X Guilt .89 IDAS Dysphoria .86 MASQ Autonomic Arous. .95 IDAS Panic .91 BAI .90 POMS Anger .96 PANAS-X Hostility .91 MAACL-R Hostility .89 IDAS Ill Temper .81 IDAS Concen. Items .91 Indecisiveness Scale .87 CES-D Concen. Items .86 Cognitive Failures Ques. .81 IDAS Agitation Items .81 Mehrabian Fidgety Scale .78 IDAS Appetite Loss .85 CES-D Appetite Items .81 PANAS-X Joviality .95 MASQ AD – PA .93 POMS Vigor/Activity .89 IDAS Well-Being .87 PANAS Self-Assurance .84 MAACL-R PA .84 POMS Fatigue/Inertia .96 PANAS-X Fatigue .91 IDAS Lassitude .84
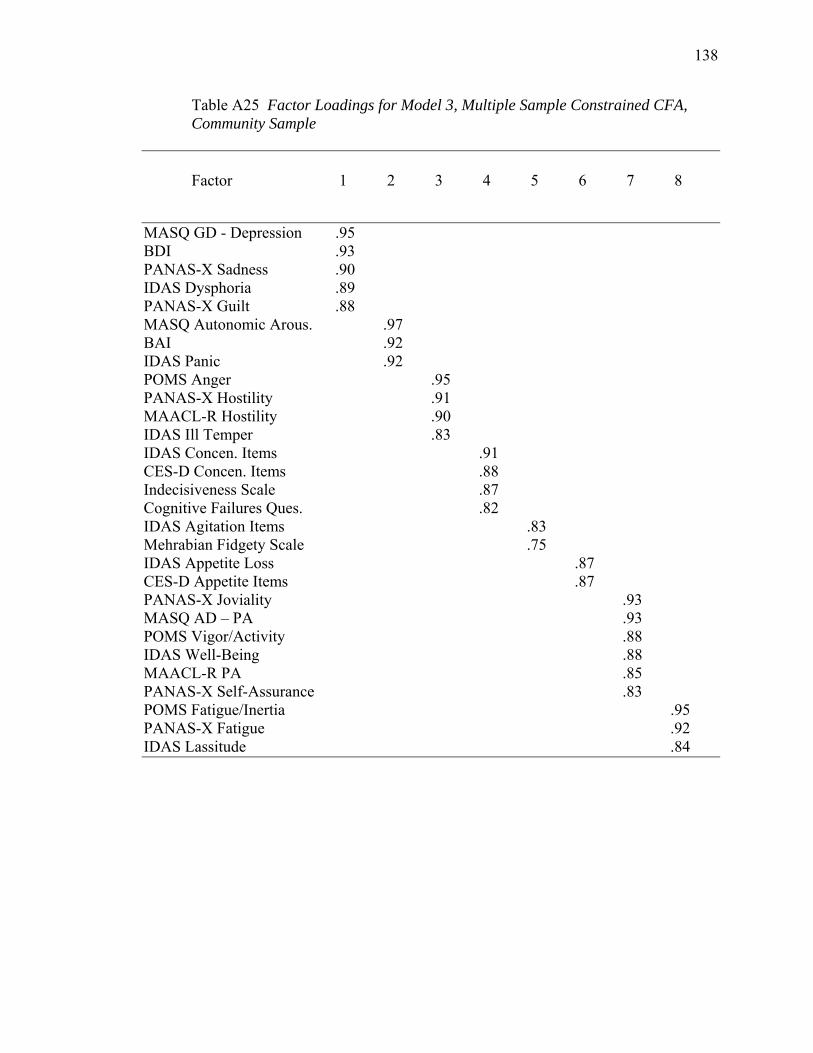
138
Table A25 Factor Loadings for Model 3, Multiple Sample Constrained CFA, Community Sample Factor .1 .2 .3 .4 .5 .6 .7 .8
MASQ GD - Depression .95 BDI .93 PANAS-X Sadness .90 IDAS Dysphoria .89 PANAS-X Guilt .88 MASQ Autonomic Arous. .97 BAI .92 IDAS Panic .92 POMS Anger .95 PANAS-X Hostility .91 MAACL-R Hostility .90 IDAS Ill Temper .83 IDAS Concen. Items .91 CES-D Concen. Items .88 Indecisiveness Scale .87 Cognitive Failures Ques. .82 IDAS Agitation Items .83 Mehrabian Fidgety Scale .75 IDAS Appetite Loss .87 CES-D Appetite Items .87 PANAS-X Joviality .93 MASQ AD – PA .93 POMS Vigor/Activity .88 IDAS Well-Being .88 MAACL-R PA .85 PANAS-X Self-Assurance .83 POMS Fatigue/Inertia .95 PANAS-X Fatigue .92 IDAS Lassitude .84
139
APPENDIX B: SELECTED MEASURES
1. Demographic Questionnaire
2. IDAS
3. MASQ
4. CES-D
5. Motivation to Eat Questionnaire
6. Indecisiveness Scale
7. Multifactorial Memory Questionnaire
8. PANAS-X, MAACL-R, POMS combined questionnaire
9. Cognitive Failures Questionnaire
10. Hospital Anxiety and Depression Scale
11. Mehrabian Fidgety Scale
12. Epworth Sleepiness Scale
13. Self-Completion Patient Outcome instrument
14. RAND 36-Item Health Survey
15. Medical Questionnaire
16. Health Information Questionnaire

140
Demographic Information
1. Today’s Date_____________
2. Your Age____________
3. Gender:
a. Male
b. Female
4. Are you Hispanic/ Latino?
1. Yes
2. No
5. What is your race?
1. American Indian/ Alaska Native
2. Asian
3. Native Hawaiian or Other Pacific Islander
4. Black or African American
5. White
6. Multiracial
4. What is your current marital status?
a. Single (Never Married)
b. Married
c. Widowed
d. Separated
e. Divorced
f. Not Married, Cohabitating with Partner

141
5. What is the highest level of education you’ve attained?
a. High School Dropout
b. GED
c. High School Diploma
d. Vocational, Technical, Associate’s Degree
e. Some College
f. Bachelor’s Degree
g. Master’s Degree
h. Doctorate
6. What is your approximate total household income per year? (include all sources,
child support, alimony, unemployment)
a. less than $9,999
b. $10,000-$19,999
c. $20,000-$29,999
d. $30,000-$39,999
e. $40,000-$49,999
f. $50,000-$59,999
g. $60,000-$69,999
h. $70,000-$79,999
i. $80,000-$89,999
j. $90,000+
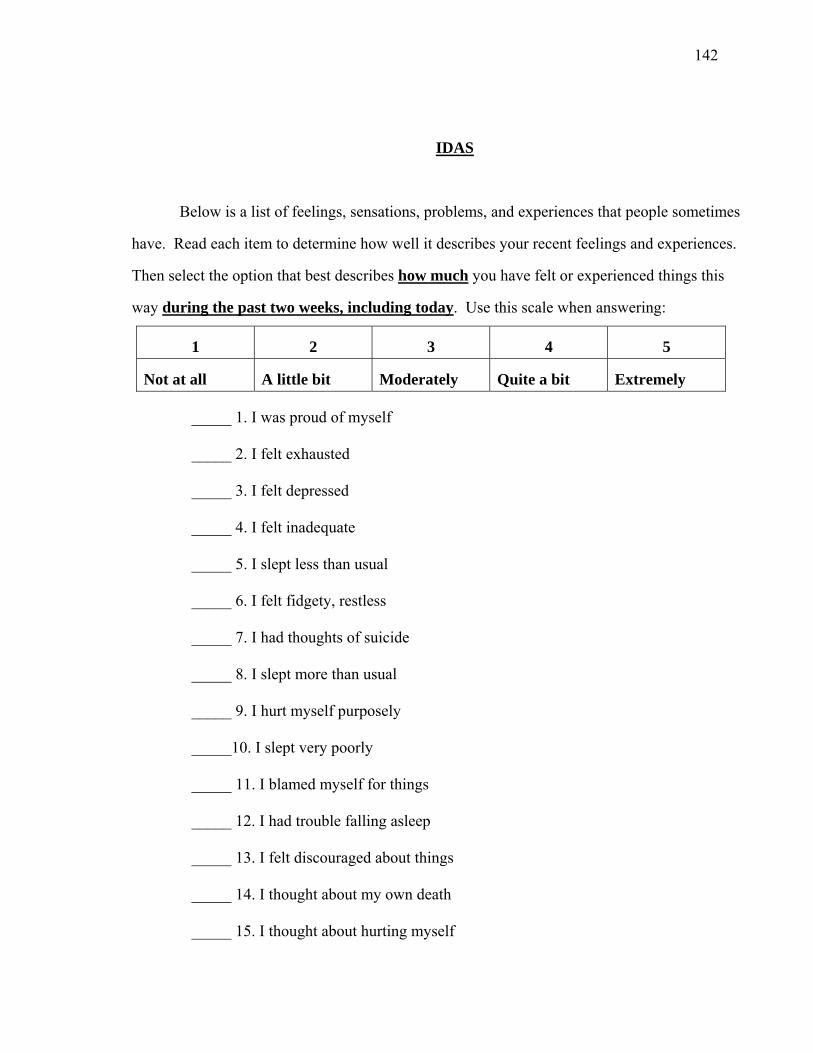
142
IDAS
Below is a list of feelings, sensations, problems, and experiences that people sometimes
have. Read each item to determine how well it describes your recent feelings and experiences.
Then select the option that best describes how much you have felt or experienced things this
way during the past two weeks, including today. Use this scale when answering:
_____ 1. I was proud of myself
_____ 2. I felt exhausted
_____ 3. I felt depressed
_____ 4. I felt inadequate
_____ 5. I slept less than usual
_____ 6. I felt fidgety, restless
_____ 7. I had thoughts of suicide
_____ 8. I slept more than usual
_____ 9. I hurt myself purposely
_____10. I slept very poorly
_____ 11. I blamed myself for things
_____ 12. I had trouble falling asleep
_____ 13. I felt discouraged about things
_____ 14. I thought about my own death
_____ 15. I thought about hurting myself
1 2 3 4 5
Not at all A little bit Moderately Quite a bit Extremely
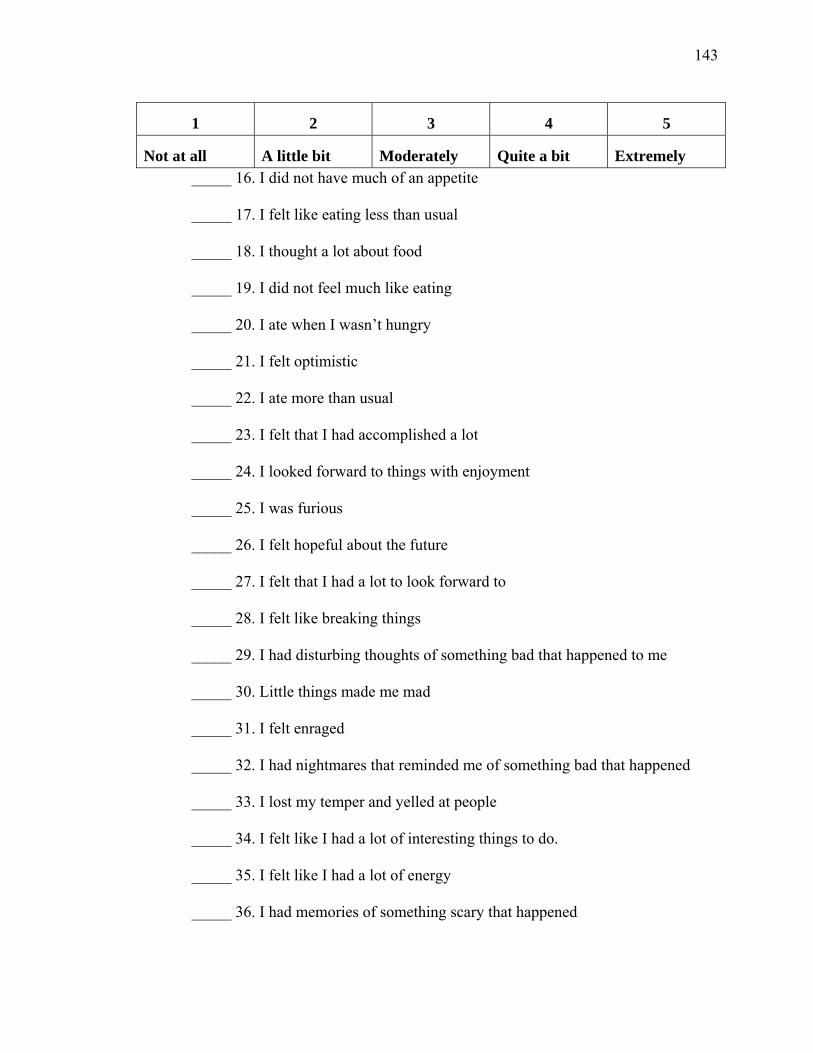
143
_____ 16. I did not have much of an appetite
_____ 17. I felt like eating less than usual
_____ 18. I thought a lot about food
_____ 19. I did not feel much like eating
_____ 20. I ate when I wasn’t hungry
_____ 21. I felt optimistic
_____ 22. I ate more than usual
_____ 23. I felt that I had accomplished a lot
_____ 24. I looked forward to things with enjoyment
_____ 25. I was furious
_____ 26. I felt hopeful about the future
_____ 27. I felt that I had a lot to look forward to
_____ 28. I felt like breaking things
_____ 29. I had disturbing thoughts of something bad that happened to me
_____ 30. Little things made me mad
_____ 31. I felt enraged
_____ 32. I had nightmares that reminded me of something bad that happened
_____ 33. I lost my temper and yelled at people
_____ 34. I felt like I had a lot of interesting things to do.
_____ 35. I felt like I had a lot of energy
_____ 36. I had memories of something scary that happened
1 2 3 4 5
Not at all A little bit Moderately Quite a bit Extremely
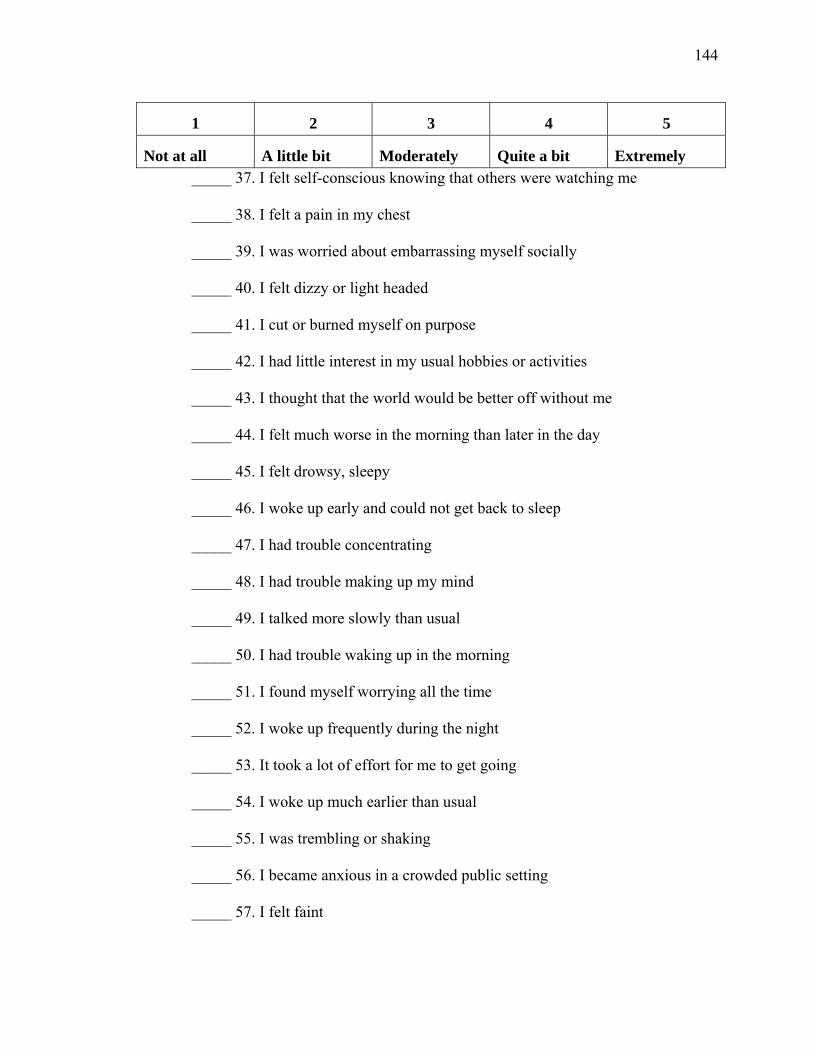
144
_____ 37. I felt self-conscious knowing that others were watching me
_____ 38. I felt a pain in my chest
_____ 39. I was worried about embarrassing myself socially
_____ 40. I felt dizzy or light headed
_____ 41. I cut or burned myself on purpose
_____ 42. I had little interest in my usual hobbies or activities
_____ 43. I thought that the world would be better off without me
_____ 44. I felt much worse in the morning than later in the day
_____ 45. I felt drowsy, sleepy
_____ 46. I woke up early and could not get back to sleep
_____ 47. I had trouble concentrating
_____ 48. I had trouble making up my mind
_____ 49. I talked more slowly than usual
_____ 50. I had trouble waking up in the morning
_____ 51. I found myself worrying all the time
_____ 52. I woke up frequently during the night
_____ 53. It took a lot of effort for me to get going
_____ 54. I woke up much earlier than usual
_____ 55. I was trembling or shaking
_____ 56. I became anxious in a crowded public setting
_____ 57. I felt faint
1 2 3 4 5
Not at all A little bit Moderately Quite a bit Extremely
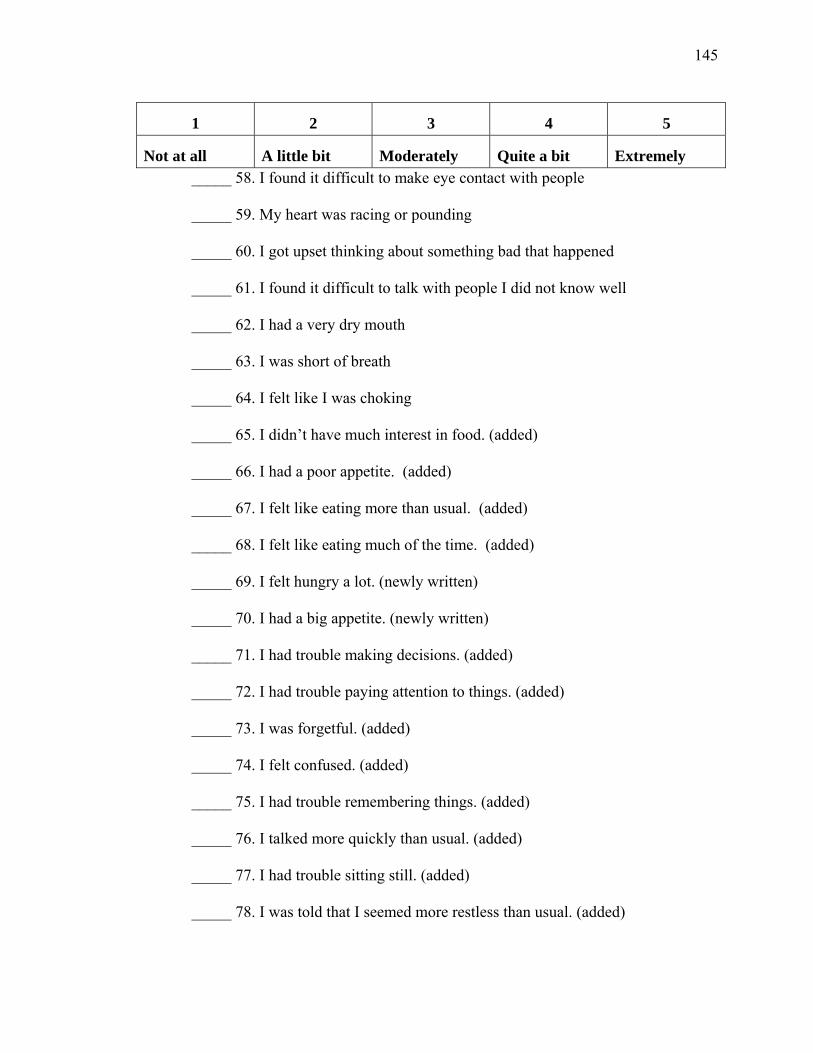
145
_____ 58. I found it difficult to make eye contact with people
_____ 59. My heart was racing or pounding
_____ 60. I got upset thinking about something bad that happened
_____ 61. I found it difficult to talk with people I did not know well
_____ 62. I had a very dry mouth
_____ 63. I was short of breath
_____ 64. I felt like I was choking
_____ 65. I didn’t have much interest in food. (added)
_____ 66. I had a poor appetite. (added)
_____ 67. I felt like eating more than usual. (added)
_____ 68. I felt like eating much of the time. (added)
_____ 69. I felt hungry a lot. (newly written)
_____ 70. I had a big appetite. (newly written)
_____ 71. I had trouble making decisions. (added)
_____ 72. I had trouble paying attention to things. (added)
_____ 73. I was forgetful. (added)
_____ 74. I felt confused. (added)
_____ 75. I had trouble remembering things. (added)
_____ 76. I talked more quickly than usual. (added)
_____ 77. I had trouble sitting still. (added)
_____ 78. I was told that I seemed more restless than usual. (added)
1 2 3 4 5
Not at all A little bit Moderately Quite a bit Extremely
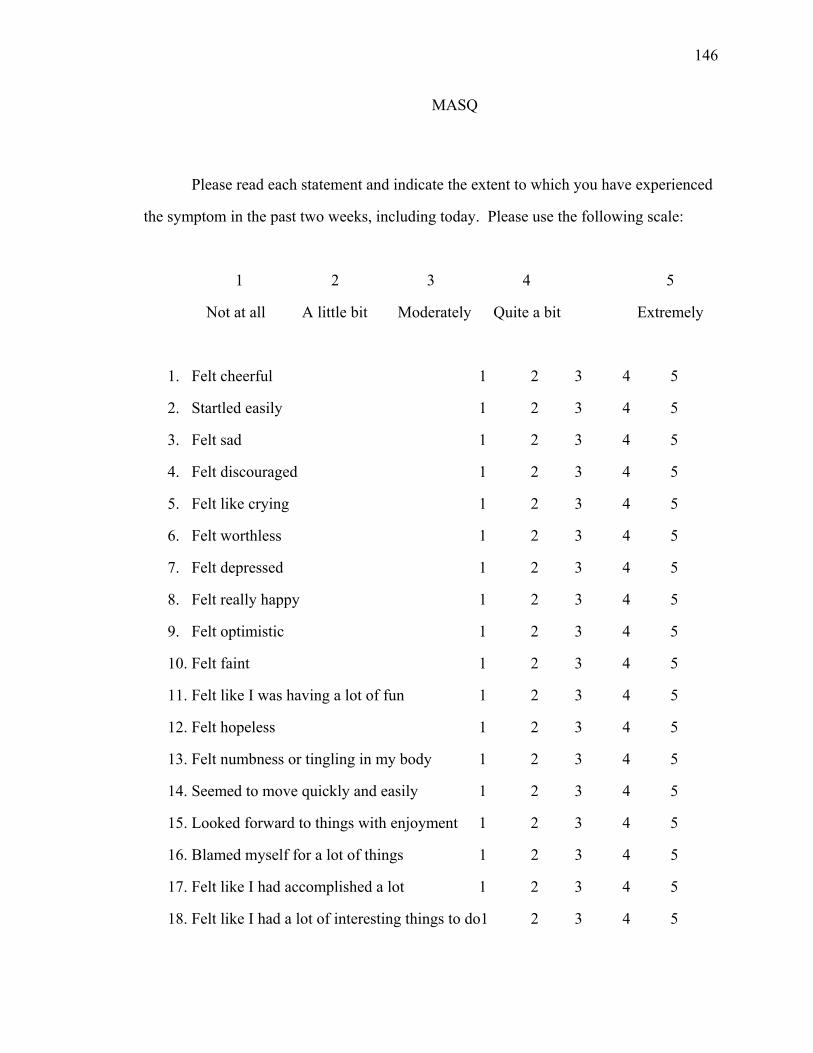
146
MASQ
Please read each statement and indicate the extent to which you have experienced
the symptom in the past two weeks, including today. Please use the following scale:
1 2 3 4 5
Not at all A little bit Moderately Quite a bit Extremely
1. Felt cheerful 1 2 3 4 5
2. Startled easily 1 2 3 4 5
3. Felt sad 1 2 3 4 5
4. Felt discouraged 1 2 3 4 5
5. Felt like crying 1 2 3 4 5
6. Felt worthless 1 2 3 4 5
7. Felt depressed 1 2 3 4 5
8. Felt really happy 1 2 3 4 5
9. Felt optimistic 1 2 3 4 5
10. Felt faint 1 2 3 4 5
11. Felt like I was having a lot of fun 1 2 3 4 5
12. Felt hopeless 1 2 3 4 5
13. Felt numbness or tingling in my body 1 2 3 4 5
14. Seemed to move quickly and easily 1 2 3 4 5
15. Looked forward to things with enjoyment 1 2 3 4 5
16. Blamed myself for a lot of things 1 2 3 4 5
17. Felt like I had accomplished a lot 1 2 3 4 5
18. Felt like I had a lot of interesting things to do1 2 3 4 5
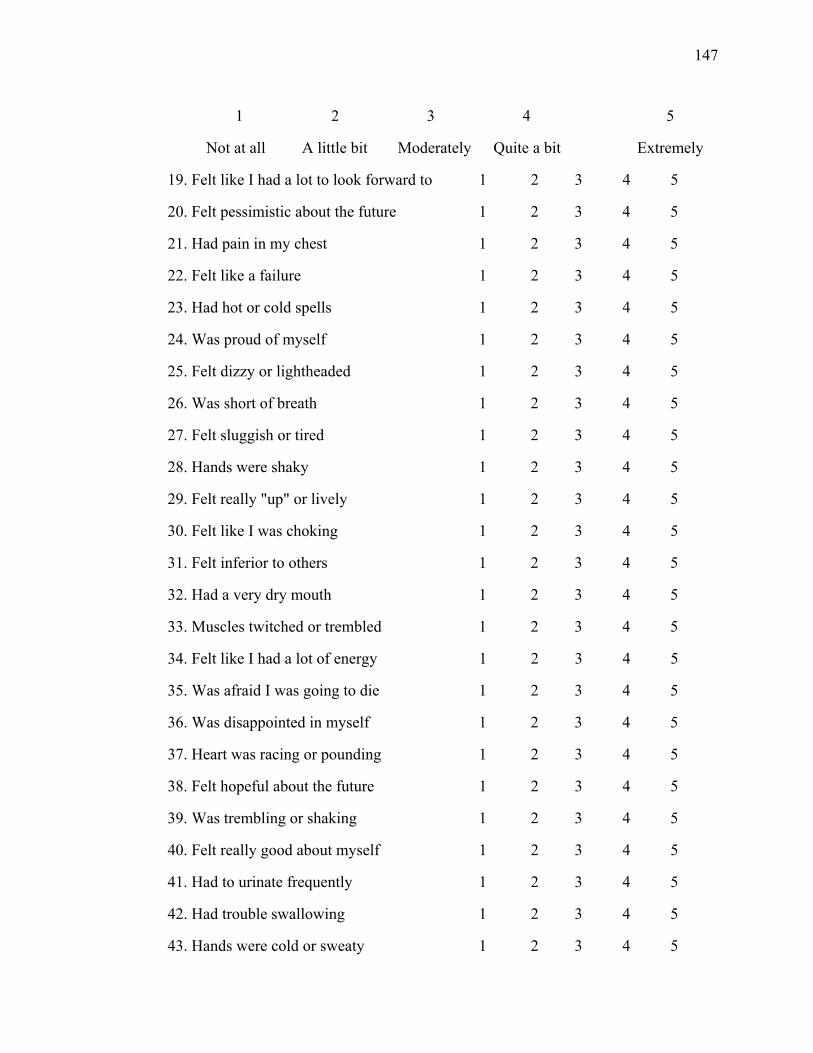
147
1 2 3 4 5
Not at all A little bit Moderately Quite a bit Extremely
19. Felt like I had a lot to look forward to 1 2 3 4 5
20. Felt pessimistic about the future 1 2 3 4 5
21. Had pain in my chest 1 2 3 4 5
22. Felt like a failure 1 2 3 4 5
23. Had hot or cold spells 1 2 3 4 5
24. Was proud of myself 1 2 3 4 5
25. Felt dizzy or lightheaded 1 2 3 4 5
26. Was short of breath 1 2 3 4 5
27. Felt sluggish or tired 1 2 3 4 5
28. Hands were shaky 1 2 3 4 5
29. Felt really "up" or lively 1 2 3 4 5
30. Felt like I was choking 1 2 3 4 5
31. Felt inferior to others 1 2 3 4 5
32. Had a very dry mouth 1 2 3 4 5
33. Muscles twitched or trembled 1 2 3 4 5
34. Felt like I had a lot of energy 1 2 3 4 5
35. Was afraid I was going to die 1 2 3 4 5
36. Was disappointed in myself 1 2 3 4 5
37. Heart was racing or pounding 1 2 3 4 5
38. Felt hopeful about the future 1 2 3 4 5
39. Was trembling or shaking 1 2 3 4 5
40. Felt really good about myself 1 2 3 4 5
41. Had to urinate frequently 1 2 3 4 5
42. Had trouble swallowing 1 2 3 4 5
43. Hands were cold or sweaty 1 2 3 4 5
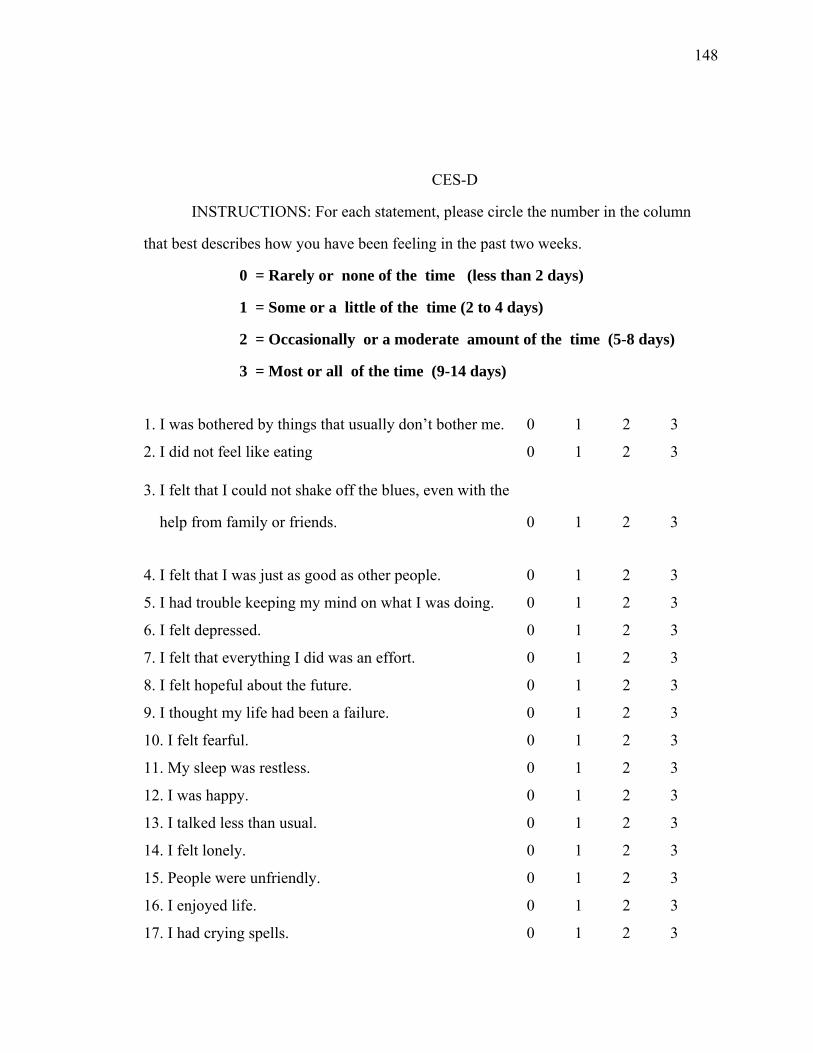
148
CES-D
INSTRUCTIONS: For each statement, please circle the number in the column
that best describes how you have been feeling in the past two weeks.
0 = Rarely or none of the time (less than 2 days)
1 = Some or a little of the time (2 to 4 days)
2 = Occasionally or a moderate amount of the time (5-8 days)
3 = Most or all of the time (9-14 days)
1. I was bothered by things that usually don’t bother me. 0 1 2 3
2. I did not feel like eating 0 1 2 3
3. I felt that I could not shake off the blues, even with the
help from family or friends. 0 1 2 3
4. I felt that I was just as good as other people. 0 1 2 3
5. I had trouble keeping my mind on what I was doing. 0 1 2 3
6. I felt depressed. 0 1 2 3
7. I felt that everything I did was an effort. 0 1 2 3
8. I felt hopeful about the future. 0 1 2 3
9. I thought my life had been a failure. 0 1 2 3
10. I felt fearful. 0 1 2 3
11. My sleep was restless. 0 1 2 3
12. I was happy. 0 1 2 3
13. I talked less than usual. 0 1 2 3
14. I felt lonely. 0 1 2 3
15. People were unfriendly. 0 1 2 3
16. I enjoyed life. 0 1 2 3
17. I had crying spells. 0 1 2 3
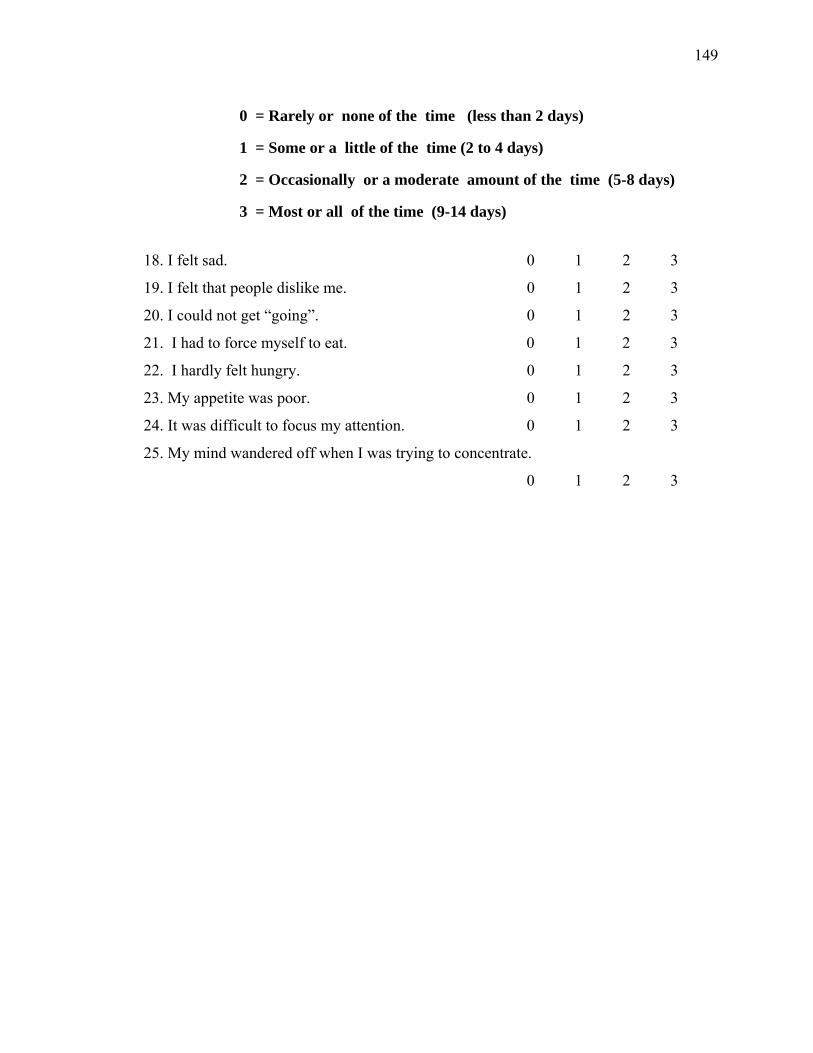
149
0 = Rarely or none of the time (less than 2 days)
1 = Some or a little of the time (2 to 4 days)
2 = Occasionally or a moderate amount of the time (5-8 days)
3 = Most or all of the time (9-14 days)
18. I felt sad. 0 1 2 3
19. I felt that people dislike me. 0 1 2 3
20. I could not get “going”. 0 1 2 3
21. I had to force myself to eat. 0 1 2 3
22. I hardly felt hungry. 0 1 2 3
23. My appetite was poor. 0 1 2 3
24. It was difficult to focus my attention. 0 1 2 3
25. My mind wandered off when I was trying to concentrate.
0 1 2 3
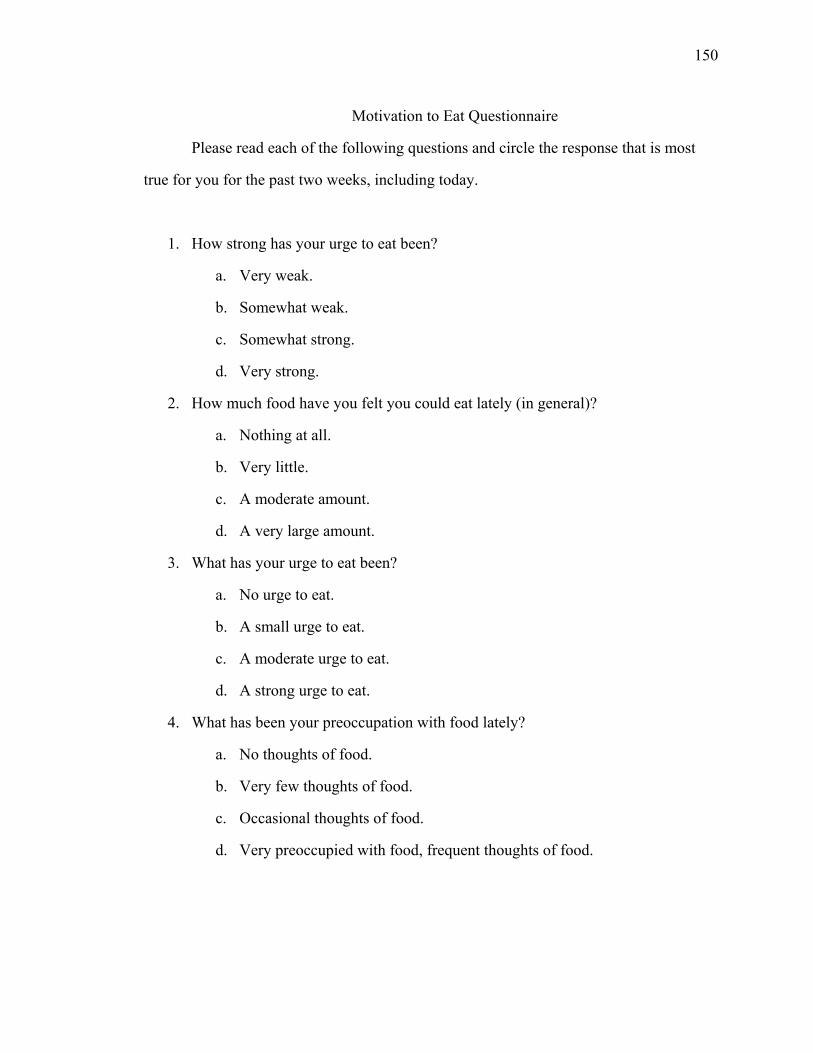
150
Motivation to Eat Questionnaire
Please read each of the following questions and circle the response that is most
true for you for the past two weeks, including today.
1. How strong has your urge to eat been?
a. Very weak.
b. Somewhat weak.
c. Somewhat strong.
d. Very strong.
2. How much food have you felt you could eat lately (in general)?
a. Nothing at all.
b. Very little.
c. A moderate amount.
d. A very large amount.
3. What has your urge to eat been?
a. No urge to eat.
b. A small urge to eat.
c. A moderate urge to eat.
d. A strong urge to eat.
4. What has been your preoccupation with food lately?
a. No thoughts of food.
b. Very few thoughts of food.
c. Occasional thoughts of food.
d. Very preoccupied with food, frequent thoughts of food.
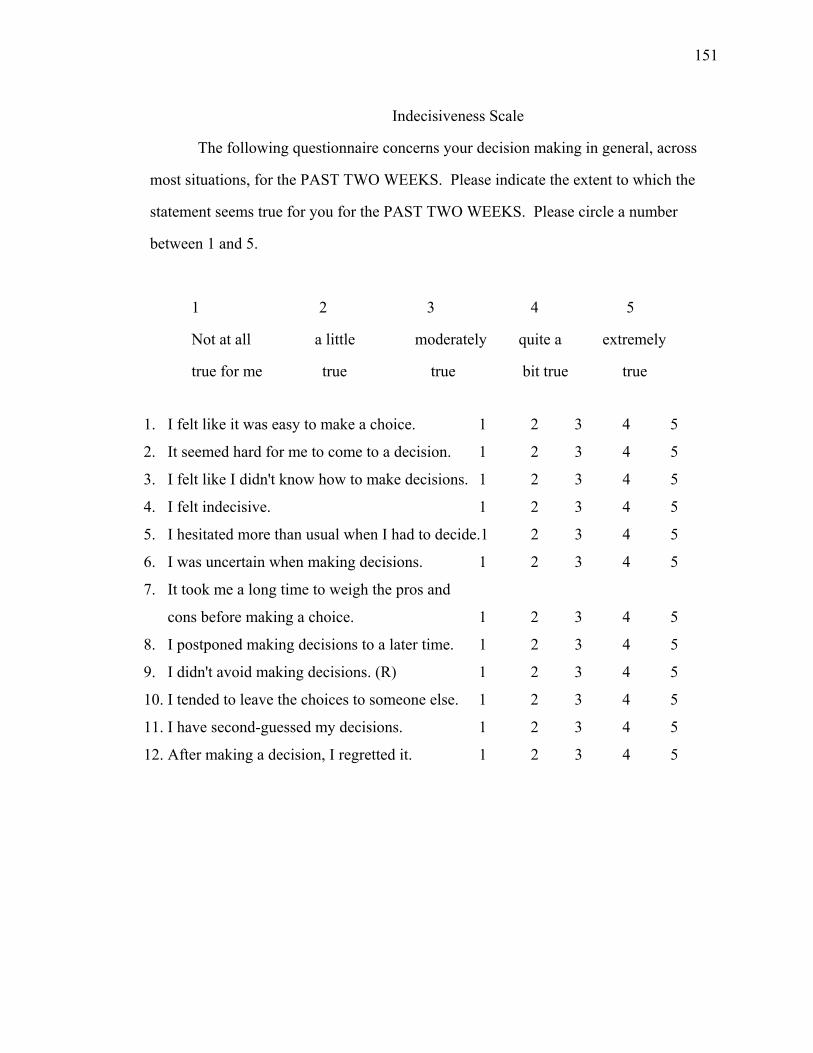
151
Indecisiveness Scale
The following questionnaire concerns your decision making in general, across
most situations, for the PAST TWO WEEKS. Please indicate the extent to which the
statement seems true for you for the PAST TWO WEEKS. Please circle a number
between 1 and 5.
1 2 3 4 5
Not at all a little moderately quite a extremely
true for me true true bit true true
1. I felt like it was easy to make a choice. 1 2 3 4 5
2. It seemed hard for me to come to a decision. 1 2 3 4 5
3. I felt like I didn't know how to make decisions. 1 2 3 4 5
4. I felt indecisive. 1 2 3 4 5
5. I hesitated more than usual when I had to decide.1 2 3 4 5
6. I was uncertain when making decisions. 1 2 3 4 5
7. It took me a long time to weigh the pros and
cons before making a choice. 1 2 3 4 5
8. I postponed making decisions to a later time. 1 2 3 4 5
9. I didn't avoid making decisions. (R) 1 2 3 4 5
10. I tended to leave the choices to someone else. 1 2 3 4 5
11. I have second-guessed my decisions. 1 2 3 4 5
12. After making a decision, I regretted it. 1 2 3 4 5
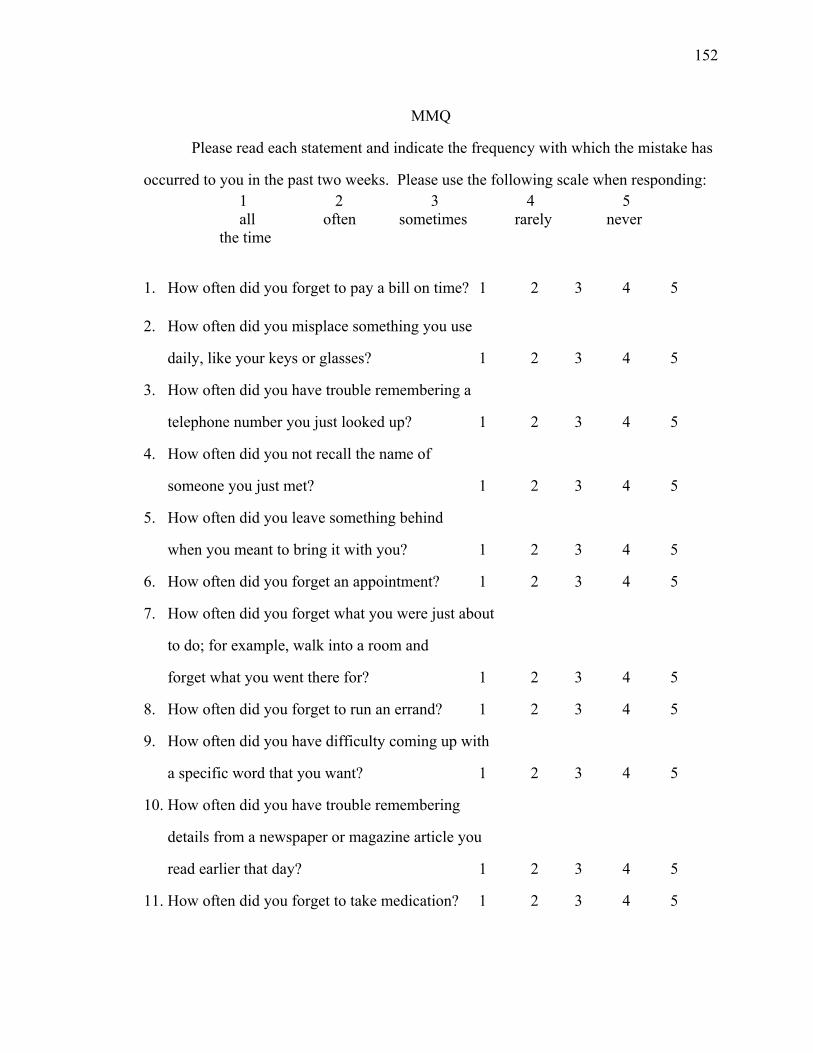
152
MMQ
Please read each statement and indicate the frequency with which the mistake has
occurred to you in the past two weeks. Please use the following scale when responding: 1 2 3 4 5 all often sometimes rarely never
the time
1. How often did you forget to pay a bill on time? 1 2 3 4 5
2. How often did you misplace something you use
daily, like your keys or glasses? 1 2 3 4 5
3. How often did you have trouble remembering a
telephone number you just looked up? 1 2 3 4 5
4. How often did you not recall the name of
someone you just met? 1 2 3 4 5
5. How often did you leave something behind
when you meant to bring it with you? 1 2 3 4 5
6. How often did you forget an appointment? 1 2 3 4 5
7. How often did you forget what you were just about
to do; for example, walk into a room and
forget what you went there for? 1 2 3 4 5
8. How often did you forget to run an errand? 1 2 3 4 5
9. How often did you have difficulty coming up with
a specific word that you want? 1 2 3 4 5
10. How often did you have trouble remembering
details from a newspaper or magazine article you
read earlier that day? 1 2 3 4 5
11. How often did you forget to take medication? 1 2 3 4 5
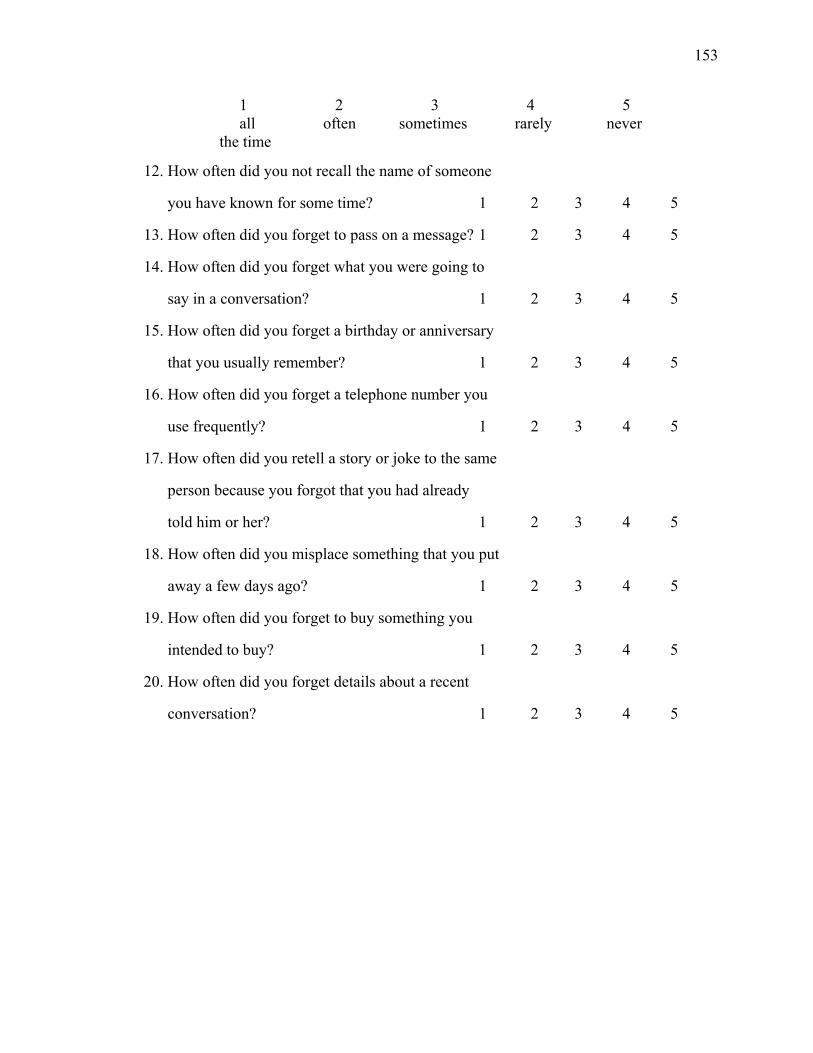
153
1 2 3 4 5 all often sometimes rarely never
the time
12. How often did you not recall the name of someone
you have known for some time? 1 2 3 4 5
13. How often did you forget to pass on a message? 1 2 3 4 5
14. How often did you forget what you were going to
say in a conversation? 1 2 3 4 5
15. How often did you forget a birthday or anniversary
that you usually remember? 1 2 3 4 5
16. How often did you forget a telephone number you
use frequently? 1 2 3 4 5
17. How often did you retell a story or joke to the same
person because you forgot that you had already
told him or her? 1 2 3 4 5
18. How often did you misplace something that you put
away a few days ago? 1 2 3 4 5
19. How often did you forget to buy something you
intended to buy? 1 2 3 4 5
20. How often did you forget details about a recent
conversation? 1 2 3 4 5
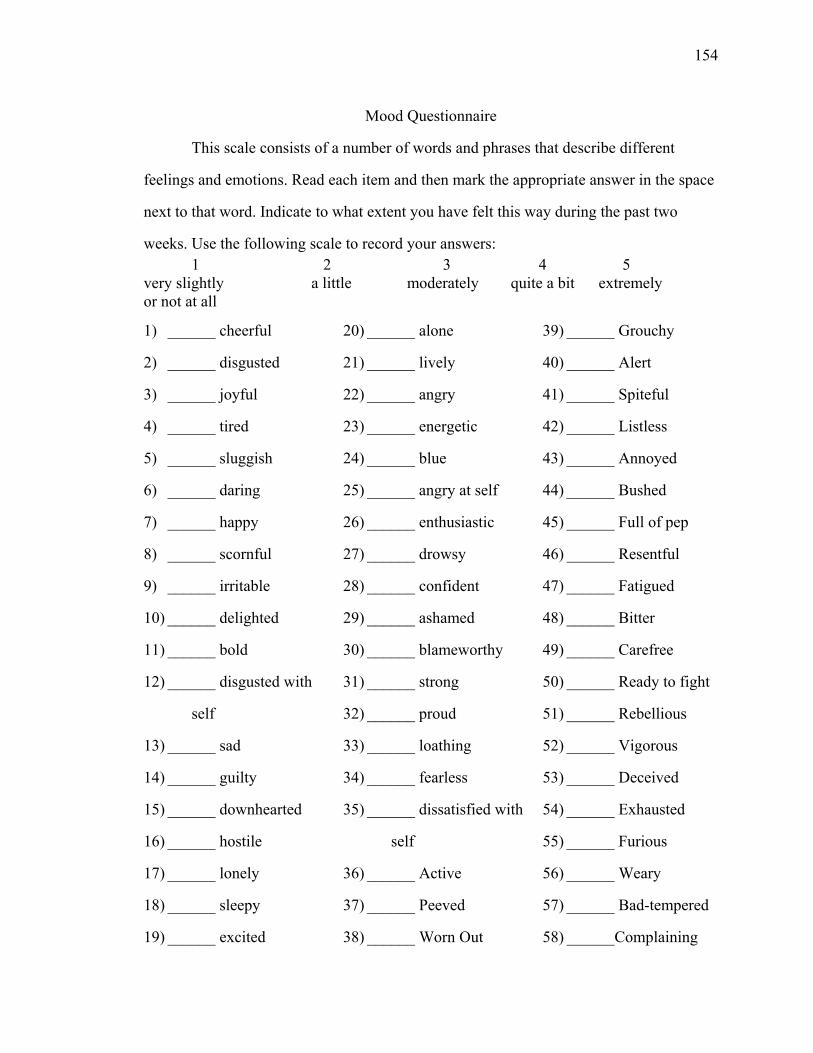
154
Mood Questionnaire
This scale consists of a number of words and phrases that describe different
feelings and emotions. Read each item and then mark the appropriate answer in the space
next to that word. Indicate to what extent you have felt this way during the past two
weeks. Use the following scale to record your answers: 1 2 3 4 5 very slightly a little moderately quite a bit extremely or not at all
1) ______ cheerful
2) ______ disgusted
3) ______ joyful
4) ______ tired
5) ______ sluggish
6) ______ daring
7) ______ happy
8) ______ scornful
9) ______ irritable
10) ______ delighted
11) ______ bold
12) ______ disgusted with
self
13) ______ sad
14) ______ guilty
15) ______ downhearted
16) ______ hostile
17) ______ lonely
18) ______ sleepy
19) ______ excited
20) ______ alone
21) ______ lively
22) ______ angry
23) ______ energetic
24) ______ blue
25) ______ angry at self
26) ______ enthusiastic
27) ______ drowsy
28) ______ confident
29) ______ ashamed
30) ______ blameworthy
31) ______ strong
32) ______ proud
33) ______ loathing
34) ______ fearless
35) ______ dissatisfied with
self
36) ______ Active
37) ______ Peeved
38) ______ Worn Out
39) ______ Grouchy
40) ______ Alert
41) ______ Spiteful
42) ______ Listless
43) ______ Annoyed
44) ______ Bushed
45) ______ Full of pep
46) ______ Resentful
47) ______ Fatigued
48) ______ Bitter
49) ______ Carefree
50) ______ Ready to fight
51) ______ Rebellious
52) ______ Vigorous
53) ______ Deceived
54) ______ Exhausted
55) ______ Furious
56) ______ Weary
57) ______ Bad-tempered
58) ______Complaining
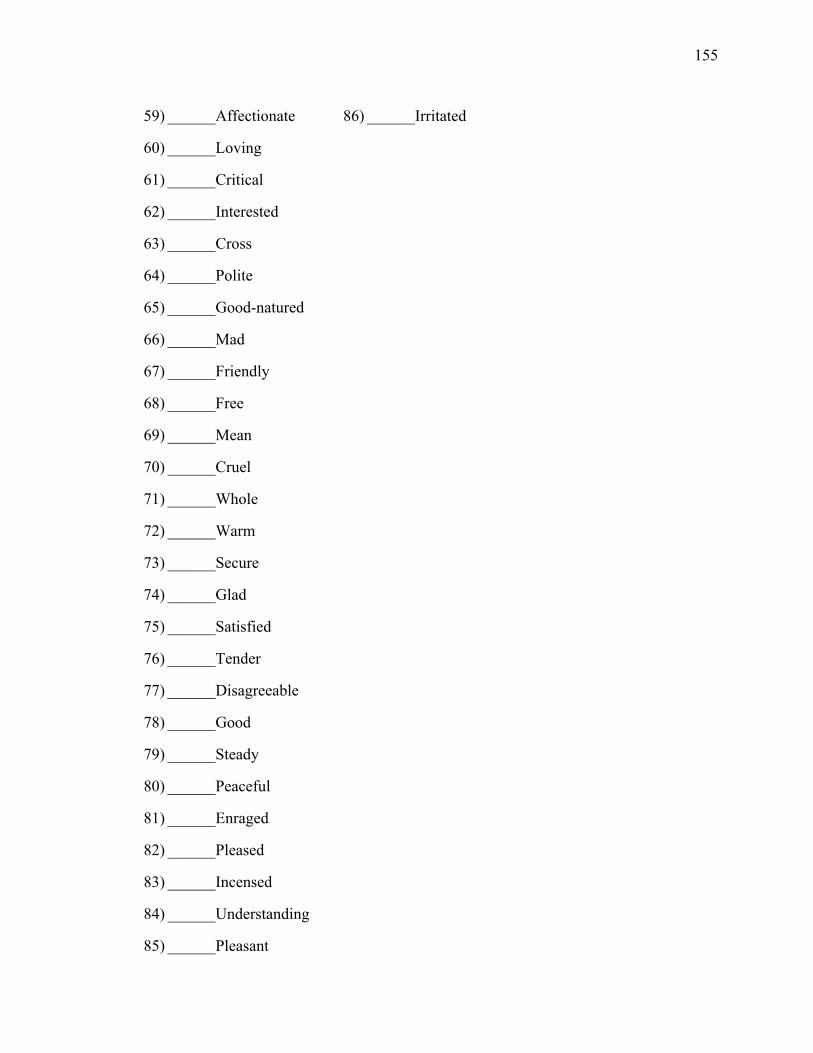
155
59) ______Affectionate
60) ______Loving
61) ______Critical
62) ______Interested
63) ______Cross
64) ______Polite
65) ______Good-natured
66) ______Mad
67) ______Friendly
68) ______Free
69) ______Mean
70) ______Cruel
71) ______Whole
72) ______Warm
73) ______Secure
74) ______Glad
75) ______Satisfied
76) ______Tender
77) ______Disagreeable
78) ______Good
79) ______Steady
80) ______Peaceful
81) ______Enraged
82) ______Pleased
83) ______Incensed
84) ______Understanding
85) ______Pleasant
86) ______Irritated
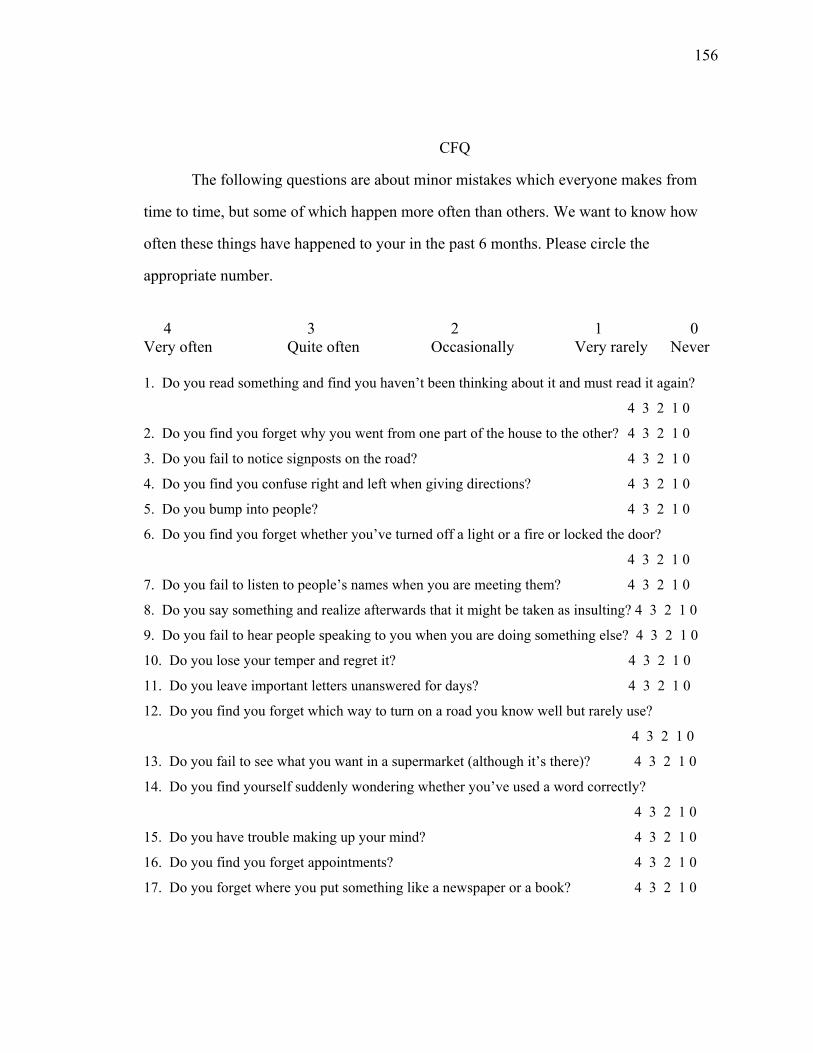
156
CFQ
The following questions are about minor mistakes which everyone makes from
time to time, but some of which happen more often than others. We want to know how
often these things have happened to your in the past 6 months. Please circle the
appropriate number.
4 3 2 1 0
Very often Quite often Occasionally Very rarely Never 1. Do you read something and find you haven’t been thinking about it and must read it again?
4 3 2 1 0
2. Do you find you forget why you went from one part of the house to the other? 4 3 2 1 0
3. Do you fail to notice signposts on the road? 4 3 2 1 0
4. Do you find you confuse right and left when giving directions? 4 3 2 1 0
5. Do you bump into people? 4 3 2 1 0
6. Do you find you forget whether you’ve turned off a light or a fire or locked the door?
4 3 2 1 0
7. Do you fail to listen to people’s names when you are meeting them? 4 3 2 1 0
8. Do you say something and realize afterwards that it might be taken as insulting? 4 3 2 1 0
9. Do you fail to hear people speaking to you when you are doing something else? 4 3 2 1 0
10. Do you lose your temper and regret it? 4 3 2 1 0
11. Do you leave important letters unanswered for days? 4 3 2 1 0
12. Do you find you forget which way to turn on a road you know well but rarely use?
4 3 2 1 0
13. Do you fail to see what you want in a supermarket (although it’s there)? 4 3 2 1 0
14. Do you find yourself suddenly wondering whether you’ve used a word correctly?
4 3 2 1 0
15. Do you have trouble making up your mind? 4 3 2 1 0
16. Do you find you forget appointments? 4 3 2 1 0
17. Do you forget where you put something like a newspaper or a book? 4 3 2 1 0
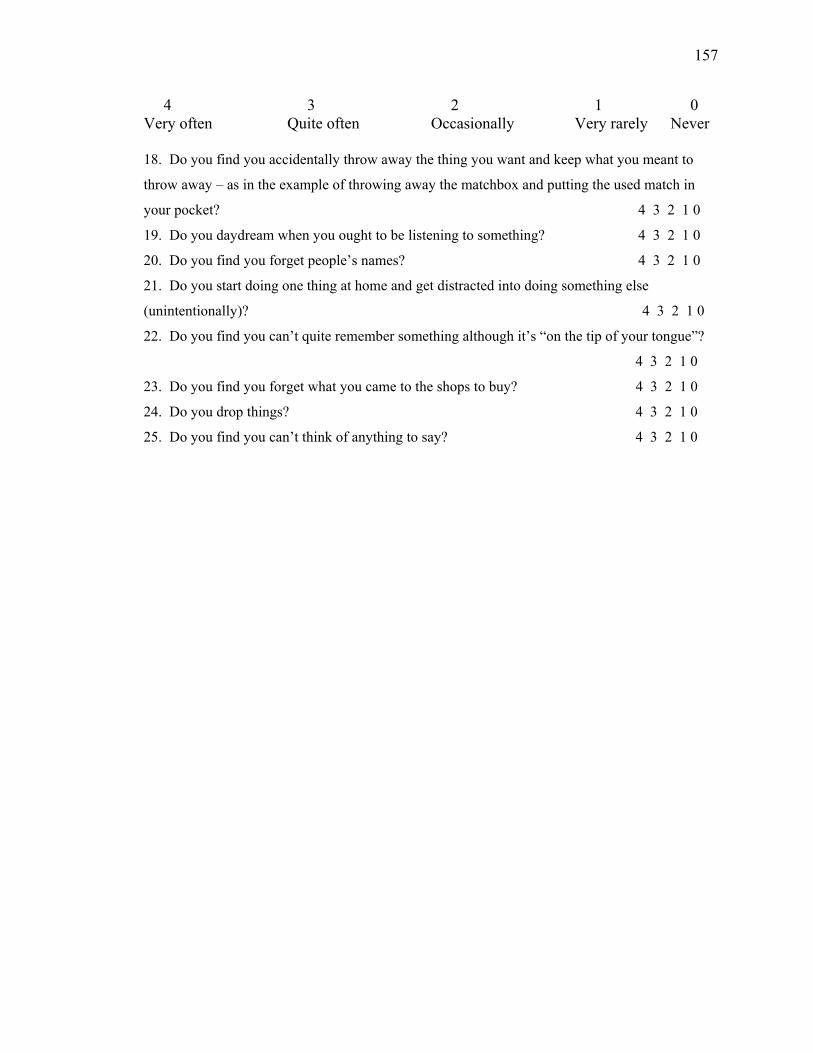
157
4 3 2 1 0 Very often Quite often Occasionally Very rarely Never 18. Do you find you accidentally throw away the thing you want and keep what you meant to
throw away – as in the example of throwing away the matchbox and putting the used match in
your pocket? 4 3 2 1 0
19. Do you daydream when you ought to be listening to something? 4 3 2 1 0
20. Do you find you forget people’s names? 4 3 2 1 0
21. Do you start doing one thing at home and get distracted into doing something else
(unintentionally)? 4 3 2 1 0
22. Do you find you can’t quite remember something although it’s “on the tip of your tongue”?
4 3 2 1 0
23. Do you find you forget what you came to the shops to buy? 4 3 2 1 0
24. Do you drop things? 4 3 2 1 0
25. Do you find you can’t think of anything to say? 4 3 2 1 0
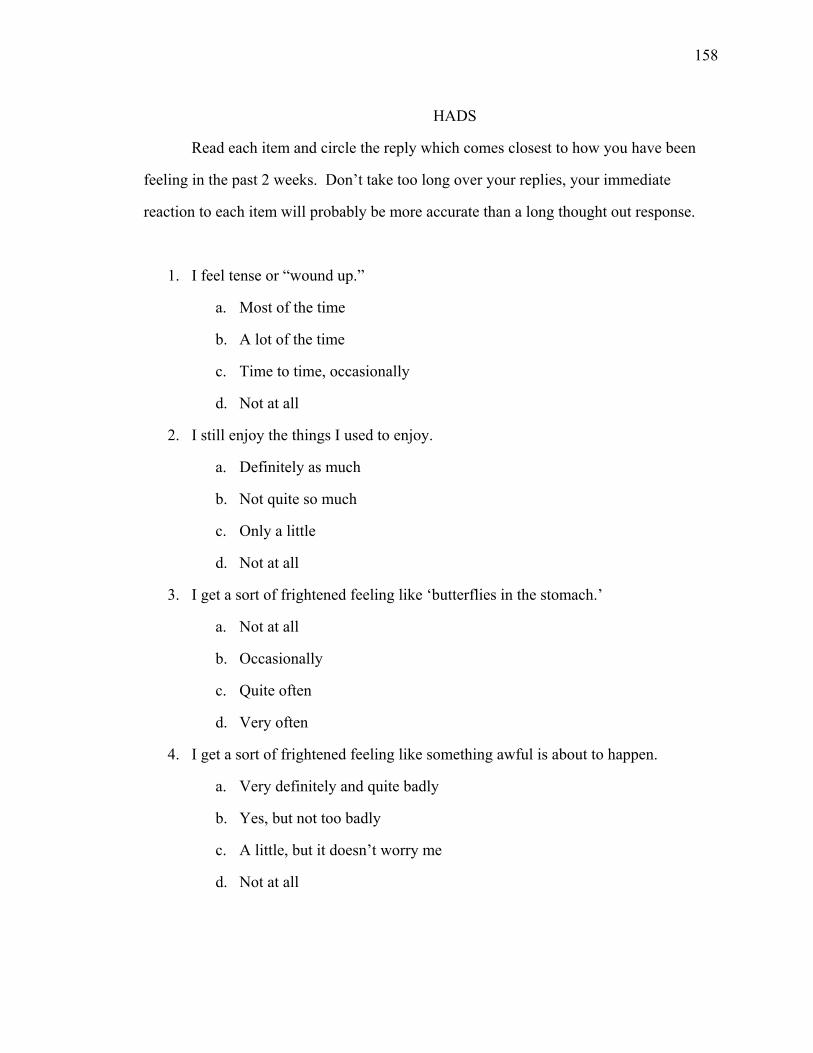
158
HADS
Read each item and circle the reply which comes closest to how you have been
feeling in the past 2 weeks. Don’t take too long over your replies, your immediate
reaction to each item will probably be more accurate than a long thought out response.
1. I feel tense or “wound up.”
a. Most of the time
b. A lot of the time
c. Time to time, occasionally
d. Not at all
2. I still enjoy the things I used to enjoy.
a. Definitely as much
b. Not quite so much
c. Only a little
d. Not at all
3. I get a sort of frightened feeling like ‘butterflies in the stomach.’
a. Not at all
b. Occasionally
c. Quite often
d. Very often
4. I get a sort of frightened feeling like something awful is about to happen.
a. Very definitely and quite badly
b. Yes, but not too badly
c. A little, but it doesn’t worry me
d. Not at all
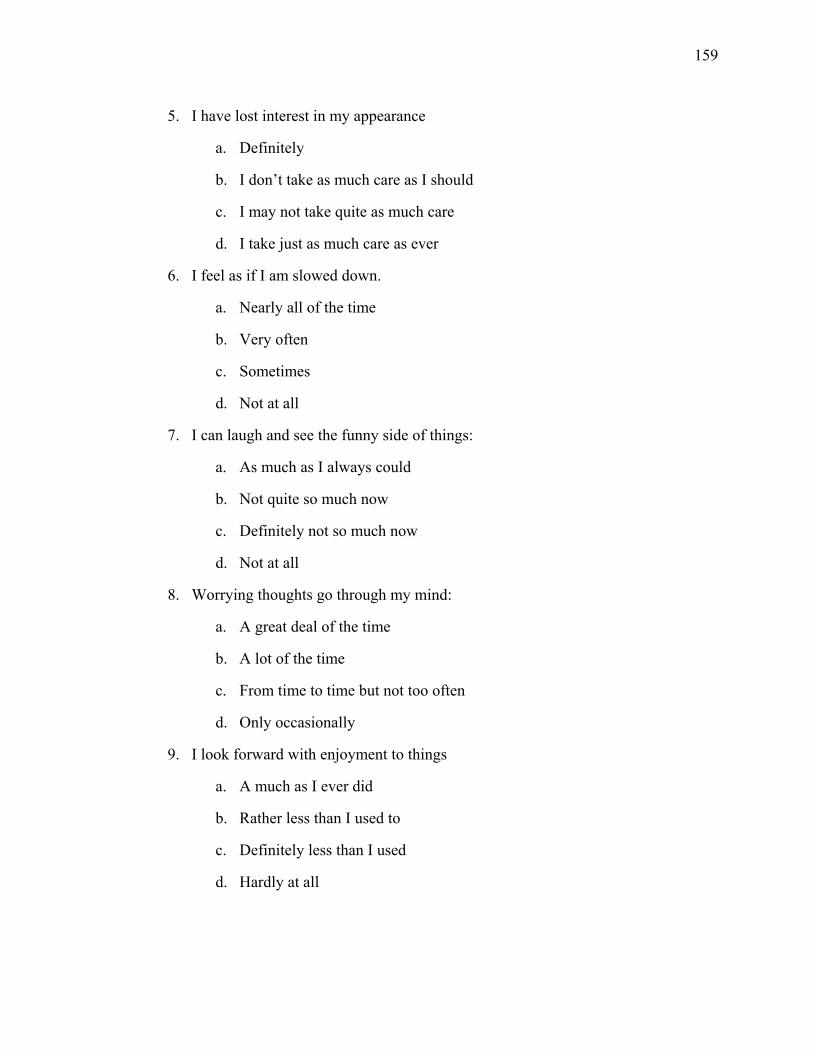
159
5. I have lost interest in my appearance
a. Definitely
b. I don’t take as much care as I should
c. I may not take quite as much care
d. I take just as much care as ever
6. I feel as if I am slowed down.
a. Nearly all of the time
b. Very often
c. Sometimes
d. Not at all
7. I can laugh and see the funny side of things:
a. As much as I always could
b. Not quite so much now
c. Definitely not so much now
d. Not at all
8. Worrying thoughts go through my mind:
a. A great deal of the time
b. A lot of the time
c. From time to time but not too often
d. Only occasionally
9. I look forward with enjoyment to things
a. A much as I ever did
b. Rather less than I used to
c. Definitely less than I used
d. Hardly at all
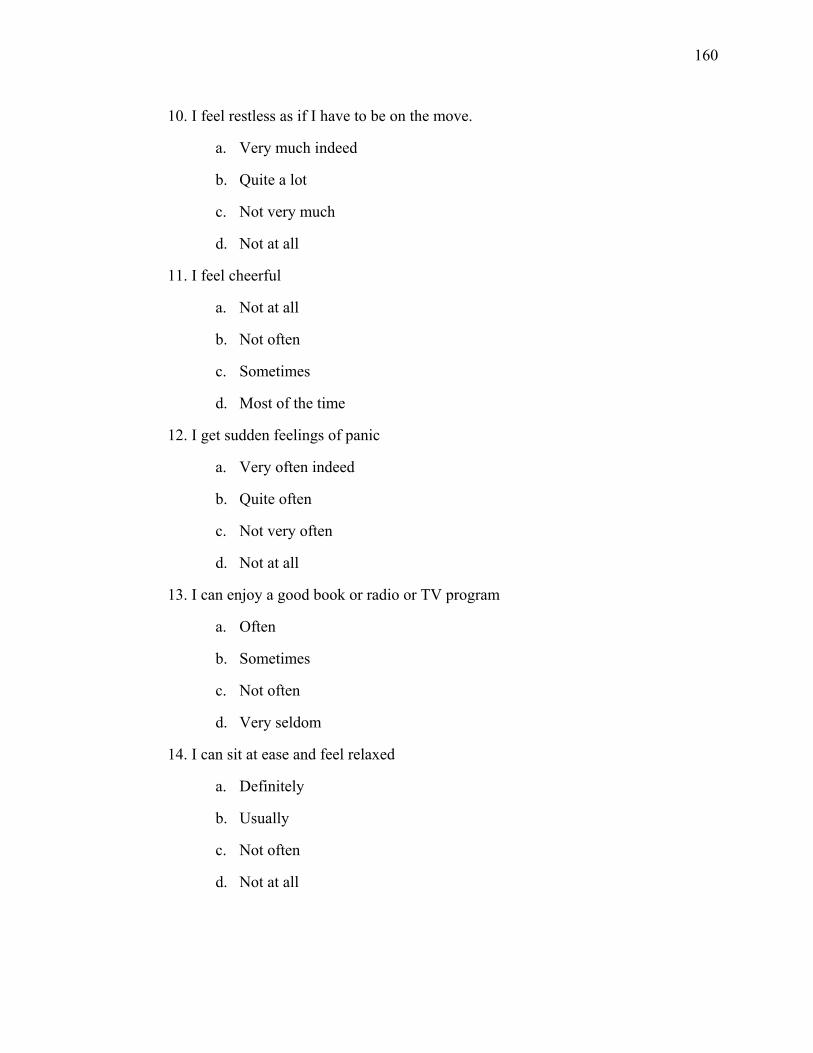
160
10. I feel restless as if I have to be on the move.
a. Very much indeed
b. Quite a lot
c. Not very much
d. Not at all
11. I feel cheerful
a. Not at all
b. Not often
c. Sometimes
d. Most of the time
12. I get sudden feelings of panic
a. Very often indeed
b. Quite often
c. Not very often
d. Not at all
13. I can enjoy a good book or radio or TV program
a. Often
b. Sometimes
c. Not often
d. Very seldom
14. I can sit at ease and feel relaxed
a. Definitely
b. Usually
c. Not often
d. Not at all
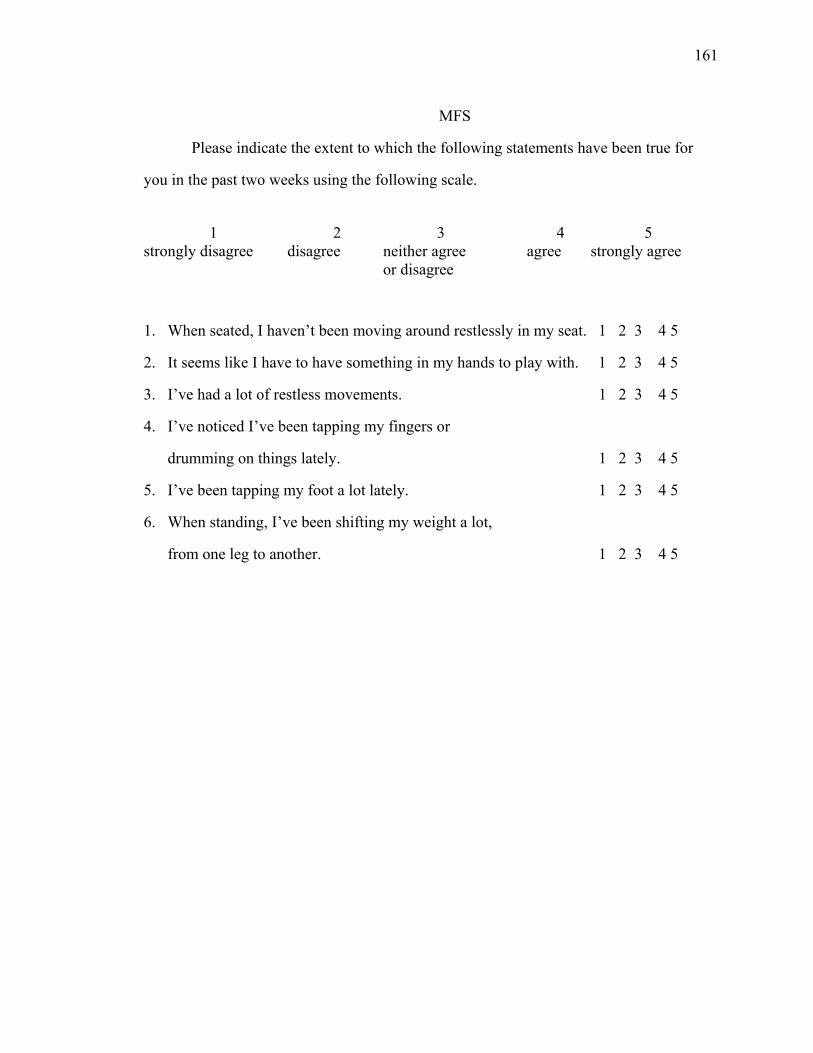
161
MFS
Please indicate the extent to which the following statements have been true for
you in the past two weeks using the following scale.
1 2 3 4 5
strongly disagree disagree neither agree agree strongly agree or disagree
1. When seated, I haven’t been moving around restlessly in my seat. 1 2 3 4 5
2. It seems like I have to have something in my hands to play with. 1 2 3 4 5
3. I’ve had a lot of restless movements. 1 2 3 4 5
4. I’ve noticed I’ve been tapping my fingers or
drumming on things lately. 1 2 3 4 5
5. I’ve been tapping my foot a lot lately. 1 2 3 4 5
6. When standing, I’ve been shifting my weight a lot,
from one leg to another. 1 2 3 4 5
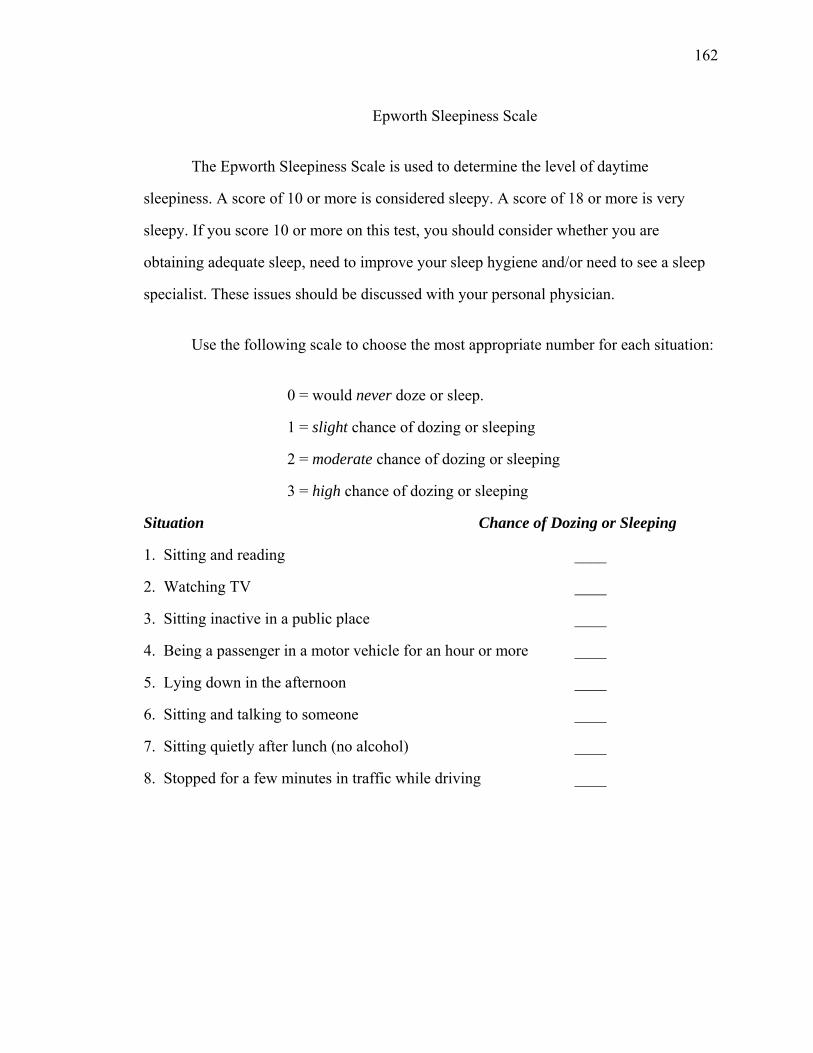
162
Epworth Sleepiness Scale
The Epworth Sleepiness Scale is used to determine the level of daytime
sleepiness. A score of 10 or more is considered sleepy. A score of 18 or more is very
sleepy. If you score 10 or more on this test, you should consider whether you are
obtaining adequate sleep, need to improve your sleep hygiene and/or need to see a sleep
specialist. These issues should be discussed with your personal physician.
Use the following scale to choose the most appropriate number for each situation:
0 = would never doze or sleep.
1 = slight chance of dozing or sleeping
2 = moderate chance of dozing or sleeping
3 = high chance of dozing or sleeping
Situation Chance of Dozing or Sleeping
1. Sitting and reading ____
2. Watching TV ____
3. Sitting inactive in a public place ____
4. Being a passenger in a motor vehicle for an hour or more ____
5. Lying down in the afternoon ____
6. Sitting and talking to someone ____
7. Sitting quietly after lunch (no alcohol) ____
8. Stopped for a few minutes in traffic while driving ____

163
SCPO Please read each statement and indicate the extent to which you have experienced
the following symptoms in the past month. Please use the following scale when responding:
1. Never
2. On one or a few days.
3. On several days.
4. On most days.
5. Every day 1. In the past month, on how many days have you felt abnormally thirsty?
1 2 3 4 5
2. In the past month, on how many days have you had blurred vision?
1 2 3 4 5
3. In the past month, on how many days have you passed a lot of water during the day?
1 2 3 4 5
4. In the past month, on how many days have you felt unusually hungry?
1 2 3 4 5
5. In the past month, on how many days have you felt shaky?
1 2 3 4 5
6. In the past month, on how many days have you had cold hands and feet?
1 2 3 4 5
7. In the past month, on how many days have you felt very sleepy during the day?
1 2 3 4 5
8. In the past month, on how many days have you had a feeling of pins and needles?
1 2 3 4 5
9. In the past month, on how many days have you felt faint, fainted or passed out?
1 2 3 4 5
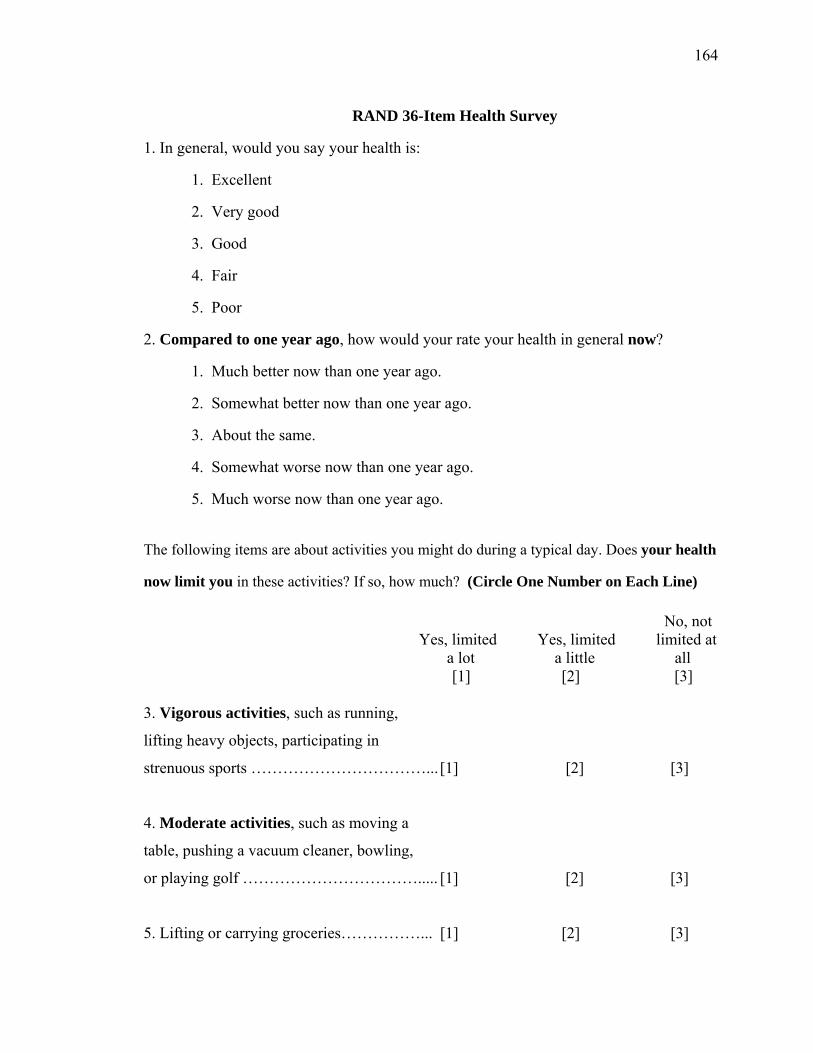
164
RAND 36-Item Health Survey
1. In general, would you say your health is:
1. Excellent
2. Very good
3. Good
4. Fair
5. Poor
2. Compared to one year ago, how would your rate your health in general now?
1. Much better now than one year ago.
2. Somewhat better now than one year ago.
3. About the same.
4. Somewhat worse now than one year ago.
5. Much worse now than one year ago.
The following items are about activities you might do during a typical day. Does your health
now limit you in these activities? If so, how much? (Circle One Number on Each Line)
No, not Yes, limited Yes, limited limited at a lot a little all [1] [2] [3] 3. Vigorous activities, such as running,
lifting heavy objects, participating in
strenuous sports ……………………………... [1] [2] [3]
4. Moderate activities, such as moving a
table, pushing a vacuum cleaner, bowling,
or playing golf ……………………………..... [1] [2] [3]
5. Lifting or carrying groceries……………... [1] [2] [3]
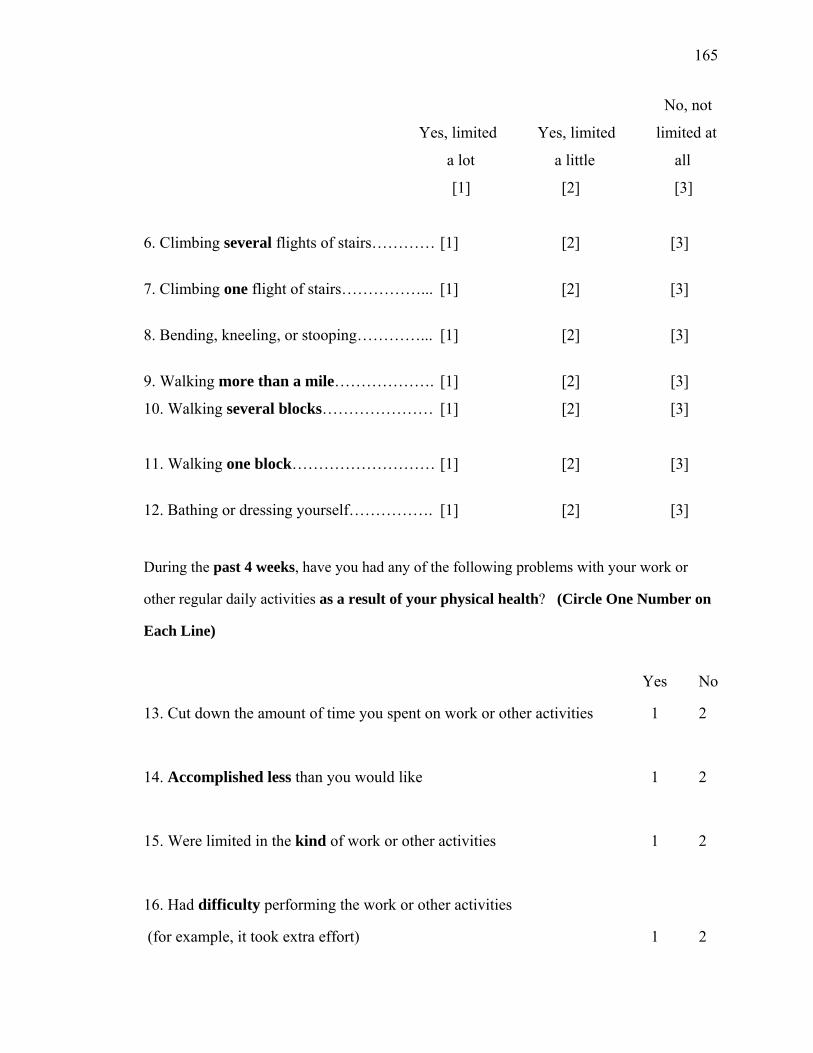
165
No, not
Yes, limited Yes, limited limited at
a lot a little all
[1] [2] [3]
6. Climbing several flights of stairs………… [1] [2] [3]
7. Climbing one flight of stairs……………... [1] [2] [3]
8. Bending, kneeling, or stooping…………... [1] [2] [3]
9. Walking more than a mile………………. [1] [2] [3]
10. Walking several blocks………………… [1] [2] [3]
11. Walking one block……………………… [1] [2] [3]
12. Bathing or dressing yourself……………. [1] [2] [3]
During the past 4 weeks, have you had any of the following problems with your work or
other regular daily activities as a result of your physical health? (Circle One Number on
Each Line)
Yes No
13. Cut down the amount of time you spent on work or other activities 1 2
14. Accomplished less than you would like 1 2
15. Were limited in the kind of work or other activities 1 2
16. Had difficulty performing the work or other activities
(for example, it took extra effort) 1 2
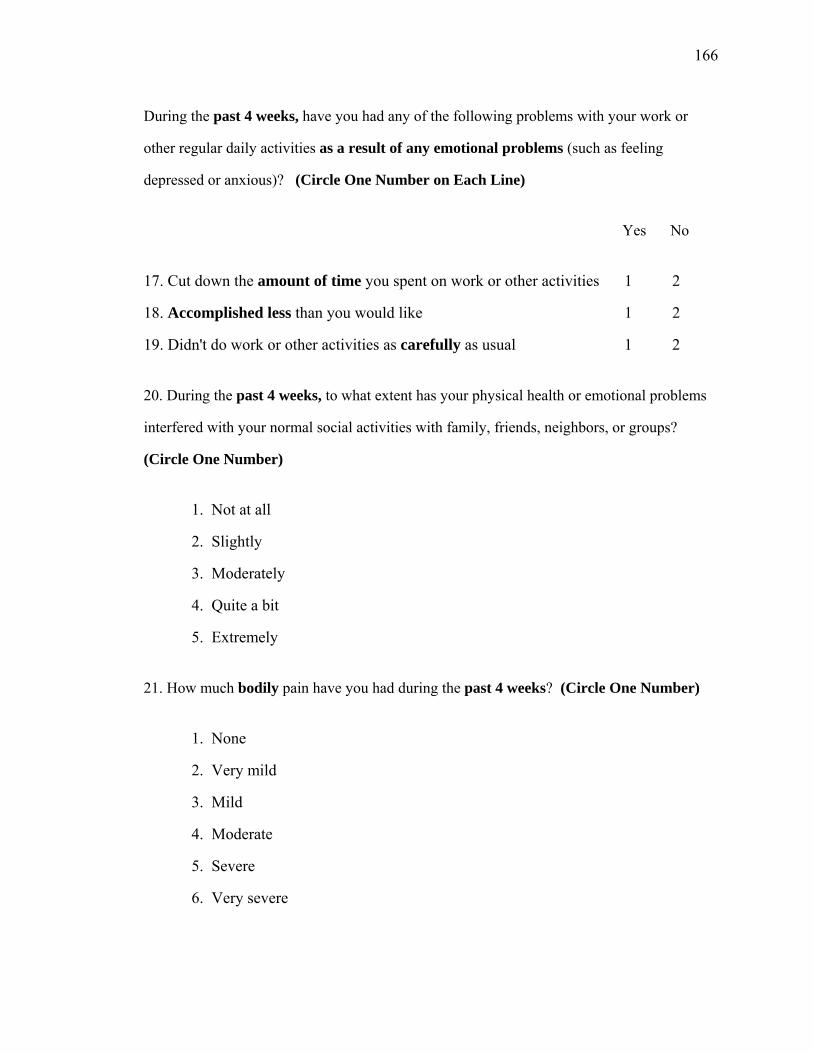
166
During the past 4 weeks, have you had any of the following problems with your work or
other regular daily activities as a result of any emotional problems (such as feeling
depressed or anxious)? (Circle One Number on Each Line)
Yes No
17. Cut down the amount of time you spent on work or other activities 1 2
18. Accomplished less than you would like 1 2
19. Didn't do work or other activities as carefully as usual 1 2
20. During the past 4 weeks, to what extent has your physical health or emotional problems
interfered with your normal social activities with family, friends, neighbors, or groups?
(Circle One Number)
1. Not at all
2. Slightly
3. Moderately
4. Quite a bit
5. Extremely
21. How much bodily pain have you had during the past 4 weeks? (Circle One Number)
1. None
2. Very mild
3. Mild
4. Moderate
5. Severe
6. Very severe
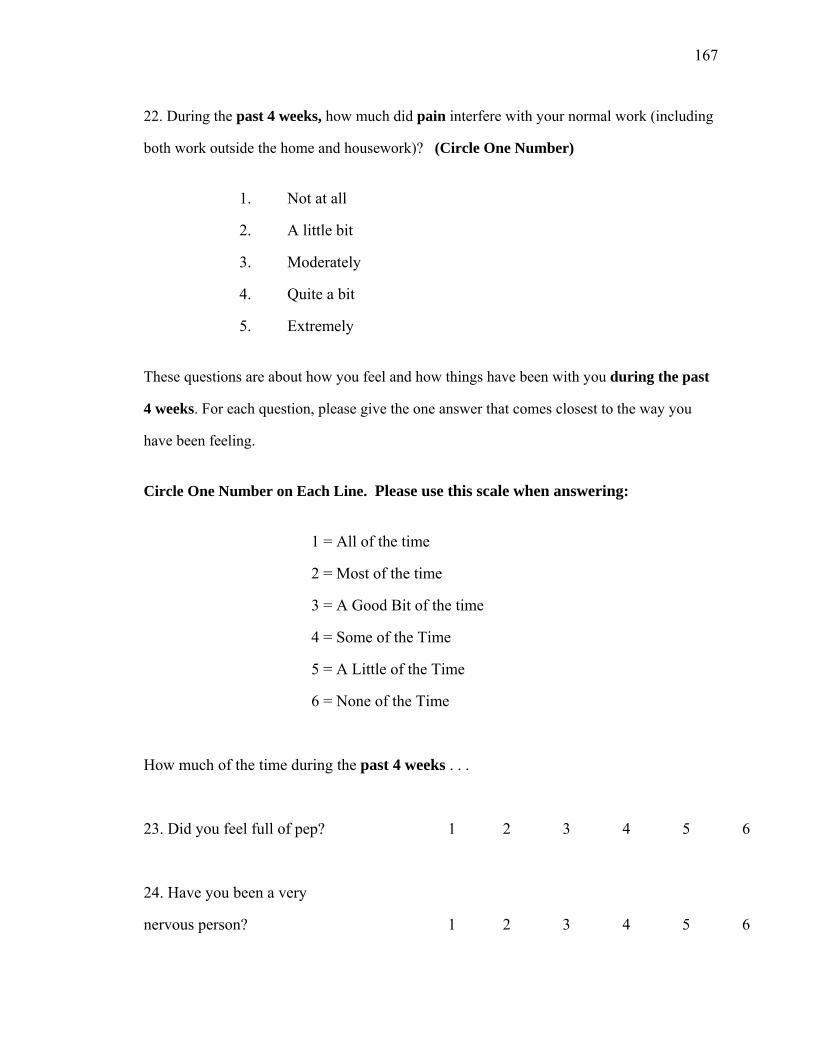
167
22. During the past 4 weeks, how much did pain interfere with your normal work (including
both work outside the home and housework)? (Circle One Number)
1. Not at all
2. A little bit
3. Moderately
4. Quite a bit
5. Extremely
These questions are about how you feel and how things have been with you during the past
4 weeks. For each question, please give the one answer that comes closest to the way you
have been feeling.
Circle One Number on Each Line. Please use this scale when answering:
1 = All of the time
2 = Most of the time
3 = A Good Bit of the time
4 = Some of the Time
5 = A Little of the Time
6 = None of the Time
How much of the time during the past 4 weeks . . .
23. Did you feel full of pep? 1 2 3 4 5 6
24. Have you been a very
nervous person? 1 2 3 4 5 6
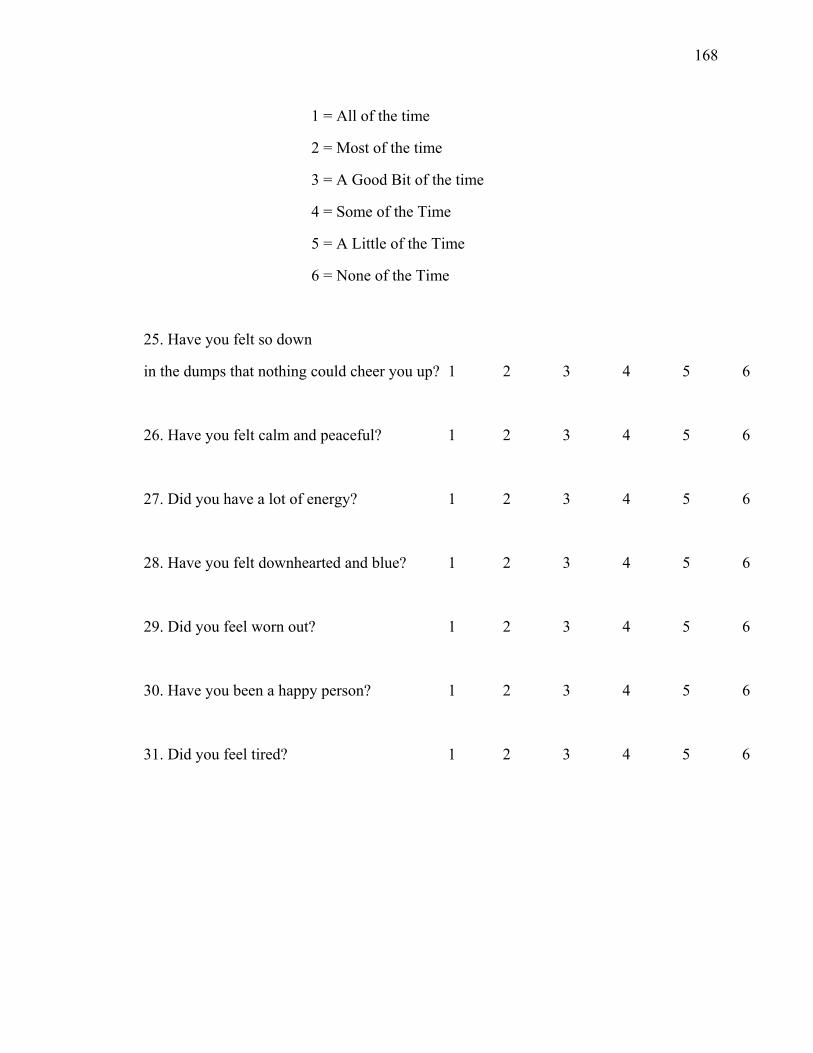
168
1 = All of the time
2 = Most of the time
3 = A Good Bit of the time
4 = Some of the Time
5 = A Little of the Time
6 = None of the Time
25. Have you felt so down
in the dumps that nothing could cheer you up? 1 2 3 4 5 6
26. Have you felt calm and peaceful? 1 2 3 4 5 6
27. Did you have a lot of energy? 1 2 3 4 5 6
28. Have you felt downhearted and blue? 1 2 3 4 5 6
29. Did you feel worn out? 1 2 3 4 5 6
30. Have you been a happy person? 1 2 3 4 5 6
31. Did you feel tired? 1 2 3 4 5 6
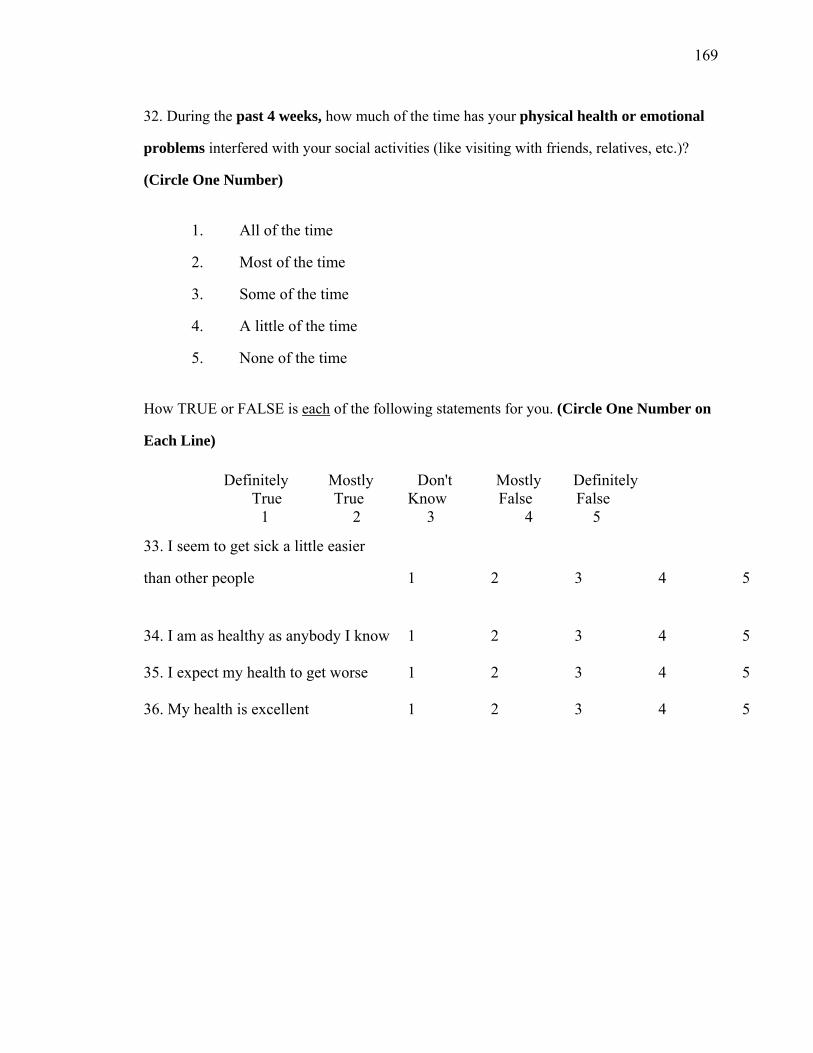
169
32. During the past 4 weeks, how much of the time has your physical health or emotional
problems interfered with your social activities (like visiting with friends, relatives, etc.)?
(Circle One Number)
1. All of the time
2. Most of the time
3. Some of the time
4. A little of the time
5. None of the time
How TRUE or FALSE is each of the following statements for you. (Circle One Number on
Each Line)
Definitely Mostly Don't Mostly Definitely True True Know False False
1 2 3 4 5
33. I seem to get sick a little easier
than other people 1 2 3 4 5
34. I am as healthy as anybody I know 1 2 3 4 5
35. I expect my health to get worse 1 2 3 4 5
36. My health is excellent 1 2 3 4 5
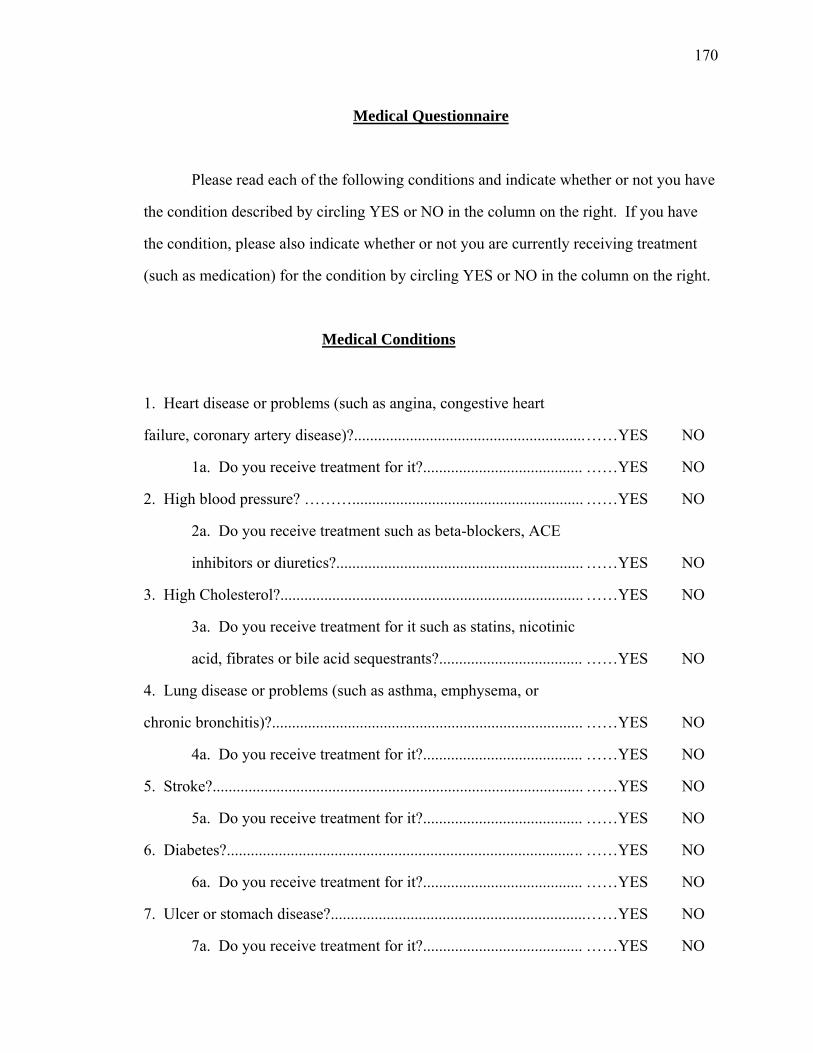
170
Medical Questionnaire
Please read each of the following conditions and indicate whether or not you have
the condition described by circling YES or NO in the column on the right. If you have
the condition, please also indicate whether or not you are currently receiving treatment
(such as medication) for the condition by circling YES or NO in the column on the right.
Medical Conditions
1. Heart disease or problems (such as angina, congestive heart
failure, coronary artery disease)?..........................................................
1a. Do you receive treatment for it?........................................
2. High blood pressure? ………..........................................................
2a. Do you receive treatment such as beta-blockers, ACE
inhibitors or diuretics?..............................................................
3. High Cholesterol?............................................................................
3a. Do you receive treatment for it such as statins, nicotinic
acid, fibrates or bile acid sequestrants?....................................
4. Lung disease or problems (such as asthma, emphysema, or
chronic bronchitis)?..............................................................................
4a. Do you receive treatment for it?........................................
5. Stroke?.............................................................................................
5a. Do you receive treatment for it?........................................
6. Diabetes?....................................................................................... ..
6a. Do you receive treatment for it?........................................
7. Ulcer or stomach disease?................................................................
7a. Do you receive treatment for it?........................................
……YES NO
……YES NO
……YES NO
……YES NO
……YES NO
……YES NO
……YES NO
……YES NO
……YES NO
……YES NO
……YES NO
……YES NO
……YES NO
……YES NO
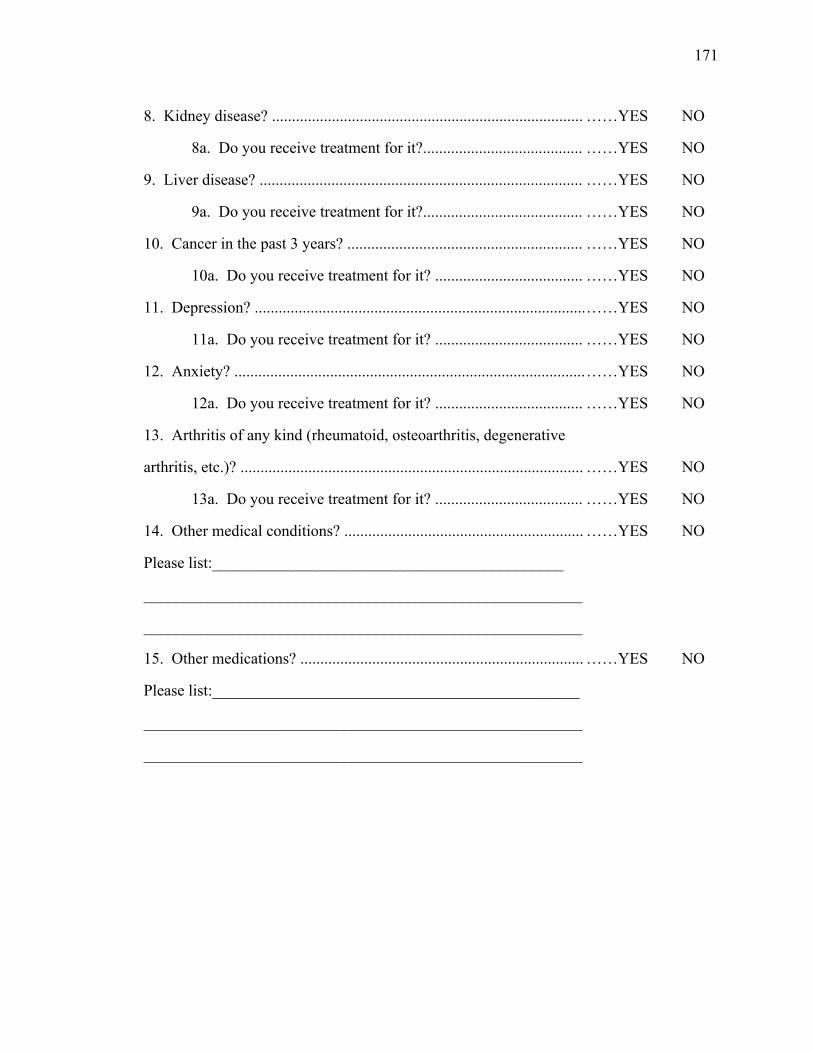
171
8. Kidney disease? ..............................................................................
8a. Do you receive treatment for it?........................................
9. Liver disease? .................................................................................
9a. Do you receive treatment for it?........................................
10. Cancer in the past 3 years? ...........................................................
10a. Do you receive treatment for it? .....................................
11. Depression? ...................................................................................
11a. Do you receive treatment for it? .....................................
12. Anxiety? ........................................................................................
12a. Do you receive treatment for it? .....................................
13. Arthritis of any kind (rheumatoid, osteoarthritis, degenerative
arthritis, etc.)? ......................................................................................
13a. Do you receive treatment for it? .....................................
14. Other medical conditions? ............................................................
Please list:____________________________________________
_______________________________________________________
_______________________________________________________
15. Other medications? .......................................................................
Please list:______________________________________________
_______________________________________________________
_______________________________________________________
……YES NO
……YES NO
……YES NO
……YES NO
……YES NO
……YES NO
……YES NO
……YES NO
……YES NO
……YES NO
……YES NO
……YES NO
……YES NO
……YES NO
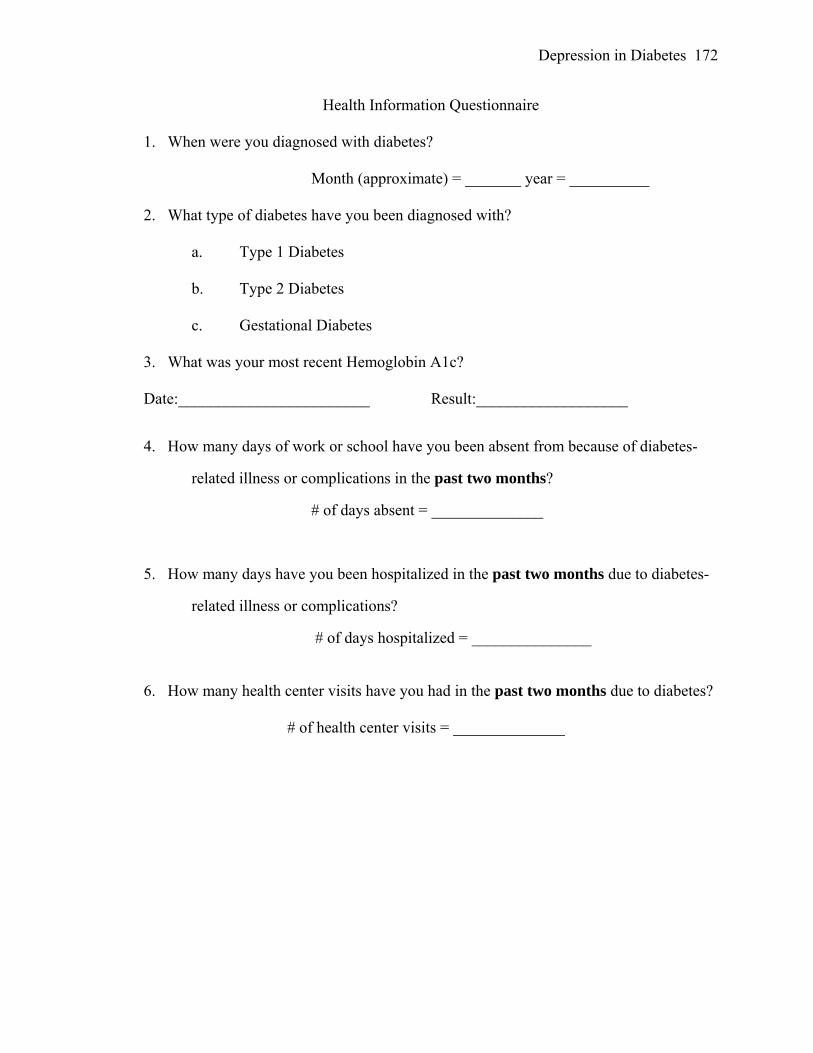
Depression in Diabetes 172
Health Information Questionnaire
1. When were you diagnosed with diabetes?
Month (approximate) = _______ year = __________
2. What type of diabetes have you been diagnosed with?
a. Type 1 Diabetes
b. Type 2 Diabetes
c. Gestational Diabetes
3. What was your most recent Hemoglobin A1c?
Date:________________________ Result:___________________
4. How many days of work or school have you been absent from because of diabetes-
related illness or complications in the past two months?
# of days absent = ______________
5. How many days have you been hospitalized in the past two months due to diabetes-
related illness or complications?
# of days hospitalized = _______________
6. How many health center visits have you had in the past two months due to diabetes?
# of health center visits = ______________
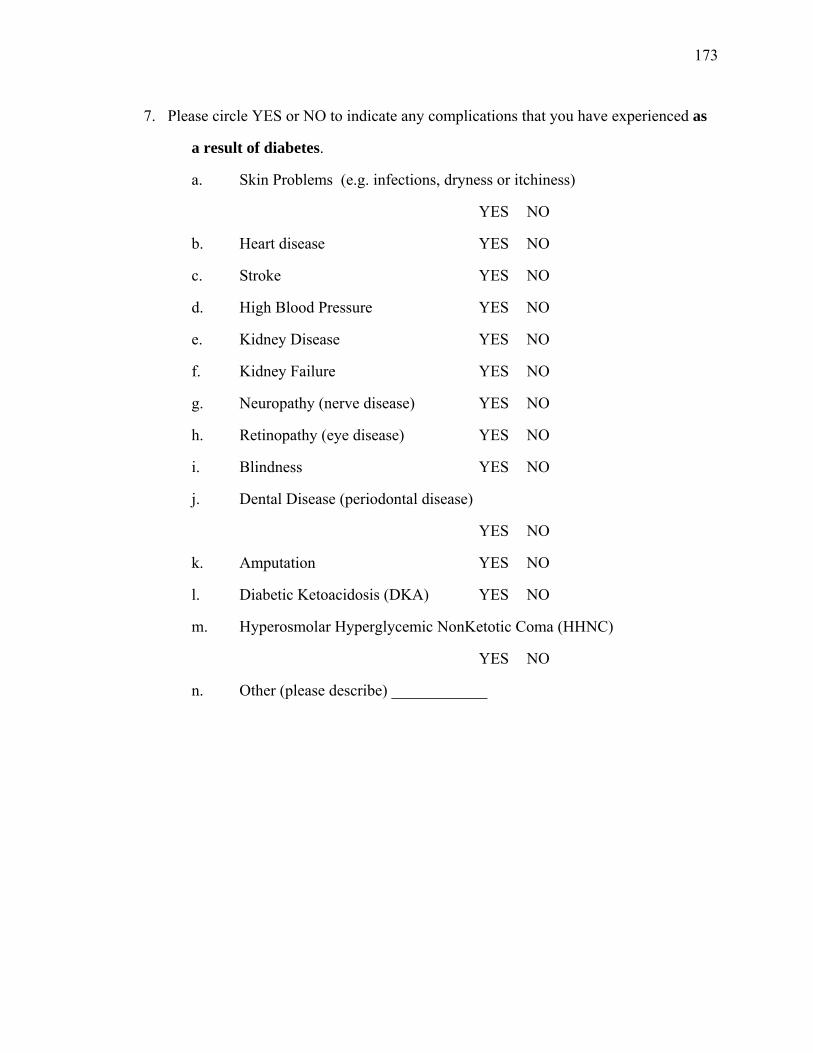
173
7. Please circle YES or NO to indicate any complications that you have experienced as
a result of diabetes.
a. Skin Problems (e.g. infections, dryness or itchiness)
YES NO
b. Heart disease YES NO
c. Stroke YES NO
d. High Blood Pressure YES NO
e. Kidney Disease YES NO
f. Kidney Failure YES NO
g. Neuropathy (nerve disease) YES NO
h. Retinopathy (eye disease) YES NO
i. Blindness YES NO
j. Dental Disease (periodontal disease)
YES NO
k. Amputation YES NO
l. Diabetic Ketoacidosis (DKA) YES NO
m. Hyperosmolar Hyperglycemic NonKetotic Coma (HHNC)
YES NO
n. Other (please describe) ____________
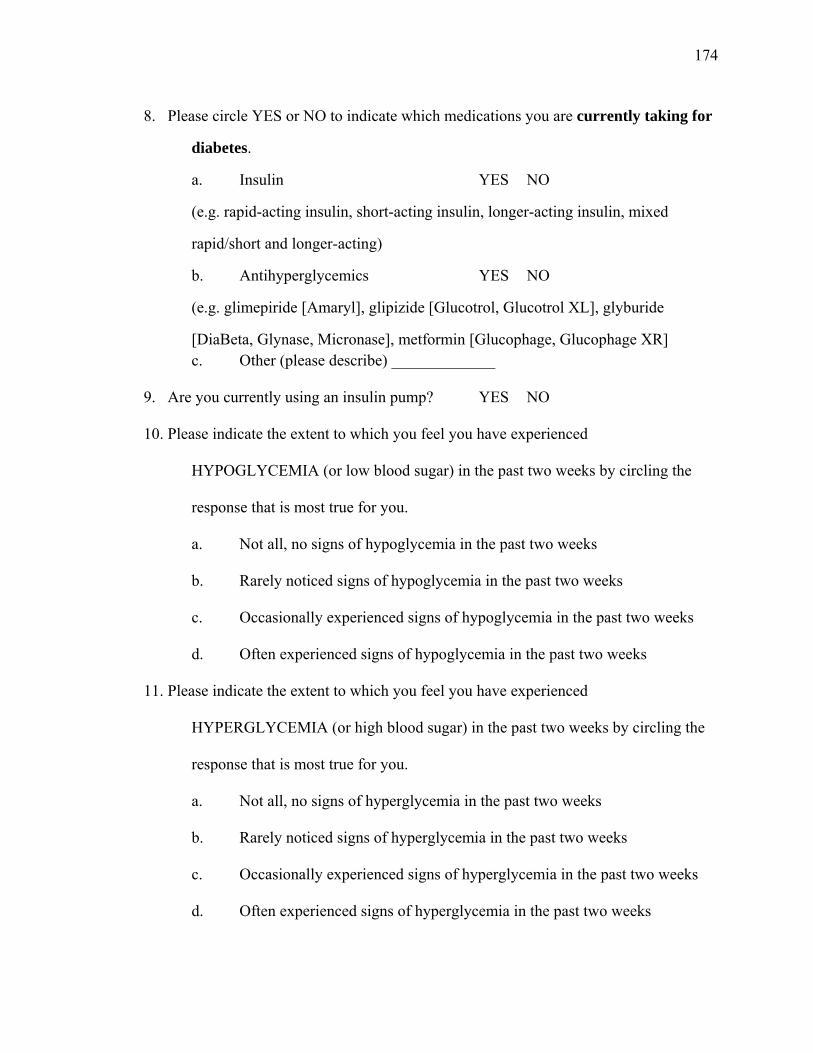
174
8. Please circle YES or NO to indicate which medications you are currently taking for
diabetes.
a. Insulin YES NO
(e.g. rapid-acting insulin, short-acting insulin, longer-acting insulin, mixed
rapid/short and longer-acting)
b. Antihyperglycemics YES NO
(e.g. glimepiride [Amaryl], glipizide [Glucotrol, Glucotrol XL], glyburide
[DiaBeta, Glynase, Micronase], metformin [Glucophage, Glucophage XR] c. Other (please describe) _____________
9. Are you currently using an insulin pump? YES NO
10. Please indicate the extent to which you feel you have experienced
HYPOGLYCEMIA (or low blood sugar) in the past two weeks by circling the
response that is most true for you.
a. Not all, no signs of hypoglycemia in the past two weeks
b. Rarely noticed signs of hypoglycemia in the past two weeks
c. Occasionally experienced signs of hypoglycemia in the past two weeks
d. Often experienced signs of hypoglycemia in the past two weeks
11. Please indicate the extent to which you feel you have experienced
HYPERGLYCEMIA (or high blood sugar) in the past two weeks by circling the
response that is most true for you.
a. Not all, no signs of hyperglycemia in the past two weeks
b. Rarely noticed signs of hyperglycemia in the past two weeks
c. Occasionally experienced signs of hyperglycemia in the past two weeks
d. Often experienced signs of hyperglycemia in the past two weeks
175
REFERENCES
American Diabetes Association. (2007). Standards of medical care in diabetes – 2007. Diabetes Care, 30, S4-S41.
American Psychiatric Association. (1987). Diagnostic and statistical manual of mental
disorders (3rd ed., rev.) Washington, DC: Author. American Psychiatric Association. (1994). Diagnostic and statistical manual of mental
disorders (4th ed.) Washington, DC: Author. Anderson, R. J., Grigsby, A. B., Freedland, K. E., Lustman, P. J., De Groot, M., McGill,
J. B. et al. (2002). Anxiety and poor glycemic control: A meta-analytic review of the literature. International Journal of Psychiatry in Medicine, 32, 235-247.
Anderson, R. J., Freedland, K. E., Clouse, R. E., & Lustman, P. J. (2001). The
prevalence of comorbid depression in adults with diabetes: A meta-analysis. Diabetes Care, 24, 1069-1078.
Barlow, D. H. (1991). Disorders of emotion. Psychological Inquiry, 2, 58-71. Beck, A. T., & Steer, R. A. (1990). Beck Anxiety Inventory manual. San Antonio, TX:
Psychological Corporation. Beck, A. T., & Steer, R. A. (1993). Manual for the Revised Beck Depression Inventory.
San Antonio, TX: Psychological Corporation Beck, A. T., Steer, R. A., & Brown, G. K. (1996). Beck Depression Inventory manual
(2nd ed.). San Antonio, TX: Psychological Corporation. Bjelland, I., Dahl, A. A., Haug, T. T., & Neckelmann, D. (2002). The validity of the
Hospital Anxiety and Depression Scale: An updated literature. Journal of Psychosomatic Research, 52, 69-77.
Broadbent, D. E., Cooper, P. F., FitzGerald, P., & Parkes, K. R. (1982). The Cognitive
Failures Questionnaire (CFQ) and its correlates. British Journal of Clinical Psychology, 21, 1-16.
Brown, T. A., Chorpita, B. F., & Barlow, D. H. (1998). Structured relationships among
dimensions of the DSM-IV anxiety and mood disorders and dimensions of negative affect, positive affect, and autonomic arousal. Journal of Abnormal Psychology, 107, 179-192.
Cavanaugh, S. (1995). Depression in the medically ill: Critical issues in diagnostic
assessment. Psychosomatics, 36, 48-59.
176
Centers for Disease Control and Prevention. (2005) National diabetes fact sheet: General information and national estimates on diabetes in the United States. (Retrieved April 19, 2006, from http://www.cdc.gov/diabetes/pubs/factsheet.htm#contents
Ciechanowski, P. S., Katon, W. J., Russo, J. E., & Hirsch, I. B. (2003). The relationship
of depressive symptoms to symptom reporting, self-care and glucose control in diabetes. General Hospital Psychiatry, 25, 246-252.
Clark, D. A., Cook, A., & Snow, D. (1998). Depressive symptom differences in
hospitalized, medically ill, depressed psychiatric inpatients and nonmedical controls. Journal of Abnormal Psychology, 107, 38-48.
Clark, L. A. (1989). The anxiety and depressive disorders: Descriptive psychopathology
and differential diagnosis. In P. Kendall & D. Watson (Ed.), Anxiety and depression: Distinctive and overlapping features (pp. 83-129). San Diego, CA: Academic Press.
Clark, L. A., & Watson, D. (1991). Tripartite model of anxiety and depression:
Psychometric evidence and taxonomic implications. Journal of Abnormal Psychology, 100, 316-336.
Clark, V. A., Aneshensel, C. S., Frerichs, R. R. (1981). Analysis of sex and age in
response to items of the CES-D scale. Psychiatry Research, 5, 171-181. Cohen, J. (1992). A power primer. Psychological Bulletin, 112, 155-159. De Groot, M., Anderson, R., Freedland, K. E., Clouse, R. E., & Lustman, P. J. (2001).
Association of depression and diabetes complications: A meta-analysis. Psychosomatic Medicine, 63, 619-630.
Derogatis, L. R., Lipman, R. S., & Covi, L. (1973). SCL-90: An outpatient psychiatric
rating scale-preliminary report. Psychopharmacology Bulletin, 9, 13-17. Diabetes Control and Complications Trial Research Group (1993). The effect of
intensive treatment of diabetes on the development and progression of long-term complications in insulin-dependent diabetes mellitus. New England Journal of Medicine, 329, 977-986.
Eaton, W. W. (2002). Epidemiologic evidence on the comorbidity of depression and
diabetes. Journal of Psychosomatic Research, 53, 903-906. Friedman, S., Samuelian, J. C., Lancrenon, S., Even, C. & Chiarelli, P. (2001). Three
dimensional structure of the Hospital Anxiety and Depression Scale in a large French primary care population suffering from major depression. Psychiatry Research, 104, 247-257.
177
Friedman, S., Vila, G., Timsit, J., Boitard, C., & Mouren-Simeoni, M. C. (1998). Anxiety and depressive disorders in an adult insulin-dependent diabetic mellitus (IDDM) population: Relationships with glycaemic control and somatic complications. European Psychiatry, 13, 259-302.
Germeijs, V., & De Boeck, P. (2002). A measurement scale for indecisiveness and its
relationship to career indecision and other types of indecision. European Journal of Psychological Assessment, 18, 113-122.
Gonder-Frederick, L. A., Cox, D. J., & Ritterband, L. M. (2002). Diabetes and
behavioral medicine: The second decade. Journal of Consulting and Clinical Psychology, 70, 611-625.
Gullege, J. & Beard, S. (Eds.). (1999). Diabetes management: Clinical pathways,
guidelines and patient education. Gaithersburg, MD: Aspen. Grigsby, A. B., Anderson, R. J., Freedland, K. E., Clouse, R. E., Lustman, P. J. (2002).
Prevalence of anxiety in adults with diabetes: A systematic review. Journal of Psychosomatic Research, 53, 1053-1060.
Hamilton, M. (1959). The assessment of anxiety states by rating. British Medical
Journal, 297, 897-899. Hamilton, M. (1960). A rating scale for depression. Journal of Neurology, Neurosurgery
and Psychiatry, 23, 56-61. Hermanns, N., Kubiak, T., Kulzer, B., & Haak, T. (2003). Emotional changes during
experimentally induced hypoglycaemia in type 1 diabetes. Biological Psychology, 63, 15-44.
Hill, A. J., & Blundell, J. E. (1986). Macronutrients and satiety: Effects of a high-
protein or high-carbohydrate meal on subjective motivation to eat and food preferences. Nutrition and Behavior, 3, 133-144.
Johns, M. W. (1991). Reliability and factor analysis of the Epworth Sleepiness Scale.
Sleep, 15, 376-381. Kessler, R. C., Nelson, C. B., McGonagle, K. A., Liu, J., Swartz, M., & Blazer, D. G. (1996).
Comorbidity of DSM-III-R major depressive disorder in the general population: Results from the US National Comorbidity Survey. British Journal of Psychiatry, 168 (Suppl. 30), 17-30.
Kessler, R. C., Chiu, W. T., Demler, O., & Walters, E. E. (2005). Prevalence, severity,
and comorbidity of 12-month DSM-IV disorders in the National Comorbidity Survey Replication. Archives of General Psychiatry, 62, 617-627.
178
Lane, A. M., & Lane, H. J. (2002). Predictive effectiveness of mood measures. Perceptual and Motor Skills, 94, 785-791.
Leboyer, M., Mayer, W., Teherani, M., Lichtermann, D., Damato, T., Franke, P. et al.
(1991). The reliability study of SADS-LA in a family study setting. European Archives of Psychiatry and Clinical Neuroscience, 241, 165-9.
Ludman, E. J., Katon, W., Russo, J., Von Korff, M., Simon, G., Ciechanowski, P. et al.
(2004). Depression and diabetes symptom burden. General Hospital Psychiatry, 26, 430-436.
Lustman, P. J. (1988). Anxiety disorders in adults with diabetes mellitus. Psychiatric
Clinics of North America, 11, 419-432. Lustman, P. J., Clouse, R. E., & Carney, R. M. (1988). Depression and the reporting of
diabetes symptoms. International Journal of Psychiatry in Medicine, 18, 295-303.
Lustman, P. J., Freedland, K. E., Carney, R. M., Hong, B. A., & Clouse, R. E. (1992).
Similarity of depression in diabetic and psychiatric patients. Psychosomatic Medicine, 54, 602-611.
Lustman, P. J., Griffith, L. S., & Crouse, R. E. (1997). Depression in adults with
diabetes. Seminars in Clinical Neuropsychiatry, 2, 15-23. Matthews, G., Jones, D. M., & Chamberlain, A. G. (1990). Refining the measurement of
mood: The UWIST Mood Adjective Checklist. British Journal of Psychology, 81, 17-42.
McNair, D. M., Lorr, M., & Droppleman, L. F. (1971). Manual: Profile of Mood States.
San Diego, CA: Educational and Industrial Testing Service. Mehrabian, A., & Friedman, S. L. (1986). An analysis of fidgeting and associated
individual differences. Journal of Personality, 54, 406-429. Mineka, S., Watson, D., & Clark, L. A. (1998). Comorbidity of anxiety and unipolar
mood disorders. Annual Review of Psychology, 49, 377-412. O’Connor, B. P. (2002). The search for dimensional structure differences between
normality and abnormality: A statistical review of published data on personality and psychopathology. Journal of Personality and Social Psychology, 83, 962-982.
Payne, R. (2001). Measuring emotions at work. In R. L. Payne & C. L. Cooper (Eds.),
Emotions at work: Theory, research and applications in management (pp. 107-129). West Sussex, England: John Wiley & Sons, Ltd.

179
Permutt, M. A., Wasson, J., & Cox, N. (2005). Genetic epidemiology of diabetes. The Journal of Clinical Investigation, 115, 1431-1439.
Peterson, R. A., & Reiss, S. (1992). Anxiery Sensitivity Index manual (2nd ed. rev.).
Worthington, OH: International Diagnostic Systems. Pichot, P., Lacassin, J., & Dreyfuss, J. F. (1978). Essai de predication de la nomifensine
à partir du profil symptomatologique préthérapeutique. La Nouvelle Presse Médicale, 7, 2313-2316.
Radloff, L. S. (1977). The CES-D: A self-report depression scale for research in the
general population. Applied Psychological Measurement, 1, 385-401. Reiger, D. A., Myers, J. K., Kramer, M., Robins, L. N., Blazer, D. G. Hough, R. L. et al.
(1984). The NIMH epidemiologic catchment area program: Historical context, major objectives, and study population characteristics. Archives of General Psychiatry, 41, 934-941.
Robins, L. N., Helzer, J. E., & Croughan, J. (1981) The NIMH Diagnostic Interview
Schedule, version 3 (Publication No. Hss-ADM-T-42-3). Washington, DC, U.S. Public Health Service.
Simms, L. J., Watson, D., & Doebbeling, B. N. (2002). Confirmatory factor analyses of
posttraumatic stress symptoms in deployed and non-deployed veterans of the Gulf War. Journal of Abnormal Psychology, 111, 637-647.
Spielberger, C. D., Gorsuch, R. L., & Lorshene, R. (1970). Test Manual for the State-
Trait Anxiety Inventory. Palo Alto, CA: Consulting Psychologists Press. Spitzer, R., Kroenke, K., & Williams, J. (2001). Validation and utility of a self-report
version of PRIME-MD: The PHQ primary care study. Primary care evaluation of mental disorders: Patient Health Questionnaire. Journal of the American Medical Association, 282, 1737-1744.
Stewart, S. H., Taylor, S., & Baker, J. M. (1997). Gender differences in dimensions of
anxiety sensitivity. Journal of Anxiety Disorders, 11, 179-200. Taylor, J. A. (1953). A personality scale of manifest anxiety. Journal of Abnormal
Psychology, 48, 285-290. Thomas, J., Jones, G., Scarinci, I., & Brantley, P. (2003). A descriptive and comparative
study of the prevalence of depressive and anxiety disorders in low income adults with type 2 diabetes and other chronic illnesses. Diabetes Care, 26, 2311-2317.

180
Troyer, A. K., & Rich, J. B. (2002). Psychometric properties of a new metamemory questionnaire for older adults. Journal of Gerontology: Psychological Sciences, 57B, P19-P27.
Watson, D. (2005). Rethinking the mood and anxiety disorders: A quantitative,
hierarchical model for DSM-V. Journal of Abnormal Psychology, 114, 522-536. Watson, D., & Clark, L. A. (1991). The Mood and Anxiety Symptom Questionnaire.
Unpublished manuscript, University of Iowa, Iowa City, IA. Watson, D., & Clark, L. A. (1999). The PANAS-X: Manual for the Positive and Negative
Affect Schedule-Expanded Form. Retrieved from University of Iowa, Department of Psychology Web site: http://www.psychology.uiowa.edu/Faculty/Watson/Watson.html.
Watson, D., Clark, L. A., & Carey, G. (1988). Positive and negative affectivity and their
relation to anxiety and depressive disorders. Journal of Abnormal Psychology, 97, 346-353.
Watson, D., Clark, L. A., & Tellegen, A. (1988). Development and validation of brief
measures of positive and negative affect: The PANAS scales. Journal of Personality and Social Psychology, 54, 1063-1070.
Watson, D., Clark, L. A., Weber, K., Assenheimer, J. S., Strauss, M. E., & McCormick,
R. (1995). Testing a tripartite model: II. Exploring the symptom structure of anxiety and depression in student, adult, and patient samples. Journal of Abnormal Psychology, 104, 15-25
Watson, D., Gamez, W., & Simms, L. J. (in press). Basic dimensions of temperament
and their relation to anxiety and depression: A symptom-based perspective. Journal of Research in Personality.
Watson, D., O’Hara, M. W., Simms, L. J., Kotov, R., Chmielewski, M., McDade-
Montez, E. A., et al. (2007). Development and validation of the Inventory of Depression and Anxiety Symptoms (IDAS). Psychological Assessment, 19, 253-268.
Watson, D., Suls, J., & Haig, J. (2002). Global self-esteem in relation to structural
models of personality and affectivity. Journal of Personality and Social Psychology, 83, 185-197.
Watson, D., & Tellegen, A. (1985). Toward a consensual structure of mood.
Psychological Bulletin, 98, 219-235. Whitty, P., Steen, N., & Eccles, M. (1997). A new completion outcome measure for
diabetes: Is it responsive to change? Quality of Life Research, 6, 407-413.
181
Zigmond, A. S., & Snaith, R. P. (1983). The Hospital Anxiety and Depression Scale. Acta Psychiatrica Scandinavica, 67, 361-370.
Zinbarg, R., E., & Barlow, D. H. (1996). Structure of anxiety and the anxiety disorders:
A hierarchical model. Journal of Abnormal Psychology, 105, 181-193. Zuckerman, M., & Lubin, B. (1985). Manual for the MAACL-R: The Multiple Affect
Adjective Check List Revised. San Diego, CA: Educational and Industrial Testing Service.
Zung, W. K. (1971). A rating instrument for anxiety disorders. Psychosomatics, 12,
371-379.