the structure and dynamics of the multilayer air transport system - atm seminar€¦ · ·...
TRANSCRIPT

1
The Structure and Dynamics of the MultilayerAir Transport System
Yanjun Wang∗†, Xinhua Xu∗†, Minghua Hu∗†, and Jianming Zhan∗‡∗College of Civil Aviation, Nanjing University of Aeronautics and Astronautics, Nanjing, China
†National Key Laboratory of Air Traffic Flow Management, Nanjing, China‡Air Traffic Management Bureau, Civil Aviation Administration of China, Beijing, China
Email: {ywang, xuxinhua, minghuahu}@nuaa.edu.cn, [email protected]
Abstract—The field of air traffic management (ATM) hasa strong interdisciplinary nature, combining of technological,management, economic and regulatory aspects. The fully under-standing of the structure and dynamics underlying the systemcontinues to be significant challenges in the field. Here we presenta novel framework for the study of the structure and dynamicsof the air transport system building upon recent advancementof network science and big data science, as well as taking intoaccount of the unique operation practicals, thus bridging thegaps between academic field and operational world. We showthat the structure of air transport system can be captured byfour interdependent networks including airlines network, airportnetwork, air route network, and ATM network. In particular, wepresent initial results on spatial-related dynamics of the systemusing one-year flight data records. We find by analyzing flightdelay data that (i) airports with similar geographical locationsexhibit similar dynamics; (ii) unlike other spatial-embeddedcomplex systems, the propagation of flight delays or failure in thesystem decays slowly, and the correlations of the failure nodesreaching to 0 when the distance between them approaching to∼ 1, 000km. Our findings may have the implications for theefficient management of air transport system.
Index Terms—Air traffic management, multilayer network, bigdata, spatial correlation, cascading failure
I. INTRODUCTION
The last decade has witnessed the improvement of airtraffic management (ATM) system in its safety, capacity,and efficiency. Great efforts have been made to enhance theperformance of ATM system, ranging from the introduction ofnew operational concepts, through the deployment of advancedautomation systems, to long-term research activities. Due to itsinterdisciplinary nature, the predictability and controllability ofsuch complex social-technical system remain great challenge.Up until now, not much is known about the complete pictureof the structure and the dynamics of the system. This is thefocus of the present article.
Like many other complex systems, air transport system iscomposed of a huge number of interlinked subsystems whichoperate with their own mechanisms. Network sciences hasbeen significantly advanced our understanding and manage-ment of real complex systems since the beginning of lastcentury, ranging from physics, chemistry, through economy,to human social science [1]. It provides a theoretical frame-work for us to understand the origins and characteristics ofcomplexity of the systems. The availability of large amount
of operating records – data on flight tracks, operational infor-mation, and aircraft performance – has created unprecedentedopportunities for investigating air transport system, allowinganalyzing of the structure and dynamics at any scale fromvarious perspectives.
Given the importance of air transport in the propagationof epidemics such as influenza and severe actuary respiratorysyndrome, there are considerable number of studies focus onthe airport networks structure[2], [3], and their roles in theprediction and predicability of global epidemics[4]. Airportnetworks are typically constructed from flights data. The nodesrepresent airports, and a edge will be added between twonodes if there is a direct flight between the two airports.The network can be directed and weighted when consideringthe directions and the volume of flights or passengers ina given time period. Guimera et al. have suggested that ata long range scale, the connections of airport network arealmost symmetrical, therefore there is no need to considerarc directions[5]. Recent advances towards quantifying delayspropagation in the US air transportation system have shed lighton the systematic investigation of delays from network per-spective [6], [7]. Although the approach of complex networkshas been immensely successful, it still has less impact on theATM field due to the fact that it disregards much importantinformation contained in the operational data. Thus, networkresearchers have turned their attention on the time-varyingand multilayer nature of networks. A recent review on themultilayer network can be found in [8]. As an example ofthe application of multilayer network theory, the air transportnetwork are commonly considered as the aggregated layers ofairlines networks [9], [10]. One of the core components ofair transport system – air traffic management system – is stillmissing.
The dynamics occurring on the top of the structure of thesystem preserves enrich information on how system operates.One of the most studied dynamical process in air transportsystem is flight delay. Flight delay can be modeled as thedynamical interaction of a set of flights flying between con-nected airports. It is unclear, however, how delay propagate inthe air transport network. To date, there have been extensivework looking into the many aspects of flights delay. Manypioneering works on delay propagation use empirical data toexplore the cause for initial and primary delays[11], [12], [13],[14]. The primary delays can trigger a cascade of secondary

2
delays which may spread over the airline networks and airportnetworks. The delay introduced by the upstream delay arecalled reactionary delays. A comprehensive study given byJetzki et al. has analyzed reactionary delays in Europeanairports using the data collected by the Central Office forDelay Analysis [15]. The airline network structure is suggestedto play an important role in absorbing delay. Optimizingflight turnaround process by dynamical scheduling buffer timeproved to be useful for minimizing delay propagation[12].
In other instances, further realism has been introduced bythe use of queueing theory to analytical study airport delaysor enroute delay[16], [17], [18], [19], [20]. Pyrgiotis et al.developed an analytical queuing and network decompositionmodel called Approximate Network Delays (AND) model tostudy the delay propagation in the US air transport network[6]. The delay propagation algorithm is to capture the ”rippleeffect” by tracing individual flight affected by local congestionand updating flight profiles when flights delays occur atupstream airports. Fleurquin et al. proposed the measures toquantify the macro-scale behavior of delay dynamics [21].They examine a variety of graph metrics like degree distri-bution and coefficients. Interconnected airports are identifiedto assess the level of air transport system congestion andthe importance of network connectivity in unfolding of delayspreading mechanism. Ingredients of their model are aircraftrotation, passenger connectivity, and airport congestion. Usingdata-driven approach, an agent-based model was developedwhich is able to reproduce the delay patterns captured in theUS air transport network [21], [22].
Another aspect that remains little addressed is the cascadingfailure in air transport system, although much focus are giveneither to the robustness and vulnerability of the system [23], orto the propagation of flight delays through airlines network.Reports from other fields have demonstrated that small dis-ruptions in the network can trigger unexpected domino-likecascade failure [24]. The very “famous example” is the powergrid system blackout in Northeastern U.S. and Eastern Canadain 2003[25]. To prevent such cascading failure happening, twoquestions have been recently risen. How the failure propagatesthrough the system and how should we build a “safety wall”to stop the propagation?
In this article, we first show that the structure of air transportsystem can be represented by four interdependent networks,namely airline network, airport network, air route network, andair traffic management network (i.e. sector network). We giveour attention on the flight delay at the airport level rather thanindividual flight delay to study the dynamics of air transportsystem. In particular, we define the failure of airports/routepoint (sector was not analyzed yet due to the limitation ofcurrent empirical dataset) according to the aggregated flightsdelay at the node. Interestingly and surprisingly, it found thatthe spatial correlations of failure are quite similar in the airportnetwork and air route network. The correlations approachto zeros when the distances between nodes over 1, 400kmand 900km for the airport network and air route networkrespectively. We discuss both the implications of the currentresults and opening questions left to be answered.
II. THE STRUCTURE OF THE MULTILAYER AIR TRANSPORTSYSTEM
A. Airport Network
The pioneering work on the study of the structure ofair transport system was from statistical physics, focusingon analysis of topological characteristics the system fromcomplex networks theory [26]. The structure of the systemwas abstracted to a directed/undirected, weighted/unweightednetwork which normally referred as airport network, withnodes are the airports and edges are determined by flights.Table I summarizes analytical results of airport networksworldwide.
One of the drawbacks of using flights as link to construct airtransport network is that much information encoded in flightsdata is missing. To overcome this difficulty, the temporalinformation must be taken into consideration. Topologicalchanges of the network were measured with characteristicsthat focus on degree distribution which have been used inprior research on network dynamics. The degree distributionof a graph is defined as a discrete probability distributionthat expresses that probability of finding a node with degreek. He et al. studied Chinese airport network in 2004 andconcluded that the network is small-world without scale-freeproperty since the degree distribution of nodes is exponentialrather than heavy tailed[27]. In a weekly cycle, the Chineseairport network exhibits scale-free properties, and the weeklycumulative degree distribution of nodes follow Pareto law[28]. At a even more small time scale, we could see thetransformation of the network in Fig. 1a and Fig. 1b. There arefew flights flying in early morning between 0600 and 0700,while traffic demands increase sharply after 0700. To examinethe temporal evolution of the networks, we construct airportnetworks using every 2 hours flight data. Across the database,there are 396× 12 networks generated. The cumulative nodesdegree distributions are plotted in Fig. 1c. It is clearly shownthat the networks are quite different before and after 0600.Before 0600, the network node degree distribution obeyspower law decay, while more airports are connected after0600AM with daily air transport starts. These results agreewith previous findings that Chinese airport network is small-world with scale-free properties. Other properties such ascommunity structure are still under investigation.
B. The air route network
Another widely investigated network in air transport fieldis air route network or air navigation route network[29].Normally, flights will fly along route structure thus bring thesystem into life. One may trace a flight back to its originalong the route. In the following section, we will compare thecharacteristics of the air route network and airport network.Normally the optimization of network traffic flow are done atthis layer. However, the propagations of airspace congestionand flights delay in the air route network requires researcheffectors.
The recent shift of focus from investigating a single layernetwork to the multilayer network has also been improvingthe understanding of air transport system as well. Special

3
TABLE ITOPOLOGY CHARACTERISTICS OF DIFFERENT AIR TRANSPORTATION NETWORK
Network investigated # Nodes/#Edges Average path length Clustering coefficient Degree distribution
da Rocha et al. Brazil 142/- 2.34 0.63 power-law distributionGuida et al. Italy 42/310 - 0.1 double power law distribution
Bagler India 79/442 2.26 0.657 power-law distributionLi-Ping Chi US 215/- 2.4 0.618 double power law distributionBarrat et al. North American 935/- 4 - power-law distribution
Guimera Worldwide 3883/27051 4.4 0.62 double power law distribution
70 80 90 100 110 120 130 1400
10
20
30
40
50
60
(a) Time: 0600-0700
70 80 90 100 110 120 130 1400
10
20
30
40
50
60
(b) Time: 0700-0800
Degree10
010
110
2
P(D
egre
e)
10-5
10-4
10-3
10-2
10-1
100
101
0000-02000200-04000400-06000600-08000800-10001000-12001200-14001400-16001600-18001800-20002000-22002200-2400
(c) Degree distribution of the hourly airport networks.
Fig. 1. The structures of airport networks in different time periods. (a)and (b) are the geographical plots of Chinese airport networks, while (c) is thedegree distribution of the hourly airport network. Networks are constructedfrom flights data from operation center of Civil Aviation Administration ofChina between 1st August 2012 to 31 August 2013.
attention is given to decompose the airport network into manylayers according to different air carriers[9], [10], [30]. Dueto lack of knowledge of air traffic control, there is still oneimportant component missing in the previous work, i.e. theair traffic management layer. It is the core structure of airtransport system from operation point of view. All the airtraffic controllers in charge of their own sectors inter-linkedform the backbone of the air transport system, working withstaff from airports and airlines to provide air transport serviceto customers.
C. The 5 interdependent layers of air transport system
In Fig. 2, we show the interdependent layers of the airtransport system. As can be seen from the figure, the basiccomponent of the system is the network formed by the flightsoperated by a single aircraft. It should be mentioned that aircrew should be taken into account when one tries to analyzethe propagation of flight delay. The late arrival of air crew andpassengers can cause the subsequent flight delay. It is howeverout of the scope of current study.
The idea of decomposition of the structure of air transportsystem is inspired from the idea of collaborative decisionmaking (CDM). Three main parties of CDM are airports,airlines, and air navigation service providers (ANSP), each ofwhich can be represented as one layer of the networks. Zaninet al. and Du et al. have studied the multilayer air transportnetwork with each airline’s network as a single laye[9], [10].The air traffic management layer is disregarded.
Sector can be seen as the operation unit of air trafficmanagement, controlled by one or two air traffic controllers.The dynamics of one sector can influence other sectors thatmay be not linked directly. For instance, when there is notenough capacity for handling incoming traffic, traffic flowmanagement initiatives are issued which will cause upstreamflights delayed. Thus, the structure of air traffic managementlayer can be captured by the sector network. The nodes of thenetwork are all the sectors, including tower/approach/groundcontrol sectors, approach sectors, and enroute sectors. Thedetermination of the edges depend on the letter of agreements(LOA) between different air navigation service providers(ANSPs) or air traffic control units which state detailedinformation on flights transfer between sectors. There is anedge between two nodes if there is traffic transferred betweenthe two sectors. Otherwise, there is no edges between the twosectors even they are physically adjacent. Sector network canbe modeled as directed and weighted graph if one consideringthe directions of transferring traffic and the volume of traffic.Fig. 3 presents the main 3 layers of air transport system inChina.
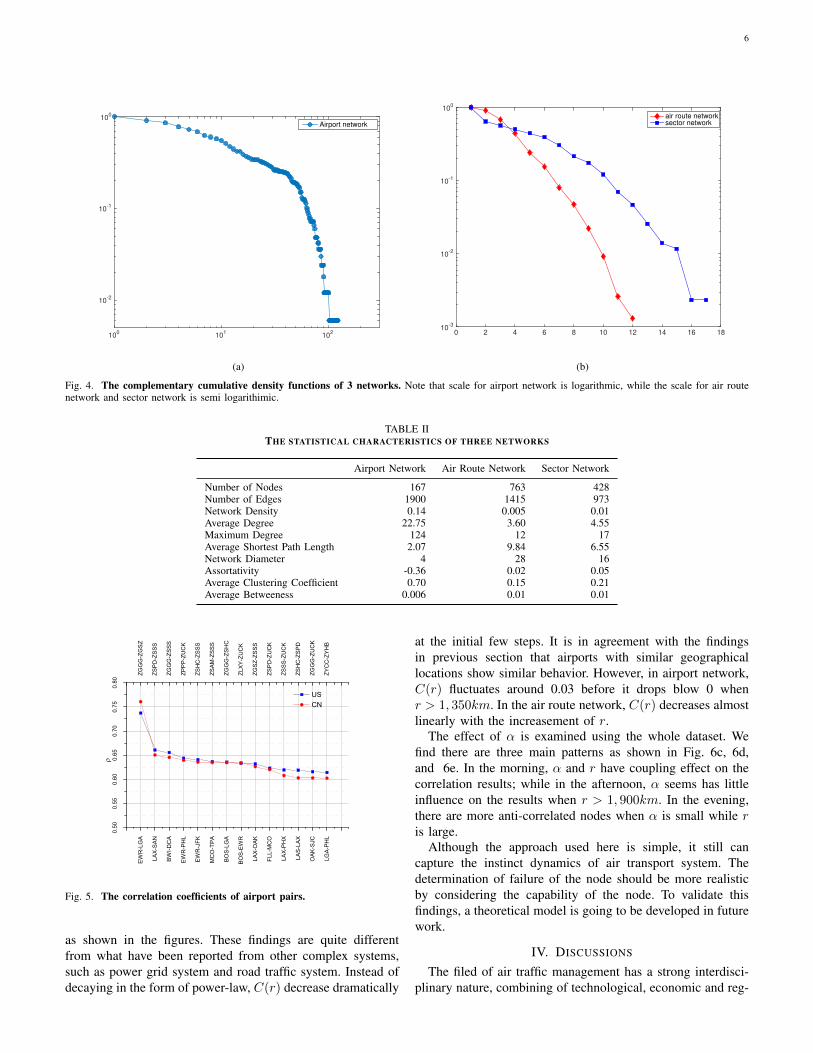
In Fig. 4, we show the degree distributions of the three mainnetworks of Chinese air transport system, airport network, airroute network, and sector network. The statistical informationof the three networks is given in table II. As it can be seenfrom the figure and the table, both sector network and air routenetwork exhibit similar characteristics which are significantlydifferent from airport network. Although the total number ofnodes in air route networks or sector network is more than totalnumber of nodes in airport network, both the average degree of

4
the nodes and the maximum degree are quite smaller than thatin airport network. The airport network can be characterizedwith small network properties and scale free feature whilethe other two are not. This significant difference in networkstructure could be the main reason that the studies of airportnetwork from complex networks have little impact in the airtransport field.
Here we have just presented our view on the structure ofair transport system, opening a new avenue for the study ofthe fundamental structure of air transport system. Still, thereare great work to be done in order to uncover fundamentalproperties of the multilayer of the air transport system.
III. THE DYNAMICS OF THE AIR TRANSPORT SYSTEM
The advancement of big data science together with theavailability of large operational datasets allow us to unrealthe hidden dynamics of air transport system. One of the moststudied dynamical aspects in air transport is flight delay. Aconsiderable amount of efforts have been devoted to inves-tigate flight delay mainly from two perspectives. The firstgroup of studies aim to minimize flight delay by optimizingutilizing available resources, while the second school of workis trying to understand how flight delay propagate throughairlines’ network or airport network. Our interest is to study thedynamics occurring on top of the networks that are describedin Section II by the analysis of flight delay. The questionraised here is that how flight delays spatially distributed in thenetworks? The occurrence of flight delay suggests that thereare disruptions happening in the system. Thus, it is directlylinked to the resilience and vulnerability of air transportsystem [26]. In the following, we show our initial analyticalresults on the spatial correlations of flight delay in airportnetwork and the cascading failure behavior in both airportnetwork and air route network. The analyses are based ontwo monthly flight datasets(1st August 2012 to 31th August2013) obtained from the Operations Management Center ofAir Traffic Management Bureau, Civil Aviation Administrationof China, and the Bureau of Transportation Statistics, UnitedStates Department of Transportation.
A. The correlations on flight delay between airports.
Pearson correlation coefficient is used to capture the cor-relations between flight delays in different airports. To maketime series data comparable, we use 15 minutes as samplingrate to calculate departure flight delays at each airport. LetXi(t) represents the departure delay at ith airport at tth timeslot, while T is the number of time slots that are observed ina traffic scenario.
To compute the correlation ρij between ith airport and jth
airport, one can use the following equation
ρij =E(XiXj)− E(Xi)E(Xj)√
E(Xi2)− E2(Xi)
√E(Xj
2)− E2(Xj), (1)
where ρ ∈ [−1, 1].To study the correlation of the flight delays in airport
network, we calculate the cross-correlation matrix C of airport
departure delays data according to eq 1. It is very interesting tofind that air transport systems in two countries exhibit quitesimilar behaviors. Fig. 5 plots the top 14 correlated airportpairs (ρij > 0.6) in the two air transport systems.
As can be seen from the figure, flight delays in the air-ports that are located note far from each other show similarcharacteristics maybe due to similar operational environmentsand geographical locations. For example, departure delaysin airports that are located in the Pearl River Delta area orYangtze River Delta area are most likely to have similar pat-terns. Newark airport, LaGuardia airport and Kennedy airportare all located in New York metroplex area, while BostonLogan airport and Philadelphia airport have close relationshipswith these three airports. Likewise, airports in Washingtonarea (Baltimore airport and Washington National airport) andMiami area (Fort Lauderdale airport, Orlando airport andTampa airport) are all have higher correlation coefficants. Theother six airports with a high correlative degree are locatedin the western coast. In China, the correlation coefficients ofairports between Guangzhou and Shenzhen, Shanghai Pudongand Shanghai Hongqiao, Changchun and Harbin, are muchlarger than the other airport pairs. The results indicates thatgeographical location as the external factor has impact on thedynamics of air transport system. s
B. Cascading failure behavior of the air transport system
The understanding of the temporal-spatial characteristicsof the cascading failure of the network systems has beenrecognized as an important step to predict and minimize thecascading failure. A very small failure in one component ofthe system may lead to catastrophic consequences[31]. Similarto other spatial-embedded system, here we try to understandhow far the “failure” can propagate in the system so that wemay be able to set up a “safety wall” to prevent that failure.
To do so, average flight delay at each airport/route point ata given time window [t1, t2] is first calculated. Then, the stateof the node xi is determined. xi = 1 if average flight delay ishigher than predefined threshold (α in minutes per flight), i.e.node is failure/degraded. Otherwise, xi = 0. The concept ofspatial correlations, C(r) is introduced to quantify the relationbetween failures separated at a distance r. C(r) is calculatedas
C(r) =1
σ2
∑ij,i∈F (xi − x)(xj − x)δ(rij − r)∑
ij,iinF δ(rij − r)(2)
where δ() is a selecting function to select the nodes whoseEuclidean distance to the failure node is r (or within a range).Positive values of C(r) means positive correlations betweennodes suggesting the tendency of failures to be close to eachother, while negative values indicate anti-correlations.
We calculate the daily spatial correlations based on hourlyflight delay at airport as the function of r. Fig. 6a and 6bare the averaged correlation results over one year for airportnetwork and air route network respectively. The time period[t1, t2] seems to have little effects on the trend of correlationresults since all the curves of C(r) exhibit similar shapes

5
Fig. 2. The 5 interdependent layers of the air transport system.
Fig. 3. The airport network, air route network, and sector network in Chinese air transport system.
6
100
101
102
10-2
10-1
100
Airport network
(a)
0 2 4 6 8 10 12 14 16 1810
-3
10-2
10-1
100
air route network
sector network
(b)
Fig. 4. The complementary cumulative density functions of 3 networks. Note that scale for airport network is logarithmic, while the scale for air routenetwork and sector network is semi logarithimic.
TABLE IITHE STATISTICAL CHARACTERISTICS OF THREE NETWORKS
Airport Network Air Route Network Sector Network
Number of Nodes 167 763 428Number of Edges 1900 1415 973Network Density 0.14 0.005 0.01Average Degree 22.75 3.60 4.55Maximum Degree 124 12 17Average Shortest Path Length 2.07 9.84 6.55Network Diameter 4 28 16Assortativity -0.36 0.02 0.05Average Clustering Coefficient 0.70 0.15 0.21Average Betweeness 0.006 0.01 0.01
EWR
-LG
A
LAX-
SAN
BWI-D
CA
EWR
-PH
L
EWR
-JFK
MC
O-T
PA
BOS-
LGA
BOS-
EWR
LAX-
OAK
FLL-
MC
O
LAX-
PHX
LAS-
LAX
OAK
-SJC
LGA-
PHL
0.50
0.55
0.60
0.65
0.70
0.75
0.80
US
ZGG
G-Z
GSZ
ZSPD
-ZSS
S
ZGG
G-Z
SSS
ZPPP
-ZU
CK
ZSH
C-Z
SSS
ZSAM
-ZSS
S
ZGG
G-Z
SHC
ZLXY
-ZU
CK
ZGSZ
-ZSS
S
ZSPD
-ZU
CK
ZSSS
-ZU
CK
ZSH
C-Z
SPD
ZGG
G-Z
UC
K
ZYC
C-Z
YHB
CN
Fig. 5. The correlation coefficients of airport pairs.
as shown in the figures. These findings are quite differentfrom what have been reported from other complex systems,such as power grid system and road traffic system. Instead ofdecaying in the form of power-law, C(r) decrease dramatically
at the initial few steps. It is in agreement with the findingsin previous section that airports with similar geographicallocations show similar behavior. However, in airport network,C(r) fluctuates around 0.03 before it drops blow 0 whenr > 1, 350km. In the air route network, C(r) decreases almostlinearly with the increasement of r.
The effect of α is examined using the whole dataset. Wefind there are three main patterns as shown in Fig. 6c, 6d,and 6e. In the morning, α and r have coupling effect on thecorrelation results; while in the afternoon, α seems has littleinfluence on the results when r > 1, 900km. In the evening,there are more anti-correlated nodes when α is small while ris large.
Although the approach used here is simple, it still cancapture the instinct dynamics of air transport system. Thedetermination of failure of the node should be more realisticby considering the capability of the node. To validate thisfindings, a theoretical model is going to be developed in futurework.
IV. DISCUSSIONS
The filed of air traffic management has a strong interdisci-plinary nature, combining of technological, economic and reg-

7
r (km)0 500 1000 1500 2000 2500 3000 3500 4000
C(r
)
-0.2
-0.1
0
0.1
0.2
0.3
0.4
0.5
(a)
r (km)0 500 1000 1500 2000 2500 3000 3500 4000
C(r
)
-0.2
-0.15
-0.1
-0.05
0
0.05
0.1
0.15
0.2
(b)
(c) (d) (e)
Fig. 6. Spatial correlations of cascading failures in air transport system. (a), Spatial correlations in airport network and in air route network (b). X-axisis the distance r in km. (c) and (d) are the effects of physical distance and the strength of resilience of the nodes, with x-axis is α and y-axis is the distancer in km.
ulatory aspects. A great number of contributions have emergedfrom the interactions between scientists trained in differentfields, ranging from computer science, through mathematics,to psychology. Researchers and operation experts have con-tributed to the improvement of the capability and efficiency ofthe system. However, there are still unanswered questions. Toensure the safety and efficiency, one must have the capabilityto predict and control the air transport system. Thus, theknowledge on the structure and dynamics of the system isa significant issue for practical control of air transport system.
The recent surge of physicists into the realms of socialscience and other scientific fields has been fueled largely bythe availability of huge empirical data. The combination of thestatistical mechanics theory and the observations of systembehavior have arisen in part to fulfil the particular need ofquantitative illustration of system structure and dynamics. Inthis work, we have investigated the structure and dynamicsof air transport system from the operation point of view,providing a framework allowing the applications of theoreticalfindings into real world systems.
V. ACKNOWLEDGEMENTS
This work was partially supported by the National NaturalScience Foundation of China (grant number: 61304190) and
by the Natural Science Foundation of Jiangsu Province ofChina (grant number: BK20130818).
REFERENCES
[1] A.-L. Barabasi, “The network takeover,” Nat Phys, vol. 8, no. 1, pp. 14–16, 01 2012. [Online]. Available: http://dx.doi.org/10.1038/nphys2188
[2] R. Guimera, S. Mossa, A. Turtschi, and L. A. N. Amaral, “Theworldwide air transportation network: Anomalous centrality, communitystructure, and cities’ global roles,” Proceedings of the National Academyof Sciences, vol. 102, no. 22, pp. 7794–7799, 2005. [Online]. Available:http://www.pnas.org/content/102/22/7794.abstract
[3] A. Vespignani, “Modelling dynamical processes in complex socio-technical systems,” Nat Phys, vol. 8, no. 1, pp. 32–39, 2012,10.1038/nphys2160.
[4] V. Colizza, A. Barrat, B. L. M., and A. Vespignani, “The role of theairline transportation network in the prediction and predictability ofglobal epidemics,” Proc Natl Acad Sci USA, vol. 103, pp. 2015–2020,2006, 10.1073/pnas.0510525103.
[5] R. Guimer, S. Mossa, A. Turtschi, and L. A. N. Amaral, “The worldwideair transportation network: Anomalous centrality, community structure,and cities’ global roles,” Proc Natl Acad Sci USA, vol. 102, pp. 7794–7799, 2005, 10.1073/pnas.0407994102.
[6] N. Pyrgiotis, K. M. Malone, and A. Odoni, “Modelling delay prop-agation within an airport network,” Transportation Research Part C:Emerging Technologies, vol. 27, no. 0, pp. 60–75, 2013.
[7] P. Fleurquin, J. J. Ramasco, and V. M. Eguiluz, “Systemic delaypropagation in the us airport network,” Sci. Rep., vol. 3, 2013,10.1038/srep01159.
[8] S. Boccaletti, G. Bianconi, R. Criado, C. del Genio, J. Gmez-Gardees, M. Romance, I. Sendia-Nadal, Z. Wang, and M. Zanin,“The structure and dynamics of multilayer networks,” PhysicsReports, vol. 544, no. 1, pp. 1 – 122, 2014, the structure

8
and dynamics of multilayer networks. [Online]. Available://www.sciencedirect.com/science/article/pii/S0370157314002105
[9] M. Zanin and F. Lillo, “Modelling the air transport with complexnetworks: A short review,” The European Physical Journal SpecialTopics, vol. 215, no. 1, pp. 5–21, 2013. [Online]. Available:http://dx.doi.org/10.1140/epjst/e2013-01711-9
[10] W.-B. Du, X.-L. Zhou, O. Lordan, Z. Wang, C. Zhao, andY.-B. Zhu, “Analysis of the chinese airline network as multi-layer networks,” Transportation Research Part E: Logistics andTransportation Review, vol. 89, pp. 108 – 116, 2016. [Online]. Available://www.sciencedirect.com/science/article/pii/S1366554515300521
[11] R. Beatty, R. Hsu, L. Berry, and J. Rome, “Preliminary evaluation offlight delay propagation through an airline schedule,” Air Traffic ControlQuarterly, vol. 7, pp. 259–270, 1999.
[12] H. Fricke and M. Schultz, “Delay impacts onto turnaround perfor-mance - optimal time buffering for minimizing delay propagation,”in USA/Europe Air Traffic Management Research and DevelopmentSeminar (ATM 2009), 2009.
[13] M. Hansen, “Micro-level analysis of airport delay externalities usingdeterministic queuing models: a case study,” Journal of Air TransportManagement, vol. 8, no. 2, pp. 73 – 87, 2002. [Online]. Available:http://www.sciencedirect.com/science/article/pii/S096969970100045X
[14] K. F. Abdelghany, S. S. Shah, S. Raina, and A. F.Abdelghany, “A model for projecting flight delays during irregularoperation conditions,” Journal of Air Transport Management,vol. 10, no. 6, pp. 385 – 394, 2004. [Online]. Available:http://www.sciencedirect.com/science/article/pii/S0969699704000377
[15] M. Jetzki, “The propagation of air transport delays in europe,” Ph.D.dissertation, Department of Airport and Air Transportation Research,RWTH AACHEN UNIVERSITY, 2009.
[16] M. Hansen, T. Nikoleris, D. Lovell, K. Vlachou, and A. Odoni, “Use ofqueuing models to estimate delay savings from 4d trajectory precision,”in 8th USA/Europe Air Traffic Management Research and DevelopmentSeminar (ATM2009), 2009.
[17] D. Long and S. Hasan, “Improved prediction of flight delays using thelminet2 system-wide simulation model,” in AIAA Aviation Technology,Integration, and Operations Conference (ATIO), 2009.
[18] M. Peterson, D. Bertsimas, and A. Odoni, “Models and algorithms fortransient queueing congestion at airports,” Management Science, vol. 41,pp. 1279–1295, 1995.
[19] M. D. Peterson, D. J. Bertsimas, and A. R. Odoni, “Decompositionalgorithms for analyzing transient phenomena in multiclassqueueing networks in air transportation,” Operations Research,vol. 43, no. 6, pp. 995–1011, 1995. [Online]. Available:http://pubsonline.informs.org/doi/abs/10.1287/opre.43.6.995
[20] N. Xu, “Method for deriving multi-factor models for predicting airportdelays,” Ph.D.@, George Mason University, 2007.
[21] K. M. Feigh, A. R. Pritchett, A. P. Shah, S. A. Kalaver, A. Jadhav,D. M. Holl, R. C. Bea, and A. Z. Gilgur, “Analyzing air trafficmanagement systems using agent-based modeling and simulation,” in6th USA/Europe Air Traffic Management Research and Development(ATM R& D) Seminar, 2005.
[22] S. M. Lee and A. R. Pritchett, “Evaluating transformations of the airtransportation system through agent-based modeling and simulation.”
[23] M. Jani, “Reprint of modelling the resilience, friability and costsof an air transport network affected by a large-scale disruptiveevent,” Transportation Research Part A: Policy and Practice, vol. 81,pp. 77 – 92, 2015, resilience of Networks. [Online]. Available://www.sciencedirect.com/science/article/pii/S0965856415002049
[24] L. Daqing, J. Yinan, K. Rui, and S. Havlin, “Spatial correlationanalysis of cascading failures: Congestions and blackouts,” ScientificReports, vol. 4, pp. 5381 EP –, 06 2014. [Online]. Available:http://dx.doi.org/10.1038/srep05381
[25] D. Helbing, “Globally networked risks and how to respond,” Nature,vol. 497, no. 7447, pp. 51–59, 05 2013. [Online]. Available:http://dx.doi.org/10.1038/nature12047
[26] A. Cook, H. A. Blom, F. Lillo, R. N. Mantegna, S. Miccich,D. Rivas, R. Vzquez, and M. Zanin, “Applying complexityscience to air traffic management,” Journal of Air TransportManagement, vol. 42, pp. 149 – 158, 2015. [Online]. Available://www.sciencedirect.com/science/article/pii/S0969699714001331
[27] Y. HE, X. ZHU, and D.-R. HE, “Statistics and developing model ofchinese skyway network,” International Journal of Modern PhysicsB, vol. 18, no. 17n19, pp. 2595–2598, 2004. [Online]. Available:http://www.worldscientific.com/doi/abs/10.1142/S0217979204025737
[28] W. Li and X. Cai, “Statistical analysis of airport network of china,”Phys. Rev. E, vol. 69, p. 046106, Apr 2004. [Online]. Available:http://link.aps.org/doi/10.1103/PhysRevE.69.046106
[29] X. Sun, S. Wandelt, and F. Linke, “Temporal evolution analysisof the european air transportation system: air navigation routenetwork and airport network,” Transportmetrica B: TransportDynamics, vol. 3, no. 2, pp. 153–168, 2015. [Online]. Available:http://dx.doi.org/10.1080/21680566.2014.960504
[30] S. Belkoura, A. Cook, J. M. Pea, and M. Zanin, “On themulti-dimensionality and sampling of air transport networks,”Transportation Research Part E: Logistics and TransportationReview, vol. 94, pp. 95 – 109, 2016. [Online]. Available://www.sciencedirect.com/science/article/pii/S1366554516301946
[31] A. Bashan, Y. Berezin, S. V. Buldyrev, and S. Havlin, “The extremevulnerability of interdependent spatially embedded networks,” NatPhys, vol. 9, no. 10, pp. 667–672, 10 2013. [Online]. Available:http://dx.doi.org/10.1038/nphys2727
Yanjun Wang is an Associate Professor of College of Civil Aviation ofNanjing University of Aeronautics and Astronautics. He received B.S. inAir Traffic Management and Dispatch and MS in Transportation Engineeringfrom NUAA in 2004 and 2007 repsectively. He was a doctoral researcherat EUROCONTROL Experimental Center from 2009 to 2012, and receivedhis PhD in information and network science from Tlcom ParisTech (ENST),France. He also holds an air traffic controller?s license. His research interestscover human factors, complex system modeling and analysis.
Xinhua Xu is current a master student at College of Civil Aviation, NanjingUniversity of Aeronautics and Astronautics. Her research focus is on the dataanalysis in air transportation.
Minghua Hu is a professor and doctoral supervisor at the Civil AviationCollege of Nanjing University of Aeronautics and Astronautics (NUAA),China. He is also an expert of Civil Aviation Administration of of China(CAAC) and a member of future national ATFM system panel.
Jianming Zhan is the director of air traffic management division, air trafficmanagement bureau of CAAC. His research interest covers air traffic flowmanagement and airspace management.