the state of freight: rail and intermodal state of freight: rail and intermodal railtrends+...
TRANSCRIPT

11/19/15
1
THE STATE OF FREIGHT: RAIL AND INTERMODAL
Railtrends Conference Nov 19, 2015
Larry Gross Partner FTR 888.988.1699 x41 [email protected] @Intermodalist
www.FTRintel.com
www.FTRintel.com

11/19/15
2
3 3
DISCUSSION OVERVIEW
§ Economic Indicators § State of Freight
o Rail Carload o Intermodal (with a truck detour)
§ Fearless Forecast
ECONOMY

11/19/15
3
5 5
MANUFACTURING IS STILL (BARELY) POSITIVE ISM MANUFACTURING VS IP MANUFACTURING
ISM Manufacturing Index (>50 = Growth)
Industrial ProducIon: Manufacturing (2012=100)
30
35
40
45
50
55
60
65
2006
2007
2008
2009
2010
2011
2012
2013
2014
2015
80
85
90
95
100
105
110
2006
2007
2008
2009
2010
2011
2012
2013
2014
2015
5 Source: FTR, ISM, Federal Reserve
6
BUSINESSES: STUCK IN THE MUD ORDERS & INVENTORIES
Source: Census Bureau
Core Capital Goods Orders
$45
$50
$55
$60
$65
$70
$75
2006
2007
2008
2009
2010
2011
2012
2013
2014
2015
Inventory-‐to-‐Retail Sales RaIo
1.20
1.25
1.30
1.35
1.40
1.45
1.50
2006
2007
2008
2009
2010
2011
2012
2013
2014
2015

11/19/15
4
7
CONSTRUCTION: ROOM TO GROW RESIDENTIAL VS. BUSINESS
Source: FTR, Census Bureau
ConstrucIon Spending
$200
$300
$400
$500
$600
$700
2006 2007 2008 2009 2010 2011 2012 2013 2014 2015
Business Spending back to pre-recession peak, long way to go for Residential
8
GDP – RECOVERY LENGTH
Source: FTR Associates
0
1
2
3
4
5
6
Begi
nnin
g O
f Re
cove
ry =
1
Length Expressed In Timing of Current Recovery
Growth In GDP During Recoveries
1950
1954
1958
1961
1971
1975
1982
1991
2001
2010
Forecast
1950
1954
1958
1971
1975
1982
1991
1961
2001
Current Forecast

11/19/15
5
Rail Carload
10 10
RAIL CARLOADS HAVE BEEN WEAK SINCE LATE WINTER
200
250
300
350
400
450
-12% -10% -8% -6% -4% -2% 0% 2% 4% 6% 8%
10% 12%
Thou
sand
s
N.A. Total Carloads Week Ending 10/31/15
Carloads Vs. Prev. Year Carloads Source: AAR
Source: AAR

11/19/15
6
11 11
H2 TO DATE N.A. CARLOADS (EXCL. IM) VERSUS SAME PERIOD 2014
16 3
(124) (215)
(28) (11)
5 (0) (1) (2) (5) (3)
(40) (13)
2 (34)
9 (18)
(6) 28
- (440)
-500 -400 -300 -200 -100 0 100
Grain Farm Prod. Excl Grain Metallic Ores Coal Crushed Stone, Sand, Gravel Non-Metallic Minerals Grain Mill Products Food Products Primary Forest Products Lumber & Wood Products Pulp & Paper Chemicals Petroleum Products Stone, Clay, Glass Coke Metals & Metal Products Motor Vehicles & Equip Metal Scrap Other Waste & Scrap Other Commodities Intermodal (Platforms) Total
Source: AAR, FTR
12 12
EXCLUDING SPECIALS (GRAIN, COAL, CRUDE) INDUSTRIAL ECONOMY STILL LOOKS WEAK
100
120
140
160
180
200
220
240
-10% -8% -6% -4% -2% 0% 2% 4% 6% 8%
10% 12%
Thou
sand
s
N.A. Total Carloads Week Ending 10/31/15
Carloads Vs. Prev. Year Carloads Source: AAR
Source: AAR, FTR

11/19/15
7
13 13
SERVICE RECOVERY IS TAKING HOLD – AVERAGE TRAIN SPEED
22.0
22.5
23.0
23.5
24.0
24.5
25.0
25.5
26.0
26.5
1 5 9 13 17 21 25 29 33 37 41 45 49 53 4 W
eek
Mov
ing
Ave
rage
IM T
rain
Spe
ed -
MPH
Week
4-Week Avg. Train Speeds - Total Network
Average 2000-2009 2010 2011 2012 2013 2014 2015
14 14
SERVICE RECOVERY IS TAKING HOLD – YARD DWELL
22
23
24
25
26
27
28
29
1 5 9 13 17 21 25 29 33 37 41 45 49 53 4 W
eek
Mov
ing
Ave
rage
IM T
rain
Spe
ed -
MPH
Week
4-Week Avg. Yard Dwell - Total Network
Average 2000-2009 2010 2011 2012 2013 2014 2015
11/19/15
8
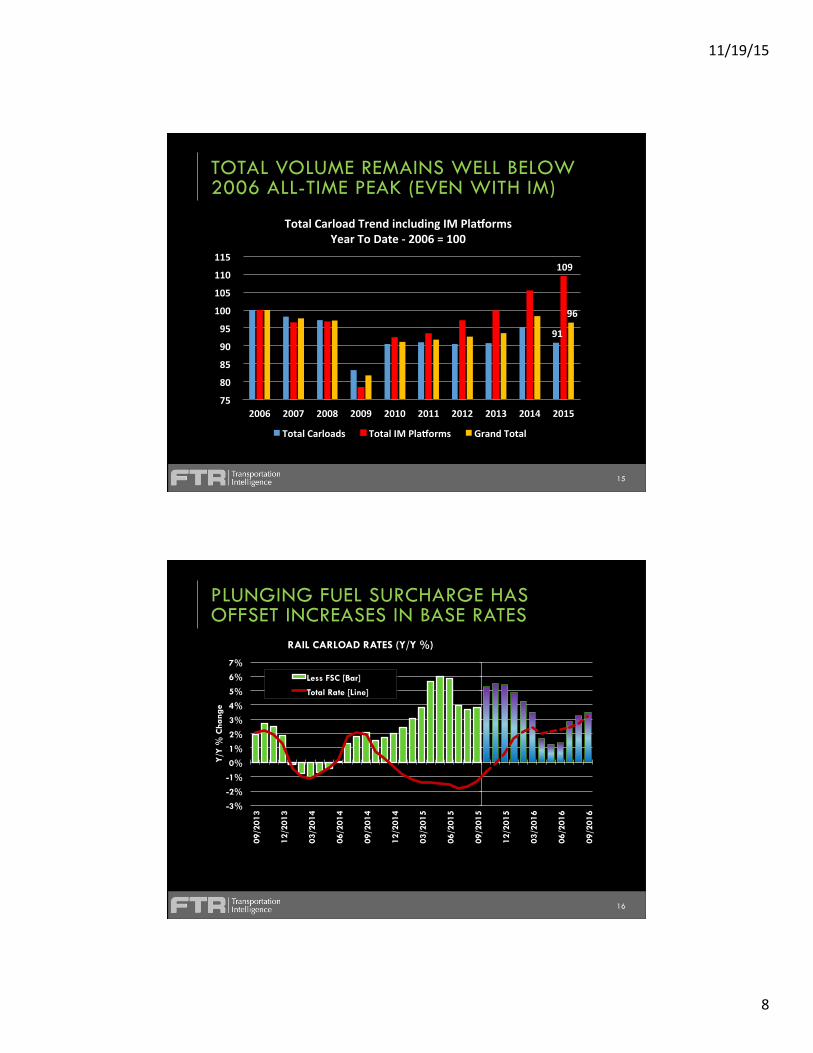
15 15
TOTAL VOLUME REMAINS WELL BELOW 2006 ALL-TIME PEAK (EVEN WITH IM)
91
109
96
75
80
85
90
95
100
105
110
115
2006 2007 2008 2009 2010 2011 2012 2013 2014 2015
Total Carload Trend including IM PlaCorms Year To Date -‐ 2006 = 100
Total Carloads Total IM PlaCorms Grand Total
16 16
PLUNGING FUEL SURCHARGE HAS OFFSET INCREASES IN BASE RATES
-3%
-2%
-1%
0%
1%
2%
3%
4%
5%
6%
7%
09/2
013
12/2
013
03/2
014
06/2
014
09/2
014
12/2
014
03/2
015
06/2
015
09/2
015
12/2
015
03/2
016
06/2
016
09/2
016
Y/Y
% C
hang
e
RAIL CARLOAD RATES (Y/Y %)
Less FSC [Bar]
Total Rate [Line]
Source: FTR; Copyright 2014 Data is seasonally adjusted; excludes Intermodal

11/19/15
9
17 17
POSSIBLE SOURCES OF IMPROVEMENT § Lumber (Strengthening residenIal construcIon outlook) § Chemicals (Petrochemical investment fueled by low prices – late 2016 and beyond? § Intermodal
Probably not enough to fill the hole….
18 18
CARLOAD VOLUME WILL SHRINK THIS YEAR AND ONLY GROW A BIT IN 2016
Source: FTR Freightcast
Excludes Intermodal
Y/Y % Change
2015 Q1
2015 Q2
2015 Q3
2015 Q4
2016 Q1
2016 Q2
Carloads 1.4% -6.3% -4.6% -5.8% -1.1% 4.9%
Y/Y % Change
2014
2015 2016
Carloads 3.2%
-3.9% 1.3%

11/19/15
10
Intermodal
20
TRUCK LOADINGS FORECAST 4.
2%
3.3%
3.
0%
-15% -12% -9% -6% -3% 0% 3% 6% 9%
1993
19
94
1995
19
96
1997
19
98
1999
20
00
2001
20
02
2003
20
04
2005
20
06
2007
20
08
2009
20
10
2011
20
12
2013
20
14
2015
20
16
2017
Y/Y
Per
cent
Cha
nge
U.S. Truck Loadings Originated
§ Modest freight growth expected going forward
Source: FTR Trucking Update Report
Dry van will be even lower!

11/19/15
11
21
THE CUMULATIVE EFFECT OF REGULATIONS WILL BE SEVERE
Source: FTR
(50)
-
50
100
150 20
11.1
2012
.1
2013
.1
2014
.1
2015
.1
2016
.1
2017
.1
2018
.1
Thou
sand
s
Additional Driver Hires Per Quarter Required By Regulation Electronic Stability Controls Speed Limiters Training Provisions OSHA Worker Protection Minimum Insurance Safe Harbor Entry Proficiency Drug & Alcohol Data Base/Hair testing Prohibition Of Coercion Pattern Of Violation Independent Contractor Rules Safe Food Transportation Motor Carrier Protection Act HOS ELD Health Regulations and Treatment Immigration Effects Mexico Regional Equipment CSA
22
TRUCKING RATES OUTLOOK
Source: FTR Shippers Update Report

11/19/15
12
23 23
INTERMODAL HEADLINES
§ DomesIc intermodal faces headwinds § InternaIonal returns to “normal” § Import diversion conInues § Service recovery begins to take hold § Overcapacity crisis on the water
24 24
400
450
500
550
600
650
700
750
800
800
900
1000
1100
1200
1300
1400
1500
1600
Nov Dec Jan Feb Mar Apr May Jun Jul Aug Sep Oct
Thou
sand
s
Total Intermodal: Rev. Moves - Actual (000's)
Sources: GTC, FTR, IANA; Copyright 2015
VOLUME HAS STABILIZED SINCE THE END OF THE USWC MELTDOWN
Total (Left Axis)
International (Right Axis)
Domestic (Right Axis)
Sources: IANA ETSO, GTC, FTR Copyright 2015

11/19/15
13
25 25
-15%
-10%
-5%
0%
5%
10%
15%
Nov Dec Jan Feb Mar Apr May Jun Jul Aug Sep Oct
Total Intermodal: Year/Year % Change
Sources: GTC, FTR, IANA; Copyright 2015
INTERMODAL GROWTH HAS SLOWED
Total +3.2% YTD (Left Axis)
International +3.2% YTD (Right Axis)
Domestic +3.3% YTD (Right Axis)
Sources: IANA ETSO, GTC, FTR Copyright 2015
26 26
450
500
550
600
650
700
750
800
1200
1250
1300
1350
1400
1450
1500
1550
Nov Dec Jan Feb Mar Apr May Jun Jul Aug Sep Oct
Thou
sand
s
Seasonally Adjusted Rev. Moves (000)
Sources: GTC, FTR, IANA; Copyright 2015 Current 12 Months
SEASONAL ADJUSTMENTS SHOW DOMESTIC NOT GROWING
Total (Left Axis)
International (Right Axis)
Domestic (Right Axis)
Sources: IANA ETSO, GTC, FTR Copyright 2015

11/19/15
14
27 27
OCTOBER WAS SEASONALLY NORMAL FOR DOMESTIC BUT NOT INT’L
Source: AAR
10.3%
10.3%
0%
2%
4%
6%
8%
10%
12%
14%
16%
Volu
me
% v
s. A
vera
ge M
onth
Seasonality - Domestic - October
1.9%
6.6%
0%
2%
4%
6%
8%
10%
12%
Volu
me
% v
s. A
vera
ge M
onth
Seasonality - International - October
28 28
INTERMODAL SERVICE IS IMPROVING
28
29
30
31
32
33
34
1 5 9 13 17 21 25 29 33 37 41 45 49 53
4 W
eek
Mov
ing
Ave
rage
IM T
rain
Spe
ed -
M
PH
Week
4-Week Avg. Intermodal Train Speeds - Total Network
Average 2000-2009 2010 2011 2012 2013 2014 2015

11/19/15
15
29 29
NORTH AMERICAN IMPORTS ARE UP EXPORTS ARE NOT
Sources: Port Reports, FTR
1,000
1,200
1,400
1,600
1,800
2,000
2,200
-30%
-20%
-10%
0%
10%
20%
30%
40%
50%
Oct '1
4 Nov
'14
Dec
'14
Ja
n '1
5 Fe
b '1
5 Mar
'15
Apr
'15
May
'15
Ju
n '1
5 Ju
l '15
Aug
'15
Sep
'15
Thou
sand
s
Seasonally Adjusted N.A. Imports - 000 TEUs
Month/Month Change Seasonally Adjusted Imports
Sources: FTR, GTC, Port Reports
-15% -10%
-5% 0% 5%
10% 15% 20% 25% 30% 35%
Summary: N.A. Port Activity - Y/Y Change
Total Imports Exports
30 30
INTERMODAL CONTINUES TO GAIN MARKET SHARE OF U.S. LONG-HAUL DRY VAN
7.0% 7.5% 8.0% 8.5% 9.0% 9.5%
10.0% 10.5% 11.0%
U.S. Intermodal Market Share Domestic
7.0% 7.5% 8.0% 8.5% 9.0% 9.5%
10.0% 10.5% 11.0%
U.S. Intermodal Market Share International
Sources: GTC, FTR, ETSO Report Sources: GTC, FTR, IANA ETSO Data

11/19/15
16
31 31
DOMESTIC STILL IS FACING A NUMBER OF HEADWINDS § Slowing growth in demand for long-‐haul dry van transport § Ample truck capacity available – for now § Lower fuel prices erode intermodal cost advantage
32 32
ISSUES ABOUND ON THE OCEAN
§ SubstanIal over-‐capacity due to overbuilding Ø Lower prices but lower service reliability due to blanked voyages
§ Port congesIon conInues § Some progress on chassis front but sIll problemaIc § Panama Canal expansion schedule sIll a quesIon § No ILA Contract will be signed this year § Port cartage under stress
Ø Independent contractor model is under threat Ø Port congesIon issues causing producIvity loss Ø Driver availability/cost a big concern

11/19/15
17
33
RAIL INTERMODAL RATES
Source: FTR Intermodal Update Report
-‐6%
-‐4%
-‐2%
0%
2%
4%
6%
8%
09/2013
12/2013
03/2014
06/2014
09/2014
12/2014
03/2015
06/2015
09/2015
12/2015
03/2016
06/2016
09/2016
Y/Y % Cha
nge
Rate Outlook: Intermodal
Rev/Load (w/o FSC) Rev/Load (w/ FSC)
Source: FTR; Copyright 2015
34 34
INTERMODAL GROWTH IS PROJECTED TO CONTINUE, BUT AT A SLOWER PACE
Source: FTR Freightcast
Y/Y % Change
2015 Q1
2015 Q2
2015 Q3
2015 Q4
2016 Q1
2016 Q2
International 0.6% 6.8% 4.0% 6.0% 9.9% -1.2%
Domestic 5.6% 2.2% 2.7% 2.9% 2.8% 3.5%
Total 3.1% 4.5% 3.4% 4.4% 6.3% 1.0%
Y/Y % Change
2014
2015 2016 2017
International 4.4% 4.4% 4.3% 4.7%
Domestic 5.1% 3.3% 3.6% 6.6%
Total 4.8% 3.9% 3.9% 5.6%

11/19/15
18
35
FTR Transportation Conference
September 13-15, 2016 Indianapolis, IN
www.FTRConference.com
Hand me a business card and I will be happy to send you a
copy of this presentation
Or download at
www.ftrintel.com/Railtrends
36
Stay Connected Twitter: @FTRintel
Blog: blog.ftrintel.com FTRintel.com/SOFTODAY
www.ftrintel.com
Stay in Contact www.FTRintel.com [email protected] 888.988.1699

11/19/15
19
THE STATE OF FREIGHT: RAIL AND INTERMODAL
Railtrends Conference Nov 19, 2015
Larry Gross Partner FTR 888.988.1699 x41 [email protected] @Intermodalist
www.FTRintel.com
Thanks!