the society for information management enterprise ... · sim enterprise architecture working group...
TRANSCRIPT
The Society for Information Management Enterprise Architecture Working Group
Information Management Practices Survey 2007
Preliminary Report: The State of EA: Progress, not Perfection
Leon A. Kappelman, Ph.D. Co-chair, SIM Enterprise Architecture Working Group
Professor of Information Systems Director Emeritus, Information Systems Research Center
Fellow, Texas Center for Digital Knowledge Information Technology & Decision Sciences Department
College of Business Administration, University of North Texas
and
Brian Salmans, MS, MBA Lieutenant Colonel, US Air Force
PhD Student, University of North Texas
Contributing Editors: Thomas McGinnis, University of North Texas
Thiagarajan Ramakrishnan, University of North Texas
This project was sponsored by: Society for Information Management (SIM)
SIM Enterprise Architecture Working Group (SIMEAWG) Information Systems Research Center at the University of North Texas
This Preliminary Report is provided free of charge to all those who participated in the
SIMEAWG’s Information Management Practices Survey 2007
1-February-2008
SIMEAWG’s Information Management Practices Survey 2007: Preliminary Report Page 1
Official Notices
Disclaimer We have tried our very best to provide useful and accurate information. Nevertheless, our lawyers ask that we advise you that all of the contributors, their employers, the Society for Information Management (SIM), the members of the SIM Enterprise Architecture Working Group, all of the authors and editors, and any and all related entities, make no representations or warranties with respect to the contents hereof and specifically disclaim any implied warranties or merchantability or fitness for any particular purpose. Furthermore, they reserve the right to revise this publication and to make changes from time to time to the content hereof without obligation to notify any person of such revisions.
Copyright Notice © 2008 Society for Information Management. All rights reserved. No part of this work covered by the copyright hereon may be reproduced or used in any form or by any means — graphic, electronic, or mechanical, including photocopying, recording, taping, or information storage and retrieval systems — without the written permission of the Society for Information Management.
For Further Information Further analyses of this survey as well as future enterprise architecture surveys will be conducted by Society for Information Management Enterprise Architecture Working Group (SIMEAWG). The SIMEAWG will also publish other reports and publications about enterprise architecture (EA) and give presentation and seminars on EA and related subjects. For updates on this survey and the work of the SIMEAWG, please check regularly at: http://EAWG.simnet.org. For questions or concerns about this Preliminary Report or the SIMEAWG please contact either Dr. Leon Kappelman at [email protected] or Brian Salmans at [email protected].

SIMEAWG’s Information Management Practices Survey 2007: Preliminary Report Page 2
Executive Summary: The State of EA: Progress, not Perfection
The body of literature and knowledge on enterprise architecture (EA) continues to increase as organizations realize the value EA can add in today’s hyper competitive, productivity focused, global environment. Moreover, IT professionals are becoming aware that EA may be the skill set required in order to gain business credibility and a seat at their organization’s strategic management table. The Society for Information Management (SIM) EA Working Group’s (SIMEAWG) survey was created to more fully understand the state of EA in organizations and the perceptions of IT leaders regarding EA. The survey was developed by the SIMEAWG, a group of over 50 EA practitioners, academics, and thought leaders from industry, government, and academia, dedicated to understanding and improving EA practices and helping IT professionals capitalize on the opportunities of EA. These initial findings provide critical insight into how IT professionals view themselves, their profession, EA’s potential, and the state of EA practice in their organizations. Three findings stood out in our initial review of the results.
First of all, our preliminary analysis indicates that many of the respondents believe in the potential positive impact of EA. The second finding is related to a dichotomy of responses to a survey question about whether or not the purpose/function of enterprise architecture is to provide a snapshot in time of an organization. The amount of disagreement with the statement is revealing since it indicates that the majority of respondents do not believe EA is about the enterprise at all, presumably believing that it is only about IT instead. The third finding that stood out is that developing requirements, a basic and necessary component of an enterprise architect’s skill set, and for decades considered to be the “essence” of software development1 continues to be a challenge for IT professionals. In-depth analyses of the data from the survey will further examine these preliminary findings and extend the investigation to include a focus on software development practices and the requirements process, assessing individuals’ understanding of what EA is as well as their perceptions of EA’s effects and benefits. Moreover, the various demographic data (e.g., organization type and size, job position and tenure, etc.) will be utilized to examine possible differences with responses to survey questions among various groups. Additionally, a follow on survey will be conducted in the Fall of 2008 to assess possible changes in EA- and IT-related practices and perceptions.
We are beginning to see more and more research being conducted in the EA realm, and the SIMEAWG is postured to continue making substantial contributions to this important field. The first of these contributions is this report. We consider these findings as preliminary and intend to conduct further, more extensive validation and analysis of these data, as well as additional data we have collected already. Subsequent findings will be made available in future publications. Moreover, it is the intention of the SIMEAWG to update and revise our survey as may be indicated by our findings and ongoing understanding of the subject matter.
We believe EA will continue to increase in importance not just to IT professionals but to management of all disciplines as the Information Age progresses. It is our hope that the SIMEAWG will continue to serve as a provider of intellectual capital to assist in developing practices that enable IT professionals to understand, create, and manage EA in partnership with the business. 1 Brooks, F. P., (1995), The Mythical Man-Month, 20th Anniversary Edition, Boston: Addison-Wesley Longman.

SIMEAWG’s Information Management Practices Survey 2007: Preliminary Report Page 3
Table of Contents Official Notices .............................................................................................................................. 1
Disclaimer ................................................................................................................................... 1
Copyright Notice......................................................................................................................... 1
For Further Information .............................................................................................................. 1
Executive Summary: The State of EA: Progress, not Perfection.................................................. 2
Table of Contents .......................................................................................................................... 3
Acknowledgements ....................................................................................................................... 4
SIMEAWG Membership Roster 2007-2008 ............................................................................... 5
The State of EA: Progress, not Perfection. ................................................................................. 6
Methodology............................................................................................................................... 6
Findings....................................................................................................................................... 7
Respondents generally believe in the positive potential of EA .............................................. 8
Respondents disagree on scope of EA activities................................................................... 10
Respondents rate the quality of the requirements practices poorly ...................................... 12
Detailed Survey Results............................................................................................................ 16
The SIM Enterprise Architecture Working Group’s “Charter” ........................................... 42
SIMEAWG’s Information Management Practices Survey 2007: Preliminary Report Page 4
Acknowledgements
We would like to acknowledge all those who have helped to make this document possible. Our sincere apologies to all those who we may have overlooked. Organizations (alphabetically):
• All the Member Organizations of the SIM EAWG • Society for Information Management (SIM) • Institutional Review Board (IRB), University of North Texas • Information Systems Research Center (ISRC), University of North Texas • Information Technology & Decision Sciences Department (ITDS), UNT • SIM Year 2000 Working Group
Individuals (alphabetically): • Tim Boivin, Tech Image® • Mary Barten, Institutional Research and Accreditation, University of North Texas • Andrea Black, ISRC, University of North Texas • Lisa Bowen, ITDS, University of North Texas • Shelia Bourns, Office of Research Services, University of North Texas • Dick Burk, U.S. Office Management & Budget • Kevin Campbell, Hunt Consolidated • Leo Collins, Lions Gate Entertainment • Jenna Countryman, Smith Bucklin • Elisabeth Fisher, Institutional Research and Accreditation, University of North Texas • Ruth Gallagher, Smith Bucklin • Finley Graves, College of Business, University of North Texas • Dan Green, Tech Image® • Holt Hackney, Architecture & Governance Magazine • Randy Hite, U.S. General Accountability Office • Michael Holland, U.S. General Accountability Office • Andrew Jackson, BravoTech • Mary Jones, ITDS, University of North Texas • Joe Lacik, Aviall • Jerry Luftman, Stevens Institute of Technology • Jim Luisi, Smith Bucklin • Steven McDevitt, Federal Emergency Management Administration • Ephraim McLean, Georgia State University • Edward Meagher, US Department of the Interior • John Oglesby, ACH Food Companies • Nicole Pfleeger, Smith Bucklin • Stacey Suits, ITDS, University of North Texas • Denny Yost, Align Journal
Finally, we would like to thank all the respondents who took the time to complete this important survey and made these findings possible.

SIMEAWG’s Information Management Practices Survey 2007: Preliminary Report Page 5
SIMEAWG Membership Roster 2007-2008 Society for Information Management Enterprise Architecture Working Group
Name Company Name Company
Mark Lane ABN AMRO Skip Slone Lockheed Martin Corp
Mohan Putcha Allstate Alex Pettit Marsh Risk Consulting / City of Denton, TX
Haiping Luo Association of Enterprise Architects (a|EA) Israel Martinez Net.Net
Ronald de Vries Atos Origin, Inc. Ed Cannon New Madison Avenue
George Harth Atos Origin, Inc. Christopher Feola nextPression, Inc.
Arnulfo Antonio Aviall Services James Jennings nextPression, Inc.
Russell Douglas Aviall Services Karl Gouverneur Northwestern Mutual
Aaron Merrill Aviall Services Bruce Ballengee Pariveda Solutions
Tyson Brooks BAE Systems Information Technology Patrick O'Malley Pariveda Solutions
Jamike Orduh Basic Designs Don Nguyen Pepsi
Peter Tribulski Chubb & Son Tery Wong Pepsi
Daniel Evans CIBER Sandeep Purao Penn State
Manish Sharma CIBER Brian Cameron Penn State
Keith Carpenter CIT Group Pierre Pureur People's Bank
Armando Ortiz CIT Group Reinaldo Dafonte Pernod Ricard
Larry Burgess Citigroup Beatrice Leon Pernod Ricard
Raymond Perez Community College of Southern Nevada Kim Morris PNM Resources
Jared Gordon County of Westchester Tony Farah Price Chopper
Norm Jacknis County of Westchester Daniel Loughney Russell Reynolds
Geof Knoerzer DePaul University Scott Bernard Syracuse University
David Bissessar Document Sciences Marco Gutierrez Universidad Catolica del Norte
Larry DeBoever EA directions Inc. Aurora Sanchez Universidad Catolica del Norte
George Paras EA directions Inc. David Reed University of Maryland University College
Keith Andrews EDS Joseph Bradley University of Missouri - Rolla
Gene Leganza Forrester Bih-ru Lea University of Missouri - Rolla
Chrissy Napper Forrester Sharma Hanish University of North Texas
Andy Field International Paper John Hooper University of North Texas
Mark Fowler Interstate Batteries Leon Kappelman University of North Texas
Merv Tarde Interstate Batteries Chang Koh IS Research Center @ UNT
Jim McCormack iRobot Corporation Maurice Leatherbury University of North Texas
Katrina Sorrentino iRobot Corporation Thomas McGinnis University of North Texas
Paul Strickler L-3 communications - Avionics Systems Thiagarajan (Ram) Ramakrishnan University of North Texas
Randy Tate L-3 communications - Avionics Systems Brian Salmans University of North Texas
Raymond Bordogna LiquidHub, Inc. John Windsor IS Research Center @ UNT
William (Bill) Peterson LiquidHub, Inc. Stan Locke Zachman Framework Associates
Edwin Nassiff Lockheed Martin Corp John Zachman Zachman International
As of 31-January-2008.
SIMEAWG’s Information Management Practices Survey 2007: Preliminary Report Page 6
The State of EA: Progress, not Perfection. The SIMEAWG initiated the SIM Information Management Practices Survey in order to assist in satisfying aspects of the mission of the working group as stated in the SIMEAWG charter. Specifically the survey of SIM membership would help in determining the state of EA practices in industry and lead to the development of metrics with which SIM members can benchmark their EA program with other organizations. Finally, the survey results may also be used in developing a maturity assessment for organizations to self-inspect and measure their EA program.
Methodology The SIM Information Management Practices survey was conducted to better understand
the state of EA practice in organizations at this point in time. The initial survey was drafted with the aim of accomplishing the stated deliverables from the SIMEAWG charter. The survey, particularly the demographics and some general IT practices questions, was based on a previously conducted survey from a survey and book by the SIM Y2K Working Group.2 A literature review was conducted as well as a review of EA maturity models with which to establish the basis for the survey’s EA, alignment, and other questions.
Beginning with the inaugural SIMEAWG meeting in January 2007 and continuing through the spring, a modified Delphi study approach was used with an expert group of EA professionals from industry and academia providing insight and recommendations in order to refine the survey. From this expert groups’ advice, it was decided to structure the survey so it would not appear as strictly an EA practices survey. This was decided because the expert group believed that many organizations may be doing EA-related activities but not calling them EA. Thus the name of the survey did not include the words “Enterprise Architecture”, but was called the SIM Information Management Practices Survey. Moreover, some practices questions used the term “Requirements Analysis and Design” (with a specific definition provided) instead of using the term “enterprise architecture”. This reflected the expert group’s determination that questions regarding requirements-related practices could serve as a surrogate for at least certain fundamental EA capabilities and practices.
Finally, to satisfy some of the objectives documented in the SIMEAWG charter, the use of EA maturity models was integrated as a foundational structure of many of the questions within the survey. A variety of EA maturity models were reviewed, with a core of four EA maturity models being used to develop and map the survey’s questions to. Additionally, the key IT and business alignment enablers and inhibitors posited by Luftman and McLean3 (2004) were integrated into the survey to reflect the importance of alignment to EA (as seen in the hub of the Enterprise Wheel) and to reflect this consistent concern of top management. The four maturity models the survey was based on were: 1) The Government Accountability Office (GAO) framework for assessing and improving EA management; 2) Carnegie Mellon’s Software Engineering Institute’s Capability Maturity Model (SEI CMM); 3) The Federal Office of Management and Budget’s (OMB) EA Assessment Framework; and 4) the MIT’s Center for Information Systems Research’s four stages of enterprise architecture (Business Silos Architecture, Standardized Technology architecture, Optimized Core architecture, and Business Modularity architecture).4
One of the goals of the working group was a final survey which would take only 10 to 15 minutes to complete. With this in mind, the questions were winnowed to a final survey 80 total

SIMEAWG’s Information Management Practices Survey 2007: Preliminary Report Page 7
questions. The questions were 5-point Likert-type scale anchored with 1 strongly disagree to 5 strongly agree, 3 being Neutral. “Don’t know” type options were provided as well.
The survey was sent out as a pilot test to the SIMEAWG in early June 2007 with the intent for this expert group to develop final recommendations and revisions to present at the second SIMEAWG meeting held in Dallas on 26-27 June 2007. At this meeting the survey instrument was further refined and the final modifications were agreed upon with the changes being implemented to the survey shortly thereafter. The final survey was comprised of 80 questions of which 14 were demographic questions. The initial launch of the survey was in September 2007 using a SIM membership mailing list. The survey was sent out entirely by e-mail with each respondent receiving a personalized e-mail with an embedded individual hyperlink with which to connect to the web server hosting the survey. Each message with embedded hyperlink was authenticated at the server, so each hyperlink could not be “used” by more than one respondent, nor could a respondent complete more than one survey.
To attempt to gain maximum participation, we followed a survey distribution method advanced by Dillman’s Mail and Internet Surveys -- The Tailored Design Method, based on the following schedule:
Initial survey sent out 4 Sep 07 1st Reminder: 17 Sep 07 2nd Reminder: 12 Oct 07 Final Reminder 30 Oct 07 To encourage accurate responses, each potential participant had an option to include an e-
mail address to receive a report of the preliminary research findings. They could then compare their organization to the entire sample and industry. A total of 2863 survey invitations were sent, with about 272 quality responses after data purification (removing responses where over 10 percent of the questions were not answered and checking response quality with reversed items and consistency checks with duplicative questions). More responses have since been collected and these will be combined and analyzed as a larger sample in the future. This response rate is consistent with other surveys of the SIM membership including the repeated surveys by Luftman and the SIM Y2K Working Group (1996, 1997, 1998, 1999).
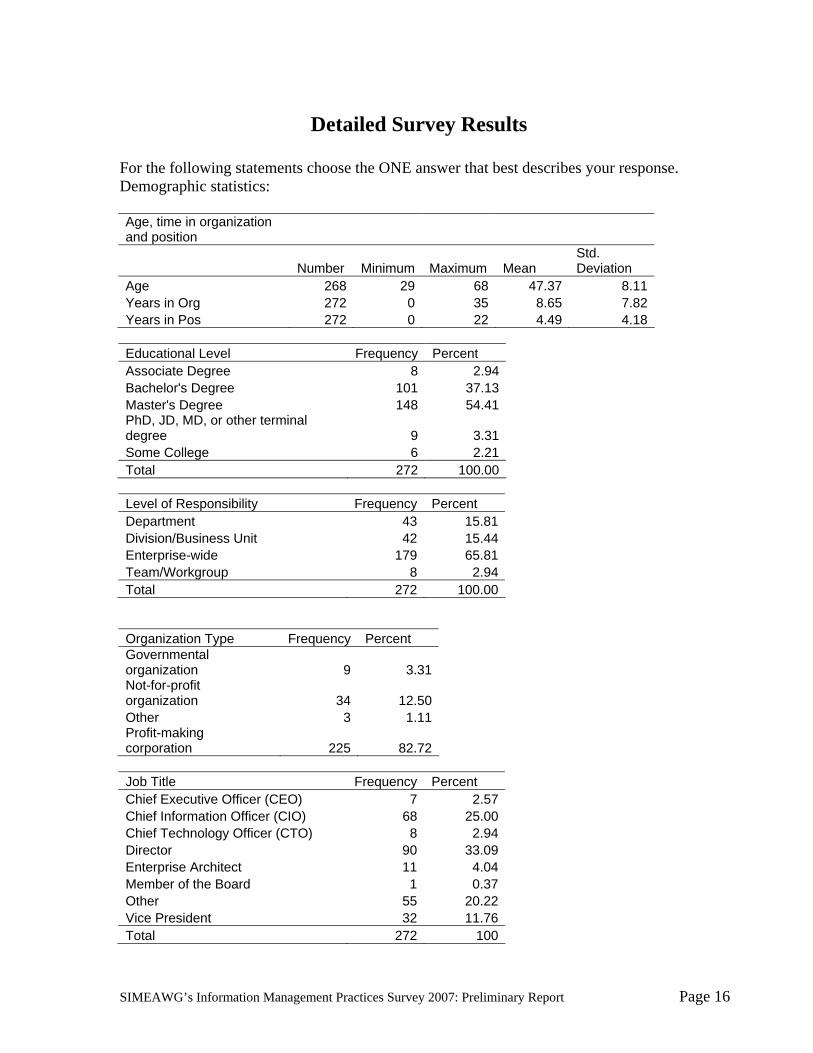
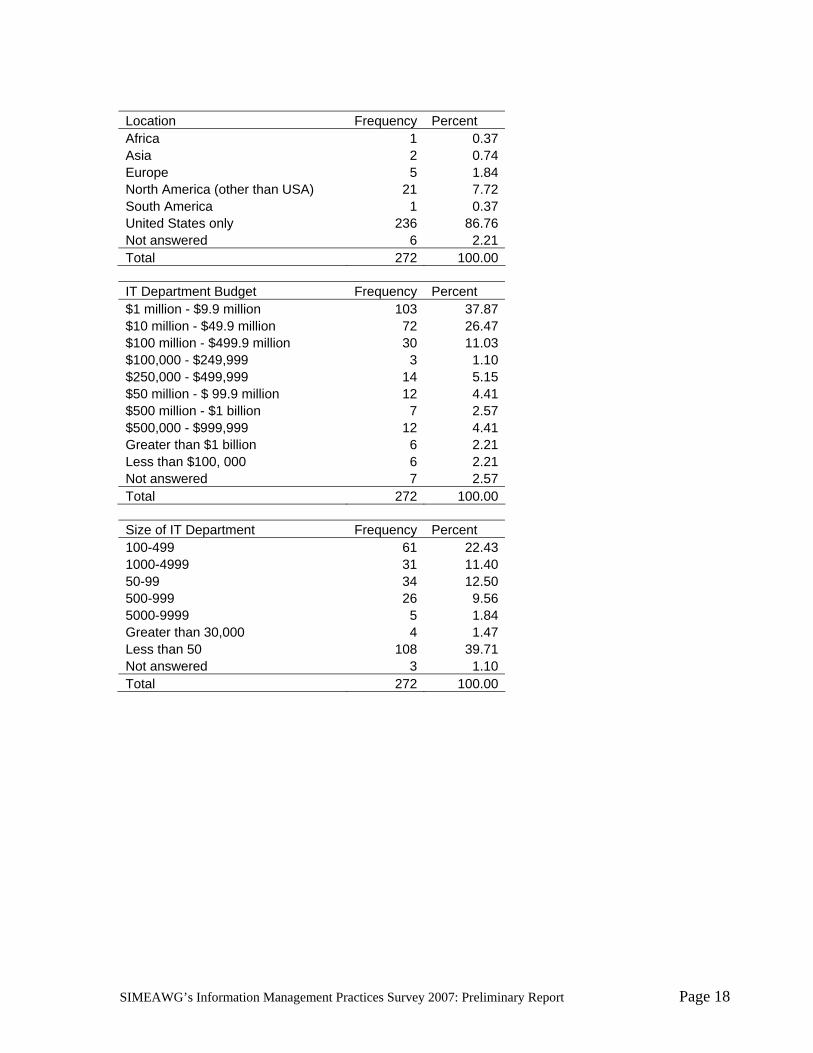
Findings In looking at the results of the demographic questions below, the average age of the respondents was about 47 with each of them having an average of 8.5 years in their organization and an average of 4.5 years in their present position. The level of responsibility of the survey respondents was at a broad level with over 80 percent reporting responsibility either at an enterprise level or a business unit/divisional level. The vast majority of respondents were with profit-oriented organizations (over 82 percent) with little representation from the governmental sector (3 percent). The job title demographic table shows the job titles of most of the respondents either being director (33 percent), chief information officer (25 percent), or some other title than what was listed (20 percent). The majority of respondents’ organizations were in the United States (236).
Initial findings of the survey provide critical insight into how IT professionals view themselves, their profession, and the state of EA practice in their organizations. Three finding stood out in our initial review of the results.
SIMEAWG’s Information Management Practices Survey 2007: Preliminary Report Page 8
0 1 2 3 4 5 6
19d
0
20
40
60
80
100
120
140
Freq
uenc
y
Mean = 4.05Std. Dev. = 0.871N = 260
0 1 2 3 4 5 6
19e
0
30
60
90
120
150
Freq
uenc
y
Mean = 4.4Std. Dev. = 0.704N = 260
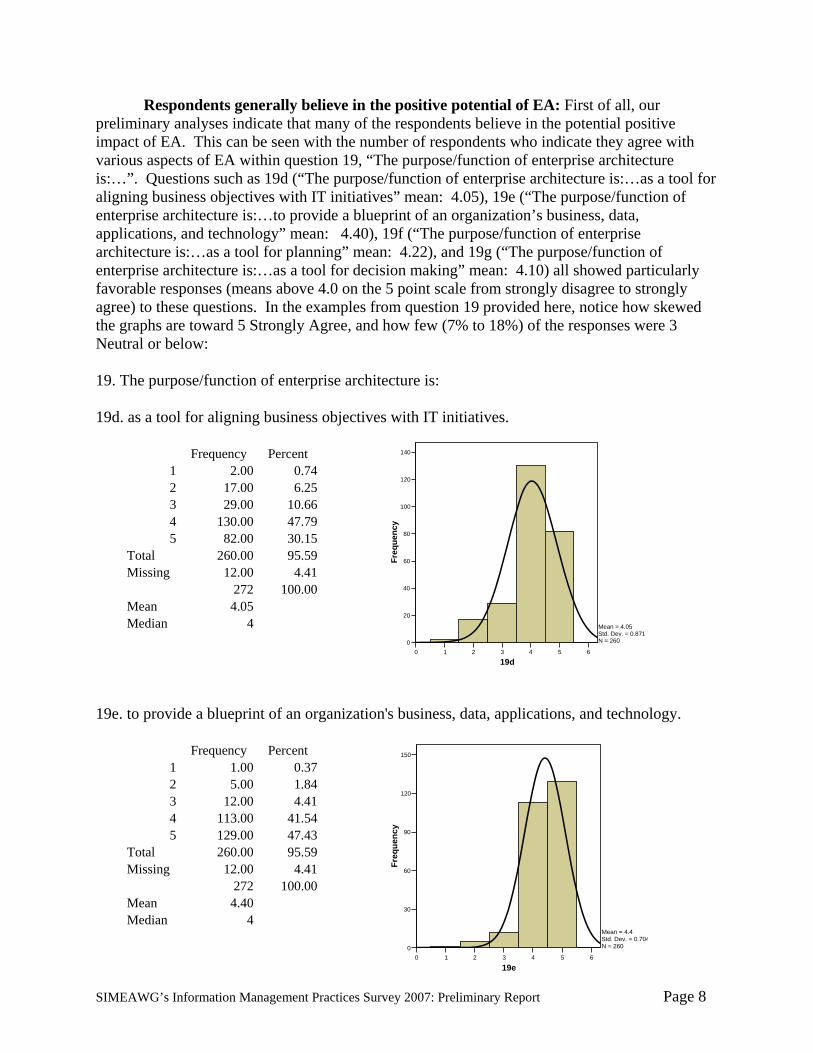
Respondents generally believe in the positive potential of EA: First of all, our preliminary analyses indicate that many of the respondents believe in the potential positive impact of EA. This can be seen with the number of respondents who indicate they agree with various aspects of EA within question 19, “The purpose/function of enterprise architecture is:…”. Questions such as 19d (“The purpose/function of enterprise architecture is:…as a tool for aligning business objectives with IT initiatives” mean: 4.05), 19e (“The purpose/function of enterprise architecture is:…to provide a blueprint of an organization’s business, data, applications, and technology” mean: 4.40), 19f (“The purpose/function of enterprise architecture is:…as a tool for planning” mean: 4.22), and 19g (“The purpose/function of enterprise architecture is:…as a tool for decision making” mean: 4.10) all showed particularly favorable responses (means above 4.0 on the 5 point scale from strongly disagree to strongly agree) to these questions. In the examples from question 19 provided here, notice how skewed the graphs are toward 5 Strongly Agree, and how few (7% to 18%) of the responses were 3 Neutral or below:
19. The purpose/function of enterprise architecture is: 19d. as a tool for aligning business objectives with IT initiatives.
Frequency Percent 1 2.00 0.74 2 17.00 6.25 3 29.00 10.66 4 130.00 47.79 5 82.00 30.15
Total 260.00 95.59 Missing 12.00 4.41 272 100.00 Mean 4.05 Median 4
19e. to provide a blueprint of an organization's business, data, applications, and technology.
Frequency Percent 1 1.00 0.37 2 5.00 1.84 3 12.00 4.41 4 113.00 41.54 5 129.00 47.43
Total 260.00 95.59 Missing 12.00 4.41 272 100.00 Mean 4.40 Median 4

SIMEAWG’s Information Management Practices Survey 2007: Preliminary Report Page 9
1 2 3 4 5 6
19f
0
50
100
150
Freq
uenc
y
Mean = 4.22Std. Dev. = 0.684N = 260
1 2 3 4 5 6
20a
0
20
40
60
80
100
120
140
Freq
uenc
y
Mean = 4.14Std. Dev. = 0.765N = 260
19f. as a tool for planning.
Frequency Percent 1 0 0 2 5.00 1.84 3 23.00 8.46 4 141.00 51.84 5 91.00 33.46
Total 260.00 95.59 Missing 12.00 4.41 272.00 100.00 Mean 4.22 Median 4
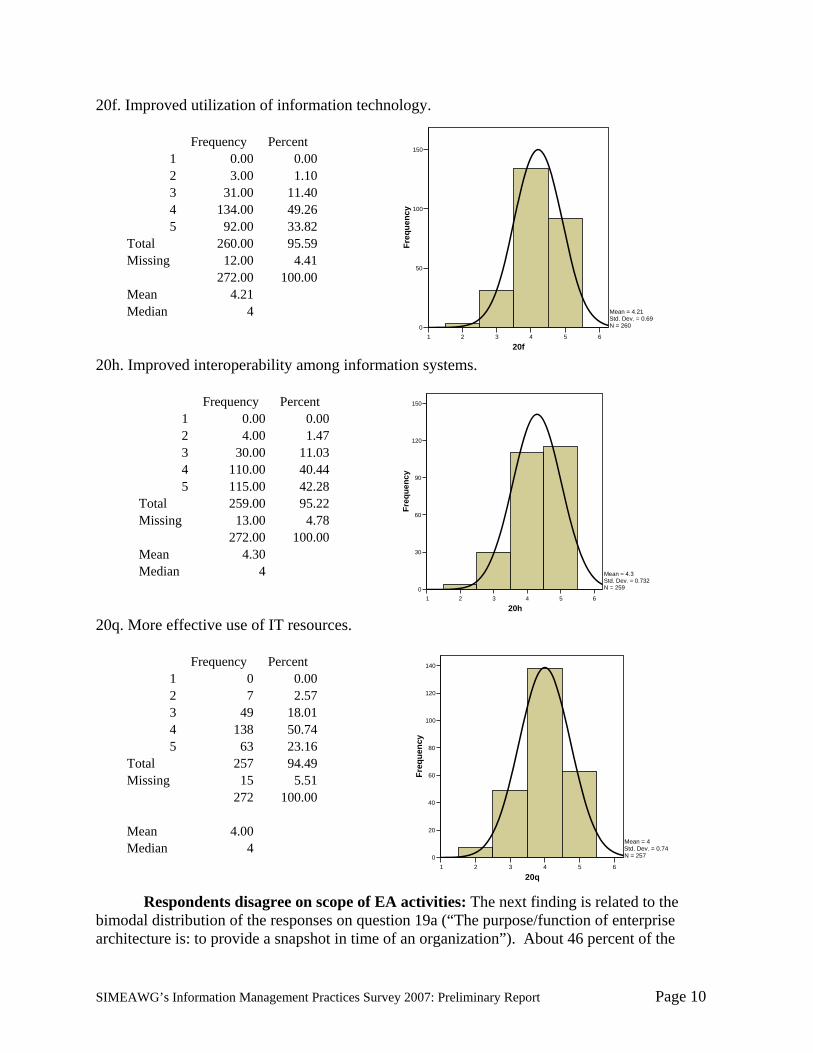
Question 20 further supports the finding that respondents perceive potential in EA. Question 20 asked respondents to select the level to which they agree or disagree that a series of statements were representative of the potential benefits to an organization from doing enterprise architecture. Of particular note are the statements where the respondents generally held beliefs in agreement with the potential benefits of EA statements such as 20a (“Aligning business objectives with information technology investments”— mean: 4.14), 20f (“Improved utilization of information technology” — mean: 4.21), 20h (“Improved interoperability among information systems” — mean: 4.3), and 20q (“More effective use of IT resources” — mean: 4.0). These responses may signify acceptance of EA as a viable organizational practices beyond the hype or ‘buzzword/trend-of-the-month’ and indicate that IT professionals really do value EA. In the examples from question 209 provided here, again notice how skewed the graphs are toward 5 Strongly Agree, and how few (12% to 21%) of the responses were 3 Neutral or below: 20. Please select the level to which you agree or disagree that each of the following statements are representative of the potential benefits to an organization from doing enterprise architecture. Potential benefits of EA: 20a. Aligning business objectives with information technology investments.
Frequency Percent 1 0 0 2 10.00 3.68 3 30.00 11.03 4 133.00 48.90 5 87.00 31.99
Total 260.00 95.59 Missing 12.00 4.41 272.00 100.00 Mean 4.14 Median 4
SIMEAWG’s Information Management Practices Survey 2007: Preliminary Report Page 10
1 2 3 4 5 6
20f
0
50
100
150
Freq
uenc
y
Mean = 4.21Std. Dev. = 0.69N = 260
1 2 3 4 5 6
20h
0
30
60
90
120
150Fr
eque
ncy
Mean = 4.3Std. Dev. = 0.732N = 259
1 2 3 4 5 6
20q
0
20
40
60
80
100
120
140
Freq
uenc
y
Mean = 4Std. Dev. = 0.74N = 257
20f. Improved utilization of information technology.
Frequency Percent 1 0.00 0.00 2 3.00 1.10 3 31.00 11.40 4 134.00 49.26 5 92.00 33.82
Total 260.00 95.59 Missing 12.00 4.41 272.00 100.00 Mean 4.21 Median 4
20h. Improved interoperability among information systems.
Frequency Percent 1 0.00 0.00 2 4.00 1.47 3 30.00 11.03 4 110.00 40.44 5 115.00 42.28
Total 259.00 95.22 Missing 13.00 4.78 272.00 100.00 Mean 4.30 Median 4
20q. More effective use of IT resources.
Frequency Percent 1 0 0.00 2 7 2.57 3 49 18.01 4 138 50.74 5 63 23.16
Total 257 94.49 Missing 15 5.51 272 100.00 Mean 4.00 Median 4
Respondents disagree on scope of EA activities: The next finding is related to the bimodal distribution of the responses on question 19a (“The purpose/function of enterprise architecture is: to provide a snapshot in time of an organization”). About 46 percent of the

SIMEAWG’s Information Management Practices Survey 2007: Preliminary Report Page 11
0 1 2 3 4 5 6
19a
0
20
40
60
80
100
120
Freq
uenc
y
Mean = 2.85Std. Dev. = 1.068N = 261
respondents disagreed or strongly disagreed with this statement (nearly 62% were either neutral or disagreed) while only about 34 percent agreed or strongly agreed. The amount of disagreement with the statement “providing a snapshot in time of an organization” is revealing since indicates that the majority of respondents do not believe that EA is about the enterprise at all. Apparently they believe that EA is only about IT. A believe that may doom their IT efforts to a persistent lack of IT-Business alignment.
Further support of this conclusion comes when comparing this result with 19e (“The
purpose/function of enterprise architecture is: to provide a blueprint of an organization’s business, data, applications, and technology”), which with nearly 88% of respondents Agreed or Strongly Agreed. This split among IS professionals as to the scope of enterprise architecture is significant. And in some ways disheartening in that it suggests that the majority of IT professionals responding to our survey only aspire to be great IT mechanics. On the other hand, a third of respondents do seem to believe that EA does hold the potential for a seat at the strategic management table and we find this encouraging. We intend to monitor this dichotomy over time. The SIMEAWG also intends to do its part to suggest the validity and opportunity of the view that EA is about the entire enterprise.
This particular finding stands out all the more since it is the only question of the survey
showing such dichotomous results among the respondents. More analyses are necessary to understand possible meanings of this finding and we intend to dig deeper into the relationships among this and other findings. Of particular interest will be so see if there are statistically significant relationships between responses to question 19a and 19e, and for example measures of maturity in EA or IS development practices, industry or respondent demographic responses, or their self-ratings on the quality of their requirement analysis and design practices. 19. The purpose/function of enterprise architecture is: 19a. to provide a snapshot in time of an organization.
Frequency Percent 1 17 6.25 2 107 39.34 3 46 16.91 4 79 29.04 5 12 4.41
Total 261 95.96 Missing 11 4.04 Total 272 100.00 Mean 2.85 Median 3

SIMEAWG’s Information Management Practices Survey 2007: Preliminary Report Page 12
0 1 2 3 4 5 6
19e
0
30
60
90
120
150
Freq
uenc
y
Mean = 4.4Std. Dev. = 0.704N = 260
19e. to provide a blueprint of an organization's business, data, applications, and technology.
Frequency Percent 1 1.00 0.37 2 5.00 1.84 3 12.00 4.41 4 113.00 41.54 5 129.00 47.43
Total 260.00 95.59 Missing 12.00 4.41 272 100.00 Mean 4.40 Median 4
Respondents rate the quality of the requirements practices poorly: The third finding is that developing IT requirements continues to be a challenge to IT professionals. The fundamental importance and difficulties of getting the requirements right has been a topic of importance among IT professionals at least since Frederick Brooks’ 1975 book The Mythical Man-Month (discussed in Chapter 2’s introduction and the EA Maturity Models article). Getting requirements right is most notably identified with Brooks’ contention that requirements are the essence of what IT professionals do, all the rest being accident or risk management.
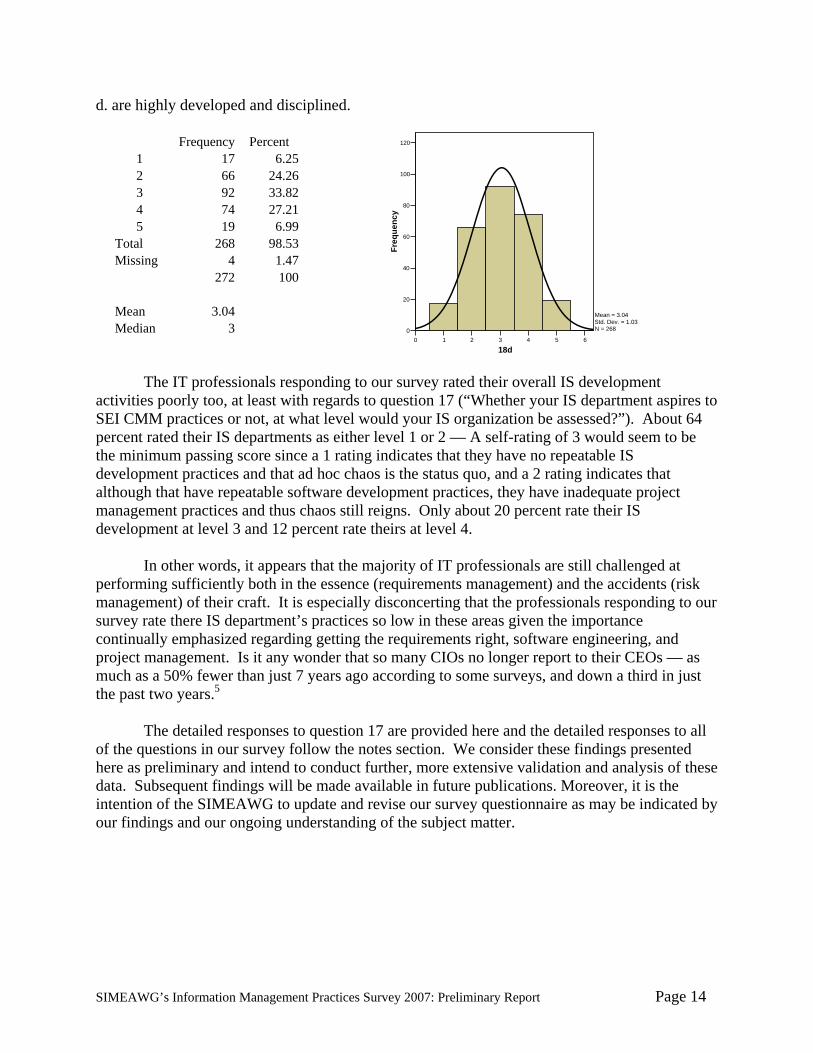
Question 18 asks about various aspects of their “requirements analysis and design (RA&D) efforts and activities” using the definition that “the purpose of … RA&D is to describe a functional process or a product/service in order to achieve enterprise objectives.” The means on the same 1 to 5 scale, from strongly disagree to strongly agree as used on the other questions, were only 3.06 for 18a My organization's RA&D activities “are measured”, only 2.34 for 18b “are benchmarked to other organizations”, and 3.04 for 18d “are highly developed and disciplined” — all basically failing self-reported grades. On a more positive note, question 18c “are aligned with the organization's objectives” had a mean response of 3.92.
These generally low scores do suggest some fundamental weaknesses in these critically important requirements activities and skills of IT professionals and perhaps suggest the need for some professional “soul searching” among IT academics and IT management leadership as to whether this is acceptable and if not what can be done about it. Details and graphs of these responses to these questions are provided here:

SIMEAWG’s Information Management Practices Survey 2007: Preliminary Report Page 13
0 1 2 3 4 5 6
18a
0
20
40
60
80
100
120
Freq
uenc
y
Mean = 3.06Std. Dev. = 1.053N = 267
0 1 2 3 4 5 6
18b
0
20
40
60
80
100
120
140
Freq
uenc
y
Mean = 2.34Std. Dev. = 0.974N = 264
0 1 2 3 4 5 6
18c
0
30
60
90
120
150
Freq
uenc
y
Mean = 3.91Std. Dev. = 0.824N = 269
18. My organization's requirements analysis and design (RA&D): _______________ a. are measured.
b. are benchmarked to other organizations.
Frequency Percent 1 43 15.81 2 130 47.79 3 57 20.96 4 25 9.19 5 9 3.31
Total 264 97.06 Missing 8 2.94 272 100 Mean 2.34 Median 2
c. are aligned with the organization's objectives.
Frequency Percent 1 4 1.47 2 11 4.04 3 47 17.28 4 150 55.15 5 57 20.96
Total 269 98.9 Missing 3 1.1 272 100 Mean 3.91 Median 4
Frequency Percent 1 16 5.88 2 77 28.31 3 64 23.53 4 95 34.93 5 15 5.51
Total 267 98.16 Missing 5 1.84 272 100 Mean 3.06 Median 3
SIMEAWG’s Information Management Practices Survey 2007: Preliminary Report Page 14
0 1 2 3 4 5 6
18d
0
20
40
60
80
100
120
Freq
uenc
y
Mean = 3.04Std. Dev. = 1.03N = 268
d. are highly developed and disciplined.
Frequency Percent 1 17 6.25 2 66 24.26 3 92 33.82 4 74 27.21 5 19 6.99
Total 268 98.53 Missing 4 1.47 272 100 Mean 3.04 Median 3
The IT professionals responding to our survey rated their overall IS development
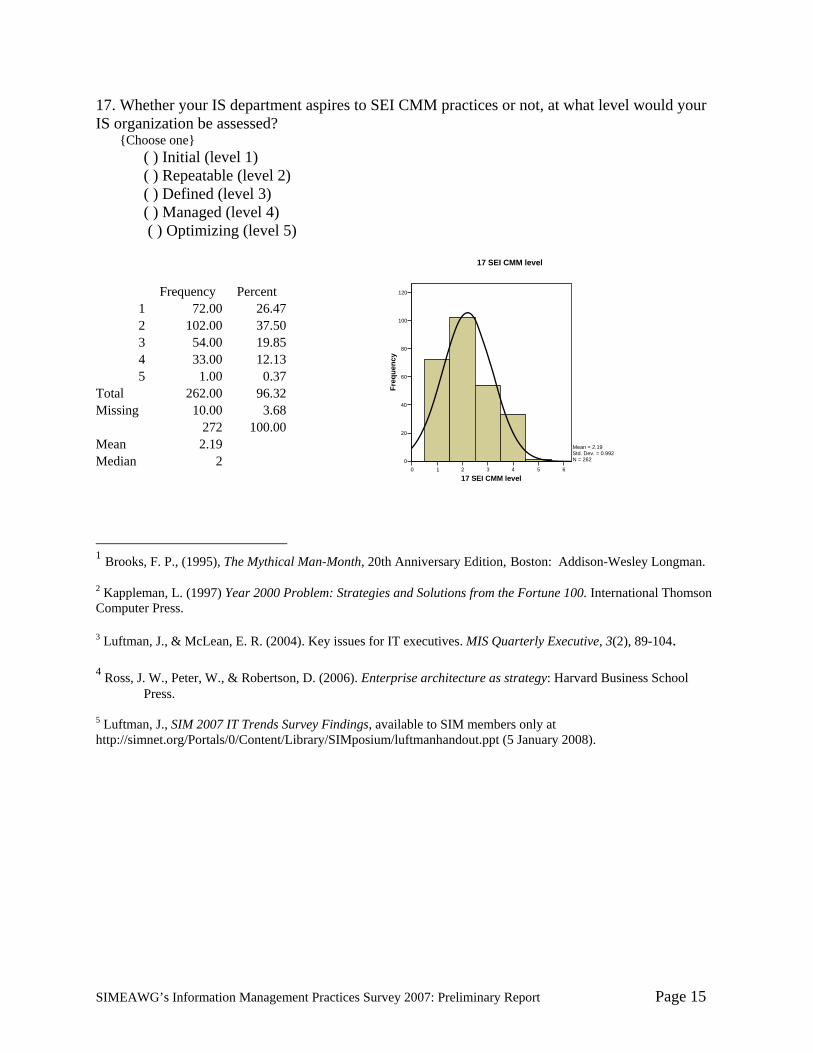
activities poorly too, at least with regards to question 17 (“Whether your IS department aspires to SEI CMM practices or not, at what level would your IS organization be assessed?”). About 64 percent rated their IS departments as either level 1 or 2 — A self-rating of 3 would seem to be the minimum passing score since a 1 rating indicates that they have no repeatable IS development practices and that ad hoc chaos is the status quo, and a 2 rating indicates that although that have repeatable software development practices, they have inadequate project management practices and thus chaos still reigns. Only about 20 percent rate their IS development at level 3 and 12 percent rate theirs at level 4.
In other words, it appears that the majority of IT professionals are still challenged at
performing sufficiently both in the essence (requirements management) and the accidents (risk management) of their craft. It is especially disconcerting that the professionals responding to our survey rate there IS department’s practices so low in these areas given the importance continually emphasized regarding getting the requirements right, software engineering, and project management. Is it any wonder that so many CIOs no longer report to their CEOs — as much as a 50% fewer than just 7 years ago according to some surveys, and down a third in just the past two years.5
The detailed responses to question 17 are provided here and the detailed responses to all
of the questions in our survey follow the notes section. We consider these findings presented here as preliminary and intend to conduct further, more extensive validation and analysis of these data. Subsequent findings will be made available in future publications. Moreover, it is the intention of the SIMEAWG to update and revise our survey questionnaire as may be indicated by our findings and our ongoing understanding of the subject matter.
SIMEAWG’s Information Management Practices Survey 2007: Preliminary Report Page 15
0 1 2 3 4 5 6
17 SEI CMM level
0
20
40
60
80
100
120
Freq
uenc
y
Mean = 2.19Std. Dev. = 0.992N = 262
17 SEI CMM level
17. Whether your IS department aspires to SEI CMM practices or not, at what level would your IS organization be assessed?
{Choose one} ( ) Initial (level 1) ( ) Repeatable (level 2) ( ) Defined (level 3) ( ) Managed (level 4) ( ) Optimizing (level 5)
1 Brooks, F. P., (1995), The Mythical Man-Month, 20th Anniversary Edition, Boston: Addison-Wesley Longman. 2 Kappleman, L. (1997) Year 2000 Problem: Strategies and Solutions from the Fortune 100. International Thomson Computer Press. 3 Luftman, J., & McLean, E. R. (2004). Key issues for IT executives. MIS Quarterly Executive, 3(2), 89-104.
4 Ross, J. W., Peter, W., & Robertson, D. (2006). Enterprise architecture as strategy: Harvard Business School Press.
5 Luftman, J., SIM 2007 IT Trends Survey Findings, available to SIM members only at http://simnet.org/Portals/0/Content/Library/SIMposium/luftmanhandout.ppt (5 January 2008).
Frequency Percent 1 72.00 26.47 2 102.00 37.50 3 54.00 19.85 4 33.00 12.13 5 1.00 0.37
Total 262.00 96.32 Missing 10.00 3.68 272 100.00 Mean 2.19 Median 2
SIMEAWG’s Information Management Practices Survey 2007: Preliminary Report Page 16
Detailed Survey Results For the following statements choose the ONE answer that best describes your response. Demographic statistics: Age, time in organization and position
Number Minimum Maximum Mean Std. Deviation
Age 268 29 68 47.37 8.11 Years in Org 272 0 35 8.65 7.82 Years in Pos 272 0 22 4.49 4.18
Educational Level Frequency Percent Associate Degree 8 2.94Bachelor's Degree 101 37.13Master's Degree 148 54.41PhD, JD, MD, or other terminal degree 9 3.31Some College 6 2.21Total 272 100.00
Level of Responsibility Frequency Percent Department 43 15.81Division/Business Unit 42 15.44Enterprise-wide 179 65.81Team/Workgroup 8 2.94Total 272 100.00
Organization Type Frequency Percent Governmental organization 9 3.31Not-for-profit organization 34 12.50Other 3 1.11Profit-making corporation 225 82.72
Job Title Frequency Percent Chief Executive Officer (CEO) 7 2.57Chief Information Officer (CIO) 68 25.00Chief Technology Officer (CTO) 8 2.94Director 90 33.09Enterprise Architect 11 4.04Member of the Board 1 0.37Other 55 20.22Vice President 32 11.76Total 272 100
SIMEAWG’s Information Management Practices Survey 2007: Preliminary Report Page 17
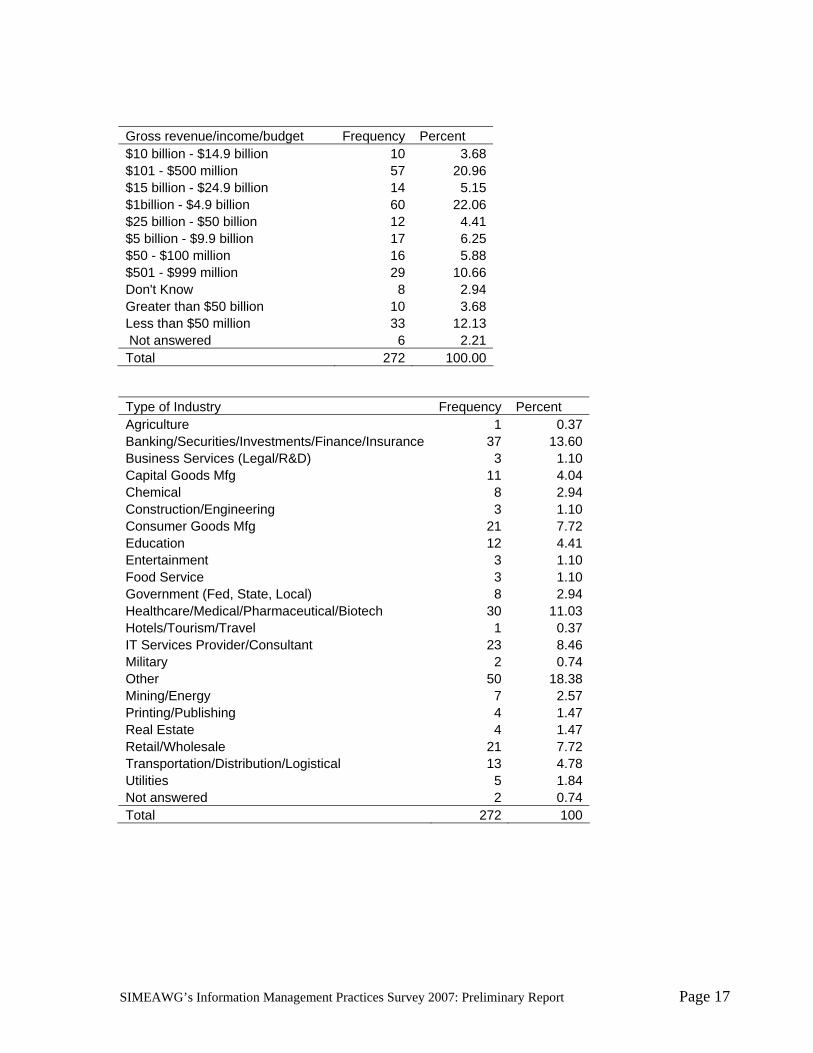
Gross revenue/income/budget Frequency Percent $10 billion - $14.9 billion 10 3.68$101 - $500 million 57 20.96$15 billion - $24.9 billion 14 5.15$1billion - $4.9 billion 60 22.06$25 billion - $50 billion 12 4.41$5 billion - $9.9 billion 17 6.25$50 - $100 million 16 5.88$501 - $999 million 29 10.66Don't Know 8 2.94Greater than $50 billion 10 3.68Less than $50 million 33 12.13 Not answered 6 2.21Total 272 100.00
Type of Industry Frequency Percent Agriculture 1 0.37 Banking/Securities/Investments/Finance/Insurance 37 13.60 Business Services (Legal/R&D) 3 1.10 Capital Goods Mfg 11 4.04 Chemical 8 2.94 Construction/Engineering 3 1.10 Consumer Goods Mfg 21 7.72 Education 12 4.41 Entertainment 3 1.10 Food Service 3 1.10 Government (Fed, State, Local) 8 2.94 Healthcare/Medical/Pharmaceutical/Biotech 30 11.03 Hotels/Tourism/Travel 1 0.37 IT Services Provider/Consultant 23 8.46 Military 2 0.74 Other 50 18.38 Mining/Energy 7 2.57 Printing/Publishing 4 1.47 Real Estate 4 1.47 Retail/Wholesale 21 7.72 Transportation/Distribution/Logistical 13 4.78 Utilities 5 1.84 Not answered 2 0.74 Total 272 100
SIMEAWG’s Information Management Practices Survey 2007: Preliminary Report Page 18
Location Frequency Percent Africa 1 0.37Asia 2 0.74Europe 5 1.84North America (other than USA) 21 7.72South America 1 0.37United States only 236 86.76Not answered 6 2.21Total 272 100.00
IT Department Budget Frequency Percent $1 million - $9.9 million 103 37.87$10 million - $49.9 million 72 26.47$100 million - $499.9 million 30 11.03$100,000 - $249,999 3 1.10$250,000 - $499,999 14 5.15$50 million - $ 99.9 million 12 4.41$500 million - $1 billion 7 2.57$500,000 - $999,999 12 4.41Greater than $1 billion 6 2.21Less than $100, 000 6 2.21Not answered 7 2.57Total 272 100.00
Size of IT Department Frequency Percent 100-499 61 22.431000-4999 31 11.4050-99 34 12.50500-999 26 9.565000-9999 5 1.84Greater than 30,000 4 1.47Less than 50 108 39.71Not answered 3 1.10Total 272 100.00

SIMEAWG’s Information Management Practices Survey 2007: Preliminary Report Page 19
0 1 2 3 4 5 6
15a
0
20
40
60
80
100
120
Freq
uenc
y
Mean = 3.84Std. Dev. = 1.085N = 272
0 1 2 3 4 5 6
15b
0
20
40
60
80
100
120
Freq
uenc
y
Mean = 3.4Std. Dev. = 1.043N = 268
0 1 2 3 4 5 6
15c
0
20
40
60
80
100
120
Freq
uenc
y
Mean = 3.58Std. Dev. = 1.024N = 272
15. For software development and/or maintenance, our IS department specifies and uses a comprehensive set of processes and/or procedures for: 15a. Establishing customer agreement on requirements:
15b. Identifying the training needs of IS professionals
15c. Establishing quality goals with customers
Frequency Percent 1 8.00 2.94 2 34.00 12.50 3 35.00 12.87 4 112.00 41.18 5 83.00 30.51
Total 272.00 100.00 Missing 0.00 0.00 Mean 3.84 Median 4
Frequency Percent 1 4.00 1.47 2 64.00 23.53 3 57.00 20.96 4 106.00 38.97 5 37.00 13.60
Total 268.00 98.53 Missing 4.00 1.47 272 100.00 Mean 3.40 Median 4
Frequency Percent 1 6.00 2.21 2 41.00 15.07 3 65.00 23.90 4 110.00 40.44 5 50.00 18.38
Total 272.00 100.00 Missing 0 0 272 100.00 Mean 3.58 Median 4

SIMEAWG’s Information Management Practices Survey 2007: Preliminary Report Page 20
0 1 2 3 4 5 6
15d
0
20
40
60
80
100
120
140
Freq
uenc
y
Mean = 3.71Std. Dev. = 0.964N = 272
1 2 3 4 5 6
15e
0
20
40
60
80
100
120
140Fr
eque
ncy
Mean = 3.88Std. Dev. = 0.884N = 271
0 1 2 3 4 5 6
15f
0
20
40
60
80
100
120
Freq
uenc
y
Mean = 3.7Std. Dev. = 0.989N = 267
15d. Estimating all resource needs
15e. Tracking progress and resource use
15f. Software quality assurance Frequency Percent
1 4.00 1.47 2 32.00 11.76 3 63.00 23.16 4 110.00 40.44 5 58.00 21.32
Total 267.00 98.16 Missing 5.00 1.84 272 100.00 Mean 3.70 Median 4
Frequency Percent 1 2.00 0.74 2 39.00 14.34 3 47.00 17.28 4 131.00 48.16 5 53.00 19.49
Total 272.00 100.00 Missing 0 0 272 100.00 Mean 3.71 Median 4
Frequency Percent 1 0.00 0.00 2 27.00 9.93 3 43.00 15.81 4 137.00 50.37 5 64.00 23.53
Total 271.00 99.63 Missing 1.00 0.37 272.00 100.00 Mean 3.88 Median 4
SIMEAWG’s Information Management Practices Survey 2007: Preliminary Report Page 21
0 1 2 3 4 5 6
15g
0
20
40
60
80
100
120
Freq
uenc
y
Mean = 3.52Std. Dev. = 1.038N = 267
0 1 2 3 4 5 6
15h
0
20
40
60
80
100
120
140Fr
eque
ncy
Mean = 3.87Std. Dev. = 0.935N = 270
0 1 2 3 4 5 6
15i
0
20
40
60
80
100
120
Freq
uenc
y
Mean = 3.84Std. Dev. = 1.038N = 266
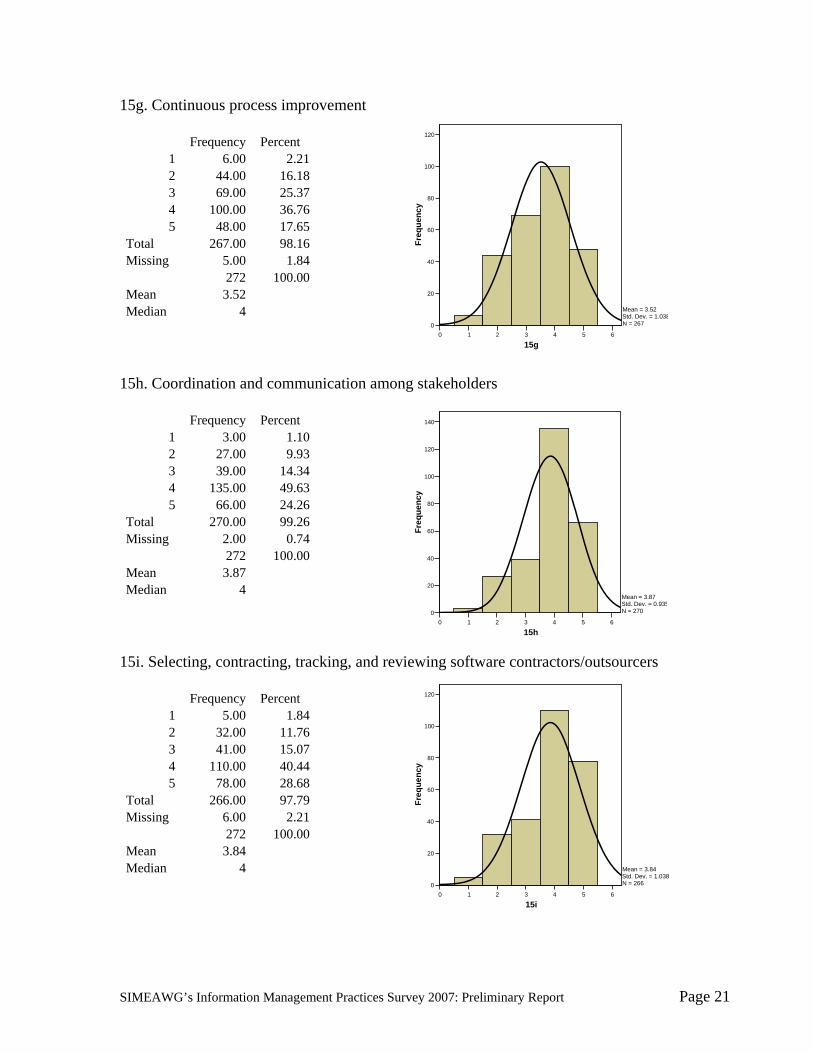
15g. Continuous process improvement
15h. Coordination and communication among stakeholders Frequency Percent
1 3.00 1.10 2 27.00 9.93 3 39.00 14.34 4 135.00 49.63 5 66.00 24.26
Total 270.00 99.26 Missing 2.00 0.74 272 100.00 Mean 3.87 Median 4
15i. Selecting, contracting, tracking, and reviewing software contractors/outsourcers Frequency Percent
1 5.00 1.84 2 32.00 11.76 3 41.00 15.07 4 110.00 40.44 5 78.00 28.68
Total 266.00 97.79 Missing 6.00 2.21 272 100.00 Mean 3.84 Median 4
Frequency Percent 1 6.00 2.21 2 44.00 16.18 3 69.00 25.37 4 100.00 36.76 5 48.00 17.65
Total 267.00 98.16 Missing 5.00 1.84 272 100.00 Mean 3.52 Median 4

SIMEAWG’s Information Management Practices Survey 2007: Preliminary Report Page 22
0 1 2 3 4 5 6
15l
0
20
40
60
80
100
120
Freq
uenc
y
Mean = 3.46Std. Dev. = 0.949N = 268
1 2 3 4 5 6
15k
0
20
40
60
80
100
120Fr
eque
ncy
Mean = 3.71Std. Dev. = 0.915N = 264
0 1 2 3 4 5 6
15j
0
20
40
60
80
100
120
Freq
uenc
y
Mean = 3.74Std. Dev. = 0.964N = 268
15j. Analyzing problems and preventing re-occurrence Frequency Percent
1 5.00 1.84 2 26.00 9.56 3 61.00 22.43 4 119.00 43.75 5 57.00 20.96
Total 268.00 98.53 Missing 4.00 1.47 272 100.00 Mean 3.74 Median 4
15k. Tailoring the process to project specific needs
15l. Continuous productivity improvements
Frequency Percent 1 0.00 0.00 2 32.00 11.76 3 63.00 23.16 4 118.00 43.38 5 51.00 18.75
Total 264.00 97.06 Missing 8.00 2.94 272.00 100.00 Mean 3.71 Median 4
Frequency Percent 1 4.00 1.47 2 41.00 15.07 3 85.00 31.25 4 104.00 38.24 5 34.00 12.50
Total 268.00 98.53 Missing 4.00 1.47 272 100.00 Mean 3.46 Median 4

SIMEAWG’s Information Management Practices Survey 2007: Preliminary Report Page 23
0 1 2 3 4 5 6
17 SEI CMM level
0
20
40
60
80
100
120
Freq
uenc
y
Mean = 2.19Std. Dev. = 0.992N = 262
17 SEI CMM level
16. This IS department aspires to the software development practices of the Software Engineering Institute's (SEI's) Capability Maturity Model for software development:
Frequency Percent
1 24.00 8.82 2 88.00 32.35 3 67.00 24.63 4 44.00 16.18 5 17.00 6.25
Total 240.00 88.24 Missing 32.00 11.76 272 100.00 Mean 2.76 Median 3
17. Whether your IS department aspires to SEI CMM practices or not, at what level would your IS organization be assessed?
{Choose one} ( ) Initial (level 1) ( ) Repeatable (level 2) ( ) Defined (level 3) ( ) Managed (level 4) ( ) Optimizing (level 5)
Frequency Percent 1 72.00 26.47 2 102.00 37.50 3 54.00 19.85 4 33.00 12.13 5 1.00 0.37
Total 262.00 96.32 Missing 10.00 3.68 272 100.00 Mean 2.19 Median 2

SIMEAWG’s Information Management Practices Survey 2007: Preliminary Report Page 24
0 1 2 3 4 5 6
18a
0
20
40
60
80
100
120
Freq
uenc
y
Mean = 3.06Std. Dev. = 1.053N = 267
0 1 2 3 4 5 6
18b
0
20
40
60
80
100
120
140
Freq
uenc
y
Mean = 2.34Std. Dev. = 0.974N = 264
18. Please select the level to which you agree or disagree that each of the following statements are representative of the requirements analysis and design practices in your IT organization. The purpose of requirements analysis and design (RA&D) is to describe a functional process or a product/service in order to achieve enterprise objectives. My organization's requirements analysis and design (RA&D) efforts and activities: _______________ a. are measured.
b. are benchmarked to other organizations.
Frequency Percent 1 43 15.81 2 130 47.79 3 57 20.96 4 25 9.19 5 9 3.31
Total 264 97.06 Missing 8 2.94 272 100 Mean 2.34 Median 2
Frequency Percent 1 16 5.88 2 77 28.31 3 64 23.53 4 95 34.93 5 15 5.51
Total 267 98.16 Missing 5 1.84 272 100 Mean 3.06 Median 3

SIMEAWG’s Information Management Practices Survey 2007: Preliminary Report Page 25
0 1 2 3 4 5 6
18c
0
30
60
90
120
150
Freq
uenc
y
Mean = 3.91Std. Dev. = 0.824N = 269
0 1 2 3 4 5 6
18d
0
20
40
60
80
100
120Fr
eque
ncy
Mean = 3.04Std. Dev. = 1.03N = 268
0 1 2 3 4 5 6
18e
0
20
40
60
80
100
120
Freq
uenc
y
Mean = 3.39Std. Dev. = 1.039N = 267
c. are aligned with the organization's objectives.
Frequency Percent 1 4 1.47 2 11 4.04 3 47 17.28 4 150 55.15 5 57 20.96
Total 269 98.9 Missing 3 1.1 272 100 Mean 3.91 Median 4
d. are highly developed and disciplined.
Frequency Percent 1 17 6.25 2 66 24.26 3 92 33.82 4 74 27.21 5 19 6.99
Total 268 98.53 Missing 4 1.47 272 100 Mean 3.04 Median 3
e. are valued by executive leadership.
Frequency Percent 1 9 3.31 2 53 19.49 3 63 23.16 4 110 40.44 5 32 11.76
Total 267 98.16 Missing 5 1.84 272 100 Mean 3.39 Median 4
SIMEAWG’s Information Management Practices Survey 2007: Preliminary Report Page 26
0 1 2 3 4 5 6
18f
0
25
50
75
100
125
Freq
uenc
y
Mean = 3.61Std. Dev. = 0.996N = 267
0 1 2 3 4 5 6
18g
0
20
40
60
80
100
120
Freq
uenc
y
Mean = 3.25Std. Dev. = 1.025N = 268
0 1 2 3 4 5 6
18h
0
20
40
60
80
100
120
140
Freq
uenc
y
Mean = 3.54Std. Dev. = 0.816N = 260
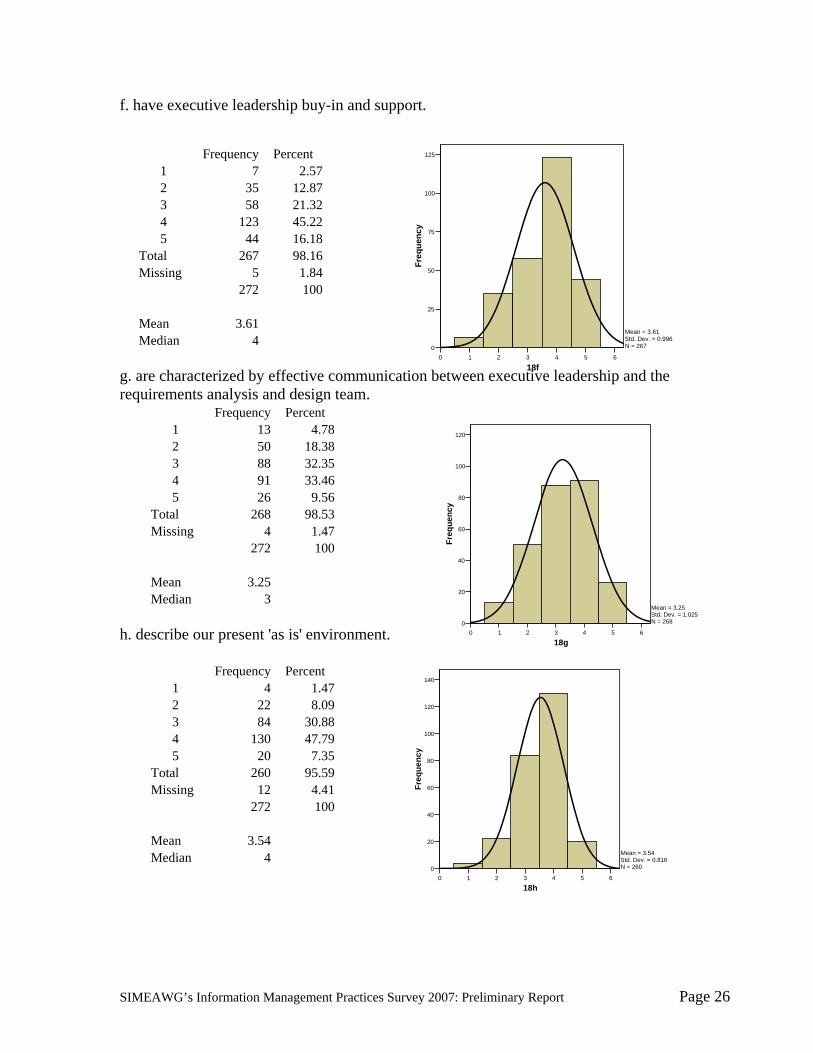
f. have executive leadership buy-in and support.
Frequency Percent 1 7 2.57 2 35 12.87 3 58 21.32 4 123 45.22 5 44 16.18
Total 267 98.16 Missing 5 1.84 272 100 Mean 3.61 Median 4
g. are characterized by effective communication between executive leadership and the requirements analysis and design team.
Frequency Percent 1 13 4.78 2 50 18.38 3 88 32.35 4 91 33.46 5 26 9.56
Total 268 98.53 Missing 4 1.47 272 100 Mean 3.25 Median 3
h. describe our present 'as is' environment.
Frequency Percent 1 4 1.47 2 22 8.09 3 84 30.88 4 130 47.79 5 20 7.35
Total 260 95.59 Missing 12 4.41 272 100 Mean 3.54 Median 4

SIMEAWG’s Information Management Practices Survey 2007: Preliminary Report Page 27
0 1 2 3 4 5 6
18i
0
20
40
60
80
100
120
140
Freq
uenc
y
Mean = 3.63Std. Dev. = 0.897N = 263
0 1 2 3 4 5 6
18j
0
20
40
60
80
100
120
140Fr
eque
ncy
Mean = 2.46Std. Dev. = 0.906N = 263
0 1 2 3 4 5 6
18k
0
20
40
60
80
100
Freq
uenc
y
Mean = 3.05Std. Dev. = 1.058N = 265
i. describe our "to be" or desired environment.
Frequency Percent 1 5 1.84 2 26 9.56 3 63 23.16 4 135 49.63 5 34 12.5
Total 263 96.69 Missing 9 3.31 272 100 Mean 3.63 Median 4
j. efforts stifle innovation in our organization.
k. are viewed strictly as an IT initiative.
Frequency Percent 1 28 10.29 2 128 47.06 3 72 26.47 4 29 10.66 5 6 2.21
Total 263 96.69 Missing 9 3.31 272 100 Mean 2.46 Median 2
Frequency Percent 1 10 3.68 2 88 32.35 3 71 26.1 4 72 26.47 5 24 8.82
Total 265 97.43 Missing 7 2.57 272 100 Mean 3.05 Median 3
SIMEAWG’s Information Management Practices Survey 2007: Preliminary Report Page 28
0 1 2 3 4 5 6
18l
0
30
60
90
120
150
Freq
uenc
y
Mean = 3.63Std. Dev. = 0.807N = 265
0 1 2 3 4 5 6
18m
0
50
100
150
Freq
uenc
y
Mean = 3.81Std. Dev. = 0.802N = 266
1 2 3 4 5 6
18n
0
30
60
90
120
150
Freq
uenc
y
Mean = 4.19Std. Dev. = 0.755N = 266
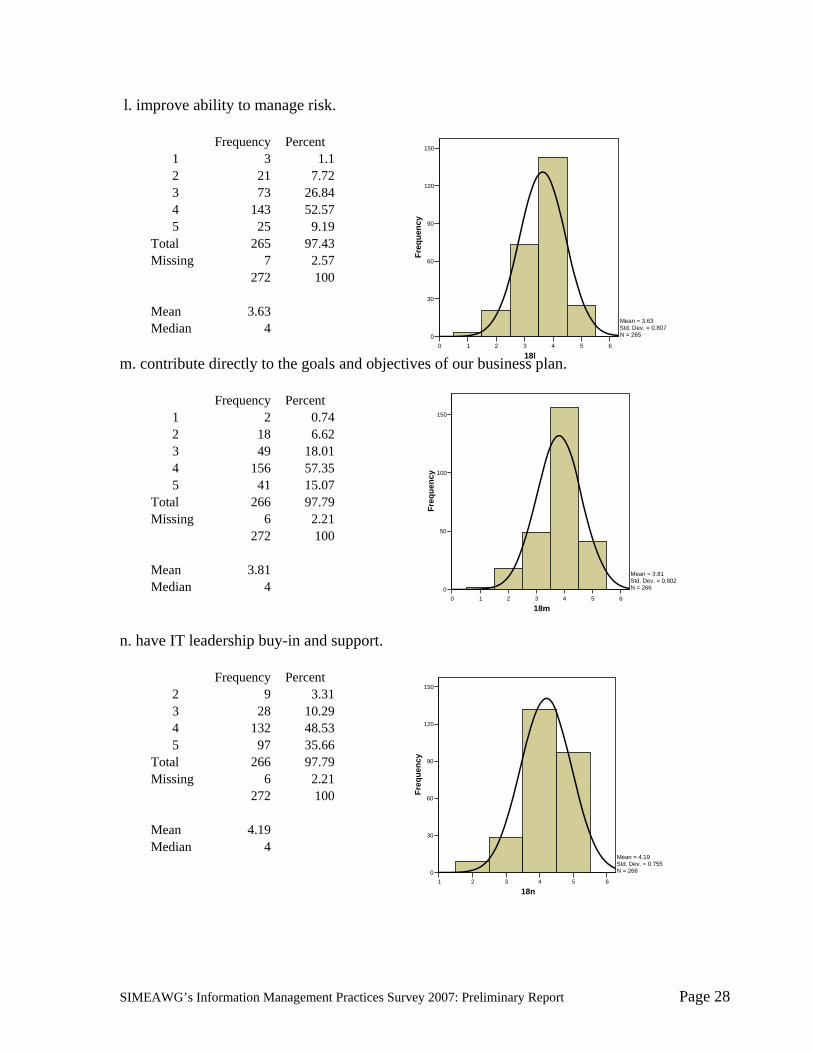
l. improve ability to manage risk.
Frequency Percent 1 3 1.1 2 21 7.72 3 73 26.84 4 143 52.57 5 25 9.19
Total 265 97.43 Missing 7 2.57 272 100 Mean 3.63 Median 4
m. contribute directly to the goals and objectives of our business plan.
Frequency Percent 1 2 0.74 2 18 6.62 3 49 18.01 4 156 57.35 5 41 15.07
Total 266 97.79 Missing 6 2.21 272 100 Mean 3.81 Median 4
n. have IT leadership buy-in and support.
Frequency Percent 2 9 3.31 3 28 10.29 4 132 48.53 5 97 35.66
Total 266 97.79 Missing 6 2.21 272 100 Mean 4.19 Median 4
SIMEAWG’s Information Management Practices Survey 2007: Preliminary Report Page 29
0 1 2 3 4 5 6
18o
0
20
40
60
80
100
120
Freq
uenc
y
Mean = 3.33Std. Dev. = 1.015N = 266
0 1 2 3 4 5 6
19a
0
20
40
60
80
100
120
Freq
uenc
y
Mean = 2.85Std. Dev. = 1.068N = 261
0 1 2 3 4 5 6
19b
0
50
100
150
200
Freq
uenc
y
Mean = 3.97Std. Dev. = 0.731N = 261
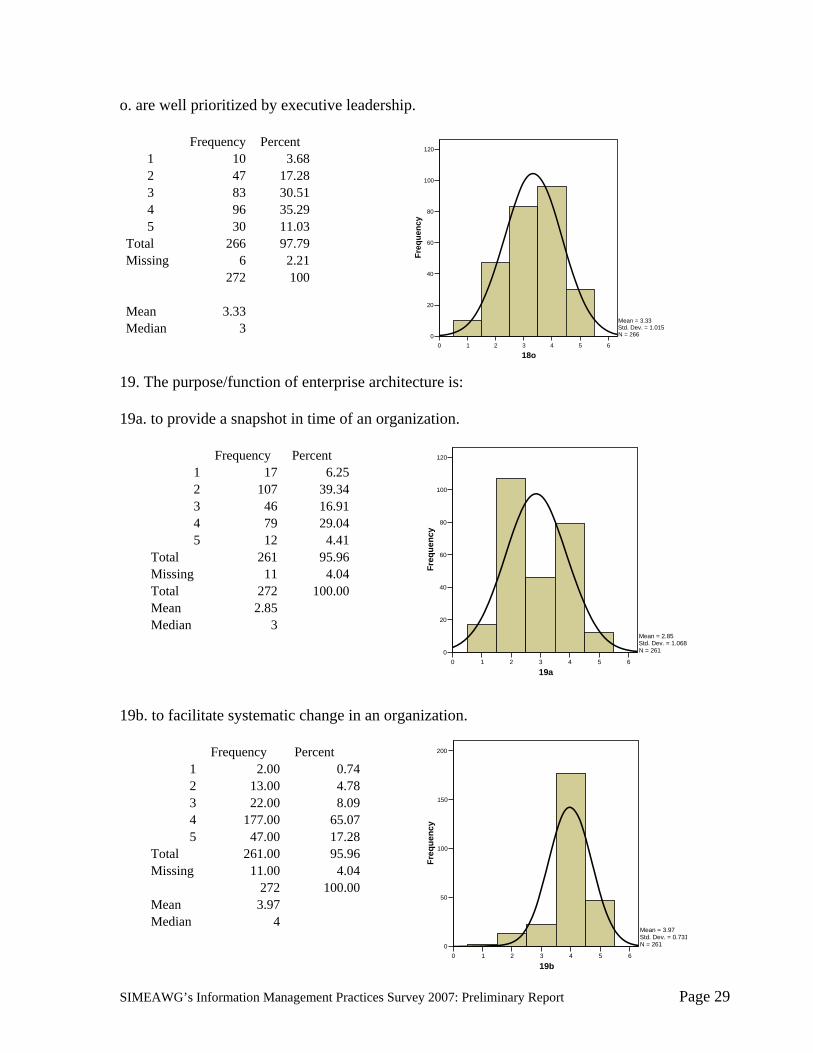
o. are well prioritized by executive leadership. Frequency Percent
1 10 3.68 2 47 17.28 3 83 30.51 4 96 35.29 5 30 11.03
Total 266 97.79 Missing 6 2.21 272 100 Mean 3.33 Median 3
19. The purpose/function of enterprise architecture is: 19a. to provide a snapshot in time of an organization.
Frequency Percent 1 17 6.25 2 107 39.34 3 46 16.91 4 79 29.04 5 12 4.41
Total 261 95.96 Missing 11 4.04 Total 272 100.00 Mean 2.85 Median 3
19b. to facilitate systematic change in an organization.
Frequency Percent 1 2.00 0.74 2 13.00 4.78 3 22.00 8.09 4 177.00 65.07 5 47.00 17.28
Total 261.00 95.96 Missing 11.00 4.04 272 100.00 Mean 3.97 Median 4
SIMEAWG’s Information Management Practices Survey 2007: Preliminary Report Page 30
0 1 2 3 4 5 6
19c
0
25
50
75
100
125
Freq
uenc
y
Mean = 3.65Std. Dev. = 0.907N = 260
0 1 2 3 4 5 6
19d
0
20
40
60
80
100
120
140
Freq
uenc
y
Mean = 4.05Std. Dev. = 0.871N = 260
0 1 2 3 4 5 6
19e
0
30
60
90
120
150
Freq
uenc
y
Mean = 4.4Std. Dev. = 0.704N = 260
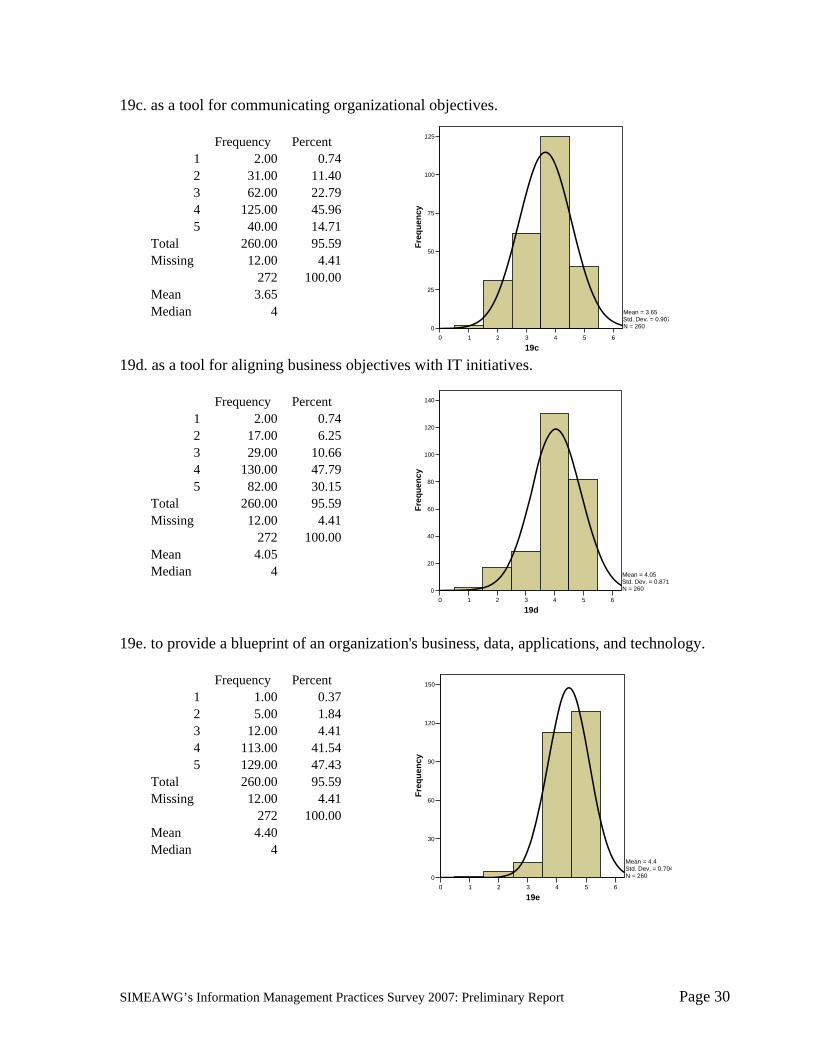
19c. as a tool for communicating organizational objectives.
Frequency Percent 1 2.00 0.74 2 31.00 11.40 3 62.00 22.79 4 125.00 45.96 5 40.00 14.71
Total 260.00 95.59 Missing 12.00 4.41 272 100.00 Mean 3.65 Median 4
19d. as a tool for aligning business objectives with IT initiatives.
Frequency Percent 1 2.00 0.74 2 17.00 6.25 3 29.00 10.66 4 130.00 47.79 5 82.00 30.15
Total 260.00 95.59 Missing 12.00 4.41 272 100.00 Mean 4.05 Median 4
19e. to provide a blueprint of an organization's business, data, applications, and technology.
Frequency Percent 1 1.00 0.37 2 5.00 1.84 3 12.00 4.41 4 113.00 41.54 5 129.00 47.43
Total 260.00 95.59 Missing 12.00 4.41 272 100.00 Mean 4.40 Median 4

SIMEAWG’s Information Management Practices Survey 2007: Preliminary Report Page 31
1 2 3 4 5 6
19f
0
50
100
150
Freq
uenc
y
Mean = 4.22Std. Dev. = 0.684N = 260
1 2 3 4 5 6
19g
0
30
60
90
120
150
Freq
uenc
y
Mean = 4.1Std. Dev. = 0.732N = 261
1 2 3 4 5 6
20a
0
20
40
60
80
100
120
140
Freq
uenc
y
Mean = 4.14Std. Dev. = 0.765N = 260
19f. as a tool for planning.
Frequency Percent 1 0 0 2 5.00 1.84 3 23.00 8.46 4 141.00 51.84 5 91.00 33.46
Total 260.00 95.59 Missing 12.00 4.41 272.00 100.00 Mean 4.22 Median 4
19g. as a tool for decision making.
Frequency Percent 1 0 0 2 7.00 2.57 3 37.00 13.60 4 140.00 51.47 5 77.00 28.31
Total 261.00 95.96 Missing 11.00 4.04 272.00 100.00 Mean 4.10 Median 4
20. Please select the level to which you agree or disagree that each of the following statements are representative of the potential benefits to an organization from doing enterprise architecture. Potential benefits of EA: 20a. Aligning business objectives with information technology investments.
Frequency Percent 1 0 0 2 10.00 3.68 3 30.00 11.03 4 133.00 48.90 5 87.00 31.99
Total 260.00 95.59 Missing 12.00 4.41 272.00 100.00 Mean 4.14 Median 4
SIMEAWG’s Information Management Practices Survey 2007: Preliminary Report Page 32
1 2 3 4 5 6
20b
0
30
60
90
120
150
Freq
uenc
y
Mean = 3.94Std. Dev. = 0.793N = 259
0 1 2 3 4 5 6
20c
0
20
40
60
80
100
120
140Fr
eque
ncy
Mean = 3.9Std. Dev. = 0.88N = 260
1 2 3 4 5 6
20d
0
50
100
150
Freq
uenc
y
Mean = 3.91Std. Dev. = 0.721N = 258
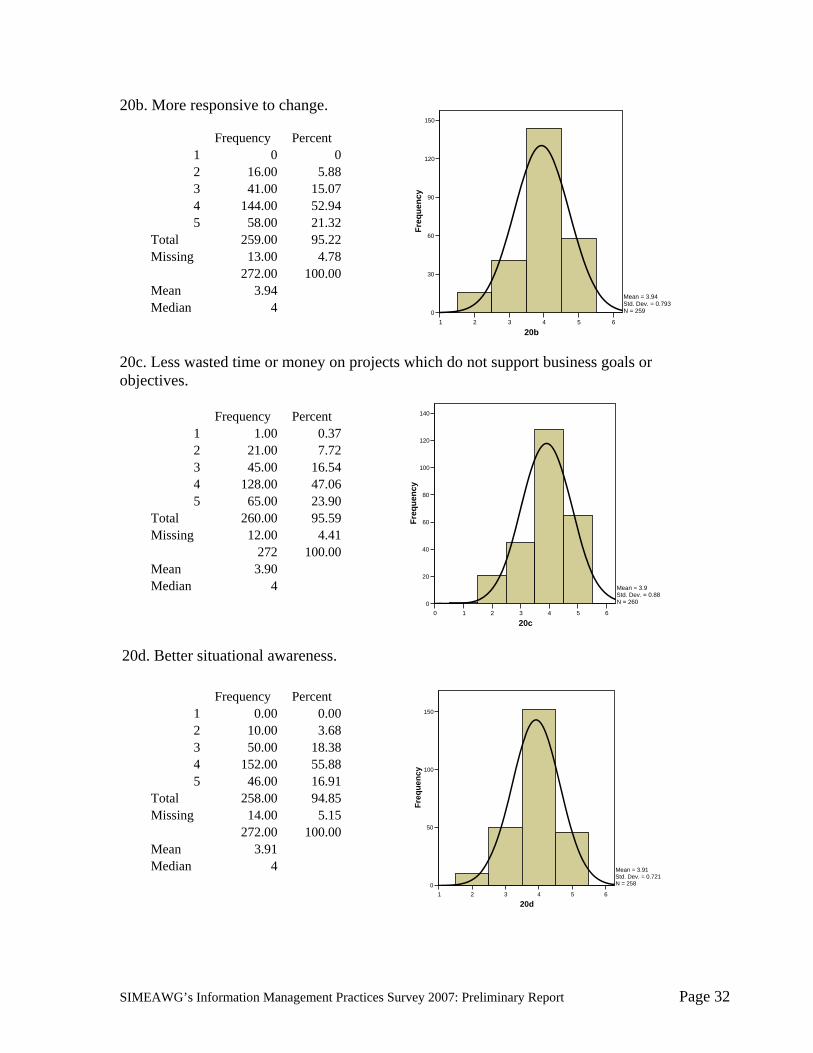
20b. More responsive to change.
20c. Less wasted time or money on projects which do not support business goals or objectives.
20d. Better situational awareness.
Frequency Percent 1 0 0 2 16.00 5.88 3 41.00 15.07 4 144.00 52.94 5 58.00 21.32
Total 259.00 95.22 Missing 13.00 4.78 272.00 100.00 Mean 3.94 Median 4
Frequency Percent 1 1.00 0.37 2 21.00 7.72 3 45.00 16.54 4 128.00 47.06 5 65.00 23.90
Total 260.00 95.59 Missing 12.00 4.41 272 100.00 Mean 3.90 Median 4
Frequency Percent 1 0.00 0.00 2 10.00 3.68 3 50.00 18.38 4 152.00 55.88 5 46.00 16.91
Total 258.00 94.85 Missing 14.00 5.15 272.00 100.00 Mean 3.91 Median 4
SIMEAWG’s Information Management Practices Survey 2007: Preliminary Report Page 33
1 2 3 4 5 6
20e
0
20
40
60
80
100
120
140
Freq
uenc
y
Mean = 3.87Std. Dev. = 0.77N = 260
1 2 3 4 5 6
20f
0
50
100
150Fr
eque
ncy
Mean = 4.21Std. Dev. = 0.69N = 260
0 1 2 3 4 5 6
20g
0
30
60
90
120
150
Freq
uenc
y
Mean = 3.87Std. Dev. = 0.818N = 259
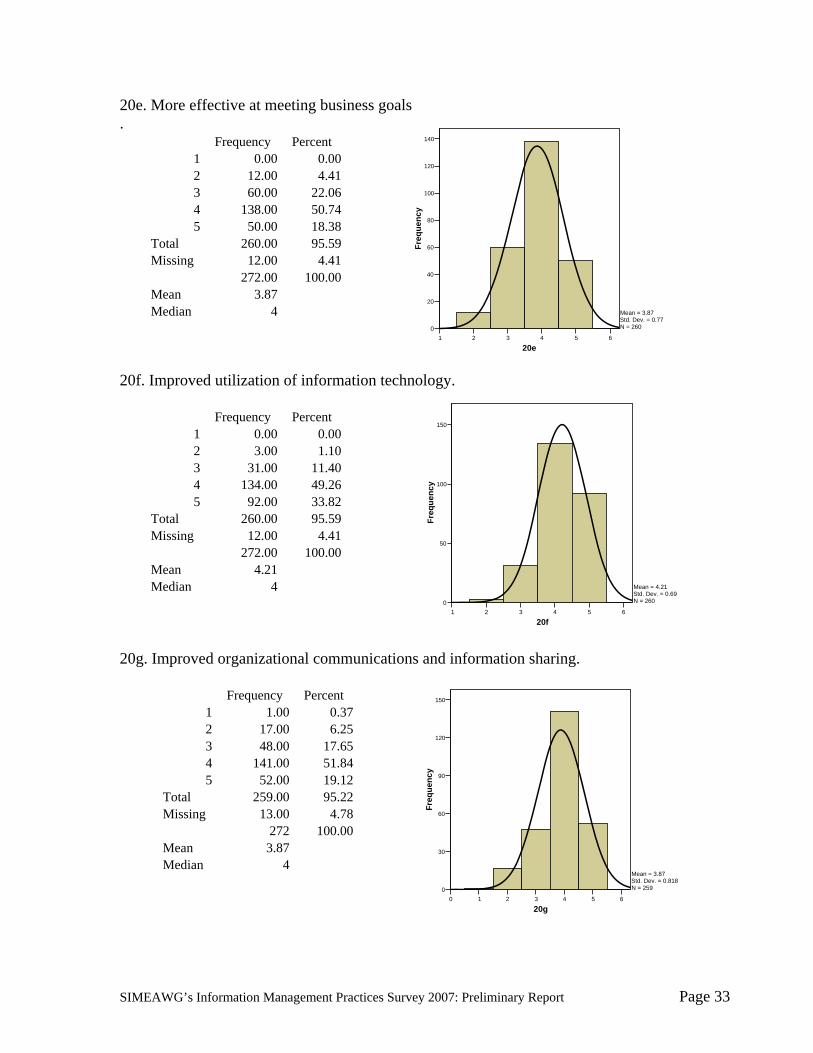
20e. More effective at meeting business goals .
Frequency Percent 1 0.00 0.00 2 12.00 4.41 3 60.00 22.06 4 138.00 50.74 5 50.00 18.38
Total 260.00 95.59 Missing 12.00 4.41 272.00 100.00 Mean 3.87 Median 4
20f. Improved utilization of information technology.
Frequency Percent 1 0.00 0.00 2 3.00 1.10 3 31.00 11.40 4 134.00 49.26 5 92.00 33.82
Total 260.00 95.59 Missing 12.00 4.41 272.00 100.00 Mean 4.21 Median 4
20g. Improved organizational communications and information sharing.
Frequency Percent 1 1.00 0.37 2 17.00 6.25 3 48.00 17.65 4 141.00 51.84 5 52.00 19.12
Total 259.00 95.22 Missing 13.00 4.78 272 100.00 Mean 3.87 Median 4
SIMEAWG’s Information Management Practices Survey 2007: Preliminary Report Page 34
1 2 3 4 5 6
20h
0
30
60
90
120
150
Freq
uenc
y
Mean = 4.3Std. Dev. = 0.732N = 259
0 1 2 3 4 5 6
20i
0
25
50
75
100
125
Freq
uenc
y
Mean = 3.95Std. Dev. = 0.844N = 258
1 2 3 4 5 6
20j
0
20
40
60
80
100
120
Freq
uenc
y
Mean = 3.79Std. Dev. = 0.869N = 258
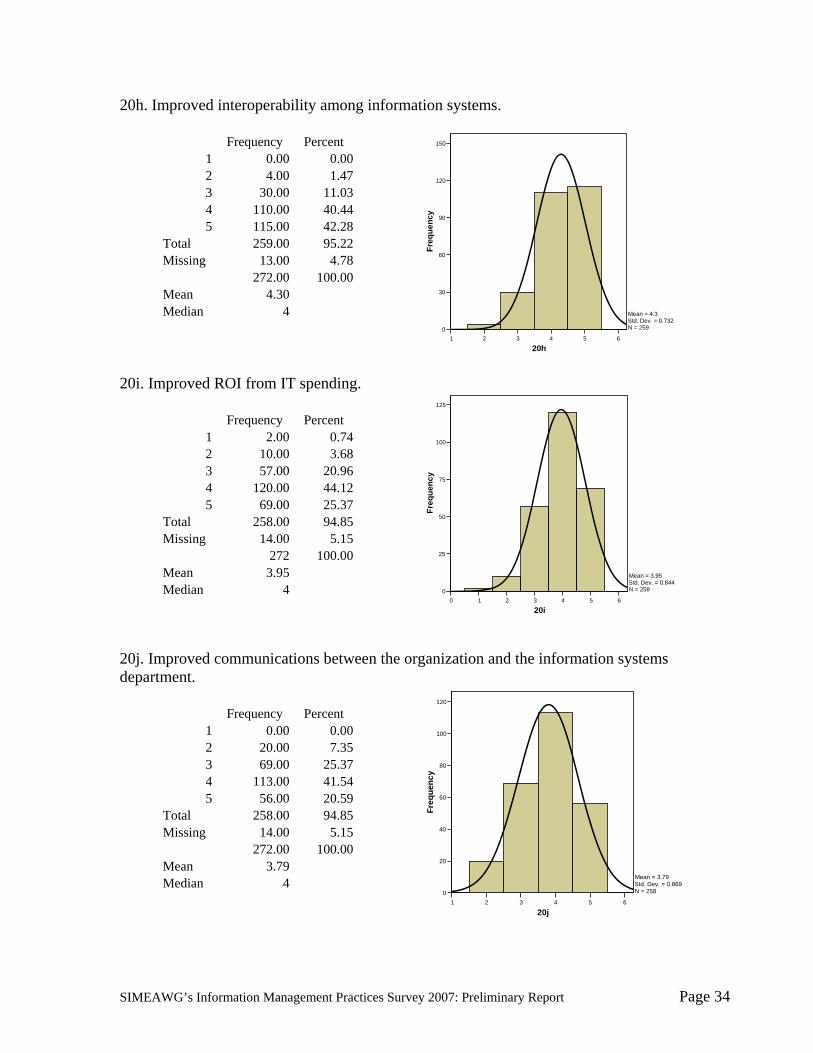
20h. Improved interoperability among information systems.
Frequency Percent 1 0.00 0.00 2 4.00 1.47 3 30.00 11.03 4 110.00 40.44 5 115.00 42.28
Total 259.00 95.22 Missing 13.00 4.78 272.00 100.00 Mean 4.30 Median 4
20i. Improved ROI from IT spending.
Frequency Percent 1 2.00 0.74 2 10.00 3.68 3 57.00 20.96 4 120.00 44.12 5 69.00 25.37
Total 258.00 94.85 Missing 14.00 5.15 272 100.00 Mean 3.95 Median 4
20j. Improved communications between the organization and the information systems department.
Frequency Percent 1 0.00 0.00 2 20.00 7.35 3 69.00 25.37 4 113.00 41.54 5 56.00 20.59
Total 258.00 94.85 Missing 14.00 5.15 272.00 100.00 Mean 3.79 Median 4

SIMEAWG’s Information Management Practices Survey 2007: Preliminary Report Page 35
0 1 2 3 4 5 6
20k
0
20
40
60
80
100
120
140
Freq
uenc
y
Mean = 3.73Std. Dev. = 0.81N = 258
1 2 3 4 5 6
20l
0
20
40
60
80
100
120
140Fr
eque
ncy
Mean = 3.86Std. Dev. = 0.82N = 258
1 2 3 4 5 6
20m
0
20
40
60
80
100
120
Freq
uenc
y
Mean = 3.68Std. Dev. = 0.882N = 255
20k. Faster at developing and implementing new information systems.
Frequency Percent 1 1.00 0.37
2 13.00 4.78 3 83.00 30.51 4 118.00 43.38 5 43.00 15.81
Total 258.00 94.85 Missing 14.00 5.15 272 100.00 Mean 3.73 Median 4
20l. Improves information systems security across the business.
Frequency Percent 1 0 0.00 2 12 4.41 3 71 26.10 4 116 42.65 5 59 21.69
Total 258 94.85 Missing 14 5.15 272 100.00 Mean 3.86 Median 4
20m. Standardizes organizational performance measures.
Frequency Percent 1 0 0.00 2 27 9.93 3 72 26.47 4 112 41.18 5 44 16.18
Total 255 93.75 Missing 17 6.25 272 100.00 Mean 3.68 Median 4

SIMEAWG’s Information Management Practices Survey 2007: Preliminary Report Page 36
1 2 3 4 5 6
20n
0
20
40
60
80
100
120
140
Freq
uenc
y
Mean = 3.78Std. Dev. = 0.777N = 258
1 2 3 4 5 6
20o
0
25
50
75
100
125
Freq
uenc
y
Mean = 3.44Std. Dev. = 0.828N = 257
0 1 2 3 4 5 6
20p
0
20
40
60
80
100
120
140
Freq
uenc
y
Mean = 3.92Std. Dev. = 0.769N = 257
20n. Better collaboration within organization.
Frequency Percent 1 0 0.00 2 15 5.51 3 68 25.00 4 135 49.63 5 40 14.71
Total 258 94.85 Missing 14 5.15 272 100.00 Mean 3.78 Median 4
20o. Improves trust in the organization.
Frequency Percent 1 0 0.00 2 32 11.76 3 104 38.24 4 97 35.66 5 24 8.82
Total 257 94.49 Missing 15 5.51 272 100.00 Mean 3.44 Median 3
20p. Assists with organizational governance.
Frequency Percent 1 1 0.37 2 8 2.94 3 57 20.96 4 136 50.00 5 55 20.22
Total 257 94.49 Missing 15 5.51 272 100.00 Mean 3.92 Median 4

SIMEAWG’s Information Management Practices Survey 2007: Preliminary Report Page 37
1 2 3 4 5 6
20q
0
20
40
60
80
100
120
140
Freq
uenc
y
Mean = 4Std. Dev. = 0.74N = 257
0 1 2 3 4 5 6
20r
0
20
40
60
80
100
120
Freq
uenc
y
Mean = 3.73Std. Dev. = 1.048N = 255
1 2 3 4 5 6
20s
0
25
50
75
100
125
Freq
uenc
y
Mean = 3.62Std. Dev. = 0.817N = 256
20q. More effective use of IT resources.
Frequency Percent 1 0 0.00 2 7 2.57 3 49 18.01 4 138 50.74 5 63 23.16
Total 257 94.49 Missing 15 5.51 272 100.00 Mean 4.00 Median 4
20r. Reduced IT complexity.
Frequency Percent 1 5 1.84 2 36 13.24 3 46 16.91 4 105 38.60 5 63 23.16
Total 255 93.75 Missing 17 6.25 272 100.00 Mean 3.73 Median 4
20s. Improved communications within organization.
Frequency Percent 1 0 0.00 2 21 7.72 3 89 32.72 4 112 41.18 5 34 12.50
Total 256 94.12 Missing 16 5.88 272 100.00 Mean 3.62 Median 4

SIMEAWG’s Information Management Practices Survey 2007: Preliminary Report Page 38
0 1 2 3 4 5 6
20t
0
25
50
75
100
125
Freq
uenc
y
Mean = 3.73Std. Dev. = 0.831N = 252
0 1 2 3 4 5 6
21a
0
20
40
60
80
100
120
140
Freq
uenc
y
Mean = 3.61Std. Dev. = 0.952N = 256
0 1 2 3 4 5 6
21b
0
30
60
90
120
150
Freq
uenc
y
Mean = 3.78Std. Dev. = 0.88N = 257
20t. Reduces organizational stovepipes.
Frequency Percent 1 1 0.37 2 14 5.15 3 81 29.78 4 111 40.81 5 45 16.54
Total 252 92.65 Missing 20 7.35 272 100.00 Mean 3.73 Median 4
21. The outcomes or products of my organization's requirements analysis and design (RA&D) activities: _______________________ 21a. include standards for information systems security.
Frequency Percent 1 4 1.47 2 41 15.07 3 39 14.34 4 140 51.47 5 32 11.76
Total 256 94.12 Missing 16 5.88 272 100.00 Mean 3.61 Median 4
21b. describe our transition from 'as is' to 'to be'.
Frequency Percent 1 3 1.10 2 24 8.82 3 44 16.18 4 142 52.21 5 44 16.18
Total 257 94.49 Missing 15 5.51 272 100.00 Mean 3.78 Median 4

SIMEAWG’s Information Management Practices Survey 2007: Preliminary Report Page 39
0 1 2 3 4 5 6
21c
0
20
40
60
80
100
120
Freq
uenc
y
Mean = 3.13Std. Dev. = 0.988N = 256
0 1 2 3 4 5 6
21d
0
20
40
60
80
100
120
Freq
uenc
y
Mean = 3.38Std. Dev. = 1.026N = 256
0 1 2 3 4 5 6
21e
0
20
40
60
80
100
120
Freq
uenc
y
Mean = 3.44Std. Dev. = 0.959N = 257
21c. are kept current
Frequency Percent 1 6 2.21 2 73 26.84 3 78 28.68 4 80 29.41 5 19 6.99
Total 256 94.12 Missing 16 5.88 272 100.00 Mean 3.13 Median 3
21d. are kept in a digital repository or database.
Frequency Percent 1 7 2.57 2 55 20.22 3 55 20.22 4 111 40.81 5 28 10.29
Total 256 94.12 Missing 16 5.88 272 100.00 Mean 3.38 Median 4
21e. are used to standardize our technologies.
Frequency Percent 1 4 1.47 2 46 16.91 3 67 24.63 4 112 41.18 5 28 10.29
Total 257 94.49 Missing 15 5.51 272 100.00 Mean 3.44 Median 4
SIMEAWG’s Information Management Practices Survey 2007: Preliminary Report Page 40
0 1 2 3 4 5 6
21f
0
20
40
60
80
100
120
140
Freq
uenc
y
Mean = 3.65Std. Dev. = 0.923N = 258
0 1 2 3 4 5 6
21g
0
20
40
60
80
100
120Fr
eque
ncy
Mean = 3.69Std. Dev. = 1.076N = 253
0 1 2 3 4 5 6
21h
0
20
40
60
80
100
120
Freq
uenc
y
Mean = 3.85Std. Dev. = 0.942N = 254
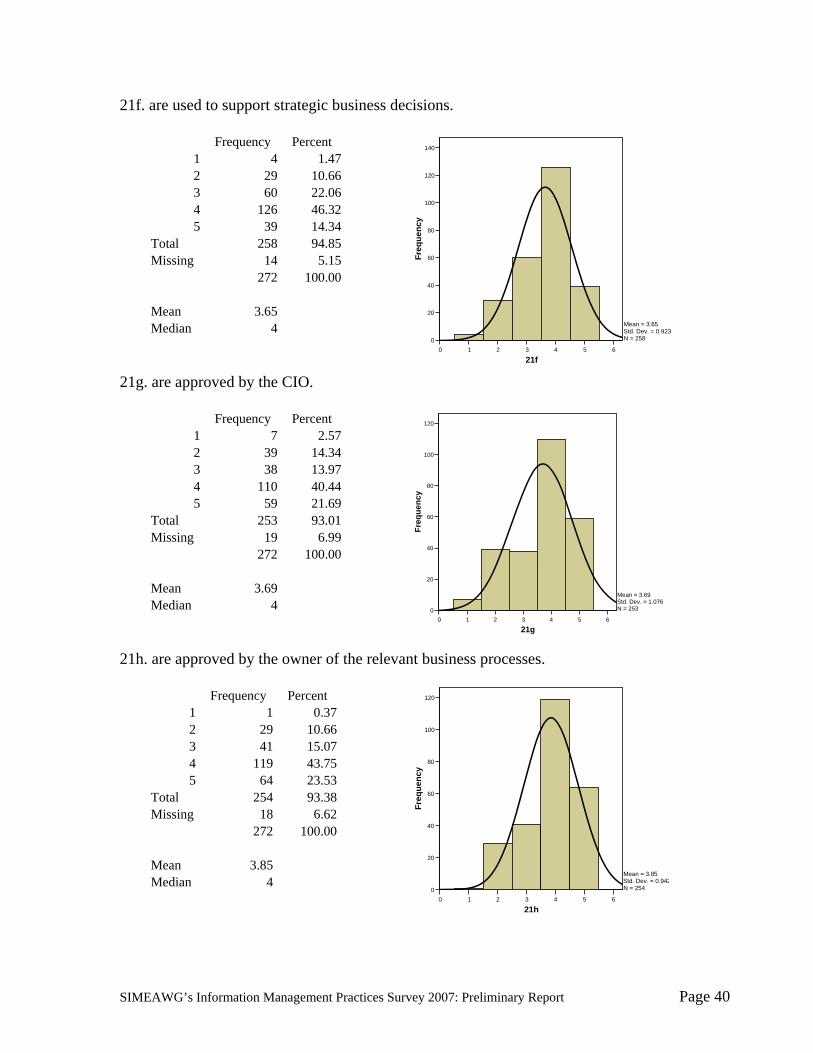
21f. are used to support strategic business decisions.
Frequency Percent 1 4 1.47 2 29 10.66 3 60 22.06 4 126 46.32 5 39 14.34
Total 258 94.85 Missing 14 5.15 272 100.00 Mean 3.65 Median 4
21g. are approved by the CIO.
Frequency Percent 1 7 2.57 2 39 14.34 3 38 13.97 4 110 40.44 5 59 21.69
Total 253 93.01 Missing 19 6.99 272 100.00 Mean 3.69 Median 4
21h. are approved by the owner of the relevant business processes.
Frequency Percent 1 1 0.37 2 29 10.66 3 41 15.07 4 119 43.75 5 64 23.53
Total 254 93.38 Missing 18 6.62 272 100.00 Mean 3.85 Median 4
SIMEAWG’s Information Management Practices Survey 2007: Preliminary Report Page 41
0 1 2 3 4 5 6
21i
0
20
40
60
80
100
120
140
Freq
uenc
y
Mean = 3.64Std. Dev. = 0.934N = 256
0 1 2 3 4 5 6
21j
0
20
40
60
80
100
120
Freq
uenc
y
Mean = 3.3Std. Dev. = 1.001N = 254
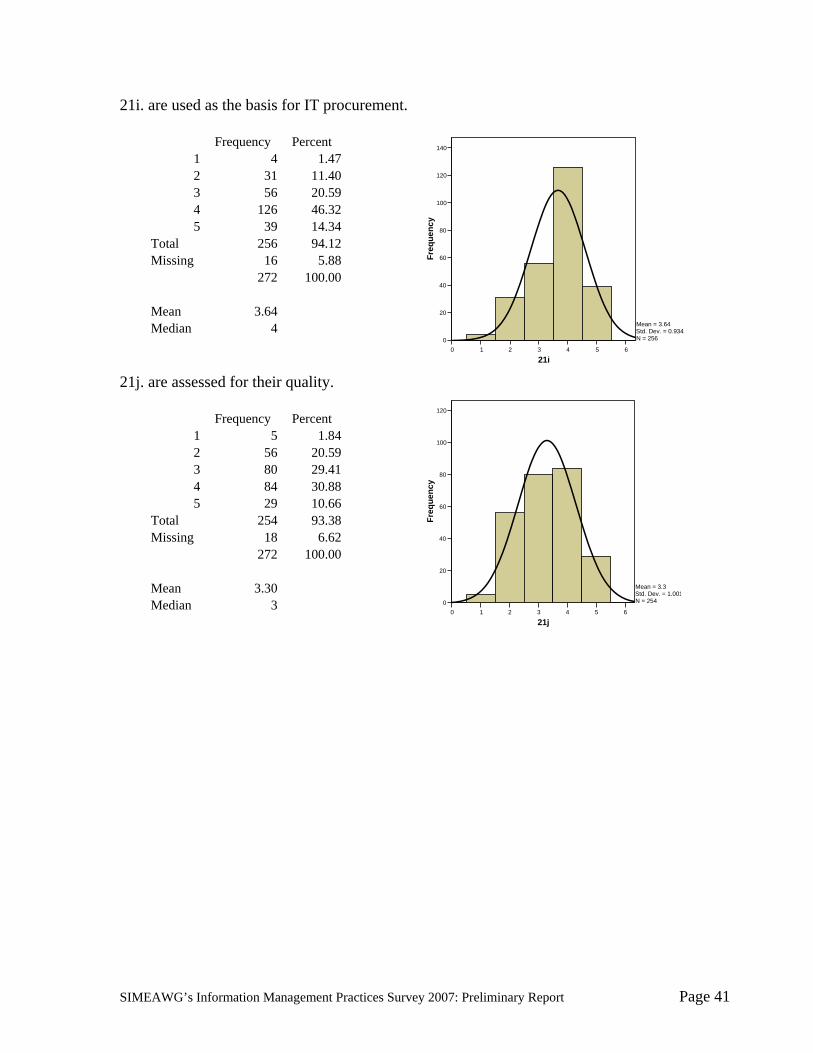
21i. are used as the basis for IT procurement.
Frequency Percent 1 4 1.47 2 31 11.40 3 56 20.59 4 126 46.32 5 39 14.34
Total 256 94.12 Missing 16 5.88 272 100.00 Mean 3.64 Median 4
21j. are assessed for their quality.
Frequency Percent 1 5 1.84 2 56 20.59 3 80 29.41 4 84 30.88 5 29 10.66
Total 254 93.38 Missing 18 6.62 272 100.00 Mean 3.30 Median 3

SIMEAWG’s Information Management Practices Survey 2007: Preliminary Report Page 42
The SIM Enterprise Architecture Working Group’s “Charter” The following is an excerpt from the SIMEAWG’s proposal as adopted by the SIM Executive Board in October 2006. Background
Can IT afford not to seize the opportunity to be ‘the keeper of all the knowledge’ about the enterprise? It could be no more than an historical accident that IT has been afforded first chance at this critical responsibility, largely due to the fact that we have done a reasonably good job managing the technical architecture of the enterprise. If we believe that information is power, then the potential is high for internal turf struggles and political machinations concerning who gets managerial responsibility for all of the information about the enterprise. In short, who will “own” the enterprise architecture for an organization? Being the keeper of the EA has the potential to ensure IT’s seat at the strategic table. The purpose of this Working Group is to help make that happen. Mission of the Working Group
The SIM Enterprise Architecture Working Group will identify and share processes, methods, tools, concepts, and best practices to enable IT organizations to understand, create, and manage EA in partnership with the business. This will in turn help these same IT organizations substantially enhance the way they manage change, reduce complexity, reengineer processes, plan, strategize, govern, manage projects, and deliver value. The Working Group will achieve these objectives by:
1. Developing a common understanding of what “EA” is and why it is important to the organization.
2. Proposing materials for the CIO to use to make EA simple to comprehend and verbalize to his/her peers and others in the enterprise.
3. Determining, through a survey of SIM membership (and other groups if possible), the current state of EA practices. These metrics can then serve as benchmarks so SIM members can determine how their organizations compare with others. This may also include a methodology for an organization to “self-survey” itself against the collective metrics.
4. Understanding the challenges and opportunities for the CIO’s organization in leading EA.
5. Sharing how organizations have successfully implemented and managed EA. 6. Identifying EA best practices including the critical initiatives and enabling processes
for the successful leadership and management of EA. Deliverables A SIM white paper that achieves the mission objectives, and includes
1. Background and definitions, 2. The survey’s findings, 3. Identification of best practices, 4. Success stories, and
SIMEAWG’s Information Management Practices Survey 2007: Preliminary Report Page 43
5. Key issues and critical success factors. Financial
• Individual members will cover their own expenses incurred to attend meetings including travel, accommodations, and meals.
• SIM will provide administrative assistance, the SIM membership list with contact information only to be used for the survey, a Working Group website, and printing and distribution costs of the white paper.
• Individual members will pay a Working Group participation fee of $300. per participant to help to cover cost of the survey and its administration, intra-group communications, and costs associated with writing and presenting the Group’s findings and report.
Logistics
• Assuming the group’s members agree to it, the Working Group will be co-chaired by Professor Leon Kappelman and a practitioner to be determined. Dr. Kappelman is Professor of Information Systems, Director Emeritus of the IS Research Center, a Fellow of the Texas Center for Digital Knowledge, and Associate Director of the Center for Quality & Productivity, in the College of Business at the University of North Texas (UNT) in Denton, Texas. He co-chaired the SIM Y2K Working Group from 1996 to 2000 during which time the Working Group conducted four annual surveys of SIM’s membership on the state of Y2K practices and published four SIM white papers. He has done EA work for the Executive Office of the President of the United States and the Department of Veterans Affairs, given presentations and written on EA, and testified before the US Congress on EA practices in the federal government.
• Meetings will take place at least quarterly. More frequent conference calls and e-meetings will be conducted as needed.
• First meeting will be one and one-half to two days, tentatively during the first ten days of January 2007. Thereafter, to be determined.