the separation of ownership and control in east asian...
TRANSCRIPT
qThe opinions expressed do not necessarily re#ect those of the World Bank. Larry H.P. Langgratefully acknowledges the Hong Kong UGC earmarked grant for research support. We thankMagdi Amin, Jerry Caprio, Chad Leechor, Rapoel La Porta (the referee), seminar participants at theWorld Bank, the International Monetary Fund, Vanderbilt University, the Thai Federation ofIndustries, the Korea Institute of Finance, and especially Tatiana Nenova and Andrei Shleifer forhelpful suggestions.
*Corresponding author. Tel.: #1-202-473-4748; fax: #1-202-522-0308.
E-mail address: [email protected] (S. Djankov).
Journal of Financial Economics 58 (2000) 81}112
The separation of ownership and control inEast Asian Corporationsq
Stijn Claessens!, Simeon Djankov!,*, Larry H.P. Lang"
!World Bank, Washington, DC, 20433 USA"Chinese University of Hong Kong, Shatin, NT, Hong Kong
Received 4 February 1999; received in revised form 1 December 1999
Abstract
We examine the separation of ownership and control for 2,980 corporations in nineEast Asian countries. In all countries, voting rights frequently exceed cash-#ow rights viapyramid structures and cross-holdings. The separation of ownership and control is mostpronounced among family-controlled "rms and small "rms. More than two-thirds of"rms are controlled by a single shareholder. Managers of closely held "rms tend to berelatives of the controlling shareholder's family. Older "rms are generally family-control-led, dispelling the notion that ownership becomes dispersed over time. Finally, signi"cantcorporate wealth in East Asia is concentrated among a few families. ( 2000 ElsevierScience S.A. All rights reserved.
JEL classixcation: G32; L22
Keywords: Ownership; Control; East Asian corporations
0304-405X/00/$ - see front matter ( 2000 Elsevier Science S.A. All rights reserved.PII: S 0 3 0 4 - 4 0 5 X ( 0 0 ) 0 0 0 6 7 - 2
1. Introduction
Much of the literature on the role and functioning of the modern "rm is basedon the assumption of widely dispersed ownership. This notion originally derivesfrom Berle and Means (1932) and has been propagated by Baumol (1959),Jensen and Meckling (1976), and Grossman and Hart (1980). A more recent lineof the literature shows, however, that some concentration of ownership existseven among the largest American corporations (Demsetz, 1983; Shleifer andVishny, 1986; Morck et al., 1988), and that an even higher level of ownershipconcentration exists in other developed and developing countries (La Portaet al., 1998, 1999).
La Porta et al. (1999) is the "rst study that investigates the issue of ultimatecontrol, i.e., they trace the chain of ownership to "nd who has the most votingrights. The "ndings suggest that ownership and control can be separated to thebene"t of the large shareholders. In this paper, we improve on their methodo-logy and apply it to East Asia. We investigate the separation of ownership andcontrol in 2,980 publicly traded companies in nine East Asian countries (HongKong, Indonesia, Japan, South Korea, Malaysia, the Philippines, Singapore,Taiwan, and Thailand).
In all East Asian countries, control is enhanced through pyramid structures,and cross-holdings among "rms. Voting rights consequently exceedformal cash-#ow rights, especially in Indonesia, Japan, and Singapore. We"nd that more than two-thirds of "rms are controlled by a single shareholder.Separation of management from ownership control is rare, and the top manage-ment of about 60% of "rms that are not widely held is related to the familyof the controlling shareholder. These "ndings have important implicationsfor the ability and incentives of controlling shareholders to expropriatefrom minority shareholders, as shown in a companion paper (Claessens et al.,1999).
We "nd extensive family control in more than half of East Asian corporations.Signi"cant cross-country di!erences exist, however. Corporations in Japan, forexample, are generally widely held, while corporations in Indonesia and Thai-land are mainly family controlled. State control is signi"cant in Indonesia,Korea, Malaysia, Singapore, and Thailand. The separation of ownership andcontrol is most pronounced among family-controlled "rms and among small"rms. In Korea, Singapore, and Taiwan, large family-controlled "rms alsodisplay a signi"cant wedge between ownership and control. We "nd that older"rms are more likely to be family controlled, as are smaller "rms. The concentra-tion of control generally diminishes with the level of a country's economicdevelopment.
The evidence also suggests that in some countries a signi"cant share ofcorporate assets rests in the hands of a small number of families. At the extreme,16.6% and 17.1% of the total value of listed corporate assets in Indonesia and
82 S. Claessens et al. / Journal of Financial Economics 58 (2000) 81}112
the Philippines, respectively, can be traced to the ultimate control of a singlefamily. The largest ten families in Indonesia, the Philippines, and Thailandcontrol half of the corporate assets in our sample, while the largest ten families inHong Kong and Korea control about a third of the corporate sector. Theexception is Japan, where family control is insigni"cant.
The paper is organized as follows. Section 2 reviews the relevant literature oncontrol of East Asian corporations. Section 3 discusses the construction of thedata. Section 4 de"nes the main variables of interest. Section 5 provides severalexamples of ownership structures of East Asian "rms. Section 6 shows theseparation of ownership and control of East Asian corporations, distinguishingamong four types of ultimate owners and the size of "rms. Section 7 studies thedeterminants of the concentration of control. Section 8 discusses the evidence on`crony capitalism.a Section 9 concludes.
2. The literature on ownership structures in East Asia
As surveyed in Rodrik (1997), numerous scholars have examined the perfor-mance of East Asian corporations over the last four decades, but their owner-ship structure and the separation between ownership and control remain largelyunknown. Several studies on corporate governance in Japan (Aoki, 1990;Prowse, 1992; Hoshi et al., 1991; Kaplan, 1994) point to the signi"cance ofkeiretsu groups. These studies focus, however, on company performance, and donot attempt to trace the ownership of each company to its ultimate owners andidentify those owners by type and control stake. The exception is Lim (1981)who studies in detail the ownership structures of the largest 100 corporations inMalaysia.
There do exist, however, a number of case studies that describe the ownershipand control structures of some of the largest business groups in East Asiancountries: Taylor (1998) for the Li Ka-shing group in Hong Kong, Sato (1993)for the Salim group in Indonesia, Okumura (1993) for the Mitsubishi group inJapan, Taniura (1993) for the Lucky Goldstar group in Korea, Koike (1993) forthe Ayala group in the Philippines, Numazaki (1993) for the Tainanbang groupin Taiwan, Taniura (1989) for the Formosa group in Taiwan, Suehiro (1993) forthe Charoen Pokphand group in Thailand, and Vatikiotis (1997) for the DhaninChearavanont group in Thailand.
These case studies provide us with insights into the evolution of corporateownership and control in East Asia. The "ndings suggest that the dominance ofmost business groups lies in the privileges that they solicit from the government:exclusive exporting or importing rights, protection from foreign competition forextensive periods of time, granting of monopoly power in the local market,procurement of large government contracts, etc. The case study literature doesnot, however, allow for cross-country comparisons; neither does it document the
S. Claessens et al. / Journal of Financial Economics 58 (2000) 81}112 83
precise mechanisms through which the owners are able to exercise and extendtheir control.
The recent contributions of La Porta et al. (1998) and La Porta et al. (1999) goa long way towards "lling this gap in our knowledge. The former studydocuments the ownership structure of the ten largest non"nancial corporationsfor a cross-section of 49 countries, including nine East Asian countries.The results show that although ownership concentration of East Asian corpora-tions is high, it is not signi"cantly di!erent from that in other countries atsimilar levels of economic and institutional development. The latter studyinvestigates in great detail the control structure of the largest 20 publiclytraded corporations in 27 rich countries, including four (Hong Kong, Japan,Korea, and Singapore) East Asian countries. It traces control to the ultimateowners of each company and distinguishes among "ve types of owners. Owner-ship in the majority of Japanese and Korean corporations is found to be widelydispersed, corporations in Hong Kong are predominantly controlled by fami-lies, while about half of the sampled companies in Singapore are controlled bythe state.
La Porta et al. (1999) also examine the means through which control isenhanced. The study shows that owners extend their resources through the useof pyramiding and management appointments, as well as through cross-owner-ship and the (infrequent) use of shares that have more votes. They document thatcontrol of East Asian corporations can be achieved with signi"cantly less thanan absolute majority share of the stock, as the probability of being a singlecontrolling owner through holding only 20% of the stock is very high (above80% across the four East Asian countries).
The previous research leaves unanswered several questions. First, are thereany di!erences in the separation of ownership and control across the East Asiancountries? Second, are there within-country di!erences in the separation ofownership and control? Third, do such di!erences depend on the age and size ofthe corporation? Finally, to what extent is corporate control concentrated in thehands of particular families? The answers to these questions have strong im-plications for understanding the corporate governance structure of East Asian"rms.
3. Construction of the data
The analysis in the following sections is based on newly assembled data for2,980 publicly traded corporations, including both "nancial institutions andnon"nancial institutions, in Hong Kong, Indonesia, Japan, South Korea,Malaysia, the Philippines, Singapore, Taiwan, and Thailand. As the start-ing point in the data collection of cash-#ow and voting rights, we use theWorldscope 1998 database which generally provides the names and immediate
84 S. Claessens et al. / Journal of Financial Economics 58 (2000) 81}112
1 In other words, roughly 20% of the "rms in the sample have incomplete ownership data. Thiscreates a concern about the biases that these missing observations may create in the calculation ofthe fraction of widely held "rms in various countries. One way of addressing this issue is to look atthe composition of the board of directors for a subsample of these "rms and examine whether boardmembers share common family names. This exercise is beyond the scope of the paper.
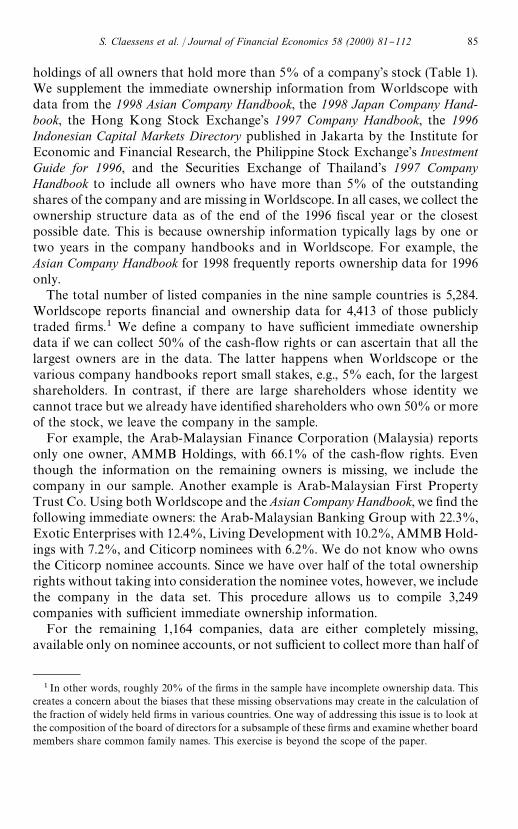
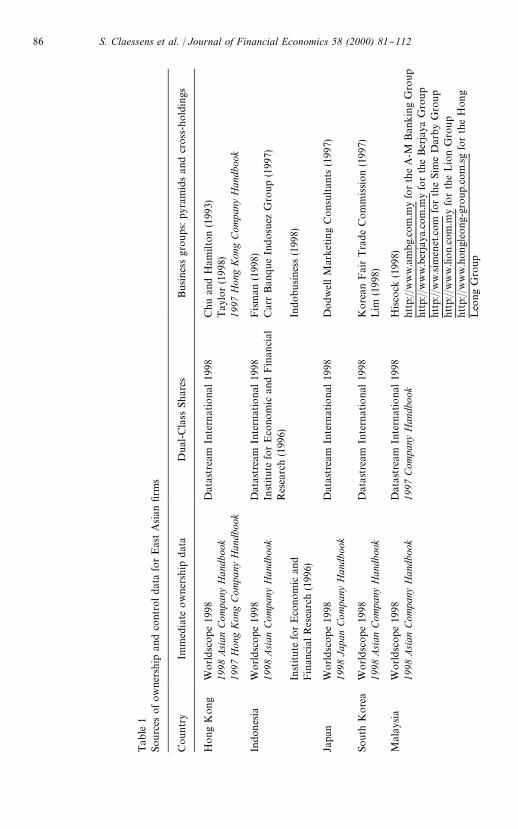
holdings of all owners that hold more than 5% of a company's stock (Table 1).We supplement the immediate ownership information from Worldscope withdata from the 1998 Asian Company Handbook, the 1998 Japan Company Hand-book, the Hong Kong Stock Exchange's 1997 Company Handbook, the 1996Indonesian Capital Markets Directory published in Jakarta by the Institute forEconomic and Financial Research, the Philippine Stock Exchange's InvestmentGuide for 1996, and the Securities Exchange of Thailand's 1997 CompanyHandbook to include all owners who have more than 5% of the outstandingshares of the company and are missing in Worldscope. In all cases, we collect theownership structure data as of the end of the 1996 "scal year or the closestpossible date. This is because ownership information typically lags by one ortwo years in the company handbooks and in Worldscope. For example, theAsian Company Handbook for 1998 frequently reports ownership data for 1996only.
The total number of listed companies in the nine sample countries is 5,284.Worldscope reports "nancial and ownership data for 4,413 of those publiclytraded "rms.1 We de"ne a company to have su$cient immediate ownershipdata if we can collect 50% of the cash-#ow rights or can ascertain that all thelargest owners are in the data. The latter happens when Worldscope or thevarious company handbooks report small stakes, e.g., 5% each, for the largestshareholders. In contrast, if there are large shareholders whose identity wecannot trace but we already have identi"ed shareholders who own 50% or moreof the stock, we leave the company in the sample.
For example, the Arab-Malaysian Finance Corporation (Malaysia) reportsonly one owner, AMMB Holdings, with 66.1% of the cash-#ow rights. Eventhough the information on the remaining owners is missing, we include thecompany in our sample. Another example is Arab-Malaysian First PropertyTrust Co. Using both Worldscope and the Asian Company Handbook, we "nd thefollowing immediate owners: the Arab-Malaysian Banking Group with 22.3%,Exotic Enterprises with 12.4%, Living Development with 10.2%, AMMB Hold-ings with 7.2%, and Citicorp nominees with 6.2%. We do not know who ownsthe Citicorp nominee accounts. Since we have over half of the total ownershiprights without taking into consideration the nominee votes, however, we includethe company in the data set. This procedure allows us to compile 3,249companies with su$cient immediate ownership information.
For the remaining 1,164 companies, data are either completely missing,available only on nominee accounts, or not su$cient to collect more than half of
S. Claessens et al. / Journal of Financial Economics 58 (2000) 81}112 85
Tab
le1
Sourc
esofow
ners
hip
and
cont
roldat
afo
rE
ast
Asian"rm
s
Coun
try
Imm
edia
teow
ner
ship
dat
aD
ual
-Cla
ssShar
esB
usine
ssgr
oups:
pyra
mid
san
dcr
oss
-hold
ings
Hong
Kon
gW
orld
scop
e19
98D
atas
trea
mIn
tern
atio
nal19
98C
huan
dH
amilt
on(1
993)
1998
Asi
anC
ompa
nyH
andb
ook
Tay
lor
(199
8)19
97H
ong
Kon
gC
ompa
nyH
andb
ook
1997
Hon
gK
ong
Com
pany
Han
dboo
k
Indo
nes
iaW
orld
scop
e19
98D
atas
trea
mIn
tern
atio
nal19
98Fism
an(1
998)
1998
Asi
anC
ompa
nyH
andb
ook
Inst
itute
for
Eco
nom
ican
dF
inan
cial
Res
earc
h(1
996)
Car
rBan
que
Indos
uez
Gro
up
(199
7)
Inst
itute
for
Eco
nom
ican
dFin
anci
alR
esea
rch
(199
6)In
dobusines
s(1
998)
Japa
nW
orld
scop
e19
98D
atas
trea
mIn
tern
atio
nal19
98D
odw
ellM
arke
ting
Cons
ulta
nts
(199
7)19
98Ja
pan
Com
pany
Han
dboo
k
South
Kore
aW
orldsc
ope
1998
Dat
astr
eam
Inte
rnat
iona
l19
98K
ore
anF
air
Tra
de
Com
mission
(199
7)19
98A
sian
Com
pany
Han
dboo
kLim
(199
8)
Mal
aysia
Wor
ldsc
ope
1998
Dat
astr
eam
Inte
rnat
iona
l19
98H
isco
ck(1
998)
1998
Asi
anC
ompa
nyH
andb
ook
1997
Com
pany
Han
dboo
khtt
p://
ww
w.a
mbg.
com
.my
for
the
A-M
Ban
kin
gG
roup
http:
//w
ww
.ber
jaya
.com
.my
for
the
Ber
jaya
Gro
up
http:
//w
w.sim
enet
.com
for
the
Sim
eD
arby
Gro
up
http:
//w
ww
.lion.
com
.my
for
the
Lio
nG
roup
http:
//w
ww
.hongl
eong-
group
.com
.sg
for
the
Hon
gLeo
ng
Gro
up
86 S. Claessens et al. / Journal of Financial Economics 58 (2000) 81}112
Phili
ppi
nes
Worldsc
ope
1998
Dat
astr
eam
Inte
rnat
iona
l19
9819
97In
vest
men
tG
uide
1998
Asi
anC
ompa
nyH
andb
ook
1997
Inve
stm
ent
Gui
deTan
(199
3)19
97In
vest
men
tG
uide
Singa
pore
Wor
ldsc
ope
1998
Dat
astr
eam
Inte
rnat
iona
l19
9819
97Si
ngap
ore
Com
pany
Han
dboo
k19
98A
sian
Com
pany
Han
dboo
k19
97Si
ngap
ore
Com
pany
Han
dboo
kH
isco
ck(1
998)
Tai
wan
Worldsc
ope
1998
Dat
astr
eam
Inte
rnat
iona
l19
98C
hina
Cre
dit
Info
rmat
ion
Ser
vice
(199
7)19
98A
sian
Com
pany
Han
dboo
kBau
m(1
994)
Thai
land
Wor
ldsc
ope
1998
Dat
astr
eam
Inte
rnat
iona
l19
98Tar
aSia
mC
ompa
ny
(199
7)19
98A
sian
Com
pan
yH
andb
ook
1997
Secu
riti
esE
xcha
nge
ofTh
aila
nd's
Com
pany
Han
dboo
kThe
Nat
ion,
Sep
tem
ber
11,19
98,1}76
.
1997
Secu
riti
esE
xcha
nge
ofTh
aila
nd's
Com
pany
Han
dboo
kV
atik
iotis
(199
7)
S. Claessens et al. / Journal of Financial Economics 58 (2000) 81}112 87
the ownership rights. We exclude these companies from the data set. Nomineeaccounts are especially problematic in Malaysia and Thailand, where we ex-clude 66 companies and 92 companies that report either nominee ownershiponly, or a mixture of nominee and direct ownership with direct ownership below50%. Only nine Singaporean companies are excluded from the sample due toreporting nominee ownership.
The exclusion of companies that report nominee accounts could create a bias. Ifnominee accounts are prevalent in closely held "rms, we are likely to understatethe fraction of such "rms. One option is to go back to primary sources, i.e., collectinformation from the annual reports of companies. This is, however, a verytime-consuming process and in many cases (especially in Thailand) these reportsare only provided in the local language. Moreover, companies in Thailand andSingapore are not required to disclose the identity of their major shareholders,i.e., direct ownership information is not reported. Such information is held onlyby the Securities and Exchange Commissions and is not publicly available.
In an attempt to study the direction of the bias when excluding "rms that reportnominee accounts, we look through our sources for group a$liation and identify"rms that report nominee accounts in Worldscope and the other sources ofimmediate ownership data. The idea is to see whether in fact nominee accountsare more common in widely held "rms. We "nd, for example, that the Arab-Malaysian Development Co. belongs to the A-M Banking Group (Malaysia),which holds 44.5% of ownership. Arab-Malaysian Finance and Arab-MalaysianFirst Property Trust also belong to this group, together with six other companieslisted on the Kuala Lumpur Stock Exchange. Two of the latter also reportnominee accounts in the original database. Repeating this process for each "rm,we "nd that 41 of the 66 Malaysian "rms belong to family groups, as do 67 of the92 Thai "rms and three of the nine Singaporean "rms. The remaining "rms arenot mentioned in any of the sources of business group information. This exerciseshows that, if anything, the exclusion of "rms that report nominee accountsbiases our results against "nding more family ownership and control.
Of the 3,249 companies that provide su$cient ownership data, we are able totrace ultimate owners for 2,980 companies. We are not able to ascertain theultimate ownership of 232 companies and exclude them from the data set. Thisoccurs when a company is owned by another company whose ultimate owners wecannot identify. Since it is generally easier to identify widely held "rms than totrace ultimate ownership, the frequency of widely held "rms in the "nal sample islikely overestimated due to this selection criterion. For 37 Taiwanese com-panies, the largest owners are reported as mainland Chinese companies, whichare in turn owned by Taiwanese families according to China Credit InformationService (1997). Since the precise magnitude of these ownership links is notobvious from the data, we choose to exclude these companies from the sample.
While Worldscope provides data on cash-#ow rights, it does not haveinformation on multiple classes of voting rights. These data are provided
88 S. Claessens et al. / Journal of Financial Economics 58 (2000) 81}112
2The organizational chart of the Lotte group is available at http://www.lotte.co.kr. The groupa$liation of companies in the largest "ve groups in South Korea are available at http://www.hyundai.net, http://www.daewoo.com, http://www.samsung.com, http://www.lg.co.kr, and http://www.ssangyong.co.kr, respectively.
in Datastream International (1998) for the majority of our companies (Table 1),while Nenova (1999) provides a detailed description of the data on multipleclasses of voting rights in Datastream. Since Datastream does not cover as many"rms as Worldscope, however, we are forced to collect additional informationon voting rights for Indonesia, the Philippines, Malaysia, Singapore, and Thai-land. The sources for these data are the Institute for Economic and FinancialResearch (1996), the Philippine Stock Exchange's 1997 Investment Guide, theKuala Lumpur Stock Exchange's 1997 Company Handbook, the Singapore StockExchange's 1997 Singapore Company Handbook, and the Securities Exchangeof Thailand's 1997 Company Handbook. These publications provide informationon each class of voting shares and their owners.
The sources for immediate ownership data do not o!er an accurate picture ofgroup a$liation. For example, many of the companies that belong to businessgroups in Korea are classi"ed as widely held companies in the 1998 AsianCompany Handbook. We therefore use specialized sources for group-a$liationinformation to avoid inaccuracies (Table 1, last column). This greatly improvesthe data coverage. For example, there are only two entries for "rms in the Lottegroup in the 1998 Asian Company Handbook, Lotte Confectionery and LotteChilsung Beverage. In contrast, the Korean Fair Trade Commission (1997)identi"es 27 companies as a$liated with the Lotte group, of which "ve arepublicly traded.2 Equally important, the specialized sources of group informa-tion provide ownership data for privately held corporations, which are unavail-able from other publications. Without them, it would be impossible to traceultimate ownership in group-a$liated companies.
The use of publications on group a$liation creates some problems too. Forexample, the de"nition of group a$liation di!ers across countries } groupa$liation in Japan is based on CEO participation in the Presidential Council ofthe keiretsu, while the Korean Fair Trade Commission (1997) de"nes a "rm asgroup a$liated if 30% of its outstanding stock is owned by other companies inthe same group. Also, the group-a$liation data for Hong Kong are for 1992 anddo not capture any changes between 1992 and 1996. To the best of ourknowledge, however, there are no superior sources of group information.
4. De5nitions of variables
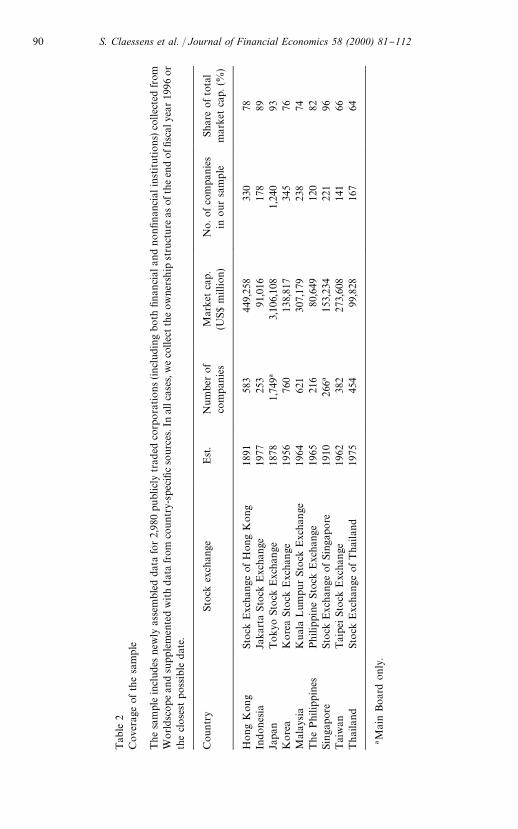
The coverage of the sample di!ers somewhat across the nine countries, asshown in Table 2. Typically, we cover about three-quarters of the market value
S. Claessens et al. / Journal of Financial Economics 58 (2000) 81}112 89
Tab
le2
Cov
erag
eof
the
sam
ple
The
sam
ple
incl
udes
new
lyas
sem
bled
data
for2,
980
publ
icly
trad
edco
rpora
tions(in
cludi
ngbo
th"na
nci
alan
dno
n"nan
cial
inst
itut
ions)
collec
ted
from
Worldsc
ope
and
supp
lem
ente
dw
ith
dat
afrom
countr
y-sp
eci"
cso
urce
s.In
allc
ases
,we
colle
ctth
eow
ners
hip
stru
cture
asoft
he
end
of"
scal
year
1996
orth
ecl
ose
stpos
sible
dat
e.
Cou
ntr
ySto
ckex
chan
geE
st.
Num
ber
of
com
pan
ies
Mar
ket
cap.
(US
$m
illio
n)
No.o
fco
mpa
nie
sin
our
sam
ple
Shar
eofto
tal
mar
ket
cap.
(%)
Hong
Kon
gSt
ock
Exc
hange
ofH
ong
Kong
1891
583
449,
258
330
78In
dones
iaJa
kart
aSto
ckE
xcha
nge
1977
253
91,0
1617
889
Japa
nToky
oSt
ock
Exc
hange
1878
1,74
9!3,
106,
108
1,24
093
Kore
aK
ore
aSt
ock
Exc
hange
1956
760
138,
817
345
76M
alay
sia
Kual
aL
umpu
rSto
ckE
xcha
nge
1964
621
307,
179
238
74The
Phi
lipp
ines
Phili
ppin
eSto
ckExc
hang
e19
6521
680
,649
120
82Si
nga
pore
Stock
Exc
hange
ofSi
ngap
ore
1910
266!
153,
234
221
96Tai
wan
Tai
peiSt
ock
Exc
hange
1962
382
273,
608
141
66Thai
land
Stock
Exc
hange
ofT
haila
nd19
7545
499
,828
167
64
!Mai
nBoar
don
ly.
90 S. Claessens et al. / Journal of Financial Economics 58 (2000) 81}112
of assets even though our sample sometimes has only half of the listed "rms(Korea, Malaysia, Taiwan, and Thailand). This is because we always cover thelargest 100 "rms in terms of market capitalization, i.e., the average "rm in oursample is larger than the average listed "rm.
We analyze the cash-#ow and control rights of companies by studying allshareholders who control over 5% of the votes. In the majority of cases, theprincipal shareholders are themselves corporate entities, not-for-pro"t founda-tions, or "nancial institutions. We then identify their owners, the owners of theirowners, etc. We do not distinguish among individual family members and usethe family group as a unit of analysis.
Our de"nition of ownership relies on cash-#ow rights. The de"nition ofcontrol relies on voting rights and uses of deviations from one-share}one-vote,pyramiding schemes, and cross-holdings as means of separating cash-#ow andvoting rights. This distinction can make for enormous di!erences. Suppose, forexample, that a family owns 11% of the stock of publicly traded Firm A, whichin turn has 21% of the stock of Firm B. Assume that there are no deviationsfrom one-share}one-vote or cross-holdings between "rms A and B. We wouldsay that the family owns about 2% of the cash-#ow rights of Firm B, or theproduct of the two ownership stakes along the chain. We would say that thefamily controls 11% of Firm B, or the weakest link in the chain of voting rights.
In many cases, particularly in Japan, Malaysia, and Singapore where cross-holdings are often present, the ultimate controller has several control rightschains through which to control the votes in a company. We trace thosepyramidal and cross-holding chains individually and then sum up the controlrights to yield the ultimate control share. For example, suppose that a familyowns 11% of the stock of publicly traded Firm A, which in turn has 21% of thestock of Firm B. The same family owns 25% of Firm C, which in turn owns 7%of Firm B. Looking at control rights, we would say that the family controls 18%of Firm B, or the sum of the weakest links in the chains of voting rights. Incontrast, we would say that the family owns about 3.5% of the cash-#ow rightsof Firm B, or the sum of the products of the ownership stakes along the twochains.
We next discuss the mechanisms that separate ownership and control. Werecord evidence for the use of multiple classes of voting rights and pyramidstructures. We also investigate the role of cross-holdings, although our data hereare less comprehensive, as it is impossible to follow all the cross-holding patternsin such a large sample. For example, we used the information provided byDodwell Marketing Consultants (1997) to identify 273 cross-holdings amongthe 42 companies of the Yasuda group, the fourth largest business group inJapan.
We begin with a description of the magnitude of deviations from one-share}one-vote through shares with di!erent voting rights. Such deviations tendto be very small in the East Asian countries, as it takes on average 19.76%
S. Claessens et al. / Journal of Financial Economics 58 (2000) 81}112 91
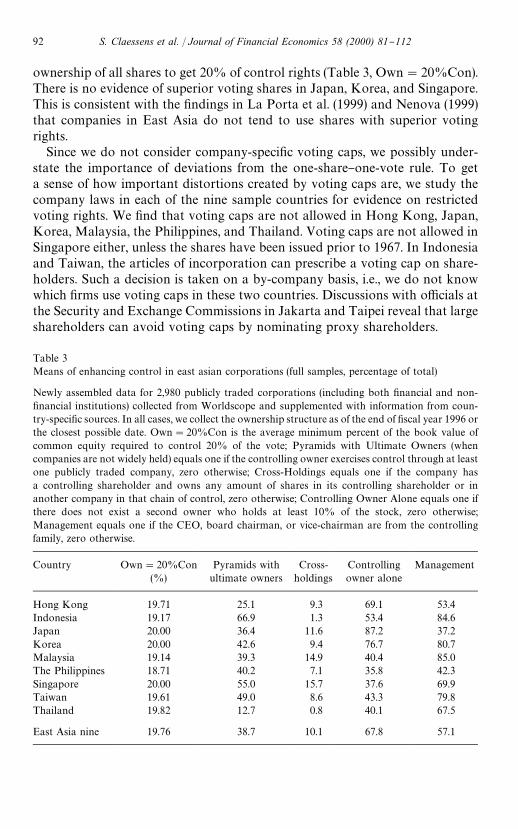
Table 3Means of enhancing control in east asian corporations (full samples, percentage of total)
Newly assembled data for 2,980 publicly traded corporations (including both "nancial and non-"nancial institutions) collected from Worldscope and supplemented with information from coun-try-speci"c sources. In all cases, we collect the ownership structure as of the end of "scal year 1996 orthe closest possible date. Own"20%Con is the average minimum percent of the book value ofcommon equity required to control 20% of the vote; Pyramids with Ultimate Owners (whencompanies are not widely held) equals one if the controlling owner exercises control through at leastone publicly traded company, zero otherwise; Cross-Holdings equals one if the company hasa controlling shareholder and owns any amount of shares in its controlling shareholder or inanother company in that chain of control, zero otherwise; Controlling Owner Alone equals one ifthere does not exist a second owner who holds at least 10% of the stock, zero otherwise;Management equals one if the CEO, board chairman, or vice-chairman are from the controllingfamily, zero otherwise.
Country Own"20%Con(%)
Pyramids withultimate owners
Cross-holdings
Controllingowner alone
Management
Hong Kong 19.71 25.1 9.3 69.1 53.4Indonesia 19.17 66.9 1.3 53.4 84.6Japan 20.00 36.4 11.6 87.2 37.2Korea 20.00 42.6 9.4 76.7 80.7Malaysia 19.14 39.3 14.9 40.4 85.0The Philippines 18.71 40.2 7.1 35.8 42.3Singapore 20.00 55.0 15.7 37.6 69.9Taiwan 19.61 49.0 8.6 43.3 79.8Thailand 19.82 12.7 0.8 40.1 67.5
East Asia nine 19.76 38.7 10.1 67.8 57.1
ownership of all shares to get 20% of control rights (Table 3, Own"20%Con).There is no evidence of superior voting shares in Japan, Korea, and Singapore.This is consistent with the "ndings in La Porta et al. (1999) and Nenova (1999)that companies in East Asia do not tend to use shares with superior votingrights.
Since we do not consider company-speci"c voting caps, we possibly under-state the importance of deviations from the one-share}one-vote rule. To geta sense of how important distortions created by voting caps are, we study thecompany laws in each of the nine sample countries for evidence on restrictedvoting rights. We "nd that voting caps are not allowed in Hong Kong, Japan,Korea, Malaysia, the Philippines, and Thailand. Voting caps are not allowed inSingapore either, unless the shares have been issued prior to 1967. In Indonesiaand Taiwan, the articles of incorporation can prescribe a voting cap on share-holders. Such a decision is taken on a by-company basis, i.e., we do not knowwhich "rms use voting caps in these two countries. Discussions with o$cials atthe Security and Exchange Commissions in Jakarta and Taipei reveal that largeshareholders can avoid voting caps by nominating proxy shareholders.
92 S. Claessens et al. / Journal of Financial Economics 58 (2000) 81}112
Pyramid structures are de"ned as owning a majority of the stock of onecorporation which in turn holds a majority of the stock of another, a processthat can be repeated a number of times. For 38.7% of the companies in oursample, ultimate control at the 20% level involves the use of a pyramidstructure, with the number being the largest in Indonesia (66.9%) and thesmallest in Thailand (12.7%). Singaporean companies also show a high inci-dence of pyramiding, while only a quarter of non-widely held companies inHong Kong are controlled through pyramid structures.
Next we study cross-holding patterns whereby a company further down thechain of control has some shares in another company in the same businessgroup. We do not "nd signi"cant evidence of cross-holdings, with the exceptionof Malaysia and Singapore where 14.9% and 15.7% of companies have somecross-ownership. Interestingly, Korean companies are above the average for thenine East Asian countries on that indicator even though cross-holdings arelimited by law. Thai companies display the least evidence of cross-holdings,a meager 0.8%.
The presence of cross-holdings creates some di$culties in measuring cash-#ow and voting rights. Imagine that "rm A owns 50% of "rm B which, in turn,owns 25% of "rm A. How should "rm A be classi"ed? La Porta et al. (1999, p.483) classify such "rms as widely held. In contrast, we classify "rm A ascontrolled by "rm B at the 20% cuto! level. We argue that this de"nition issuperior in a study of East Asian corporations, since we most frequently observethat both "rm A and "rm B belong to a family group, i.e., the family owns someshares in both A and B. In such cases the cross-shareholding is also part ofa pyramidal structure, which reinforces the view that the companies are notwidely held.
Another di$culty emerges when dealing with subsidiary companies. Supposethat a shareholder has 25% of the voting rights in "rm A, which owns 100% of"rm B. Firm B in turn owns 50% of "rm A. What share of the voting rights doesthe shareholder have in "rm A? Following our de"nition of control, we deter-mine that the shareholder has 50% of the control rights in "rm A, 25% directlyand 25% through a pyramidal chain.
We also identify two means that strengthen ultimate control but are not usedin the calculations of the separation between ownership and control. The "rst isthe possibility of being the only controlling owner, with a second controllingowner de"ned as somebody with at least 10% of the voting rights. The idea isthat if such a second party exists, it could be more di$cult for the "rst owner tocontrol the board of directors. However, a large owner who controls more thanhalf of the votes is classi"ed as the single controller. The data show that morethan two-thirds of the sample companies that are not widely held have singleultimate owners. This share is highest in Japan (87.2%) and Korea (76.7%) andlowest in the Philippines (35.8%), Singapore (37.6%), and Thailand (40.1%). Theresults for Thailand, combined with the low use of pyramids and cross-holdings,
S. Claessens et al. / Journal of Financial Economics 58 (2000) 81}112 93
re#ect the importance in Thailand of informal alliances among the smallnumber of families controlling most Thai companies. Often, several families willjointly own a large stake in a corporation, with one family in the alliance takingthe role of primary controlling shareholder; Suehiro (1993) describes interfamilybusiness cooperation in Thailand.
Finally, we study the separation of control and management by investigatingwhether a member of the controlling family or an employee of the controllingwidely held "nancial institution or corporation is the CEO, chairman, honorarychairman, or vice-chairman of the company. It is generally di$cult to "ndwhether a manager is an employee of a controlling "nancial institution orcorporation, although such information does exist in the Stock Exchange guidesof several East Asian companies. It is much easier to "nd family membership,even if the particular manager does not have the same last name. This is becausein all countries we are able to obtain the family trees for the 15 largest familygroups.
The correspondence between control and management in our data is striking(Table 3, last column). On average, about 60% of companies that are not widelyheld have the controlling owner appoint a member of top management. Four-"fths or more of companies in Indonesia, Korea, Malaysia, and Taiwan havemanagers who belong to the controlling group. The correspondence betweencontrol and management is less frequent in Japan and the Philippines, whereless than half of the managers are related to the controlling owner. In Japan, this"nding is consistent with previous sociological studies, which generally concludethat `the Japanese had a tradition of professional management well beforethe Meiji Restoration } before, that is, the country had even embarked onthe industrialization processa (Fukuyama, 1996, p. 329). The latter case is in partexplained by the tendency of Philippine corporations to have interlockingdirectorates and management boards, whereby members of one family wouldserve on the board of directors or management board of companies controlledby other in#uential families (Tan, 1993). The numbers of managers a$liated tothe controlling families are higher than the ones reported in La Porta et al.(1999) because in many cases we have traced family members with di!erent lastnames, and also because smaller companies are more likely to have an ownerwho is also the CEO or the board chairman.
5. Examples of ownership structures
We divide corporations into those that are widely held and those withcontrolling owners. A widely held corporation is a corporation that does nothave any owners with signi"cant control rights. Owners are further divided intofour categories: families, the state, widely held "nancial institutions such asbanks and insurance companies, and widely held corporations. Our de"nition of
94 S. Claessens et al. / Journal of Financial Economics 58 (2000) 81}112
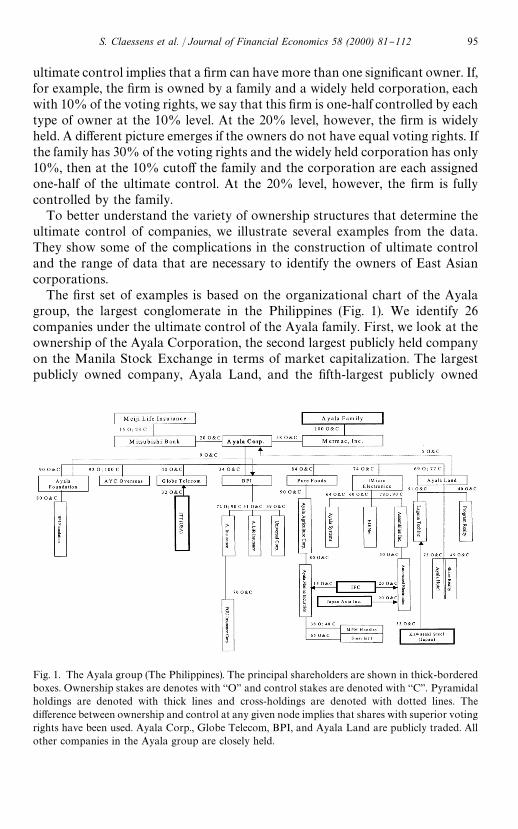
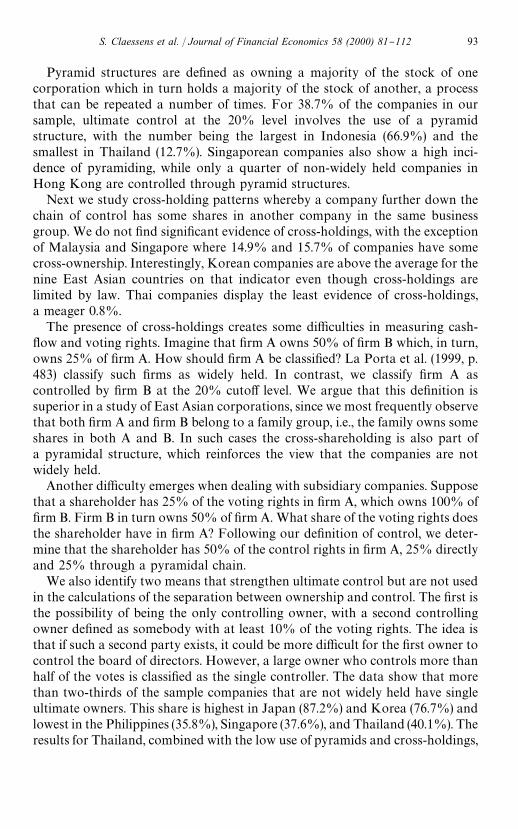
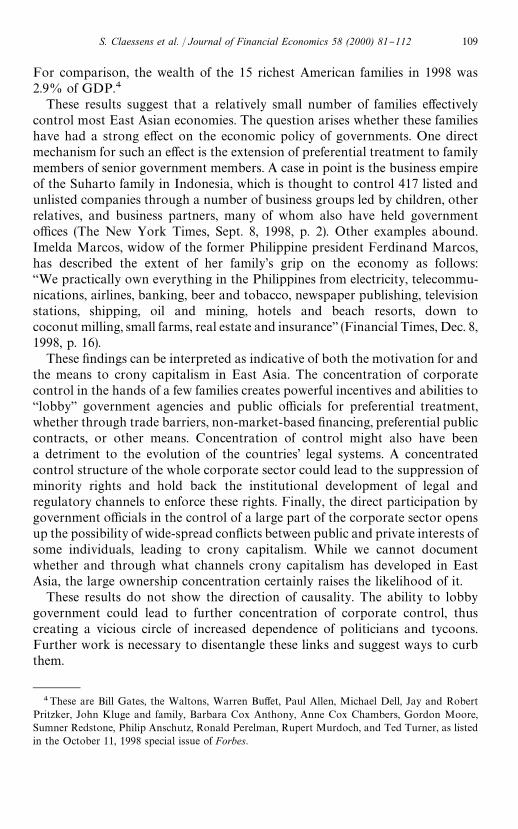
Fig. 1. The Ayala group (The Philippines). The principal shareholders are shown in thick-borderedboxes. Ownership stakes are denotes with `Oa and control stakes are denoted with `Ca. Pyramidalholdings are denoted with thick lines and cross-holdings are denoted with dotted lines. Thedi!erence between ownership and control at any given node implies that shares with superior votingrights have been used. Ayala Corp., Globe Telecom, BPI, and Ayala Land are publicly traded. Allother companies in the Ayala group are closely held.
ultimate control implies that a "rm can have more than one signi"cant owner. If,for example, the "rm is owned by a family and a widely held corporation, eachwith 10% of the voting rights, we say that this "rm is one-half controlled by eachtype of owner at the 10% level. At the 20% level, however, the "rm is widelyheld. A di!erent picture emerges if the owners do not have equal voting rights. Ifthe family has 30% of the voting rights and the widely held corporation has only10%, then at the 10% cuto! the family and the corporation are each assignedone-half of the ultimate control. At the 20% level, however, the "rm is fullycontrolled by the family.
To better understand the variety of ownership structures that determine theultimate control of companies, we illustrate several examples from the data.They show some of the complications in the construction of ultimate controland the range of data that are necessary to identify the owners of East Asiancorporations.
The "rst set of examples is based on the organizational chart of the Ayalagroup, the largest conglomerate in the Philippines (Fig. 1). We identify 26companies under the ultimate control of the Ayala family. First, we look at theownership of the Ayala Corporation, the second largest publicly held companyon the Manila Stock Exchange in terms of market capitalization. The largestpublicly owned company, Ayala Land, and the "fth-largest publicly owned
S. Claessens et al. / Journal of Financial Economics 58 (2000) 81}112 95
3We thank Andrei Shleifer for suggesting this change in the de"nition of ultimate control, i.e.,a shareholder with over half of the voting rights is considered the sole ultimate control holder. Thismakes it easier to identify controlling shareholders in the sample, since small shareholders are moredi$cult to track down.
company, the Bank of the Philippine Islands, also belong to the Ayala conglom-erate. Note that Ayala Corp. has 69% of the cash-#ow rights and 77% of thevoting rights in Ayala Land, which in turn has 5% of the cash-#ow and controlrights of Ayala Corp., an example of cross-holdings between companies in thesame group. The separation between ownership and control of Ayala Corp. isdue to the existence of some shares with superior voting rights. In anotherexample of a cross-holding, Ayala Corp. has 90% of the shares in the AyalaFoundation and 34% of the shares in the BPI, the Bank of the PhilippineIslands; the Ayala Foundation, in turn, has 9% of the shares in the BPI.
The principal owners of the Ayala corporation are the privately held MermacInc., with 58% of the ownership and control rights, and the Mitsubishi Bank,with 20% of ownership and 23% of control. Each other owner of Ayala Corp.has less than 5% of the stock. We next trace the owners of the owners of AyalaCorp. The Ayala family has 100% of the control of Mermac Inc., while MeijiLife Insurance of Japan has 23% control of Mitsubishi Bank. There are no othersigni"cant owners of Mitsubishi Bank. We now say that the ultimate owners ofthe Ayala Corp. are the Ayala family, with 58% of the control rights, and MeijiLife Insurance, with 20% of the control rights. Since the Ayala family has morethan half of the votes, however, it is regarded as the single controlling owner inthe subsequent analysis.3
Next, we study the ultimate control structure of Globe Telecom, anothermember of the Ayala conglomerate. The two principal owners of Globe Telecomare the ITT corporation, with 32% of the ownership and control rights, and theAyala corporation, with 40% of the ownership and control rights. We havealready established that Ayala Corp. is controlled by the Ayala family, with 58%of ownership and control rights. We hence conclude that Globe Telecom hastwo ultimate controllers: the Ayala family with 40% and ITT with 32%. WhileITT has 32% of the cash-#ow rights as well, the Ayalas have only 23.2%, theproduct along the chain of ownership.
Finally, we investigate the ultimate control structure of Automated Elec-tronics (the lower right corner of Fig. 1). Two of the ultimate owners are theInternational Finance Corporation (part of the World Bank Group) and JapanAsia Inc., both widely held corporations that own (and control) 20% of Auto-mated Electronics each. Another 30% of Automated Electronics is owned byAssemblies Inc., which in turn is owned (78%) by IMicro Electronics, which inturn is owned (74%) by the Ayala Corp. We thus determine that AutomatedElectronics has three ultimate owners: the International Finance Corporationwith 20%, Japan Asia Inc. with 20%, and the Ayala family with 30%. While
96 S. Claessens et al. / Journal of Financial Economics 58 (2000) 81}112
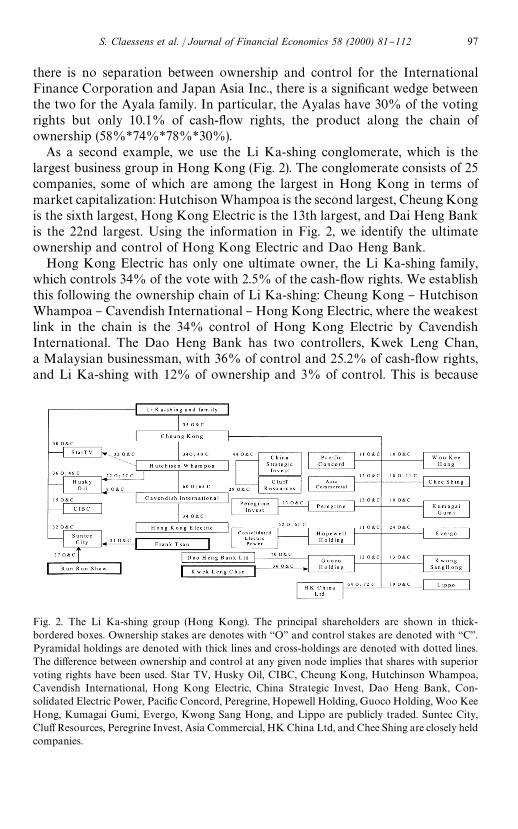
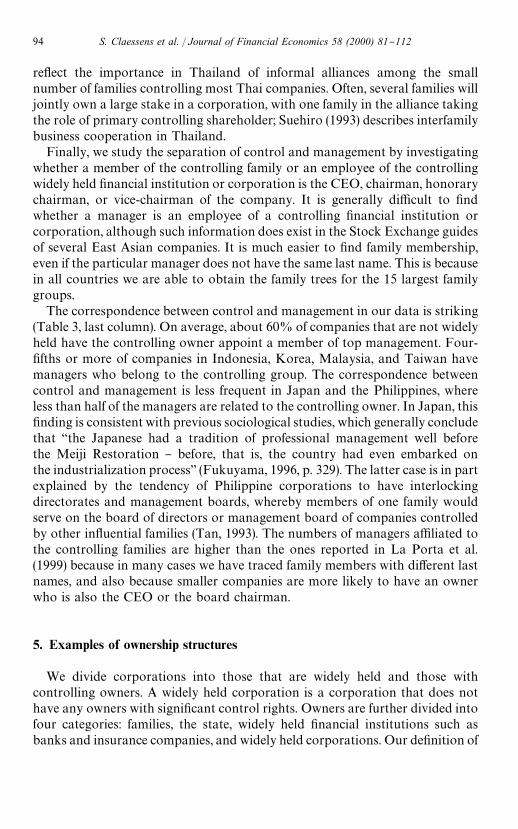
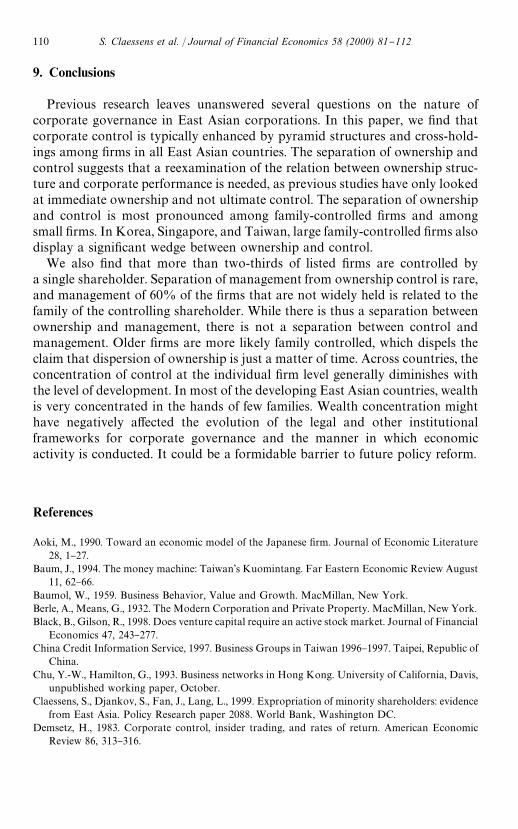
Fig. 2. The Li Ka-shing group (Hong Kong). The principal shareholders are shown in thick-bordered boxes. Ownership stakes are denotes with `Oa and control stakes are denoted with `Ca.Pyramidal holdings are denoted with thick lines and cross-holdings are denoted with dotted lines.The di!erence between ownership and control at any given node implies that shares with superiorvoting rights have been used. Star TV, Husky Oil, CIBC, Cheung Kong, Hutchinson Whampoa,Cavendish International, Hong Kong Electric, China Strategic Invest, Dao Heng Bank, Con-solidated Electric Power, Paci"c Concord, Peregrine, Hopewell Holding, Guoco Holding, Woo KeeHong, Kumagai Gumi, Evergo, Kwong Sang Hong, and Lippo are publicly traded. Suntec City,Clu!Resources, Peregrine Invest, Asia Commercial, HK China Ltd, and Chee Shing are closely heldcompanies.
there is no separation between ownership and control for the InternationalFinance Corporation and Japan Asia Inc., there is a signi"cant wedge betweenthe two for the Ayala family. In particular, the Ayalas have 30% of the votingrights but only 10.1% of cash-#ow rights, the product along the chain ofownership (58%*74%*78%*30%).
As a second example, we use the Li Ka-shing conglomerate, which is thelargest business group in Hong Kong (Fig. 2). The conglomerate consists of 25companies, some of which are among the largest in Hong Kong in terms ofmarket capitalization: Hutchison Whampoa is the second largest, Cheung Kongis the sixth largest, Hong Kong Electric is the 13th largest, and Dai Heng Bankis the 22nd largest. Using the information in Fig. 2, we identify the ultimateownership and control of Hong Kong Electric and Dao Heng Bank.
Hong Kong Electric has only one ultimate owner, the Li Ka-shing family,which controls 34% of the vote with 2.5% of the cash-#ow rights. We establishthis following the ownership chain of Li Ka-shing: Cheung Kong } HutchisonWhampoa } Cavendish International } Hong Kong Electric, where the weakestlink in the chain is the 34% control of Hong Kong Electric by CavendishInternational. The Dao Heng Bank has two controllers, Kwek Leng Chan,a Malaysian businessman, with 36% of control and 25.2% of cash-#ow rights,and Li Ka-shing with 12% of ownership and 3% of control. This is because
S. Claessens et al. / Journal of Financial Economics 58 (2000) 81}112 97
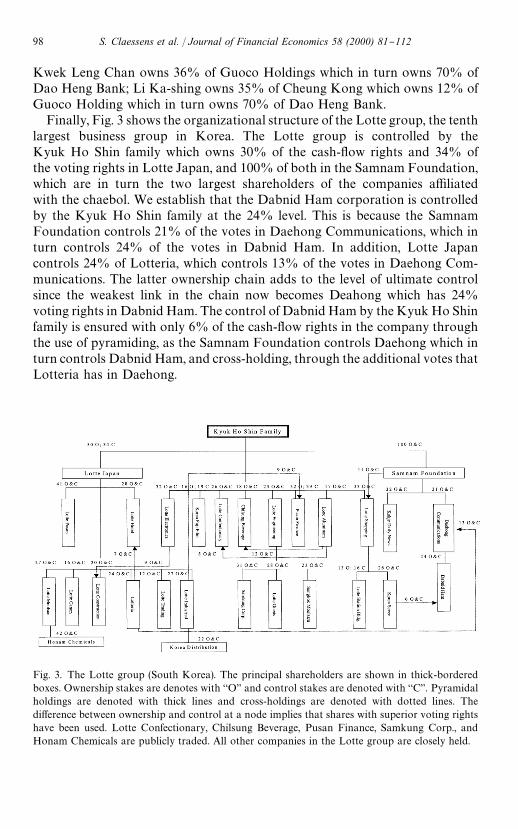
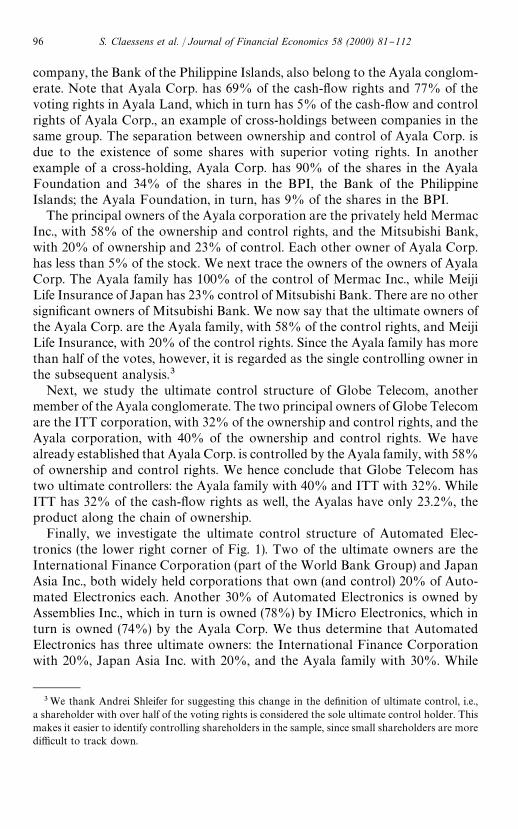
Fig. 3. The Lotte group (South Korea). The principal shareholders are shown in thick-borderedboxes. Ownership stakes are denotes with `Oa and control stakes are denoted with `Ca. Pyramidalholdings are denoted with thick lines and cross-holdings are denoted with dotted lines. Thedi!erence between ownership and control at a node implies that shares with superior voting rightshave been used. Lotte Confectionary, Chilsung Beverage, Pusan Finance, Samkung Corp., andHonam Chemicals are publicly traded. All other companies in the Lotte group are closely held.
Kwek Leng Chan owns 36% of Guoco Holdings which in turn owns 70% ofDao Heng Bank; Li Ka-shing owns 35% of Cheung Kong which owns 12% ofGuoco Holding which in turn owns 70% of Dao Heng Bank.
Finally, Fig. 3 shows the organizational structure of the Lotte group, the tenthlargest business group in Korea. The Lotte group is controlled by theKyuk Ho Shin family which owns 30% of the cash-#ow rights and 34% ofthe voting rights in Lotte Japan, and 100% of both in the Samnam Foundation,which are in turn the two largest shareholders of the companies a$liatedwith the chaebol. We establish that the Dabnid Ham corporation is controlledby the Kyuk Ho Shin family at the 24% level. This is because the SamnamFoundation controls 21% of the votes in Daehong Communications, which inturn controls 24% of the votes in Dabnid Ham. In addition, Lotte Japancontrols 24% of Lotteria, which controls 13% of the votes in Daehong Com-munications. The latter ownership chain adds to the level of ultimate controlsince the weakest link in the chain now becomes Deahong which has 24%voting rights in Dabnid Ham. The control of Dabnid Ham by the Kyuk Ho Shinfamily is ensured with only 6% of the cash-#ow rights in the company throughthe use of pyramiding, as the Samnam Foundation controls Daehong which inturn controls Dabnid Ham, and cross-holding, through the additional votes thatLotteria has in Daehong.
98 S. Claessens et al. / Journal of Financial Economics 58 (2000) 81}112
We also study the ultimate ownership structure of Pusan Finance. The KyukHo Shin family has 32% of the cash-#ow rights and 39% of the voting rights inPusan Finance directly. Lotte Japan has a 27% control of Lotte Industrial,which in turn has a 9% ownership ands control stake in Pusan Finance.Summing up the two chains of ultimate ownership, the controlling family has48% of the control rights in Pusan Finance, while holding only 33% of thecash-#ow rights.
6. The separation of ownership and control
Theory suggests that both cash-#ow and voting rights are important. Crucial-ly, the incentives to expropriate vary with cash-#ow rights (Jensen and Meck-ling, 1976). This section hence focuses on the level of cash-#ow and voting rightsand on the wedge between cash-#ow and voting rights in East Asian corpora-tions. Table 4 reports descriptive statistics on the separation of ultimate cash-#ow and control rights of East Asian corporations in the hands of the largestcontrolling holder, for all companies in which the largest control holder has atleast 5% of the vote. Thai corporations display the most concentrated cash-#owrights, 32.84% on average, followed by Indonesian companies with 25.61% andHong Kong companies with 24.30%. Japanese and Korean corporations havethe least concentration of ownership rights at 6.90% and 13.96%, respectively.A quarter of Thai companies have more than 40% of the cash-#ow rights in thehands of the largest blockholder, while a quarter of Japanese companies haveonly 2% of the cash-#ow rights in the hands of the largest blockholder.
The concentration of control rights in the hands of the largest blockholder issimilar to the concentration of cash-#ow rights, with Thai and Indonesiancompanies having the highest concentration at 35.25% and 33.68%, respective-ly, followed by Malaysian and Hong Kong companies at 28.32% and 28.08%,respectively. The least concentration of control rights is documented in Japan,Korea, and Taiwan (10.33%, 17.78%, and 18.96%, respectively; see Panel B).
Panel C shows the ratio of cash-#ow to control rights. The separation ofownership and control is highest in Japan, Indonesia, and Singapore and lowestin the Philippines and Thailand. For example, the typical large control holder inJapan has ten ultimate votes for each six direct shares held. In contrast, thetypical Thai large control holder has ten ultimate votes for each 9.5 shares held.We further investigate whether the separation of ownership and control variessigni"cantly by type of owner and by "rm size in the next table.
We study the four types of controlling shareholders as de"ned in La Portaet al. (1999). Control is de"ned as 20% voting rights, which is a moreconservative cuto! than the one we use in Table 4. To look at the separationof ownership and control across di!erent sizes of "rms, we use marketcapitalization as a proxy to identify the largest 20, the median 50, and the
S. Claessens et al. / Journal of Financial Economics 58 (2000) 81}112 99
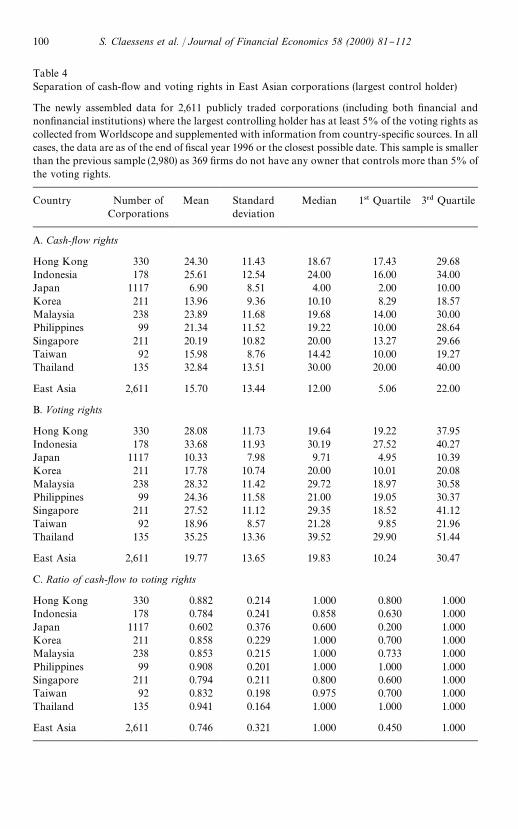
Table 4Separation of cash-#ow and voting rights in East Asian corporations (largest control holder)
The newly assembled data for 2,611 publicly traded corporations (including both "nancial andnon"nancial institutions) where the largest controlling holder has at least 5% of the voting rights ascollected from Worldscope and supplemented with information from country-speci"c sources. In allcases, the data are as of the end of "scal year 1996 or the closest possible date. This sample is smallerthan the previous sample (2,980) as 369 "rms do not have any owner that controls more than 5% ofthe voting rights.
Country Number ofCorporations
Mean Standarddeviation
Median 145 Quartile 33$ Quartile
A. Cash-yow rights
Hong Kong 330 24.30 11.43 18.67 17.43 29.68Indonesia 178 25.61 12.54 24.00 16.00 34.00Japan 1117 6.90 8.51 4.00 2.00 10.00Korea 211 13.96 9.36 10.10 8.29 18.57Malaysia 238 23.89 11.68 19.68 14.00 30.00Philippines 99 21.34 11.52 19.22 10.00 28.64Singapore 211 20.19 10.82 20.00 13.27 29.66Taiwan 92 15.98 8.76 14.42 10.00 19.27Thailand 135 32.84 13.51 30.00 20.00 40.00
East Asia 2,611 15.70 13.44 12.00 5.06 22.00
B. Voting rights
Hong Kong 330 28.08 11.73 19.64 19.22 37.95Indonesia 178 33.68 11.93 30.19 27.52 40.27Japan 1117 10.33 7.98 9.71 4.95 10.39Korea 211 17.78 10.74 20.00 10.01 20.08Malaysia 238 28.32 11.42 29.72 18.97 30.58Philippines 99 24.36 11.58 21.00 19.05 30.37Singapore 211 27.52 11.12 29.35 18.52 41.12Taiwan 92 18.96 8.57 21.28 9.85 21.96Thailand 135 35.25 13.36 39.52 29.90 51.44
East Asia 2,611 19.77 13.65 19.83 10.24 30.47
C. Ratio of cash-yow to voting rights
Hong Kong 330 0.882 0.214 1.000 0.800 1.000Indonesia 178 0.784 0.241 0.858 0.630 1.000Japan 1117 0.602 0.376 0.600 0.200 1.000Korea 211 0.858 0.229 1.000 0.700 1.000Malaysia 238 0.853 0.215 1.000 0.733 1.000Philippines 99 0.908 0.201 1.000 1.000 1.000Singapore 211 0.794 0.211 0.800 0.600 1.000Taiwan 92 0.832 0.198 0.975 0.700 1.000Thailand 135 0.941 0.164 1.000 1.000 1.000
East Asia 2,611 0.746 0.321 1.000 0.450 1.000
100 S. Claessens et al. / Journal of Financial Economics 58 (2000) 81}112
smallest 50 companies in each country sample. The "rst group of companiesrepresent the largest 20 companies on their respective stock markets,whereas the median 50 and the bottom 50 companies in our sample are notnecessarily the median 50 and bottom 50 of all listed corporations in eachcountry. We use the 20}50}50 breakdown for three reasons. First, the largest-20group allows us to replicate the results in La Porta et al. (1999). Second, themedian and small-"rm groups include a larger number of companies and weexpect more variation in control structures across those types of companies.Third, our sample for the Philippines has only 120 companies, and consequentlyit is not possible to make any of the groups larger as they currently cover allPhilippine "rms.
The results show several interesting patterns (Table 5). In all countries butJapan and Singapore, family-controlled "rms have the most separation ofownership and control. Firms controlled by widely held "nancial institutionshave the most separation (0.495) in Japan. State-controlled "rms show the mostseparation among all types of "rms in Singapore (0.685). The latter result isconsistent with La Porta et al. (1999). The pattern across company size is lessclear. Among family-controlled "rms, the largest separation in Hong Kong,Japan, the Philippines, and Thailand occurs in the smallest "rms. In Korea,Singapore, and Taiwan, it is the largest "rms that display the most separation ofownership and control. In Malaysia and Indonesia, medium-size "rms show themost separation.
The separation of ownership and control in state-controlled "rms occurs onlyin Malaysia, the Philippines, and Singapore, and is especially pronounced in thelatter. In all three cases, it is the smallest "rms that display the most separation.The only country that has any signi"cant separation of ownership and controlamong "rms held by "nancial institutions is Japan, and this is only the case formedium- and small-size "rms. Finally, the only country with a measurablewedge between cash-#ow and voting rights in "rms controlled by widely heldcorporations is Malaysia. The largest separation (0.789) again occurs in small"rms.
In summary, the evidence suggests that "rms controlled by families are mostlikely to have separation between ownership and control. Small "rms are mostlikely to have a larger wedge between cash-#ow and control rights, regardless ofthe type of ownership. In three countries (Korea, Singapore, and Taiwan),families seem to use mechanisms to separate ownership and control in large"rms. These results are robust to the 10% de"nition of ultimate control.
7. What determines the concentration of control?
From a corporate governance standpoint, the concentration of voting rightsis crucial, as it enables owners to determine dividend policies, investment
S. Claessens et al. / Journal of Financial Economics 58 (2000) 81}112 101
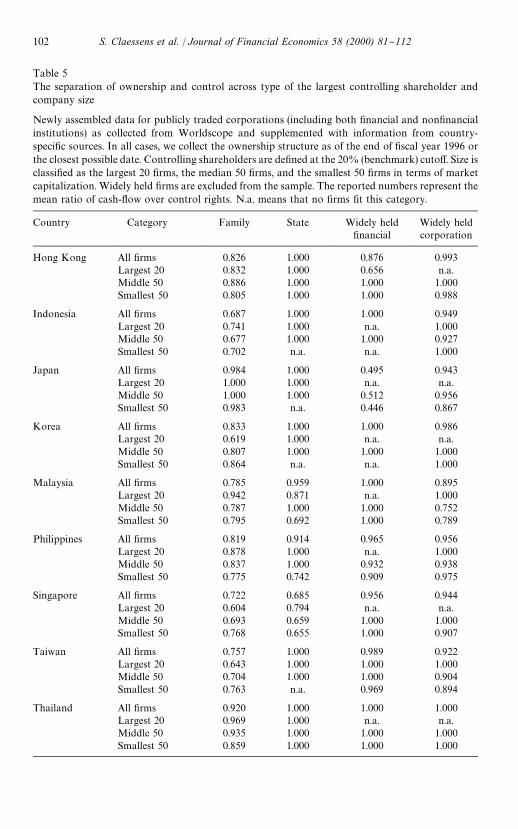
Table 5The separation of ownership and control across type of the largest controlling shareholder andcompany size
Newly assembled data for publicly traded corporations (including both "nancial and non"nancialinstitutions) as collected from Worldscope and supplemented with information from country-speci"c sources. In all cases, we collect the ownership structure as of the end of "scal year 1996 orthe closest possible date. Controlling shareholders are de"ned at the 20% (benchmark) cuto!. Size isclassi"ed as the largest 20 "rms, the median 50 "rms, and the smallest 50 "rms in terms of marketcapitalization. Widely held "rms are excluded from the sample. The reported numbers represent themean ratio of cash-#ow over control rights. N.a. means that no "rms "t this category.
Country Category Family State Widely held"nancial
Widely heldcorporation
Hong Kong All "rms 0.826 1.000 0.876 0.993Largest 20 0.832 1.000 0.656 n.a.Middle 50 0.886 1.000 1.000 1.000Smallest 50 0.805 1.000 1.000 0.988
Indonesia All "rms 0.687 1.000 1.000 0.949Largest 20 0.741 1.000 n.a. 1.000Middle 50 0.677 1.000 1.000 0.927Smallest 50 0.702 n.a. n.a. 1.000
Japan All "rms 0.984 1.000 0.495 0.943Largest 20 1.000 1.000 n.a. n.a.Middle 50 1.000 1.000 0.512 0.956Smallest 50 0.983 n.a. 0.446 0.867
Korea All "rms 0.833 1.000 1.000 0.986Largest 20 0.619 1.000 n.a. n.a.Middle 50 0.807 1.000 1.000 1.000Smallest 50 0.864 n.a. n.a. 1.000
Malaysia All "rms 0.785 0.959 1.000 0.895Largest 20 0.942 0.871 n.a. 1.000Middle 50 0.787 1.000 1.000 0.752Smallest 50 0.795 0.692 1.000 0.789
Philippines All "rms 0.819 0.914 0.965 0.956Largest 20 0.878 1.000 n.a. 1.000Middle 50 0.837 1.000 0.932 0.938Smallest 50 0.775 0.742 0.909 0.975
Singapore All "rms 0.722 0.685 0.956 0.944Largest 20 0.604 0.794 n.a. n.a.Middle 50 0.693 0.659 1.000 1.000Smallest 50 0.768 0.655 1.000 0.907
Taiwan All "rms 0.757 1.000 0.989 0.922Largest 20 0.643 1.000 1.000 1.000Middle 50 0.704 1.000 1.000 0.904Smallest 50 0.763 n.a. 0.969 0.894
Thailand All "rms 0.920 1.000 1.000 1.000Largest 20 0.969 1.000 n.a. n.a.Middle 50 0.935 1.000 1.000 1.000Smallest 50 0.859 1.000 1.000 1.000
102 S. Claessens et al. / Journal of Financial Economics 58 (2000) 81}112
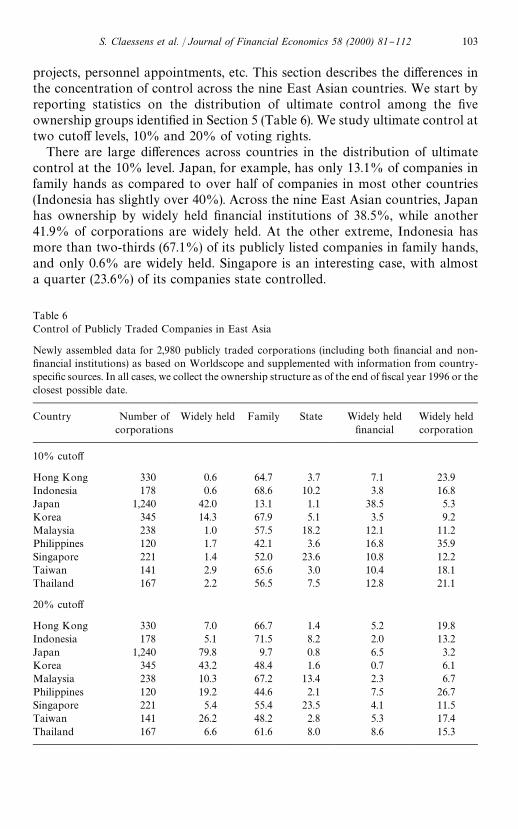
Table 6Control of Publicly Traded Companies in East Asia
Newly assembled data for 2,980 publicly traded corporations (including both "nancial and non-"nancial institutions) as based on Worldscope and supplemented with information from country-speci"c sources. In all cases, we collect the ownership structure as of the end of "scal year 1996 or theclosest possible date.
Country Number ofcorporations
Widely held Family State Widely held"nancial
Widely heldcorporation
10% cuto!
Hong Kong 330 0.6 64.7 3.7 7.1 23.9Indonesia 178 0.6 68.6 10.2 3.8 16.8Japan 1,240 42.0 13.1 1.1 38.5 5.3Korea 345 14.3 67.9 5.1 3.5 9.2Malaysia 238 1.0 57.5 18.2 12.1 11.2Philippines 120 1.7 42.1 3.6 16.8 35.9Singapore 221 1.4 52.0 23.6 10.8 12.2Taiwan 141 2.9 65.6 3.0 10.4 18.1Thailand 167 2.2 56.5 7.5 12.8 21.1
20% cuto!
Hong Kong 330 7.0 66.7 1.4 5.2 19.8Indonesia 178 5.1 71.5 8.2 2.0 13.2Japan 1,240 79.8 9.7 0.8 6.5 3.2Korea 345 43.2 48.4 1.6 0.7 6.1Malaysia 238 10.3 67.2 13.4 2.3 6.7Philippines 120 19.2 44.6 2.1 7.5 26.7Singapore 221 5.4 55.4 23.5 4.1 11.5Taiwan 141 26.2 48.2 2.8 5.3 17.4Thailand 167 6.6 61.6 8.0 8.6 15.3
projects, personnel appointments, etc. This section describes the di!erences inthe concentration of control across the nine East Asian countries. We start byreporting statistics on the distribution of ultimate control among the "veownership groups identi"ed in Section 5 (Table 6). We study ultimate control attwo cuto! levels, 10% and 20% of voting rights.
There are large di!erences across countries in the distribution of ultimatecontrol at the 10% level. Japan, for example, has only 13.1% of companies infamily hands as compared to over half of companies in most other countries(Indonesia has slightly over 40%). Across the nine East Asian countries, Japanhas ownership by widely held "nancial institutions of 38.5%, while another41.9% of corporations are widely held. At the other extreme, Indonesia hasmore than two-thirds (67.1%) of its publicly listed companies in family hands,and only 0.6% are widely held. Singapore is an interesting case, with almosta quarter (23.6%) of its companies state controlled.
S. Claessens et al. / Journal of Financial Economics 58 (2000) 81}112 103
At the 20% (benchmark) cuto! level the di!erences across countries widen.Fewer than one-tenth of Japanese companies (9.7%) are now controlled byfamilies, while almost four-"fths (79.8%) are widely held. This drop in familycontrol arises as many Japanese companies have family ownership between10% and 20%. At a threshold of 20%, these corporations are de"ned as widelyheld. An even more dramatic change takes place in Korea, where family controldrops from 67.9% to 48.4%, and in Taiwan, where family control decreases from65.6% to 48.2%. In the Indonesian sample, the share of family control increasesat the expense of state, widely held "nancial, and widely held corporate control.A similar but even more pronounced pattern can be observed for Thailand,where family control increases from 50.8% to 61.6%, and Malaysia, wherefamily control increases from 57.7% to 67.2%. The most stable control structurebetween these two cuto! levels is observed in the Philippines and Singapore.
Some of the di!erences in the concentration of control likely arise fromvariations in company laws across countries. For example, di!erences in min-imum percentages in shareholdings required for blocking major decisions or theminimum percentages required to entitle a shareholder to call an extraordinaryshareholders' meeting are important in determining the minimum shareholderstake necessary to exercise e!ective control. Other rules also a!ect the size ofownership necessary to exercise e!ective control. In Korea, for example, restric-tions on the voting rights of institutional investors in listed companies and pasthigh minimum percentages required to "le class-action suits imply that relative-ly low ownership stakes can result in e!ective control. In four of the ninecountries (Hong Kong, Japan, Korea, and Singapore) there are limits to theshare of ownership that banks can have in other companies, while such owner-ship is not permitted in Indonesia at all (Institute of International Bankers,1997). It is not surprising then that the role of widely held "nancial institutions isgreatly diminished at the 20% level for all countries.
Overall, the concentration of control seems to diminish with the level ofeconomic development of the country. Japan has the largest share of widely held"rms, followed by Korea and Taiwan. Indonesia and Thailand have the smallestshare of widely held "rms, together with Singapore. Given the small number ofcountries in the sample, however, the robustness of this "nding is limited.
The di!erences in concentration of control within a country could be relatedto "rm-speci"c variables like age and size. Some previous papers (e.g., Black andGilson, 1998) argue that younger companies are more likely to have concen-trated ownership, while older companies are more frequently widely held.Anecdotally, this argument holds some appeal if one were to look at the U.S.market where the recent new listings of technology-related companies hasincreased the number of companies with controlling owners. Microsoft has oneultimate owner, Bill Gates, with 24% of the stock; so does Yahoo!, where theJapanese entrepreneur Masayoshi Son has 29% of the voting rights. Theseexamples suggest a life-cycle story of concentrated ownership. One might also
104 S. Claessens et al. / Journal of Financial Economics 58 (2000) 81}112
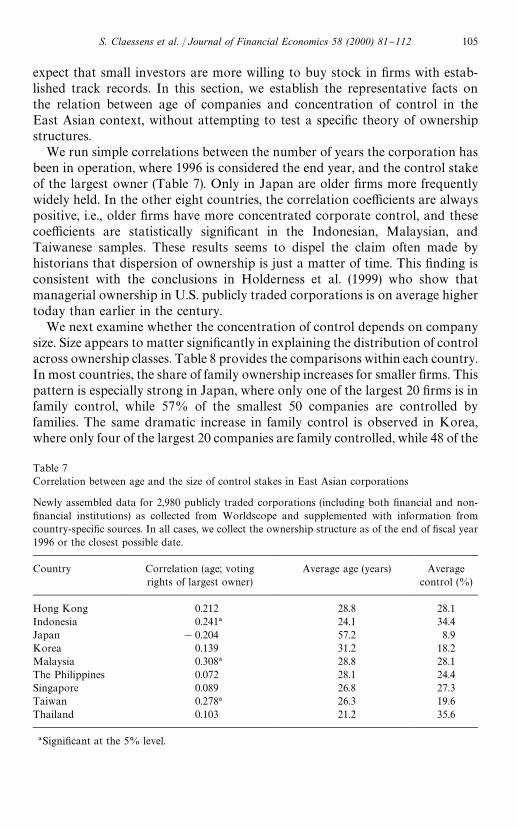
Table 7Correlation between age and the size of control stakes in East Asian corporations
Newly assembled data for 2,980 publicly traded corporations (including both "nancial and non-"nancial institutions) as collected from Worldscope and supplemented with information fromcountry-speci"c sources. In all cases, we collect the ownership structure as of the end of "scal year1996 or the closest possible date.
Country Correlation (age; votingrights of largest owner)
Average age (years) Averagecontrol (%)
Hong Kong 0.212 28.8 28.1Indonesia 0.241! 24.1 34.4Japan !0.204 57.2 8.9Korea 0.139 31.2 18.2Malaysia 0.308! 28.8 28.1The Philippines 0.072 28.1 24.4Singapore 0.089 26.8 27.3Taiwan 0.278! 26.3 19.6Thailand 0.103 21.2 35.6
!Signi"cant at the 5% level.
expect that small investors are more willing to buy stock in "rms with estab-lished track records. In this section, we establish the representative facts onthe relation between age of companies and concentration of control in theEast Asian context, without attempting to test a speci"c theory of ownershipstructures.
We run simple correlations between the number of years the corporation hasbeen in operation, where 1996 is considered the end year, and the control stakeof the largest owner (Table 7). Only in Japan are older "rms more frequentlywidely held. In the other eight countries, the correlation coe$cients are alwayspositive, i.e., older "rms have more concentrated corporate control, and thesecoe$cients are statistically signi"cant in the Indonesian, Malaysian, andTaiwanese samples. These results seems to dispel the claim often made byhistorians that dispersion of ownership is just a matter of time. This "nding isconsistent with the conclusions in Holderness et al. (1999) who show thatmanagerial ownership in U.S. publicly traded corporations is on average highertoday than earlier in the century.
We next examine whether the concentration of control depends on companysize. Size appears to matter signi"cantly in explaining the distribution of controlacross ownership classes. Table 8 provides the comparisons within each country.In most countries, the share of family ownership increases for smaller "rms. Thispattern is especially strong in Japan, where only one of the largest 20 "rms is infamily control, while 57% of the smallest 50 companies are controlled byfamilies. The same dramatic increase in family control is observed in Korea,where only four of the largest 20 companies are family controlled, while 48 of the
S. Claessens et al. / Journal of Financial Economics 58 (2000) 81}112 105
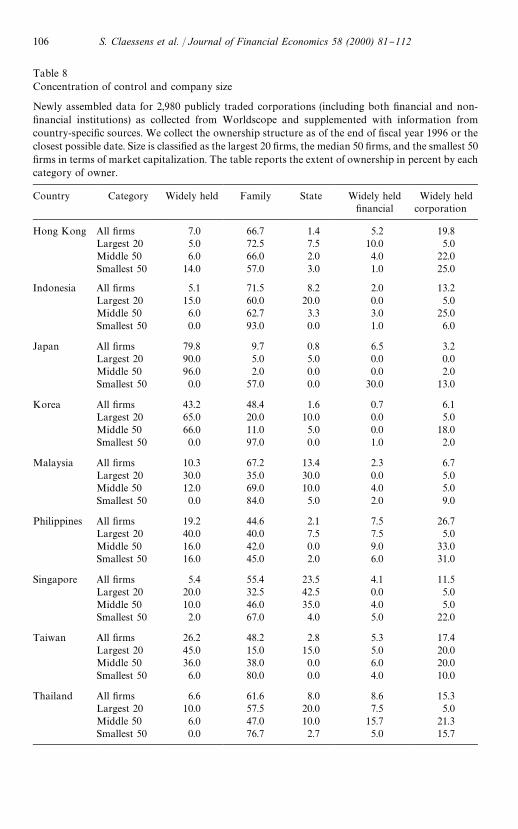
Table 8Concentration of control and company size
Newly assembled data for 2,980 publicly traded corporations (including both "nancial and non-"nancial institutions) as collected from Worldscope and supplemented with information fromcountry-speci"c sources. We collect the ownership structure as of the end of "scal year 1996 or theclosest possible date. Size is classi"ed as the largest 20 "rms, the median 50 "rms, and the smallest 50"rms in terms of market capitalization. The table reports the extent of ownership in percent by eachcategory of owner.
Country Category Widely held Family State Widely held"nancial
Widely heldcorporation
Hong Kong All "rms 7.0 66.7 1.4 5.2 19.8Largest 20 5.0 72.5 7.5 10.0 5.0Middle 50 6.0 66.0 2.0 4.0 22.0Smallest 50 14.0 57.0 3.0 1.0 25.0
Indonesia All "rms 5.1 71.5 8.2 2.0 13.2Largest 20 15.0 60.0 20.0 0.0 5.0Middle 50 6.0 62.7 3.3 3.0 25.0Smallest 50 0.0 93.0 0.0 1.0 6.0
Japan All "rms 79.8 9.7 0.8 6.5 3.2Largest 20 90.0 5.0 5.0 0.0 0.0Middle 50 96.0 2.0 0.0 0.0 2.0Smallest 50 0.0 57.0 0.0 30.0 13.0
Korea All "rms 43.2 48.4 1.6 0.7 6.1Largest 20 65.0 20.0 10.0 0.0 5.0Middle 50 66.0 11.0 5.0 0.0 18.0Smallest 50 0.0 97.0 0.0 1.0 2.0
Malaysia All "rms 10.3 67.2 13.4 2.3 6.7Largest 20 30.0 35.0 30.0 0.0 5.0Middle 50 12.0 69.0 10.0 4.0 5.0Smallest 50 0.0 84.0 5.0 2.0 9.0
Philippines All "rms 19.2 44.6 2.1 7.5 26.7Largest 20 40.0 40.0 7.5 7.5 5.0Middle 50 16.0 42.0 0.0 9.0 33.0Smallest 50 16.0 45.0 2.0 6.0 31.0
Singapore All "rms 5.4 55.4 23.5 4.1 11.5Largest 20 20.0 32.5 42.5 0.0 5.0Middle 50 10.0 46.0 35.0 4.0 5.0Smallest 50 2.0 67.0 4.0 5.0 22.0
Taiwan All "rms 26.2 48.2 2.8 5.3 17.4Largest 20 45.0 15.0 15.0 5.0 20.0Middle 50 36.0 38.0 0.0 6.0 20.0Smallest 50 6.0 80.0 0.0 4.0 10.0
Thailand All "rms 6.6 61.6 8.0 8.6 15.3Largest 20 10.0 57.5 20.0 7.5 5.0Middle 50 6.0 47.0 10.0 15.7 21.3Smallest 50 0.0 76.7 2.7 5.0 15.7
106 S. Claessens et al. / Journal of Financial Economics 58 (2000) 81}112
smallest 50 companies fall into that category. The magnitude of the increase offamily control in smaller companies is similar in Taiwan, from 15% to 80% ofthe sample. In Indonesia, Malaysia, the Philippines, Singapore, and Thailand,the same pattern is present, although it is not as strong, as many large com-panies are also controlled by families. The exception is Hong Kong, where aboutthree-fourths of the largest 20 companies are under family control, while fewerthan 60% of the smallest 50 companies are in the same category.
These statistics also show that the majority of large and medium-sizeJapanese and Korean corporations are widely held. All bottom 50 companieshave ultimate owners, however. In contrast, there is much less variation ofcontrol structures across company size in the Philippines, although this resultcould be driven by the smaller sample in that country. In all other countries,widely held corporations are the exception for small corporations, but less so forlarge and medium-size corporations.
When comparing our results for the largest 20 companies with La Porta et al.(1999), we must focus on Hong Kong, Japan, Korea, and Singapore, the EastAsian countries reported in both studies. We obtain identical results for Japanand Singapore, while the di!erences in Hong Kong and Korea are within 5% ofownership. This implies that the data on corporate ownership across East Asiaare fairly robust.
8. Evidence of crony capitalism
So far we have investigated the incidence of ultimate control at the level of theindividual "rm. Perhaps a more meaningful unit of analysis, particularly if weare concerned with issues of market entry, access to "nancing, and governmentpolicy, is the concentration of control of corporate assets in the hands of one ormore family groups. We therefore calculate the number of "rms in the samplecontrolled by a single family (Table 9). Indonesia stands out with the largestnumber of companies controlled by a single family, more than four on average.Japan has the fewest, with each family controlling approximately one company.
These numbers already suggest that the control of listed corporate assets restsin the hands of a small number of families in countries like Indonesia, thePhilippines, and Hong Kong. This can be further demonstrated by calculatingthe value of total assets controlled by the largest family groups in each country.We adjust the value of assets held by each family group by assuming that the"rms missing from our sample are not controlled by any of the largest 15families. For example, the largest "ve families in the Philippines control 52.2%of the market capitalization in our sample. Since the sample "rms represent 82%of total market capitalization in the Philippines (Table 2), we reach an adjusted"gure of 42.8% (52.2%*82%) for the control holdings of the largest "ve families.At the extreme, 16.6% and 17.1% of total market capitalization in Indonesia
S. Claessens et al. / Journal of Financial Economics 58 (2000) 81}112 107
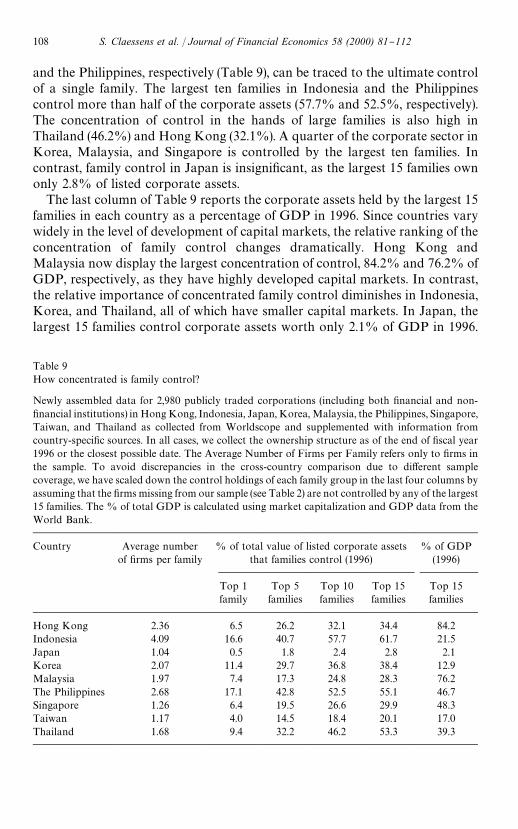
Table 9How concentrated is family control?
Newly assembled data for 2,980 publicly traded corporations (including both "nancial and non-"nancial institutions) in Hong Kong, Indonesia, Japan, Korea, Malaysia, the Philippines, Singapore,Taiwan, and Thailand as collected from Worldscope and supplemented with information fromcountry-speci"c sources. In all cases, we collect the ownership structure as of the end of "scal year1996 or the closest possible date. The Average Number of Firms per Family refers only to "rms inthe sample. To avoid discrepancies in the cross-country comparison due to di!erent samplecoverage, we have scaled down the control holdings of each family group in the last four columns byassuming that the "rms missing from our sample (see Table 2) are not controlled by any of the largest15 families. The % of total GDP is calculated using market capitalization and GDP data from theWorld Bank.
Country Average numberof "rms per family
% of total value of listed corporate assetsthat families control (1996)
% of GDP(1996)
Top 1family
Top 5families
Top 10families
Top 15families
Top 15families
Hong Kong 2.36 6.5 26.2 32.1 34.4 84.2Indonesia 4.09 16.6 40.7 57.7 61.7 21.5Japan 1.04 0.5 1.8 2.4 2.8 2.1Korea 2.07 11.4 29.7 36.8 38.4 12.9Malaysia 1.97 7.4 17.3 24.8 28.3 76.2The Philippines 2.68 17.1 42.8 52.5 55.1 46.7Singapore 1.26 6.4 19.5 26.6 29.9 48.3Taiwan 1.17 4.0 14.5 18.4 20.1 17.0Thailand 1.68 9.4 32.2 46.2 53.3 39.3
and the Philippines, respectively (Table 9), can be traced to the ultimate controlof a single family. The largest ten families in Indonesia and the Philippinescontrol more than half of the corporate assets (57.7% and 52.5%, respectively).The concentration of control in the hands of large families is also high inThailand (46.2%) and Hong Kong (32.1%). A quarter of the corporate sector inKorea, Malaysia, and Singapore is controlled by the largest ten families. Incontrast, family control in Japan is insigni"cant, as the largest 15 families ownonly 2.8% of listed corporate assets.
The last column of Table 9 reports the corporate assets held by the largest 15families in each country as a percentage of GDP in 1996. Since countries varywidely in the level of development of capital markets, the relative ranking of theconcentration of family control changes dramatically. Hong Kong andMalaysia now display the largest concentration of control, 84.2% and 76.2% ofGDP, respectively, as they have highly developed capital markets. In contrast,the relative importance of concentrated family control diminishes in Indonesia,Korea, and Thailand, all of which have smaller capital markets. In Japan, thelargest 15 families control corporate assets worth only 2.1% of GDP in 1996.
108 S. Claessens et al. / Journal of Financial Economics 58 (2000) 81}112
4These are Bill Gates, the Waltons, Warren Bu!et, Paul Allen, Michael Dell, Jay and RobertPritzker, John Kluge and family, Barbara Cox Anthony, Anne Cox Chambers, Gordon Moore,Sumner Redstone, Philip Anschutz, Ronald Perelman, Rupert Murdoch, and Ted Turner, as listedin the October 11, 1998 special issue of Forbes.
For comparison, the wealth of the 15 richest American families in 1998 was2.9% of GDP.4
These results suggest that a relatively small number of families e!ectivelycontrol most East Asian economies. The question arises whether these familieshave had a strong e!ect on the economic policy of governments. One directmechanism for such an e!ect is the extension of preferential treatment to familymembers of senior government members. A case in point is the business empireof the Suharto family in Indonesia, which is thought to control 417 listed andunlisted companies through a number of business groups led by children, otherrelatives, and business partners, many of whom also have held governmento$ces (The New York Times, Sept. 8, 1998, p. 2). Other examples abound.Imelda Marcos, widow of the former Philippine president Ferdinand Marcos,has described the extent of her family's grip on the economy as follows:`We practically own everything in the Philippines from electricity, telecommu-nications, airlines, banking, beer and tobacco, newspaper publishing, televisionstations, shipping, oil and mining, hotels and beach resorts, down tococonut milling, small farms, real estate and insurancea (Financial Times, Dec. 8,1998, p. 16).
These "ndings can be interpreted as indicative of both the motivation for andthe means to crony capitalism in East Asia. The concentration of corporatecontrol in the hands of a few families creates powerful incentives and abilities to`lobbya government agencies and public o$cials for preferential treatment,whether through trade barriers, non-market-based "nancing, preferential publiccontracts, or other means. Concentration of control might also have beena detriment to the evolution of the countries' legal systems. A concentratedcontrol structure of the whole corporate sector could lead to the suppression ofminority rights and hold back the institutional development of legal andregulatory channels to enforce these rights. Finally, the direct participation bygovernment o$cials in the control of a large part of the corporate sector opensup the possibility of wide-spread con#icts between public and private interests ofsome individuals, leading to crony capitalism. While we cannot documentwhether and through what channels crony capitalism has developed in EastAsia, the large ownership concentration certainly raises the likelihood of it.
These results do not show the direction of causality. The ability to lobbygovernment could lead to further concentration of corporate control, thuscreating a vicious circle of increased dependence of politicians and tycoons.Further work is necessary to disentangle these links and suggest ways to curbthem.
S. Claessens et al. / Journal of Financial Economics 58 (2000) 81}112 109
9. Conclusions
Previous research leaves unanswered several questions on the nature ofcorporate governance in East Asian corporations. In this paper, we "nd thatcorporate control is typically enhanced by pyramid structures and cross-hold-ings among "rms in all East Asian countries. The separation of ownership andcontrol suggests that a reexamination of the relation between ownership struc-ture and corporate performance is needed, as previous studies have only lookedat immediate ownership and not ultimate control. The separation of ownershipand control is most pronounced among family-controlled "rms and amongsmall "rms. In Korea, Singapore, and Taiwan, large family-controlled "rms alsodisplay a signi"cant wedge between ownership and control.
We also "nd that more than two-thirds of listed "rms are controlled bya single shareholder. Separation of management from ownership control is rare,and management of 60% of the "rms that are not widely held is related to thefamily of the controlling shareholder. While there is thus a separation betweenownership and management, there is not a separation between control andmanagement. Older "rms are more likely family controlled, which dispels theclaim that dispersion of ownership is just a matter of time. Across countries, theconcentration of control at the individual "rm level generally diminishes withthe level of development. In most of the developing East Asian countries, wealthis very concentrated in the hands of few families. Wealth concentration mighthave negatively a!ected the evolution of the legal and other institutionalframeworks for corporate governance and the manner in which economicactivity is conducted. It could be a formidable barrier to future policy reform.
References
Aoki, M., 1990. Toward an economic model of the Japanese "rm. Journal of Economic Literature28, 1}27.
Baum, J., 1994. The money machine: Taiwan's Kuomintang. Far Eastern Economic Review August11, 62}66.
Baumol, W., 1959. Business Behavior, Value and Growth. MacMillan, New York.Berle, A., Means, G., 1932. The Modern Corporation and Private Property. MacMillan, New York.Black, B., Gilson, R., 1998. Does venture capital require an active stock market. Journal of Financial
Economics 47, 243}277.China Credit Information Service, 1997. Business Groups in Taiwan 1996}1997. Taipei, Republic of
China.Chu, Y.-W., Hamilton, G., 1993. Business networks in Hong Kong. University of California, Davis,
unpublished working paper, October.Claessens, S., Djankov, S., Fan, J., Lang, L., 1999. Expropriation of minority shareholders: evidence
from East Asia. Policy Research paper 2088. World Bank, Washington DC.Demsetz, H., 1983. Corporate control, insider trading, and rates of return. American Economic
Review 86, 313}316.
110 S. Claessens et al. / Journal of Financial Economics 58 (2000) 81}112
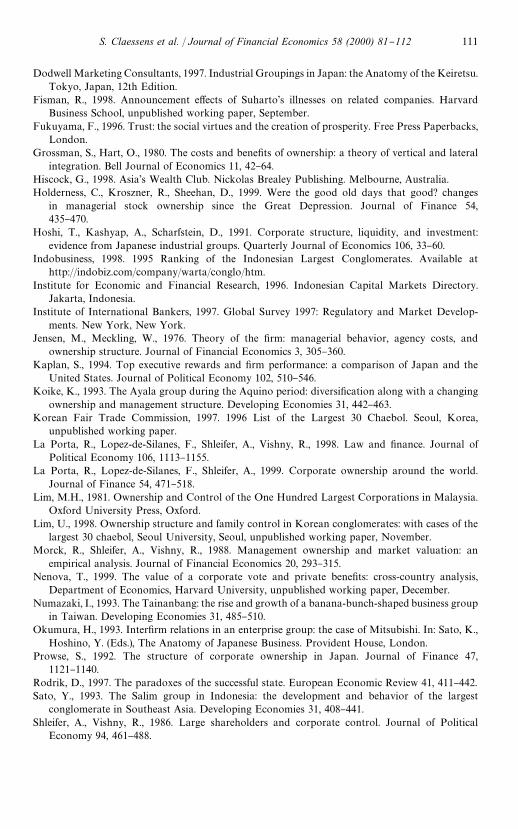
Dodwell Marketing Consultants, 1997. Industrial Groupings in Japan: the Anatomy of the Keiretsu.Tokyo, Japan, 12th Edition.
Fisman, R., 1998. Announcement e!ects of Suharto's illnesses on related companies. HarvardBusiness School, unpublished working paper, September.
Fukuyama, F., 1996. Trust: the social virtues and the creation of prosperity. Free Press Paperbacks,London.
Grossman, S., Hart, O., 1980. The costs and bene"ts of ownership: a theory of vertical and lateralintegration. Bell Journal of Economics 11, 42}64.
Hiscock, G., 1998. Asia's Wealth Club. Nickolas Brealey Publishing. Melbourne, Australia.Holderness, C., Kroszner, R., Sheehan, D., 1999. Were the good old days that good? changes
in managerial stock ownership since the Great Depression. Journal of Finance 54,435}470.
Hoshi, T., Kashyap, A., Scharfstein, D., 1991. Corporate structure, liquidity, and investment:evidence from Japanese industrial groups. Quarterly Journal of Economics 106, 33}60.
Indobusiness, 1998. 1995 Ranking of the Indonesian Largest Conglomerates. Available athttp://indobiz.com/company/warta/conglo/htm.
Institute for Economic and Financial Research, 1996. Indonesian Capital Markets Directory.Jakarta, Indonesia.
Institute of International Bankers, 1997. Global Survey 1997: Regulatory and Market Develop-ments. New York, New York.
Jensen, M., Meckling, W., 1976. Theory of the "rm: managerial behavior, agency costs, andownership structure. Journal of Financial Economics 3, 305}360.
Kaplan, S., 1994. Top executive rewards and "rm performance: a comparison of Japan and theUnited States. Journal of Political Economy 102, 510}546.
Koike, K., 1993. The Ayala group during the Aquino period: diversi"cation along with a changingownership and management structure. Developing Economies 31, 442}463.
Korean Fair Trade Commission, 1997. 1996 List of the Largest 30 Chaebol. Seoul, Korea,unpublished working paper.
La Porta, R., Lopez-de-Silanes, F., Shleifer, A., Vishny, R., 1998. Law and "nance. Journal ofPolitical Economy 106, 1113}1155.
La Porta, R., Lopez-de-Silanes, F., Shleifer, A., 1999. Corporate ownership around the world.Journal of Finance 54, 471}518.
Lim, M.H., 1981. Ownership and Control of the One Hundred Largest Corporations in Malaysia.Oxford University Press, Oxford.
Lim, U., 1998. Ownership structure and family control in Korean conglomerates: with cases of thelargest 30 chaebol, Seoul University, Seoul, unpublished working paper, November.
Morck, R., Shleifer, A., Vishny, R., 1988. Management ownership and market valuation: anempirical analysis. Journal of Financial Economics 20, 293}315.
Nenova, T., 1999. The value of a corporate vote and private bene"ts: cross-country analysis,Department of Economics, Harvard University, unpublished working paper, December.
Numazaki, I., 1993. The Tainanbang: the rise and growth of a banana-bunch-shaped business groupin Taiwan. Developing Economies 31, 485}510.
Okumura, H., 1993. Inter"rm relations in an enterprise group: the case of Mitsubishi. In: Sato, K.,Hoshino, Y. (Eds.), The Anatomy of Japanese Business. Provident House, London.
Prowse, S., 1992. The structure of corporate ownership in Japan. Journal of Finance 47,1121}1140.
Rodrik, D., 1997. The paradoxes of the successful state. European Economic Review 41, 411}442.Sato, Y., 1993. The Salim group in Indonesia: the development and behavior of the largest
conglomerate in Southeast Asia. Developing Economies 31, 408}441.Shleifer, A., Vishny, R., 1986. Large shareholders and corporate control. Journal of Political
Economy 94, 461}488.
S. Claessens et al. / Journal of Financial Economics 58 (2000) 81}112 111
Suehiro, A., 1993. Family business reassessed: corporate structure and late-starting industrializationin Thailand. Developing Economies 31, 378}407.
Tan, E., 1993. Interlocking directorates, commercial banks, other "nancial institutions, and non-"nancial corporations. Philippine Review of Economics and Business 30, 1}50.
Taniura, T., 1989. Management in Taiwan: the case of the Formosa plastics group. East AsianCultural Studies 28, 21}46.
Taniura, T., 1993. The Lucky Goldstar group in the Republic of Korea. Developing Economies 31,465}484.
Tara Siam Company, 1997. Thai Business Groups 1996}1997: A Unique Guide to Who Owns What.Bangkok, Thailand.
Taylor, M., 1998. Have cash, will travel: Hong Kong is no longer big enough for property tycoon LiKa-Shing. Far Eastern Economic Review March 5, 56}60.
Vatikiotis, M., 1997. From chicken to microchips: Thailand's Dhanin Chearavanont. Far EasternEconomic Review January 23, 38}43.
W. I. Carr Banque Indosuez Group, 1997. Indonesian Group Connections. Jakarta, Indonesia.
112 S. Claessens et al. / Journal of Financial Economics 58 (2000) 81}112