the semiconductor industry - european investment · pdf filethe semiconductor industry :...
TRANSCRIPT

THE SEMICONDUCTOR INDUSTRY:
REVIEW OF THE SECTOR AND
FINANCING OPPORTUNITIES
by:
HARALD GRUBER
*^ίί|/Α
EUROPEAN INVESTMENTBANK

The Semiconductor Industry : Review of the Sector and Financing Opportunities
Executive summary
The semiconductor industry is cyclical and it has a growth trend of 15% per year. Promoters operating in this sector face substantial risk because individual projects are big (a greenfield plant costs about ECU 1 bn) and depreciation is rapid (most of the investment, i.e. machinery and equipment, is technologically obsolete within 5 years).
The European semiconductor industry is undergoing structural change. As a result of foreign direct investment and the renewed international competitiveness of European companies, Europe is reducing the trade deficit in semiconductors. Although substantial new capacity should come on stream during the next few years, the risk of structural overcapacity in Europe is low.
The planned investments in new production capacity are large, with 11 new greenfield plants and 21 expansions of existing plants, all coming on stream by the year 2000. The total investment cost is estimated at ECU 26 bn, or more than ECU 5 bn per year.
The Bank's intervention can be justified by its role in promoting regional development and furthering the international competitiveness of European industry. Many of the existing and planned production plants are located in regions eligible for structural support. Moreover, semiconductors are a key product in modern society and serve as an input for a wide range of everyday products.

The Semiconductor Industry : Review of the Sector and Financing Opportunities
Table of Contents
1. Background
2. The market
3. Business cycles
4. Innovation
5. Semiconductor technologies
6. Product groups
7. Leading companies
8- International competitiveness of Europe
9. Public Interest
10. Investment trends
11. Risk assessment and implications for EIB lending to the sector
3
3
5
5
6
6
7
7
8
8
9
Bibliography 10
ANNEX 1
ANNEX 2
ANNEX 3
European 200 mm Semiconductor Wafer Production Plants
1995 vs. 2000 Production Capacity By Region (msi/year)
1995 vs. 2000 Production Capacity By Region (Percent Capacity)
The Semiconductor Industry : Review of the Sector and Financing Opportunit ies
1. Background
The semiconductor industry is relatively young ; it is global ; and i: is growing rapidly. It originated in the US with the invention of the transistor in 1947. The complexity of the product, its capital intensity upstream (production) and labour intensity downstream (assembly) as well as its light weight enable producers to exploit different local comparative advantages. As a result, semiconductor companies are typically multinational enterprises with procuction units scattered around the worid. The performance of European companies in this industry has been unsatisfactory, and, associated with that, European semiconductor production is low as compared with the economic weight of the region. However, a series of structural changes have occurred in recent years that have injected new vigour into the European industry : foreic η direct investment is flowing in at accelerating rates; European companies are restructuring and becoming more globalised ; and profits are looking up.
2. The market
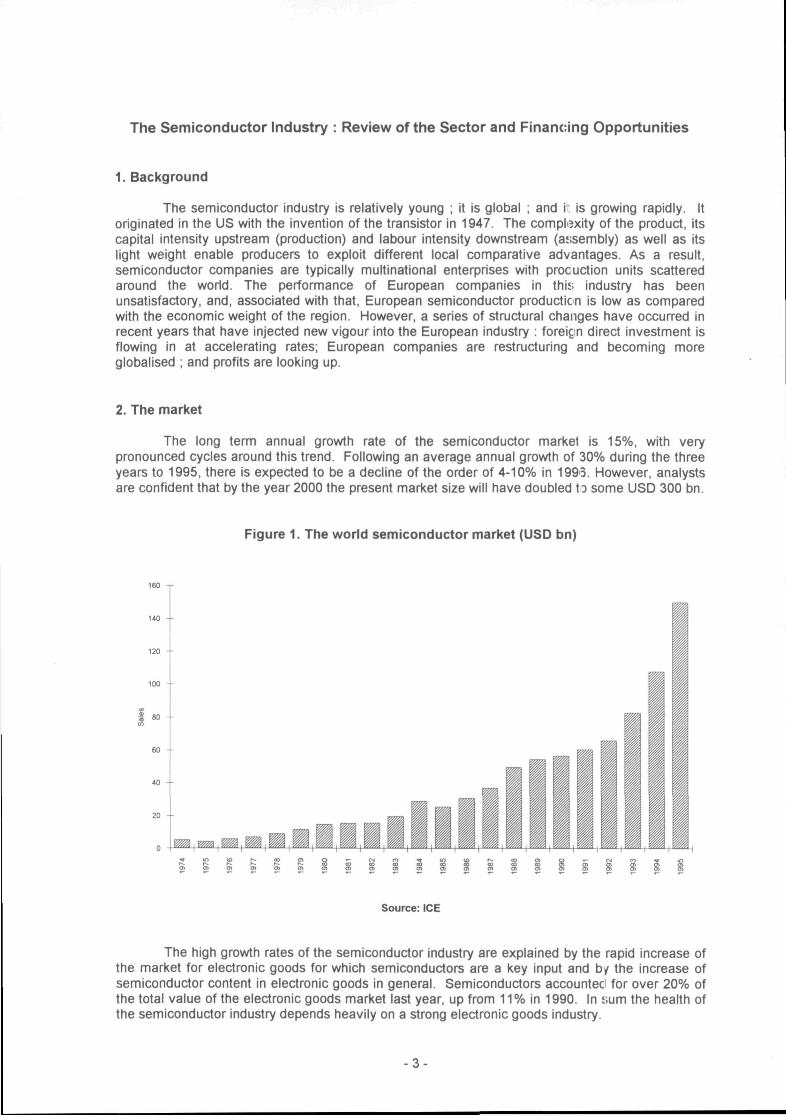
The long term annual grov^h rate of the semiconductor market is 15%, with very pronounced cycles around this trend. Following an average annual growrth of 30% during the three years to 1995, there is expected to be a decline of the order of 4-10% in 1993. However, analysts are confldent that by the year 2000 the present market size will have doubled ID some USD 300 bn.
Figure 1. The world semiconductor market (USD bn)
i.
Source: ICE
The high growth rates of the semiconductor industry are explained by the rapid increase of the market for electronic goods for which semiconductors are a key input and b/ the increase of semiconductor content in electronic goods in general. Semiconductors accounted for over 20% of the total value of the electronic goods market last year, up from 11% in 1990. In sum the health of the semiconductor industry depends heavily on a strong electronic goods industry.
-3

The electronic goods industry is growing at about 10% a year and it amounted to USD 750 bn worid-wide in 1995. The main segments of this semiconductor-intensive industry are computers, which account for 47% of world-wide semiconductor sales, consumer electronics (23%), communications equipment (13%), industrial applications (12%)and cars (5%).
Figure 2. Key applications for semiconductors (1995)
Automotive 5%
Industrial applications
13%
Communications
47%
Computer
Consumer electronics Source: ICE
The largest markets for semiconductors are the US (33% of the global market) followed by Japan (26%), Europe (19%) and South East Asia (22%). Japan had the largest market during the 1980's, but the joint effects of strong currency, domestic recession and the outward investment strategy by Japanese electronics companies have recently led to a reduction of the importance of this market, mainly to the benefit of Southeast Asian countries. The North American market is highly dependent on the computer industry ; the Japanese semiconductor market still relies heavily on the consumer electronics industry ; and In Europe, communication systems are relatively prominent.
Figure 3. The main semiconductor user regions (1995)
SE Asia
Europe
Source: ICE
4 -

3. Business cycles
The semiconductor market is characterised by pronounced economic cycles with wide swings from one year to another (Figure 4). For instance, in 1985 sales fell by 12% whereas a year eariier they had risen by 47%. For 1996 a fall of 7% is expected whereas the sector grew 39% in 1995. For 1997 analysts expect growrth rates to be positive again. Such rapid changes create problems for the industry. During downturns, semiconductor producers must basically choose between profit margins and retaining market shares. Since market shares are often important to achieve economies of scale, profits typically tend to suffer during downturns.
Figure 4. World-wide semiconductor sales grovi/th rates
η (0
50%
25%
0%
-25% ^ u ï < o r « . c o o > O T - e M c o * u > t o i « » o o o ) O T - e M e o ^ u ) « h ^ h * h ^ h ^ h ^ K ^ O O C O C O O O O O O O O O C O O O O O O > 0 > 0 > 0 > 0 > 0 ) ^ O > O > O > O > O > O > O > O > O > O > O > 0 > O > O > O > Ô O > O > O > O > O > O > X r
*PJ forecast Source: ICE
While the creation of new electronic and equipment markets is the driving force behind the high growrth trend of the semiconductor industry, it is the supply-demand imbalance that governs the year-on-year dynamics. New factories provide discrete blocks of incremental capacity and, due to their high capital cost, must be operated at full capacity. During periods of capacity shortage, firms tend to over-invest. The resulting over-capacity leads to a halting of investment until demand again exceeds capacity, whereupon the investment cycle resumes. With a typical lead time for a new factory, from groundbreaking to saleable production, of 18 months to two years, the industry has an in-built three to four year cycle.
4. Innovation
The semiconductor industry continually introduces new and innovative products. As these enter the marketplace, existing components are pushed further along their life cycle paths. In general, each new generation of semiconductors represents an increase in circuit density as compared with existing generations.
Although introduction-type semiconductors receive a great deal of publicity, the semiconductor manufacturer makes his money mainly from semiconductors in their growth and maturity stages. However, because of the competitive nature of the marketplace and the need to acquire production experience (to move down the learning curve), it has proven difficult to enter a market segment in the profitable stage without having had a part in the introductory stage.
5-
s. Semiconductor technologies
The diffusion of most of the major semiconductor technologies has changed dramatically over time. The battle used to be between the MOS (Metal Oxide Semiconductor) and the bipolar technology. Now MOS has cleariy won, with CMOS (Complementary MOS) capturing 80% of the market. No technology of the past 25 years has dominated the market as CMOS does now. It is estimated that by 2000, 90% of semiconductors will be built with CMOS.
Integration density levels, i.e. transistors per mm2, have grown continually since the invention of the integrated circuit. MOS integration levels have increased on average by 35-50% per year for the past 23 years. Moore's law states that density should double every 18 months. This law is a useful rule of thumb for forecasting technology trends and new products.
6. Product groups
Semiconductors are classified into major product groups, mainly according to their function.
The largest product group are memory chips which account for about one third of the total semiconductor market. The memory chip market consists of DRAM, SRAM; ROM, EPROM, EEPROM and fiash memory^. DRAMs and SRAMs are "volatile" memories because they lose memory content when power is switched off. They account for about 90% of the memory chip market and are mainly used in computers. All the others are "non-volatile" memories, i.e. they keep memory content when the power is switched off.
The second largest semiconductor product group are micro components, which mainly consist of microprocessors and micro controllers. This group accounts for about another third of the semiconductor market. Microprocessors are the core of computers and are supported by other devices such as memories. Micro controllers are stand alone devices that perform dedicated or embedded computer functions within an overall electronic system without the need of other support circuits.
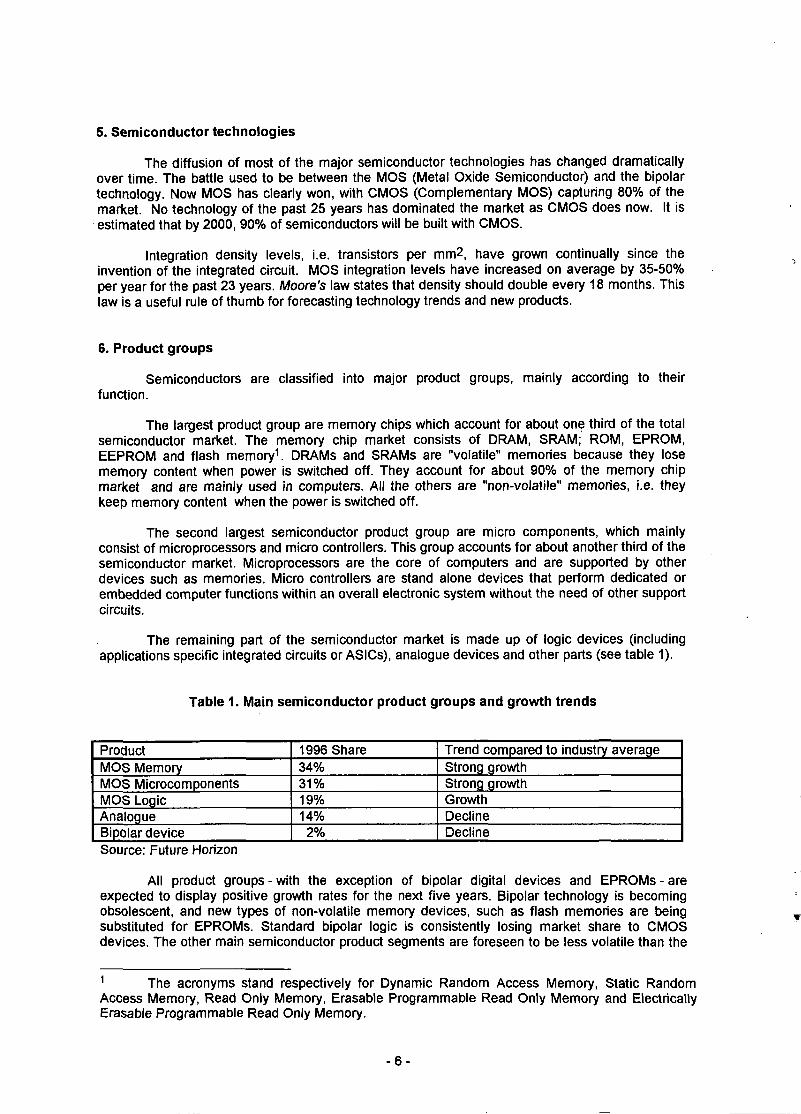
The remaining part of the semiconductor market is made up of logic devices (including applications specific integrated circuits or ASICs), analogue devices and other parts (see table 1).
Table 1. Main semiconductor product groups and growth trends
Product MOS Memory MOS Microcomponents MOS Logic Analogue Bipolar device
1996 Share 34% 31% 19% 14% 2%
Trend compared to industry average Strong growth Strong growth Growrth Decline Decline
Source: Future Horizon
All product groups - with the exception of bipolar digital devices and EPROMs - are expected to display positive growth rates for the next five years. Bipolar technology is becoming obsolescent, and new types of non-volatile memory devices, such as fiash memories are being substituted for EPROMs. Standard bipolar logic is consistently losing market share to CMOS devices. The other main semiconductor product segments are foreseen to be less volatile than the
^ The acronyms stand respectively for Dynamic Random Access Memory, Static Random Access Memory, Read Only Memory, Erasable Programmable Read Only Memory and Electrically Erasable Programmable Read Only Memory.

bipolar and MOS logic areas. Analogue semiconductors are forecast to decline relative to the sector average, even though they still grow in absolute terms.
The micro components segment is expected to increase strongly. Microprocessors and micro controllers are becoming more and more like a complete system on a chip as large amounts of memory and control circuitry are now being embedded in them. The rising complexity and density of these devices will cause the micro component market to grow faster than the total semiconductor market.
The memory chip market is very volatile. As the semiconductor industry moves between boom and slump, there are huge memory price swings. In comparison, the other product segments are much more stable. A period of rising prices is now expected with the introduction of new high-density DRAM, SRAM, and flash memory products. The increased cost of memory plants and the growing complexity of the more advanced memories will also make steep per-bit pricing declines more difficult to offer. Moreover, as MOS memory products become more specialised (e.g. video RAMs, low-power versions, etc.), they will command higher prices than non-specialised memory parts. The fastest growing product for the next years is fiash memory, as it replaces EPROMs.
7. Leading companies
The US company Intel is the largest supplier with a worid market share of 9.2%, followed by the Japanese companies NEC (8.3%), Toshiba (6.8%) and Hitachi (6.6%). Market shares can display dramatic changes within short fime periods. Intel managed to become the leading supplier within a very short time period. Another interesting case is the Korean company Samsung, which entered the semiconductor market during the 1980's and has climbed the worid rankings with very high growrth rates ever since.
The Japanese companies, which increasingly dominated the industry in the course of the 1980's have become less aggressive. The firm stance of the US administration, which has made clear that the semiconductor industry is a strategic one for the US economy, has probably contributed significantly to this; and US suppliers are making a competitive comeback.
European companies were doing badly during the 1980s. However, by the beginning of the 1990s major companies - Philips, SGS-Thomson and Siemens-had experienced a sort of renaissance. They have started to reshuffle the product portfolio ; they are successfully finding new growth niches ; and they are trying to rely less on the home market. However, in the worid ranking they are still placed in the midfield, between ranks 10 and 15.
8. International competitiveness of Europe
Why is Europe as a whole underrepresented in the worid semiconductor industry compared to its economic weight ? The reasons usually given are comparatively high labour costs, due to high social charges and rigidities in working hours, high interest rates, and higher material and supply costs. From an accounting point of view the main cost item in semiconductor production is depreciation, which accounts for up to 70% of unit costs. Thus efficient plant utilisation is the key to success. This requires a flexible and motivated labour force. In Europe, the workforce has now accepted 24/24 hours operation for 365 days per year, which gives a badly needed boost to the industry's competitiveness.
Europe has traditionally been a net importer of semiconductors, which means that local consumption is much higher than production. Moreover, most of the production is carried out by European companies.
However, the picture has been changing as a result of concerted efforts by companies, policy makers and the European Commission through cooperative R&D programmes (e.g. the Joint European Submicron Semiconductor Initiative, JESSI) and other support mechanisms. European companies have specialised in niche markets with high growth potential such as semiconductors for telecommunications and automobiles. Moreover, foreign direct investment in Europe is increasing rapidly. This has led to a change in the perception of Europe as a place of semiconductor production and to a dramatic increase in investment (see below).

European companies have always tended to have most of their production units within Europe. They are unlikely to stand aside from the trend towards internationalisation of production however, and it is to be expected that they will increasingly set up production units abroad.
9. Public interest
The semiconductor industry is frequently considered as being of strategic importance. As a supplier of key inputs of military and industrial products, it has always attracted the interest and support of govemments. Moreover semiconductors are the basic building block of the electronics industry which is becoming the largest industrial sector in advanced economies (see flgure 5). The sector attracts substantial R&D and a highly skilled labour force. It has been estimated that by the year 2010 more than 12% of GDP will be generated by the electronics sector.
Figure 5. The size of main sectors of economic activity in OECD countries
1960 1970 1980 1990 20(i0 2010
Source: MITI
Governments support the semiconductor industry in different ways. In the US for instance, the military applications have had undisputed top priority, whereas in Japan the scope of interventions has been much more geared toward civilian applications, such as consumer products. In Europe, support used to be carried out at national level with a high degree of duplication and dispersion of effort. In so far as they existed, national support programmes for the electronics industries in Europe have generally been considered as failures. It is only lecently that European countries have managed to successfully coordinate these efforts through the consortium JESSI.
10. Investment trends
Rising demand for semiconductors and the need for more advanced production capacities have been behind the strong increase of investment in the sector. It is widely held that the semiconductor industry currently requires a investment/sales ratio of 18-19% to keep up with the demand for leading-edge production capacity.
Between 1989 and 1995 the proportion of the production capacity installed in Europe that was accounted for by direct foreign investment rose from 35% to 40%. Tiiis illustrates the growth of foreign interest. During the last two years a number of new investments have been announced, especially by foreign companies (see annex 1). If all the announced inve.stments are undertaken, by the year 2000 almost half of the production capacity will be owned by foreign companies.
-8

This surge in investment however does not necessarily mean a further period of over capacity since the new capacity in Europe will basically close the gap between local consumption and production. But it will have an effect on the balance between supply and demand worid wide.
If companies carry out all the new investment which they have announced, Europe should see from now to the year 2000 11 new greenfield semiconductor plants and 21 expansions of existing plants. This means that production capacity should increase by 64%. The bulk of the new capacity should be located in Germany and UK (see annex 2). As a result, 47% of the installed capacity by the year 2000 should consist of state of the art technology. This proportion is slightly higher than for the rest of the worid, which means that Europe may count on a very advanced production base.
In terms of cost, the investment requirements are huge. A state of the art greenfield plant normally costs around USD 1.2m, of which 70% is for equipment alone. The 11 greenfield plants would add up to USD 13 bn and the 21 expansions to about USD 18 bn. In other words some USD 31 bn of investment would occur in Europe over 1996-2000, or some USD 6 bn per year.
11. Risk assessment and implications for EIB lending to the sector
The Bank's intervention in this industry can be justified in terms of its role in promoting regional development and the international competitiveness of European industry. Many existing and planned production plants are located in regions eligible for structural support as grant finance is an important element in the location decision. A strong semiconductor industry also attracts other industries.
Long term lending to the semiconductor industry is a high risk undertaking, because of large technological uncertainties, huge investment requirements and the extremely short life cycles of products and equipment. Companies have learned that one of the keys for survival in this industry is a strong financial structure. The risks in lending may however be mitigated if the promoter is sufficiently diversified and its own existence does not crucially depend on a single project. Moreover, companies focusing on niche markets and with high market shares could also qualify for lending. In any case, lending should only occur subject to a very careful analysis of technological and market risks and involve also an assessment of the long term viability of the promoter's product and technology strategy.

Bibliography
DAUVIN, J.-PH. 1990 Les Semiconducteurs (Economica, Paris)
FUTURE HORIZONS, 1996 An Executive Study On Semiconductor Fab Capacity Requirements In Western Europe
GRUBER, H., 1994 Learning and Strategic Product Innovation. Theory and Evidence for
the Semiconductor Industry (North Holland, Amsterdam)
ICE, 1996 Report on the Integrated Circuit Industry, Status 1996 (Scottsdale)
UNCTC, 1983 The Global Semiconductor Industry (UN, Vienna)
•10-

ANNEX 1
European 200 mm Semiconductor Wafer Production Plants
Company
AMD
AT&T Micro
Atmel-ES2 Fujitsu Fujitsu
GEC-Plessey
Hitachi
Hitachi IBM Intel Intel
Mitsubishi
NEC NEC Newport Wafer Fab Newport Wafer Fab
Philips
SGS-Thomson SGS-Thomson SGS-Thomson SGS-Thomson Siemens Siemens Siemens Siemens Siemens/IBM SMST SMST
TEMIC
Texas Instruments Texas Instruments LG Semicon
Country
Germany
Spain
France England England
England
Germany
Germany France Ireland Ireland
Germany
Scotland Scotland Wales Wales
Netherlands
Italy Italy France France Germany Germany Germany England France Germany Germany
France
Italy Italy Wales
Products
Microprocessor
Logic Devices
Logic Devices/Memory 64M DRAM 16/64M DRAM
Logic Devices
4/16/M DRAM/Memory
16/64M DRAM 16/64M DRAM 486/P5 Microprocessor Microprocessor
16/64M DRAM
16/64M DRAM 16/64M DRAM Foundry Foundry
Logic Devices
EPROM/FLASH EPROM/FLASH Logic Devices/Microproc. Microprocessor 256M DRAM 16/64M DRAM 16/64M DRAM Logic Devices/Memory 16M DRAM 16M DRAM/Microproc. 4/16M DRAM Logic Devices/Microproc. /Memory 16M DRAM 64M DRAM 256M DRAM
Start
1998
1997
1996 1999 1998
1996
1992
1997 1997 1994 1997
1996
1996 1997 1998 1997
1997
1997 1997 1993 1997 1999 1996 1997 1997 1992 1997 1989
1998
1995 1997 1998
Wafer/ Month 24 000
15 000
22 000 15 000 15 000
8 000
10 000
10 000 20 000 20 000 25 000
15 000
15 000 24 000 20 000 10 000
10 000
20 000 20 000 20 000 20 000 25 000 10 000 10 000 25 000 16 000 10 000 20 000
10 000
15 000 35 000 TBA
Plant Type
Greenfield
Expansion
Expansion Expansion Expansion
Expansion
Greenfield
Expansion Expansion Greenfield Expansion
Greenfield
Greenfield Expansion Expansion Expansion
Expansion
Expansion Expansion Expansion Expansion Greenfield Greenfield Greenfield Greenfield Expansion Expansion Expansion
Expansion
Expansion Expansion Greenfield
Owner
us
US
Europe Japan Japan
Europe
Japan
Japan us US US
Japan
Japan Japan Asia Pac Asia Pac
Europe
Europe Europe Europe Europe Europe Europe Euroope Europe US US US
Europe
US US Asia Pac
Cost
$1.5b $145m (equip only) $550m $1.3b In Above $285m (equip only) $250m (equip only) na $1.0b $850m $1.5b $350m (equip only) $1.0b In Above $750m In Above $300m ($ 600m) na na na na $1.9b In Above In Above $1.6b na na na
na
$1.0b In Above $1.3b
Source : Future Horizons

1995 vs. 2000 Production Capacity By Region
(msi/year)*
^ Germany
^ France
• UK D Italy
I Other
pjil Netherlands
H Ireland
Current Future
1995 = 406.9 msi/year 2000 = 669.9 msi/year
* msl = million square inches
Source : Future Horizons
m X Ν)

1995 vs. 2000 Production Capacity By Region
(Percent Capacity)
Other Austria UK 5% 3% France 19% . . . « 1 ^ — 21%
Netherlands β 6%
Italy 14% Ireland
4%
Germany 28%
Other Austria 5% 2% France
19%
Netherlands 5%
15% Ireland 5%
Germany 26%
1995 = 406.9 msi/year 2000 = 669.9 msi/year
* msi = million square inches
Source : Future Horizons
m X

DEN EUROPA.ISKE INVESTERINGSBANK
EUROPÄISCHE INVESTITIONSBANK
ΕΥΡΠΠΑΪΚΗ ΤΡΑΠΕΖΑ ΕΠΕΝΔΥΣΕΩΝ
EUROPEAN INVESTMENT BANK
BANCO EUROPEO DE INVERSIONES
BANQUE EUROPEENNE D'INVESTISSEMENT
BANCA EUROPEA PER GLI INVESTIMENTI
EUROPESE INVESTERINGSBANK
BANCO EUROPEU DE INVESTIMENTO
EUROOPAN INVESTOINTIPANKKI
EUROPEISKA INVESTERINGSBANKEN