the school staffing surge - edchoice.org · the school staffing surge ... figure 3: pupil-teacher...
TRANSCRIPT

The School STaffing SurgeDecades of Employment Growthin America’s Public Schools
BENJAMIN ScafiDi, Ph.D.
October 2012
The frieDman founDaTionfOr EDucAtIONAl chOIcE
edchoice.org

about the friedman foundation for educational choiceThe Friedman Foundation for Educational Choice is a 501(c)(3) nonprofit and nonpartisan organization, solely dedicated to advancing Milton and Rose Friedman’s vision of school choice for all children. First established as the Milton and Rose D. Friedman Foundation in 1996, the foundation continues to promote school choice as the most effective and equitable way to improve the quality of K-12 education in America. The foundation is dedicated to research, education, and outreach on the vital issues and implications related to choice in K-12 education.

The School STaffing SurgeDecades of Employment Growthin America’s Public Schools
BENJAMIN ScafiDi, Ph.D.
October 2012

Table of contentsExecutive Summary .......................................................................................................................1
Introduction ....................................................................................................................................3
National Changes in Public School Staffing ...............................................................................3
Did No Child Left Behind Make Us Do It? ................................................................................5
Comparing Staffing in U.S. Public Schools to Publicly Funded Schools inthe OECD ........................................................................................................................................5
Although Staffing U.S. Public Schools Dramatically Increased,Student Achievement Did Not .....................................................................................................6
U.S. Public High School Graduation Rates ...........................................................................6
U.S. Test Scores—Have They Improved as Public School Staffing Increased? ...............7
Are American Students Getting Worse Over Time? .................................................................8
How Can Public Schools Lower Class Sizes and Increase Administrative andOther Non-Teaching Staff Yet Not Increase Student Achievement? ......................................9
Increases in Public School Staff in the 50 States and Washington, D.C. ...............................12
Ranking the 50 States and Washington, D.C., on Growth in PublicSchool Employment .....................................................................................................................12
The 40 States with Growing Student Populations: Ranking Them According to Employment Growth .....................................................................................13
The 11 States with Declining Student Populations: Ranking Them According to Employment Growth .....................................................................................15
What if the Growth Rate for Non-Teaching Personnel Had Been the Same asthe Growth Rate for Public School Students and the Growth Rate for TeachersHad Been “Only” 1.5 Times the Growth Rate of Students?...................................................17
Thought Experiment Part I: Growth in Non-Teaching Personnel ...................................17
Thought Experiment Part II: Growth in the Teaching Force ............................................18
Conclusion ....................................................................................................................................19
References .....................................................................................................................................23
Notes ..............................................................................................................................................24
About the Author .........................................................................................................................25

list of figures
list of Tables
Figure 1: Growth in Students and Public School Personnel, United States, FY 1950 to FY 2009 .......................................................................................................4
Figure 2: Pupil-Staff Ratio: FY 1950 and FY 2009 ....................................................................4
Figure 3: Pupil-Teacher Ratio: FY 1950 and FY 2009 ...............................................................4
Figure 4: Growth in Students and Public School Personnel, United States, FY 1992 to FY 2009 .......................................................................................................5
Figure 5: Percent of Current Expenditures on Teachers in Publicly Funded Schools, U.S. vs. OECD Average ...............................................................................5
Figure 6: Percent of Current Expenditures on Non-Teaching Staff in Publicly Funded Schools, U.S. vs. OECD Average .................................................6
Figure 7: National Assessment of Educational Progress, Age 17, Public Schools, 1992 and 2008 ................................................................................................8
Table 1: Changes in the Staffing and Student Populations in American Public Schools, FY 1992 to FY 2009 .........................................................................12
Table 2: Comparing the Increase of Students to the Increase in Public School Employment, FY 1992 to FY 2009 ...............................................................13
Table 3: Comparing the Increase of Students to the Increase in Teachers, FY 1992 to FY 2009 .....................................................................................................14
Table 4: Comparing the Increase of Public School Students to the Increase in Non-Teaching Staff, FY 1992 to FY 2009 ............................................................15
Table 5: Difference Between the Change in Student Population to the Change in Public School Employment, FY 1992 to FY 2009 ................................16
Table 6: Difference Between the Change in the Public School Student Population to the Change in the Teaching Force, FY 1992 to FY 2009 ....................................16
Table 7: Difference Between the Change in the Public School Student Population to the Change in Non-Teaching Staff, FY 1992 to FY 2009 ...................................17
Table 8: Thought Experiment I: What if the Increase in Non-Teaching Staff Had Been the Same as the Increase in Students in American Public Schools, FY 1992 to FY 2009 .....................................................................................18
Table 9: Thought Experiment II: What if the Increase in Teachers Had Been “Only” 1.5 Times as Large as the Increase in Students in American Public Schools, FY 1992 to FY 2009 .........................................................................18

1
The friedman foundation for Educational choice
edchoice.org
executive Summary
America’s K-12 public education system has experienced tremendous historical growth in employment, according to the U.S. Department of Education’s National Center for Education Statistics. Between fiscal year (FY) 1950 and FY 2009, the number of K-12 public school students in the United States increased by 96 percent while the number of full-time equivalent (FTE) school employees grew 386 percent. Public schools grew staffing at a rate four times faster than the increase in students over that time period. Of those personnel, teachers’ numbers increased 252 percent while administrators and other staff experienced growth of 702 percent, more than seven times the increase in students.
In a recent Heritage Foundation Backgrounder, Lindsey Burke (2012) reports that since 1970, the number of students in American public schools increased by 8 percent while the number of teachers increased 60 percent and the number of non-teaching personnel increased 138 percent.
That hiring pattern has persisted in more recent years as well. This report analyzes the rise in public school personnel relative to the increase in students since FY 1992. Analyses are provided for the nation as a whole and for each state.
Between FY 1992 and FY 2009, the number of K-12 public school students nationwide grew 17 percent while the number of full-time equivalent school employees increased 39 percent, 2.3 times greater than the increase in students over that 18-year period. Among school personnel, teachers’ staffing numbers rose 32 percent while administrators and other staff experienced growth of 46 percent; the growth in the number of administrators and other staff was 2.7 times that of students.
Importantly, such growth cannot be attributed to the federal No Child Left Behind (NCLB) law. During the pre-NCLB period, FY 1992 to FY 2001, public schools’ student population grew 13 percent while public education personnel rose 29 percent—a 23 percent increase for teachers and a 37 percent increase for administrators and other staff. Post-NCLB (FY 2002 to FY 2009), employment growth (7 percent) still outpaced student numbers (3 percent). Teachers and administrators increased at about the same rate of 7 percent.
The chief difference between the NCLB era and the prior time period is the trend toward increasing non-teaching staff at a rate greater than teachers was halted—with NCLB, teachers and non-teaching staff both increased at the same rate (more than twice as
800%
700%
600%
500%
400%
300%
200%
100%
0%
Growth in Students and Public SchoolPersonnel, United States, FY 1950 to FY 2009
Source: U.S. Department of Education, National Center for Education Statistics, 1991 Digestof Education Statistics, Tables 37 and 77; 2010 Digest of Education Statistics, Tables 36 and 87
Students Total SchoolPersonnel
Teachers Administratorsand Other Staff
702%
252%
386%
96%
40%
35%
30%
50%
45%
25%
20%
15%
10%
5%
0%
Growth in Students and Public SchoolPersonnel, United States, FY 1992 to FY 2009
Source: U.S. Department of Education, National Center for Education Statistics, 1994 Digestof Education Statistics, Tables 40 and 85; 2010 Digest of Education Statistics, Tables 36 and 87
Students
17%
Total SchoolPersonnel
Teachers Administratorsand Other Staff
39%
32%
46%

fast as student enrollment). In both the pre- and post-NCLB periods analyzed, overall staffing in public education grew about 2.3 times faster than the increase in students.
Compared to other nations’ schools, U.S. public schools devote significantly higher fractions of their operating budgets to non-teaching personnel—and lower portions to teachers. Meanwhile, the U.S. is one of the highest spending nations in the Organisation for Economic Co-operation and Development (OECD) when it comes to K-12 education.
Notably, different states experienced different patterns from FY 1992 to FY 2009. For ease of exposition, Washington, D.C., is treated as a state. During that time, 48 states grew total school personnel at a faster rate than their increase in students—or decreased school personnel at a slower rate than their declines in students. Forty-six states increased teachers and 48 states grew non-teaching personnel at faster rates than their uptick in students.
Even when student populations were dropping, public school systems were increasing staffing between 1992 and 2009. Nine states with declining student populations had significant increases in public school personnel—D.C., Iowa, Louisiana, Maine, Mississippi, North Dakota, South Dakota, Vermont, and Wyoming. For example, Maine experienced an 11 percent decline in students from 1992-2009; however, the number of public school personnel increased by 35 percent. Perhaps more noteworthy during that period is the number of teachers in Maine public schools increased by 3 percent while the number of non-teaching personnel increased by 76 percent. An additional two states with declining student populations—Montana and West Virginia—did not decrease staffing at nearly the same rate as their declines in students.
Only three states, between 1992 and 2009, increased public school personnel at a slower rate than their rise in students—Arizona, Nevada, and South Carolina.
There is no evidence in the aggregate that the increase in public school staffing caused student achievement
to improve. In a shocking finding, economist and Nobel laureate James Heckman and his co-author, Paul LaFontaine, found that public high school graduation rates peaked around 1970. Thus, as staffing was rising dramatically in public schools, graduation rates were not.
In addition, scores on the National Assessment of Educational Progress (NAEP) Long-Term Trend exam for 17-year-old students in public schools have not increased during the time period studied. Between 1992 and 2008, public schools’ NAEP reading scores fell slightly while scores in mathematics were stagnant. After the sizeable increase in the teaching force and the dramatic upsurge in the hiring of non-teaching personnel, student achievement in American public schools has been roughly flat or modestly in decline.
As more adults gain employment in public schools, there is no evidence their numbers are leading to improved academic outcomes for students. And this increase in staffing has a significant opportunity cost. If non-teaching personnel had grown at the same rate as the growth in students and if the teaching force had grown “only” 1.5 times as fast as the growth in students, American public schools would have an additional $37.2 billion to spend per year. This $37.2 billion in annual recurring savings could be used:
• to raise every public school teacher’s salary by more than $11,700 per year;
• to more than double taxpayer funding for early childhood education;
• to provide property tax relief;
• to lessen fiscal stress on state and local governments;
• to give families of each child in poverty more than $2,600 in cash per child;
• to give each child in poverty a voucher worth more than $2,600 to attend the private school of his or her parents’ choice;
• or to support a combination of the above or for some other worthy purpose.
The School Staffing Surge: Decades of Employment Growth in America’s Public Schools 2
edchoice.org
3
The friedman foundation for Educational choice
edchoice.org
introduction
This report analyzes changes in public school staffing over time by examining data from the annual editions of the Digest of Education Statistics, which is compiled by the U.S. Department of Education’s National Center for Education Statistics. The report’s main part analyzes changes in public school staffing over the past generation, the fiscal year (FY) 1992 to FY 2009. Particular attention is paid to changes in (a) overall public school staffing relative to changes in the number of public school students, and (b) changes in the number of teachers and non-teaching staff relative to the change in number of students.
In reading this report, please keep two issues in mind:
• Although dramatic increases in staffing in K-12 schools perhaps were warranted in 1950, does that necessarily imply public school staffing should increase forever? Are adding teachers and non-teaching staff at rates higher than increases in students a wise investment?1
• Is there an inherent trade-off between the number
of public school staff and overall public school staff quality? When public schools hire more staff, does that require hiring less effective personnel and create more bureaucracy to burden classroom teachers?
The rest of this report is organized as follows: The next two sections highlight the significant increases in public school staffing in the United States as a whole and the corresponding lack of increases in student achievement. Next, the report considers and—based on the historical data—rejects the claim the federal No Child Left Behind law is responsible for rises in public school staffing, especially among non-teaching personnel. Later sections contain the following:
• To add context, the report compares public school staffing in the U.S. to countries in the Organisation for Economic Co-operation and Development.
• A description—and rejection—of the argument that American public school students today are more disadvantaged than past American students.
• An explanation of how increases in public school staffing could be harmful to student achievement.
• Changes in staffing in the individual states and Washington, D.C., between 1992 and 2009.
• Thought experiments showing the significant opportunity costs that result from the rapid increase in public school employment.
national changes in Public School Staffing
From 1837, when Horace Mann became secretary of the Massachusetts State Board of Education, to today’s “Broader, Bolder Approach to Education,” there have been widespread calls for more funding and staffing for American public schools.2 To state that those calls have been successful would be an understatement. According to the National Center for Education Statistics, between fiscal year (FY) 1950 and FY 2009, the number of K-12 public school students in the
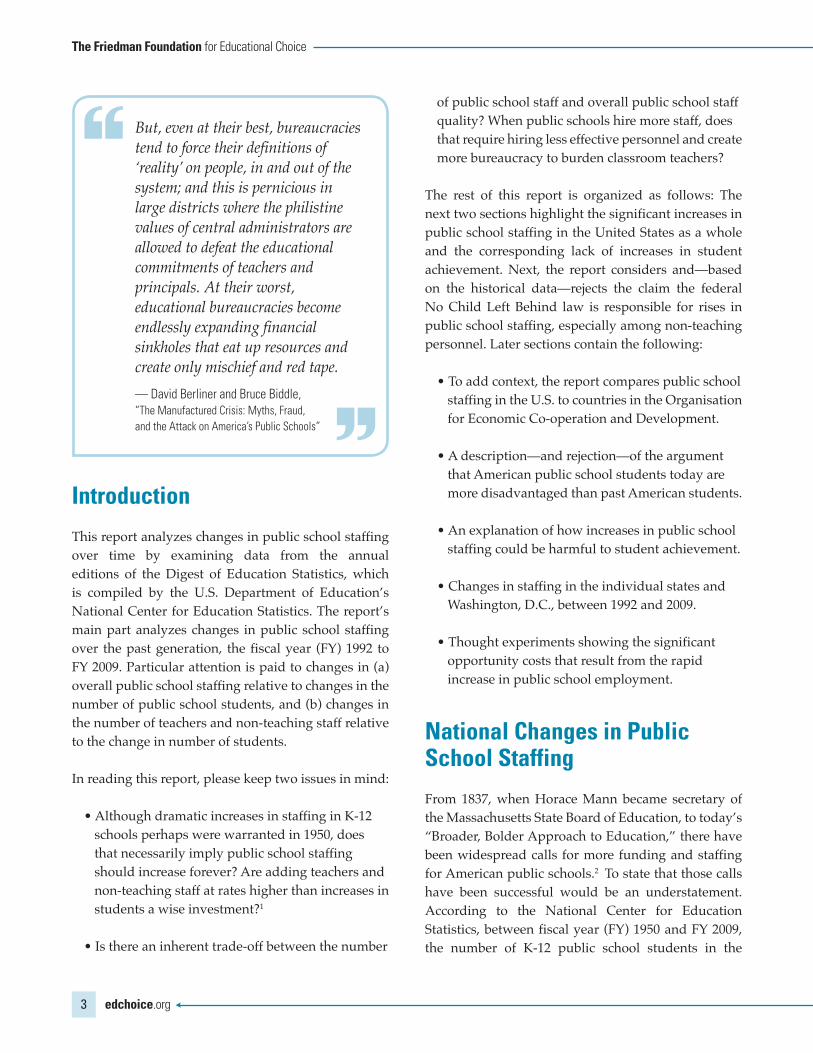
But, even at their best, bureaucracies tend to force their definitions of ‘reality’ on people, in and out of the system; and this is pernicious in large districts where the philistine values of central administrators are allowed to defeat the educational commitments of teachers and principals. At their worst, educational bureaucracies become endlessly expanding financial sinkholes that eat up resources and create only mischief and red tape.— David Berliner and Bruce Biddle,“the Manufactured crisis: Myths, fraud, and the Attack on America’s Public Schools”
The School Staffing Surge: Decades of Employment Growth in America’s Public Schools 4
edchoice.org
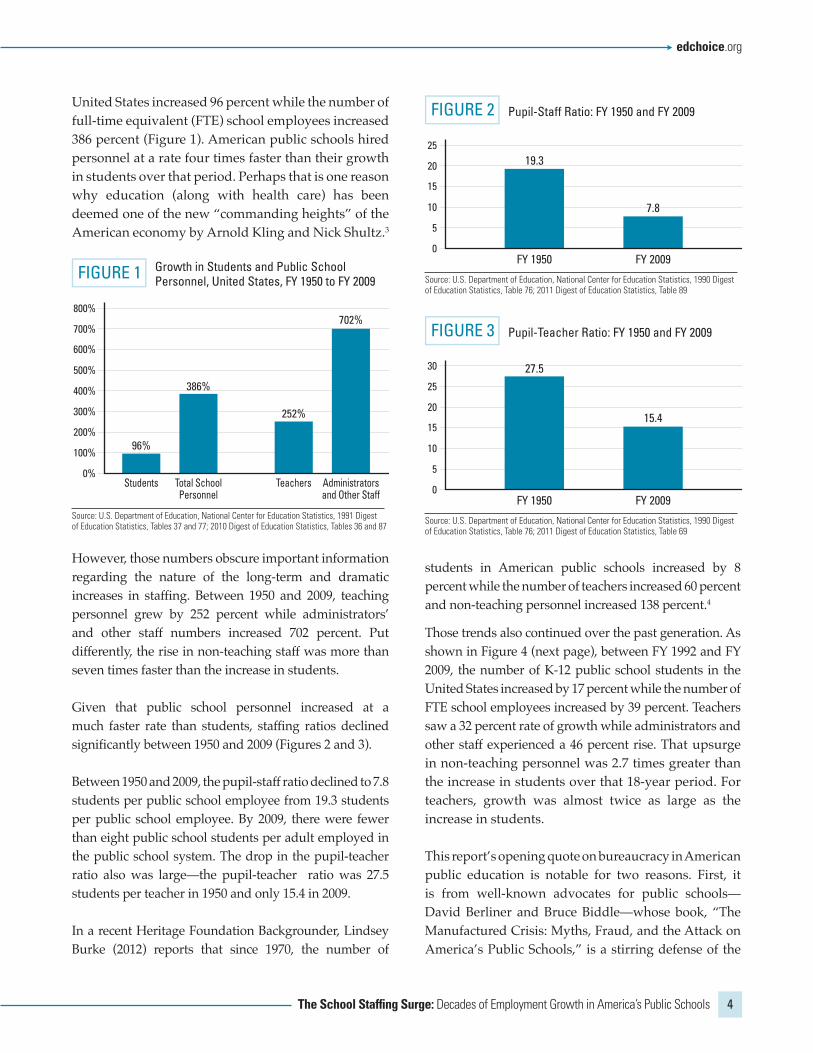
United States increased 96 percent while the number of full-time equivalent (FTE) school employees increased 386 percent (Figure 1). American public schools hired personnel at a rate four times faster than their growth in students over that period. Perhaps that is one reason why education (along with health care) has been deemed one of the new “commanding heights” of the American economy by Arnold Kling and Nick Shultz.3
However, those numbers obscure important information regarding the nature of the long-term and dramatic increases in staffing. Between 1950 and 2009, teaching personnel grew by 252 percent while administrators’ and other staff numbers increased 702 percent. Put differently, the rise in non-teaching staff was more than seven times faster than the increase in students.
Given that public school personnel increased at a much faster rate than students, staffing ratios declined significantly between 1950 and 2009 (Figures 2 and 3).
Between 1950 and 2009, the pupil-staff ratio declined to 7.8 students per public school employee from 19.3 students per public school employee. By 2009, there were fewer than eight public school students per adult employed in the public school system. The drop in the pupil-teacher ratio also was large—the pupil-teacher ratio was 27.5 students per teacher in 1950 and only 15.4 in 2009.
In a recent Heritage Foundation Backgrounder, Lindsey Burke (2012) reports that since 1970, the number of
students in American public schools increased by 8 percent while the number of teachers increased 60 percent and non-teaching personnel increased 138 percent.4
Those trends also continued over the past generation. As shown in Figure 4 (next page), between FY 1992 and FY 2009, the number of K-12 public school students in the United States increased by 17 percent while the number of FTE school employees increased by 39 percent. Teachers saw a 32 percent rate of growth while administrators and other staff experienced a 46 percent rise. That upsurge in non-teaching personnel was 2.7 times greater than the increase in students over that 18-year period. For teachers, growth was almost twice as large as the increase in students.
This report’s opening quote on bureaucracy in American public education is notable for two reasons. First, it is from well-known advocates for public schools—David Berliner and Bruce Biddle—whose book, “The Manufactured Crisis: Myths, Fraud, and the Attack on America’s Public Schools,” is a stirring defense of the
800%
700%
600%
500%
400%
300%
200%
100%
0%
FIGURE 1 Growth in Students and Public SchoolPersonnel, United States, FY 1950 to FY 2009
Source: U.S. Department of Education, National Center for Education Statistics, 1991 Digestof Education Statistics, Tables 37 and 77; 2010 Digest of Education Statistics, Tables 36 and 87
Students Total SchoolPersonnel
Teachers Administratorsand Other Staff
702%
252%
386%
96%
25
20
15
10
5
0
FIGURE 2 Pupil-Staff Ratio: FY 1950 and FY 2009
Source: U.S. Department of Education, National Center for Education Statistics, 1990 Digestof Education Statistics, Table 76; 2011 Digest of Education Statistics, Table 89
FY 1950 FY 2009
7.8
19.3
25
20
30
15
10
5
0
FIGURE 3 Pupil-Teacher Ratio: FY 1950 and FY 2009
Source: U.S. Department of Education, National Center for Education Statistics, 1990 Digestof Education Statistics, Table 76; 2011 Digest of Education Statistics, Table 69
FY 1950 FY 2009
27.5
15.4

5
The friedman foundation for Educational choice
edchoice.org
public school system. Second, they wrote that, “At their worst, educational bureaucracies become endlessly expanding financial sinkholes that eat up resources and create only mischief and red tape” before the significant increase in administration and other non-teaching personnel analyzed in this report. If many teachers, principals, parents, and taxpayers were burdened by too much “bureaucratization” in 1995, how should one think now that the public school bureaucracy has become significantly larger?
Did no child left Behindmake us Do it?
The short answer is “no.” The expansion in public school staffing between FY 1992 and FY 2009—including the relatively large increase in non-teaching personnel—cannot be blamed on the federal No Child Left Behind (NCLB) law.
During the pre-NCLB period, FY 1992 to FY 2001, public schools saw their student populations grow 13 percent. Meanwhile, school personnel numbers increased 29 percent. Teachers’ numbers rose 23 percent, about 1.75 times the increase in students; administrators and other staff experienced a 37 percent rise—almost three times the increase in students.
Although the largest staffing surges occurred pre-NCLB, personnel numbers also outpaced student growth during the NCLB era.
From the school year in which NCLB was passed (FY 2002) until FY 2009, the number of students rose 3 percent while the number of public school teachers and administrators increased at about the same rate, 7 percent. The primary difference between the NCLB era and the prior time period is that the trend toward increasing non-teaching staff at a greater rate than teachers was halted; in the NCLB era, teachers and non-teaching staff both increased at the same rate, which was more than twice as fast as the increase in students. In both the NCLB and the pre-NCLB eras under study, overall staffing in public education increased about 2.3 times faster than student growth.
comparing Staffing in u.S. Public Schools to Publicly funded Schools in the oecD
The Organisation for Economic Co-operation and Development (OECD) collects information on a wide variety of economic and social statistics on member nations, including staffing in publicly funded schools in the U.S. and the other 33 OECD nations.5 According to the OECD, publicly funded schools in OECD nations devote, on average, 63.8 percent of their operating budgets on salaries and benefits for teachers (see Figure 5). U.S. public schools, meanwhile, spend just 54.8 percent of their operating funds on teachers. That begs the question: Where do U.S. public schools spend the rest?
75
50
25
0
FIGURE 5 Percent of Current Expenditures on Teachers inPublicly Funded Schools, U.S. vs. OECD Average
Source: Source: Education at a Glance 2010: OECD Indicators, Table B62b. Organisation forEconomic Co-operation and Development.
U.S. OECD
63.8%54.8%
40%
35%
30%
50%
45%
25%
20%
15%
10%
5%
0%
FIGURE 4 Growth in Students and Public SchoolPersonnel, United States, FY 1992 to FY 2009
Source: U.S. Department of Education, National Center for Education Statistics, 1994 Digestof Education Statistics, Tables 40 and 85; 2010 Digest of Education Statistics, Tables 36 and 87
Students
17%
Total SchoolPersonnel
Teachers Administratorsand Other Staff
39%
32%
46%

The School Staffing Surge: Decades of Employment Growth in America’s Public Schools 6
edchoice.org
American public schools disproportionately spend their operating budgets on non-teaching staff relative to other nations. Whereas OECD nations’ publicly funded schools spend an average of 14.9 percent of their operating budgets on non-teaching staff, American public schools spend 25.7 percent of their budgets on administrators, support staff, clerical staff, etc. (see Figure 6).
Compared to OECD nations, American public schools spend disproportionately more of their budgets on non-teaching staff and less on teachers. And, in the aggregate, there is no evidence the large increase in staffing in American public schools have improved student achievement.6
In 2009, a sample of K-12 students from each of the 34 OECD nations, and 31 other nations and provinces, were given international exams called the Programme for International Student Assessment (PISA). The U.S. Department of Education’s summary of American students’ achievement in math relative to other countries on the PISA exam is as follows:
“Among the 33 other OECD countries, 17 countries had higher average scores than the United States, 5 had lower average scores, and 11 had average scores not measurably different from the U.S. average. Among the 64 other OECD countries, non-OECD countries, and other education systems, 23 had higher average scores than the United States, 29 had lower average scores, and 12 had average scores not measurably different from the U.S. average score.”7
In our globalized world, low or mediocre student
achievement will harm Americans in the labor market. In particular, many studies have shown achievement in mathematics to be an important predictor of future labor market productivity and earnings (see, for example, Johnson and Neal (1998)). Although mathematics achievement in the U.S. is not at the top in international comparisons, America’s education spending per student is. Only two out of 31 OECD countries spend more per student on elementary and secondary public school students than the U.S.8 Further, higher scores on those international exams seem to be associated with higher levels of national economic output.9
Even though the U.S. spends more money per student relative to almost all other nations, it does not have higher student achievement.
although Staffing in u.S. Public Schools Dramatically increased, Student achievement Did not
Given U.S. public schools’ massive increase in staffing and larger proportion of spending on administrative and other non-teaching staff relative to other countries, an important question about the wisdom of that policy presents itself: Is there evidence that increases in public school staffing and disproportionate spending on non-teaching personnel improved student achievement in the United States?
The next two subsections contain, respectively, analyses of the evidence on U.S. public high school graduation rates and student achievement on exams given under the National Assessment of Educational Progress (NAEP).
u.S. Public high School graduation rates
After three decades of decline, America’s public high school graduation rate has increased slightly in the 21st century’s first decade. Using the most accurate measure of the on-time public high school graduation rate, the National Center for Education Statistics reports
30
20
10
0
FIGURE 6 Percent of Current Expenditures on Non-Teaching Staffin Publicly Funded Schools, U.S. vs. OECD Average
Source: Education at a Glance 2010: OECD Indicators, Table B62b. Organisation for EconomicCo-operation and Development.
U.S. OECD
14.9%
25.7%

7
The friedman foundation for Educational choice
edchoice.org
the public high school graduation rate increased to 74.7 percent from 74.2 percent between FY 1992 and FY 2008.10 However, the public high school graduation rate in 2008 remained slightly below where it was four decades earlier.
Two pieces of research are worth consulting on this topic. First, in the abstract to their 2010 paper, which endeavored to get accurate estimates of public high school graduation rates over time, Nobel laureate James Heckman and his co-author, Paul LaFontaine, wrote:
“This paper uses multiple data sources and a unified methodology to estimate the trends and levels of the U.S. high school graduation rate. Correcting for important biases that plague previous calculations, we establish that (a) the true high school graduation rate is substantially lower than the official rate issued by the National Center for Educational (sic) Statistics; (b) it has been declining over the past 40 years; (c) majority/minority graduation rate differentials are substantial and have not converged over the past 35 years; (d) the decline in high school graduation rates occurs among native populations and is not solely a consequence of increasing proportions of immigrants and minorities in American society; (e) the decline in high school graduation explains part of the recent slowdown in college attendance; and (f) the pattern of the decline of high school graduation rates by gender helps to explain the recent increase in male-female college attendance gaps.”11
Heckman and LaFontaine report that the percentage earning high school diplomas in recent years was below the percentage receiving diplomas in 1970. Since 1970, the financial returns in the labor market have declined in relative terms for high school dropouts. By itself, the decline in economic fortunes for high school dropouts should have led to an increase in the public high school graduation rate. That public high school graduation rates actually have fallen even when the incentive for students to graduate has risen is a startling finding.
Second, Harvard economists Claudia Goldin and
Larry Katz summarize their extensive research on more than 100 years of U.S. education data:
“The supply of educated Americans increased greatly and almost unceasingly from 1900 to around 1980. The enormous increase in educational attainment in the early part of the twentieth century came primarily from a grass-roots movement that propelled the building and staffing of public high schools. It was not due to a top-down mandate or pressure from the federal government, nor did it result from powerful local interest groups or arise because of legal compulsion. Later in the century, after high schools had spread and attendance in them had grown, the expansion of state colleges and universities led to further increases in education.
“But after around 1980 the supply of educated Americans slowed considerably. The sluggish growth in the educated workforce in the last quarter century has been mainly due to a slowing down of the educational attainment of those schooled in the United States, rather than to an increase in the foreign born component of the workforce.
“The slowdown in the growth of educational attainment has been most extreme and disturbing for those at the bottom of the income distribution, particularly for racial and ethnic minorities.”12
The main theme from Goldin and Katz is that the slowdown in educational attainment is harming U.S. economic growth, increasing income inequality, and leading to an eventual lowering of America’s position in the world.13
u.S. Test Scores—have They improved as Public School Staffing increased?
The National Assessment of Educational Progress (NAEP) is a series of exams on various subjects given to samples of students ages nine, 13, and 17.
As shown in Figure 7, scores on the NAEP Long-Term Trend Assessment have not increased during the time period under study when public school staffing

The School Staffing Surge: Decades of Employment Growth in America’s Public Schools 8
edchoice.org
ballooned.14 Between 1992 and 2008, NAEP reading scores fell slightly while scores in mathematics were flat.
In sum, there is no evidence student achievement in American public schools improved when there were large increases in staffing.
are american Students getting Worse over Time?
Perhaps extra public school staff were necessary because American students have become more disadvantaged over recent decades.
Many believe children enrolled in schools today are “harder to teach” than children a generation ago; Berliner and Biddle (1995) may be the most prominent and oft-cited proponents of that view. Presumably, family breakdown, increased child poverty, or other factors may have caused the decline in graduation rates and the lack of increased test scores. There is good evidence that family breakdown and low family income do contribute to poorer rates of student achievement (see, for example, Heckman (2008)).
Although rates of living with one parent increased dramatically in the latter half of the 20th century, in other respects current American students are more
advantaged than their parents were. Specifically, American students typically live in households with more income, more educated parents (although that is changing because of the decline in public high school graduation rates), and have fewer siblings than previous generations. Higher income, more educated parents, and fewer siblings have all been shown to increase student achievement. Thus, those factors may offset the negative social trends that may decrease student achievement. Because there are factors that, by themselves, would lead to increases or decreases in student achievement, the extent to which American students are harder or easier to teach overall relative to the past is an empirical question.
That issue was considered by Hoxby (2003) who found that the characteristics of American students in 1998-99 were on balance “more beneficial for achievement” relative to 1970-71. Thus, contrary to the belief espoused by Berliner and Biddle (1995), American students did not become harder to teach during the period of large increases in per-pupil spending, slumping American high school graduation rates, and constant or declining test scores. Hoxby states:
“One does not have to be hopelessly optimistic to think that regular public schools in the U.S. could be substantially more productive.
“Straightforward productivity estimates suggest that their productivity was approximately 65 percent higher in 1970-71 than in 1998-99, the most recent year for which we can produce estimates. The 65 percent figure is what one gets by dividing National Assessment of Educational Progress scores by per- pupil spending, adjusted by the Consumer Price Index.… If one adjusts for the family background of student test-takers, the estimated decline in productivity grows slightly larger, to 68 (percent) or 69 percent. (The 68 percent figure is based on using coefficients from 1998-99 and the 69 percent figure is based on using coefficients from 1970-71).”15
Hoxby continues:
“That is, I did an Oaxaca decomposition using
310
305
300
295
290
285
280
275
270
FIGURE 7 National Assessment of Educational Progress(NAEP), Age 17, Public Schools, 1992 and 2008
Source: National Assessment of Educational Progress Long-Term Trend Assessment
Reading1992
288284
Reading2008
Math1992
Math2008
305 305
9
The friedman foundation for Educational choice
edchoice.org
coefficients from a cross-sectional regression of achievement on students’ characteristics and employed data from, first, 1970-71 and, then, 1998- 99. Either set of coefficients suggests that students’ characteristics were more beneficial for achievement in 1998-99 than in 1970-71 (emphasis added).
“The characteristics that can be considered are race, gender, region, parents’ education, parents’ income, number of siblings, having a single-parent family, and being an immigrant or child of an immigrant. The variables that are especially responsible for making family background more beneficial in 1998- 99 are parents’ education, number of siblings, and parents’ income.”16
Thus, it appears American students, on balance, are slightly more advantaged than students of a few decades ago—contrary to the claims made by Berliner and Biddle and many other public school advocates. Despite that relative advantage and the rather large increase in spending devoted to public education, public high school graduation rates are lower and test scores are flat or have declined slightly.
Data from the U.S. Census paint a similar portrait—in some respects, American students are more disadvantaged, but in other respects they have more advantages than their ancestors. For example, in 1959, the child poverty rate in the United States stood at 27.3 percent. By 1992, the child poverty rate had declined to 22.3 percent. In 2009, the child poverty rate stood at 20.7 percent.17
All else equal, the decline in childhood poverty should have led to higher student achievement.
On the other hand, the percent of children who were foreign-born increased to 12 percent in 2010, from 7.9 percent in 1990, and 6.8 percent in 1950, according to the U.S. Census Bureau.18 Students who are not native English speakers may require extra help to learn English and succeed in school. The percent of children who lived with only one parent increased significantly between the mid-1960s and 1996, but that trend has not worsened further since then.19
how can Public Schoolslower class Sizes and increase administrative and other non-Teaching Staff, Yet not increase Student achievement?
If a given teacher has a smaller class size, she may be more effective because she could spend more time with each student on his or her unique needs. Also, there may be better classroom discipline, fewer disruptions, etc. Certainly that teacher would not become less effective with fewer students in the classroom. But, read the first sentence of this paragraph carefully—if a given teacher…. If class sizes are lowered, many students will be taught by one of the newly hired teachers, and that is the key insight to understanding the trade-off between class size and teacher effectiveness.
Trade-offs between quantity and quality exist in many realms of life, including class-size reduction. If public schools across a state or the entire nation implement class-size reductions, they have to hire thousands of more teachers. As public schools do so, they may fill classrooms “with any warm bodies (they) can find.” Rivkin, et al. (2005), Koedel and Betts (2011), and many other careful empirical studies document the wide disparity in teaching effectiveness within the public
So the real danger we face in simultaneously pursuing higher teacher standards and smaller classes is that we will have a small but excellent corps of teachers who have met the raised standards but a growing number of classrooms that we will be forced to staff with any warm bodies we can find.” — Arthur levine,former Dean of columbia’s teachers’ college

The School Staffing Surge: Decades of Employment Growth in America’s Public Schools 10
edchoice.org
education system.20 Based on those results, Hanushek (2010) reports:
“Literally hundreds of research studies have focused on the importance of teachers for student achievement. Two key findings emerge. First, teachers are very important; no other measured aspect of schools is nearly as important in determining student achievement. Second, it has not been possible to identify any specific characteristics of teachers that are reliably related to student outcomes.”21
Hanushek continues:
“Some teachers year after year produce bigger gains in student learning than other teachers. The magnitude of the differences is truly large, with some teachers producing 1½ years of gain in achievement in an academic year while others with equivalent students produce only ½ year of gain. In other words, two students starting at the same level of achievement can know vastly different amounts at the end of a single academic year due solely to the teacher to which they are assigned. If a bad year is compounded by other bad years, it may not be possible for the student to recover. No other attribute of schools comes close to having this much influence on student achievement. The available estimates for, say, class size reduction, do not suggest any leverage past the earliest grades of school, and then the expected effects are small.”22
In an earlier study, Hanushek (2002) put the results on the large differences in teacher effectiveness in context:
“We can also return to the popular argument that family background is overwhelmingly important and that schools cannot be expected to make up for bad preparation from home. The latter estimates of teacher performance suggest that having three years of good teachers (85th percentile) in a row would overcome the average achievement deficit between low-income kids (those on free or reduced- price lunch) and others. In other words, high quality teachers can make up for the typical deficits that
we see in the preparation of kids from disadvantaged backgrounds.”23
As public schools have reduced class sizes continually since at least 1950, they have had to hire more teachers. And, the evidence is in—the disparity in effectiveness across teachers is considerable. Accordingly, state governments and local public school boards should have been more concerned with improving teacher effectiveness than lowering class sizes.
Analogously, hiring more non-teaching personnel likely lowers the average quality of that workforce as well. Another concern with hiring more non-teaching staff is the possibility it increases bureaucracy and reduces the amount of time and energy teachers can devote to their students. Berliner and Biddle (1995) called excessive “bureaucratization” one of the “real problems of American education”—and their information on bureaucracy largely comes before the time period under study here. Thus, there has been a rather dramatic increase in bureaucracy even since public school advocates Berliner and Biddle claimed that excessive bureaucracy was a problem.
“I used to be up late preparing creative lessons that I loved. Now I’m up late getting my data in,” a Fairfax, Virginia teacher told the Washington Post in 2011. The Post reporter continued, “She and others from her school said administrative chores have become so excessive that teachers have broken down and cried at work.”24
That news article pins the blame for the increase in “administrative chores” for teachers on testing requirements under NCLB. However, excessive paperwork for teachers has long been a feature of the American public education system. In 1987, researchers had teachers fill out time diaries and found that, on average, they spent eight hours per week on paperwork either at school or at home.25 In addition, public school teachers and administrators often have complained about excessive paperwork under the federal Individuals with Disabilities Education Act (IDEA). The National Association of Elementary School Principals (NAESP) and others have advocated
11
The friedman foundation for Educational choice
edchoice.org
for a reduction in paperwork. NAESP quoted one teacher as saying, “It’s the additional special-education paperwork that I find most burdensome because I have to generate the same information and repeat it over and over on different forms.”26 A Westat study, commissioned by the U.S. Department of Education, found that paperwork was burdensome for special education teachers and recommended reducing it.27
A decline in average educator quality (the result of hiring more teachers and non-teaching staff) and increased bureaucracy and paperwork (perhaps inherent when more non-teaching staff are employed) may be the reasons increased staffing has not appeared to boost student achievement.28 Regardless of the reasons, public schools have increased staffing dramatically, especially non-teaching staff, and student achievement has not improved in measurable ways.
increases in Public SchoolStaff in the 50 States and Washington, D.c.
Table 1 shows the changes in public school staffing compared to changes in student populations for public schools in the U.S. as a whole, each of the 50 states, and Washington, D.C., between FY 1992 and FY 2009. As can be seen in Table 1, different states experienced different patterns over that period. For ease of exposition, Washington, D.C., is treated as a state. From 1992 to 2009, 48 states grew school personnel at a faster rate than their increase in students. Forty-six states increased teachers and 48 states upped the number of non-teaching personnel at a faster rate than their increase in students.
Even when student populations were declining, public school systems were increasing staffing between 1992 and 2009. Nine states with declining student populations had significant increases in public school personnel—D.C., Iowa, Louisiana, Maine, Mississippi, North Dakota, South Dakota, Vermont, and Wyoming. For example, Maine experienced an 11 percent decline in students from 1992 to 2009; however, the number
of public school personnel increased by 35 percent. Perhaps more noteworthy during that period is the number of teachers in Maine public schools increased by 3 percent while the number of non-teaching personnel increased by 76 percent. The other two states with declining student populations—Montana and West Virginia—did not decrease staffing at nearly the same rate as their declines in students. Between 1992 and 2009, three states increased public school personnel at a slower rate than their rise in students—Arizona, Nevada, and South Carolina.
At www.edchoice.org/StaffSurge/Map, graphs for the 50 states and Washington, D.C., show the percentage changes in public school staffing and the number of students from 1992 to 2009.
For some years, six states reported inaccurate data on public school staffing to the U.S. Department of Education, according to the National Center for Education Statistics. For the following five states, accurate data were used for years closest to FY 1992 and FY 2009: Illinois (FY 1992 and FY 2006), Kansas (FY 1992 and FY 2006), Louisiana (FY 1991 and FY 2009), Montana (FY 1993 and FY 2009), and Nevada (FY 1993 and FY 2003). Accurate data on non-teaching staff could not be obtained for South Carolina; thus, the reported decline may be chimerical.
It is puzzling as to why a state and its school districts could not accurately report how many teachers or non-teaching staff were employed in public schools—states must report that information annually to the U.S. Department of Education.
ranking the 50 States and Washington, D.c., on growth in Public School employment
During FY 1992 to FY 2009, 40 states experienced growth in public school student populations, whereas 11 states saw declines. Because of negative numbers, it is easier to rank separately states that are growing and states that are shrinking. The next two subsections

The School Staffing Surge: Decades of Employment Growth in America’s Public Schools 12
edchoice.org
TABLE 1 Changes in the Staf�ng and Student Populations in American Public Schools, FY 1992 to FY 2009
17.2%3.3%
10.1%65.6%9.2%
23.8%38.0%17.9%22.7%-14.8%36.2%40.6%2.7%
21.9%14.3%9.3%-0.8%5.0%3.7%
-12.7%-10.8%14.6%13.3%4.2%8.1%-2.4%8.9%
-11.3%4.7%
72.8%11.7%24.5%7.0%3.7%
35.6%-20.0%1.9%9.7%
15.4%4.9%2.2%
14.4%-3.9%16.6%37.2%22.6%-3.6%21.6%19.3%-11.7%7.3%
-14.6%
United StatesAlabamaAlaskaArizona
ArkansasCaliforniaColorado
ConnecticutDelaware
District of ColumbiaFloridaGeorgiaHawaiiIdahoIllinoisIndianaIowa
KansasKentuckyLouisiana
MaineMaryland
MassachusettsMichigan
MinnesotaMississippi
MissouriMontanaNebraskaNevada
New HampshireNew JerseyNew Mexico
New YorkNorth CarolinaNorth Dakota
OhioOklahoma
OregonPennsylvaniaRhode Island
South CarolinaSouth Dakota
TennesseeTexasUtah
VermontVirginia
WashingtonWest Virginia
WisconsinWyoming
38.6%16.4%22.6%61.1%38.0%36.4%63.9%52.8%34.9%8.9%
55.1%79.9%38.9%46.4%27.8%30.6%20.0%26.9%29.9%10.7%34.6%46.2%24.9%16.8%39.5%21.7%31.7%-4.2%25.3%67.1%55.8%38.5%38.7%26.5%64.5%15.0%25.7%25.5%29.0%32.2%20.4%4.8%
24.7%50.1%92.4%47.3%39.1%55.8%34.1%-0.8%20.8%20.6%
32.4%18.1%11.4%61.0%44.1%35.6%47.1%41.0%36.5%-16.2%69.5%86.2%19.5%30.3%21.5%15.0%14.5%14.6%15.7%8.8%3.2%
35.1%25.8%14.2%18.2%18.7%29.2%-5.6%6.2%
69.3%36.6%42.5%30.4%26.8%67.8%5.8%9.2%
23.7%12.7%29.1%16.6%34.6%4.2%
50.8%49.6%29.2%24.7%10.7%26.8%-3.8%14.2%6.6%
45.7%14.7%34.3%61.3%31.9%37.3%82.6%68.5%32.8%42.0%40.6%74.1%68.9%73.2%35.9%46.2%25.9%43.1%43.4%12.6%76.1%59.5%23.8%19.1%68.2%24.5%34.5%-2.7%48.6%64.0%80.2%33.8%47.1%26.3%61.0%27.2%44.4%27.5%47.3%35.6%26.8%-32.7%55.4%49.4%
171.8%69.4%53.9%
100.0%43.0%2.8%
30.3%34.6%
Increase inStudents
Increase inTotal Staff
Increase inTeachers
Increase inAdministrators and
Other Non-Teaching StaffState
Source: U.S. Department of Education, National Center for Education Statistics, 1994 Digest of Education Statistics,Tables 40 and 85; 2010 Digest of Education Statistics, Tables 36 and 87; Author’s Calculations
13
The friedman foundation for Educational choice
edchoice.org
rank those states according to growth in total staff, teachers, and non-teaching personnel relative to the change in student population.
In the next six tables, percentages may appear to be “off” by one-tenth of 1 percent, but those differences are because of rounding.
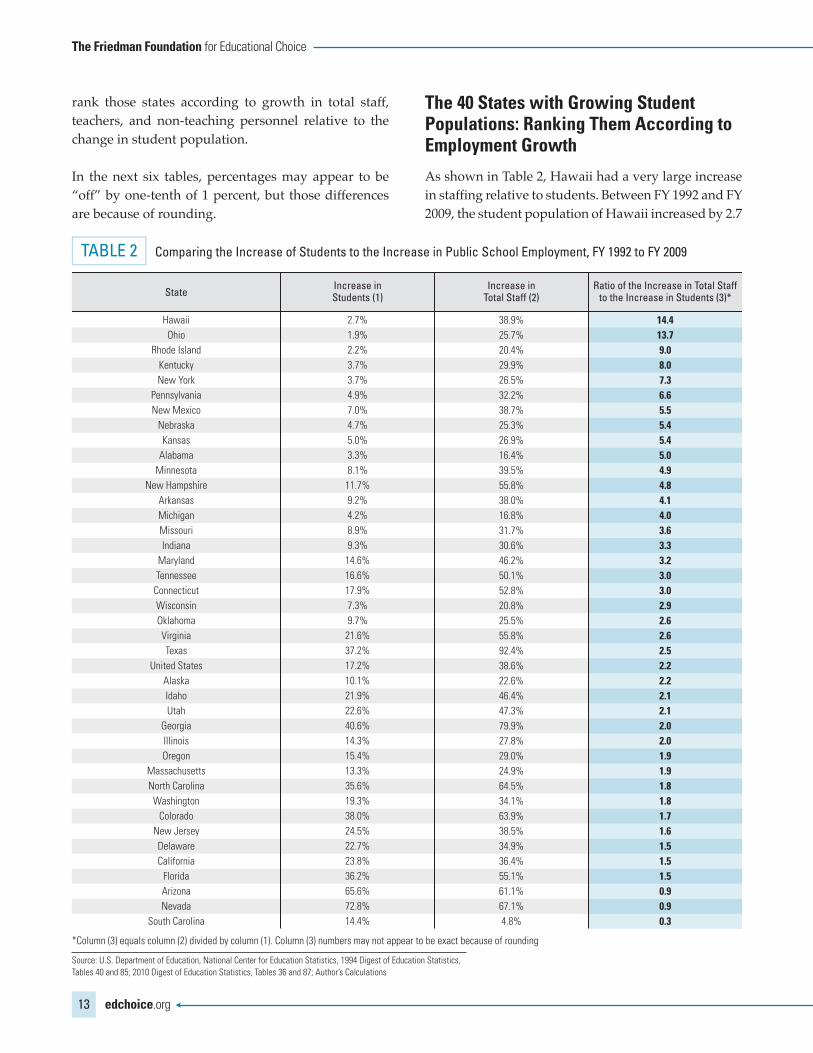
The 40 States with growing Student Populations: ranking Them according to employment growth As shown in Table 2, Hawaii had a very large increase in staffing relative to students. Between FY 1992 and FY 2009, the student population of Hawaii increased by 2.7
TABLE 2 Comparing the Increase of Students to the Increase in Public School Employment, FY 1992 to FY 2009
2.7%1.9%2.2%3.7%3.7%4.9%7.0%4.7%5.0%3.3%8.1%
11.7%9.2%4.2%8.9%9.3%
14.6%16.6%17.9%7.3%9.7%
21.6%37.2%17.2%10.1%21.9%22.6%40.6%14.3%15.4%13.3%35.6%19.3%38.0%24.5%22.7%23.8%36.2%65.6%72.8%14.4%
HawaiiOhio
Rhode IslandKentuckyNew York
PennsylvaniaNew Mexico
NebraskaKansas
AlabamaMinnesota
New HampshireArkansasMichiganMissouriIndiana
MarylandTennessee
ConnecticutWisconsinOklahomaVirginiaTexas
United StatesAlaskaIdahoUtah
GeorgiaIllinoisOregon
MassachusettsNorth Carolina
WashingtonColorado
New JerseyDelawareCalifornia
FloridaArizonaNevada
South Carolina
38.9%25.7%20.4%29.9%26.5%32.2%38.7%25.3%26.9%16.4%39.5%55.8%38.0%16.8%31.7%30.6%46.2%50.1%52.8%20.8%25.5%55.8%92.4%38.6%22.6%46.4%47.3%79.9%27.8%29.0%24.9%64.5%34.1%63.9%38.5%34.9%36.4%55.1%61.1%67.1%4.8%
14.413.79.08.07.36.65.55.45.45.04.94.84.14.03.63.33.23.03.02.92.62.62.52.22.22.12.12.02.01.91.91.81.81.71.61.51.51.50.90.90.3
Increase inStudents (1)
Increase inTotal Staff (2)
Ratio of the Increase in Total Staffto the Increase in Students (3)*State
*Column (3) equals column (2) divided by column (1). Column (3) numbers may not appear to be exact because of rounding
Source: U.S. Department of Education, National Center for Education Statistics, 1994 Digest of Education Statistics,Tables 40 and 85; 2010 Digest of Education Statistics, Tables 36 and 87; Author’s Calculations

The School Staffing Surge: Decades of Employment Growth in America’s Public Schools 14
edchoice.org
percent. Over that same period, the number of public school employees grew by 38.9 percent. Thus, staffing increased at a rate 14.4 times faster than students.
Looking at teachers alone, Rhode Island led the nation with growth among teachers at 16.6 percent while its student population increased only 2.2 percent. For
Rhode Island, teachers’ numbers grew at 7.4 times the rate of the change in student population. Data on teacher growth relative to students are reported in Table 3.
Table 4 displays increases in administration and other non-teaching personnel relative to changes in student
TABLE 3 Comparing the Increase of Students to the Increase in Teachers, FY 1992 to FY 2009
2.2%3.7%2.7%4.9%3.3%1.9%9.2%7.0%3.7%4.2%8.9%
11.7%16.6%5.0%9.7%
14.6%14.4%17.9%8.1%
40.6%7.3%
13.3%36.2%35.6%17.2%24.5%22.7%9.3%
14.3%23.8%19.3%21.9%4.7%
37.2%22.6%38.0%10.1%72.8%65.6%15.4%21.6%
Rhode IslandNew York
HawaiiPennsylvania
AlabamaOhio
ArkansasNew Mexico
KentuckyMichiganMissouri
New HampshireTennessee
KansasOklahomaMaryland
South CarolinaConnecticutMinnesota
GeorgiaWisconsin
MassachusettsFlorida
North CarolinaUnited StatesNew JerseyDelawareIndianaIllinois
CaliforniaWashington
IdahoNebraska
TexasUtah
ColoradoAlaskaNevadaArizonaOregonVirginia
16.6%26.8%19.5%29.1%18.1%9.2%
44.1%30.4%15.7%14.2%29.2%36.6%50.8%14.6%23.7%35.1%34.6%41.0%18.2%86.2%14.2%25.8%69.5%67.8%32.4%42.5%36.5%15.0%21.5%35.6%26.8%30.3%6.2%
49.6%29.2%47.1%11.4%69.3%61.0%12.7%10.7%
7.47.37.26.05.54.94.84.44.23.43.33.13.12.92.52.42.42.32.32.12.01.91.91.91.91.71.61.61.51.51.41.41.31.31.31.21.11.00.90.80.5
Increase inStudents (1)
Increase inTeachers (2)
Ratio of the Increase in Teachersto the Increase in Students (3)*State
*Column (3) equals column (2) divided by column (1)
Source: U.S. Department of Education, National Center for Education Statistics, 1994 Digest of Education Statistics,Tables 40 and 85; 2010 Digest of Education Statistics, Tables 36 and 87; Author’s Calculations

15
The friedman foundation for Educational choice
edchoice.org
population. Again, Hawaii led the way with a 68.9 percent increase in non-teaching personnel compared to 2.7 percent growth among students. Hawaii public schools added administrators and other non-teaching staff at a rate more than 25 times greater than its increase in students.
The 11 States with Declining Student Populations: ranking Them according to employment growth Given the negative numbers for those states, Table 5 contains a comparison of the absolute difference
TABLE 4 Comparing the Increase of Public School Students to the Increase in Non-Teaching Staff, FY 1992 to FY 2009
2.7%1.9%2.2%3.7%4.7%5.0%8.1%4.9%3.7%
11.7%7.0%9.3%
21.6%37.2%4.2%3.3%7.3%
14.6%8.9%
17.9%9.2%
10.1%21.9%15.4%22.6%16.6%9.7%
17.2%14.3%19.3%38.0%40.6%13.3%35.6%23.8%22.7%24.5%36.2%65.6%72.8%14.4%
HawaiiOhio
Rhode IslandKentuckyNebraskaKansas
MinnesotaPennsylvania
New YorkNew Hampshire
New MexicoIndianaVirginiaTexas
MichiganAlabama
WisconsinMarylandMissouri
ConnecticutArkansas
AlaskaIdaho
OregonUtah
TennesseeOklahoma
United StatesIllinois
WashingtonColoradoGeorgia
MassachusettsNorth Carolina
CaliforniaDelaware
New JerseyFloridaArizonaNevada
South Carolina
68.9%44.4%26.8%43.4%48.6%43.1%68.2%35.6%26.3%80.2%47.1%46.2%
100.0%171.8%19.1%14.7%30.3%59.5%34.5%68.5%31.9%34.3%73.2%47.3%69.4%49.4%27.5%45.7%35.9%43.0%82.6%74.1%23.8%61.0%37.3%32.8%33.8%40.6%61.3%64.0%-32.7%
25.423.711.911.710.48.78.47.37.26.86.75.04.64.64.64.54.24.13.93.83.53.43.33.13.13.02.82.72.52.22.21.81.81.71.61.41.41.10.90.9-2.3
Increase inStudents (1)
Increase in Administrators andOther Non-Teaching Staff (2)
Ratio of the Increase in Administratorsand Other Non-Teaching Staffto the Increase in Students (3)*
State
*Column (3) equals column (2) divided by column (1)
Source: U.S. Department of Education, National Center for Education Statistics, 1994 Digest of Education Statistics,Tables 40 and 85; 2010 Digest of Education Statistics, Tables 36 and 87; Author’s Calculations

The School Staffing Surge: Decades of Employment Growth in America’s Public Schools 16
edchoice.org
between the percentage declines in the numbers of public school students and percentage changes in the number of staff. For example, Maine experienced a decline of its public school student population of 10.8 percent from FY 1992 to FY 2009. Nevertheless, Maine public schools increased employment by 34.6 percent—which yields a 45.5 percentage-point difference between the percent change in students and the percent change in employment.
Table 6 contains analogous information for teachers. While Vermont grew its teacher workforce by 24.7
percent between FY 1992 and FY 2009, its student population declined by 3.6 percent over that period—a difference of 28.3 percentage points.
Maine’s surge in staffing was caused by a massive increase in the hiring of administrators and other non-teaching personnel. As shown in Table 7, Maine public schools increased the workforce of non-teaching personnel by 76.1 percent between FY 1992 and FY 2009, while its student population declined by almost 11 percent.
TABLE 5 Difference Between the Change in Student Population to the Change in Public School Employment, FY 1992 to FY 2009
-10.8%-3.6%
-14.6%-20.0%-3.9%-2.4%
-14.8%-12.7%-0.8%
-11.7%-11.3%
MaineVermontWyoming
North DakotaSouth DakotaMississippi
District of ColumbiaLouisiana
IowaWest Virginia
Montana
34.6%39.1%20.6%15.0%24.7%21.7%8.9%
10.7%20.0%-0.8%-4.2%
45.5%42.7%35.2%35.0%28.6%24.1%23.7%23.4%20.7%11.0%7.1%
Change inStudents (1)
Change inTotal Staff (2)
Change in Total Staff Minusthe Change in Students (3)*State
*The percentage in column (3) equals coulum (2) minus column (1)
Source: U.S. Department of Education, National Center for Education Statistics, 1994 Digest of Education Statistics,Tables 40 and 85; 2010 Digest of Education Statistics, Tables 36 and 87; Author’s Calculations
TABLE 6 Difference Between the Change in the Public School Student Population to the Change in the Teaching Force, FY 1992 to FY 2009
-3.6%-20.0%-12.7%-14.6%-2.4%-0.8%
-10.8%-3.9%
-11.7%-11.3%-14.8%
VermontNorth Dakota
LouisianaWyoming
MississippiIowa
MaineSouth DakotaWest Virginia
MontanaDistrict of Columbia
24.7%5.8%8.8%6.6%
18.7%14.5%3.2%4.2%-3.8%-5.6%
-16.2%
28.3%25.8%21.5%21.3%21.1%15.3%14.1%8.2%8.0%5.7%-1.3%
Change inStudents (1)
Change inTeachers (2)
Change in Teachers Minusthe Change in Students (3)*State
*The percentage in column (3) equals coulum (2) minus column (1).
Source: U.S. Department of Education, National Center for Education Statistics, 1994 Digest of Education Statistics,Tables 40 and 85; 2010 Digest of Education Statistics, Tables 36 and 87; Author’s Calculations

17
The friedman foundation for Educational choice
edchoice.org
What if the growth rate for non-Teaching Personnel had Been the Same as the growth rate for Public School Students and the growth rate for Teachers had Been “only” 1.5 Times the growth rate of Students?
As previously discussed, public schools in 47 states grew their non-teaching workforces at a rate greater than their increases in students—or increased their non-teaching workforce while their student counts decreased. One more state, Montana, decreased its non-teaching workforce in response to a decline in students, but the drop in students was 8.6 percentage points larger than the decline in non-teaching staff (-2.7 percent versus -11.3 percent, as shown in Table 7).
But what if states had changed their non-teaching personnel commensurate with their change in student populations? What if there had not been a disproportionate increase in staffing of administrators and other non-teaching personnel? What if the increase in teachers had been “only” 1.5 times as large as the increase in students? If these two trends actually had occurred, what taxpayer resources would have been available for other uses?
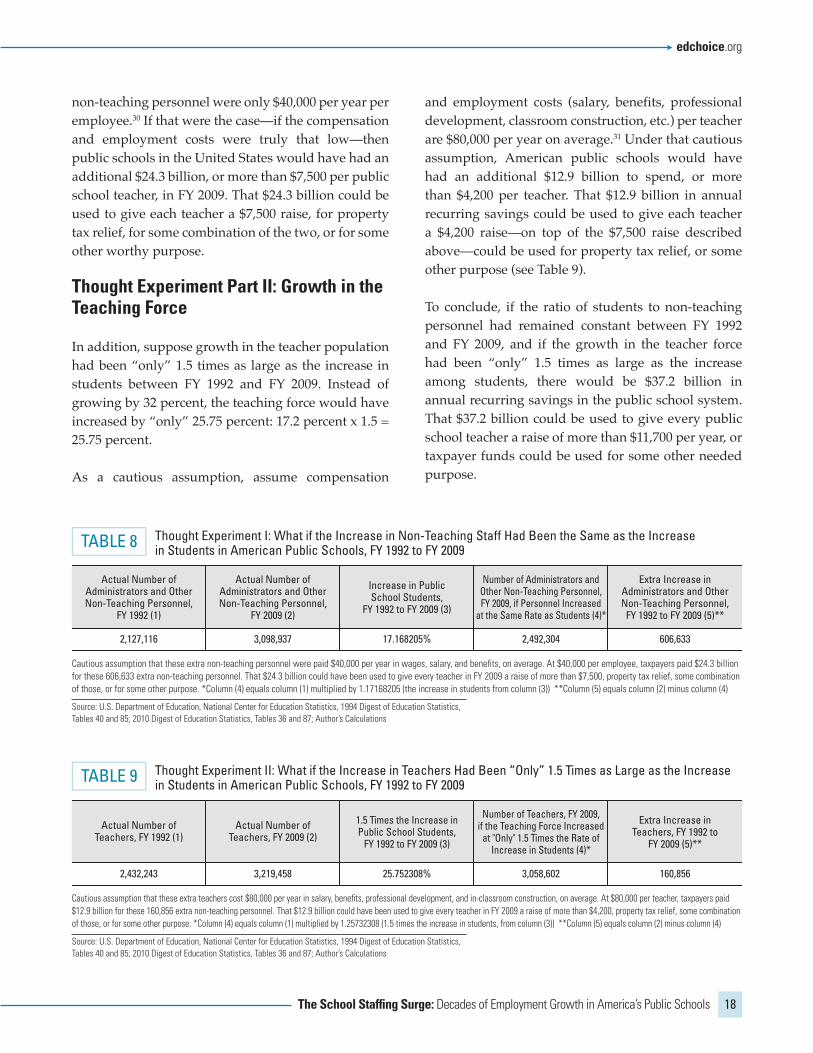
Thought experiment Part i: growth in non-Teaching Personnel
Between FY 1992 and FY 2009, public schools in the United States experienced a 17.2 percent increase in students. What if the increase in administration and other non-teaching personnel had increased at only 17.2 percent over that period?
The results of that thought experiment are in Table 8. Between FY 1992 and FY 2009, the number of non-teaching personnel in American public schools increased to 3.1 million full-time equivalents (FTEs) from 2.13 million FTEs, a 46 percent increase in staffing. If the number of non-teaching personnel had merely matched student growth and grown “only” 17.2 percent, the number of non-teaching personnel in American public schools would have been 2.5 million in FY 2009. Thus, the actual number of non-teaching personnel was more than 606,000 FTEs above what would have been if staffing growth had been proportional. Many public school officials and their advocates like to claim that a large proportion of their budgets represent “fixed” costs. If that were true, then the increase in administration, for example, should have been less than the increase in students—if those costs were truly fixed.29
As an extremely cautious assumption, assume the average compensation and employment costs of those
TABLE 7 Difference Between the Change in the Public School Student Population to the Change in Non-Teaching Staff, FY 1992 to FY 2009
-10.8%-3.9%-3.6%
-14.8%-14.6%-20.0%-2.4%-0.8%
-12.7%-11.7%-11.3%
MaineSouth Dakota
VermontDistrict of Columbia
WyomingNorth DakotaMississippi
IowaLouisiana
West VirginiaMontana
76.1%55.4%53.9%42.0%34.6%27.2%24.5%25.9%12.6%2.8%-2.7%
87.0%59.3%57.5%56.8%49.2%47.2%26.9%26.6%25.4%14.5%8.6%
Change inStudents (1)
Change in Administrators andOther Non-Teaching Staff (2)
Change in Administratorsand Other Non-Teaching Staff
Minus the Change in Students (3)*State
*The percentage in column (3) equals coulum (2) minus column (1).
Source: U.S. Department of Education, National Center for Education Statistics, 1994 Digest of Education Statistics,Tables 40 and 85; 2010 Digest of Education Statistics, Tables 36 and 87; Author’s Calculations
The School Staffing Surge: Decades of Employment Growth in America’s Public Schools 18
edchoice.org
non-teaching personnel were only $40,000 per year per employee.30 If that were the case—if the compensation and employment costs were truly that low—then public schools in the United States would have had an additional $24.3 billion, or more than $7,500 per public school teacher, in FY 2009. That $24.3 billion could be used to give each teacher a $7,500 raise, for property tax relief, for some combination of the two, or for some other worthy purpose.
Thought experiment Part ii: growth in the Teaching force
In addition, suppose growth in the teacher population had been “only” 1.5 times as large as the increase in students between FY 1992 and FY 2009. Instead of growing by 32 percent, the teaching force would have increased by “only” 25.75 percent: 17.2 percent x 1.5 = 25.75 percent.
As a cautious assumption, assume compensation
and employment costs (salary, benefits, professional development, classroom construction, etc.) per teacher are $80,000 per year on average.31 Under that cautious assumption, American public schools would have had an additional $12.9 billion to spend, or more than $4,200 per teacher. That $12.9 billion in annual recurring savings could be used to give each teacher a $4,200 raise—on top of the $7,500 raise described above—could be used for property tax relief, or some other purpose (see Table 9).
To conclude, if the ratio of students to non-teaching personnel had remained constant between FY 1992 and FY 2009, and if the growth in the teacher force had been “only” 1.5 times as large as the increase among students, there would be $37.2 billion in annual recurring savings in the public school system. That $37.2 billion could be used to give every public school teacher a raise of more than $11,700 per year, or taxpayer funds could be used for some other needed purpose.
Source: U.S. Department of Education, National Center for Education Statistics, 1994 Digest of Education Statistics,Tables 40 and 85; 2010 Digest of Education Statistics, Tables 36 and 87; Author’s Calculations
TABLE 8 Thought Experiment I: What if the Increase in Non-Teaching Staff Had Been the Same as the Increasein Students in American Public Schools, FY 1992 to FY 2009
Actual Number ofAdministrators and OtherNon-Teaching Personnel,
FY 1992 (1)
2,127,116 3,098,937 17.168205% 2,492,304 606,633
Actual Number ofAdministrators and OtherNon-Teaching Personnel,
FY 2009 (2)
Increase in PublicSchool Students,
FY 1992 to FY 2009 (3)
Number of Administrators andOther Non-Teaching Personnel,FY 2009, if Personnel Increased
at the Same Rate as Students (4)*
Extra Increase inAdministrators and OtherNon-Teaching Personnel,
FY 1992 to FY 2009 (5)**
Cautious assumption that these extra non-teaching personnel were paid $40,000 per year in wages, salary, and bene�ts, on average. At $40,000 per employee, taxpayers paid $24.3 billionfor these 606,633 extra non-teaching personnel. That $24.3 billion could have been used to give every teacher in FY 2009 a raise of more than $7,500, property tax relief, some combinationof those, or for some other purpose. *Column (4) equals column (1) multiplied by 1.17168205 (the increase in students from column (3)) **Column (5) equals column (2) minus column (4)
Source: U.S. Department of Education, National Center for Education Statistics, 1994 Digest of Education Statistics,Tables 40 and 85; 2010 Digest of Education Statistics, Tables 36 and 87; Author’s Calculations
TABLE 9 Thought Experiment II: What if the Increase in Teachers Had Been “Only” 1.5 Times as Large as the Increasein Students in American Public Schools, FY 1992 to FY 2009
Actual Number ofTeachers, FY 1992 (1)
Actual Number ofTeachers, FY 2009 (2)
2,432,243 3,219,458 25.752308% 3,058,602 160,856
1.5 Times the Increase inPublic School Students,
FY 1992 to FY 2009 (3)
Number of Teachers, FY 2009,if the Teaching Force Increased
at "Only" 1.5 Times the Rate ofIncrease in Students (4)*
Extra Increase inTeachers, FY 1992 to
FY 2009 (5)**
Cautious assumption that these extra teachers cost $80,000 per year in salary, bene�ts, professional development, and in-classroom construction, on average. At $80,000 per teacher, taxpayers paid$12.9 billion for these 160,856 extra non-teaching personnel. That $12.9 billion could have been used to give every teacher in FY 2009 a raise of more than $4,200, property tax relief, some combinationof those, or for some other purpose. *Column (4) equals column (1) multiplied by 1.25732308 (1.5 times the increase in students, from column (3)) **Column (5) equals column (2) minus column (4)

19
The friedman foundation for Educational choice
edchoice.org
conclusion
American taxpayers have been paying for increased staffing in public schools for decades, with public school teachers and non-teaching staff outpacing the rising number of students. Thus, pupil-staff ratios and pupil-teacher ratios in American public schools have declined dramatically since 1950.
Those staffing increases also were present over the past generation, 1992 to 2009—while the number of American public school students grew by 17 percent, there was a 32 percent increase in teachers and a 46 percent rise in non-teaching staff.
The changes in public school staffing have made the American education system top-heavy, particularly when compared to other wealthy nations. According to the OECD, the United States spends more of its taxpayer funds for public schools on non-teaching personnel—and less on teachers—relative to other OECD members. In 2007, American public schools spent 54.8 percent of operating expenditures on teachers while the average for all OECD nations was 63.8 percent. At the same time, American public schools devoted 25.7 percent of operating expenditures to non-teaching staff; the OECD average was only 14.9 percent. Thus, American public schools spend around 72 percent more on non-teaching staff as a proportion of their operating budgets relative to the other nations in the OECD. It is worth mentioning that overall spending per student in American public schools ranks among the very highest OECD nations.
There is evidence the American people support reductions in public school staffing. According to 2012 polling data reported by the Thomas B. Fordham Institute, 69 percent of adults surveyed favor “reducing the number of district-level administrators to the bare minimum” as a “good way to save money because it means cutting bureaucracy without hurting classrooms.” Only 20 percent said it was “a bad way to save money because districts need strong leadership and good leaders cost money.” The survey also found 73 percent of adult respondents would choose to have a larger class with 27 students—provided it is “taught
by one of the district’s best performing teachers”—over a smaller class with 22 students “taught by a randomly chosen teacher.” Only 21 percent opposed having the larger class size with a better teacher.32
At the beginning of this report, two issues were proposed for consideration:
• Although dramatic increases in staffing in K-12 schools perhaps were warranted in 1950, does that necessarily imply public school staffing should increase forever? Are adding teachers and non-teaching staff at rates higher than increases in students a wise investment?
• Is there an inherent trade-off between the number of public school staff and overall public school staff quality? When public schools hire more staff, does that require hiring less effective personnel and create more bureaucracy to burden classroom teachers?
Based on the historical and massive increase in staffing America’s public education system and the flat (or even declining) student achievement levels, why does anyone believe states should “double-down” by further raising taxes to spend even more money per student on public schools? There is no evidence students of today are more disadvantaged than their ancestors. In addition, increases in public school staffing predated No Child Left Behind. So, how can the United States improve educational opportunities for children?
“One does not have to be hopelessly optimistic to think that regular public schools in the U.S. could be substantially more productive,” wrote Caroline Hoxby in her 2003 article. Historically, American public schools had the same levels of achievement as today at a much lower cost to taxpayers. Taxpayers and students appear to have received the bad end of an exchange—more teachers, and to a larger extent more non-teaching staff, have been added to public school payrolls—which likely has lowered the average effectiveness of teachers and non-teachers alike. Hiring more personnel leads public schools to move down

The School Staffing Surge: Decades of Employment Growth in America’s Public Schools 20
edchoice.org
the quality distribution to fill those new positions. Historical evidence suggests less is more when it comes to public school staffing. If that conclusion is wrong, why did student achievement in public schools not improve with dramatically lowered class sizes and increased non-teaching staff in recent decades?
Further, the massive taxpayer investment for increased public school staffing could have been spent in a more effective manner within the public school system. If the ratio of students to non-teaching personnel had remained constant between FY 1992 and FY 2009, and if the growth in the teacher force had been “only” 1.5 times as large as the rise among students, there would be $37.2 billion in annual recurring savings in the public school system.
A large body of research finds dramatic differences in effectiveness between high-performing and low-performing teachers. Given that class-size reductions force public schools to hire more low-performing teachers, funds spent on class-size reduction and administration would seem better allocated toward higher salaries for great teachers—if one wanted to keep those taxpayer funds in the public education system.
However, parents, other citizens, and policymakers may want to cast a wider net in looking for opportunities to improve the education offered to students. In contrast to the static student achievement in public schools (despite massive increases in taxpayer funding), school choice programs have a good track record. All forms of enhanced school choice tried in the U.S. have led to an improvement in academic outcomes—in just one case was there no effect—for those who remain in public schools. The most recent empirical study on that topic, by Figlio and Hart (2010),33 shows “evidence that public schools subject to more competitive pressure from private schools raised their test scores the most following the introduction of Florida’s program.” They found that the greater the competition for Florida’s tax-credit scholarship program, the larger the benefits to Florida public school students.
In a summary piece on the empirical research on this issue, Forster (2011) writes:
“Contrary to the widespread claim that vouchers do not benefit participants and hurt public schools, the empirical evidence consistently shows that vouchers improve outcomes for both participants and public schools. In addition to helping the participants by giving them more options, there are a variety of explanations for why vouchers might improve public schools as well. The most important is that competition from vouchers introduces healthy incentives for public schools to improve.”34
No study finds any evidence of academic harm for students who remain in public schools because of enhanced school choice. The evidence on this issue is crystal clear—greater school choice does not harm academic outcomes for students who remain in public schools. And, the bulk of the evidence suggests school choice benefits students who make a choice to attend a different school, either traditional public, charter, or private. Finally, new evidence suggests that just giving families school choice leads to better student outcomes—even if children remain in their traditional public schools. Perhaps choice gives public schools a greater incentive to focus on the individual needs of children when those children—and the taxpayer funding devoted to their education—are now able to leave to a charter or private school.
The first eight paragraphs of a piece by Arnold Kling and Nick Shultz (2010) provide a stark historical framing of the key question facing education (and health care) policy in America today.
“In the early 1920s, the Russian economy was flagging, having been ravaged by years of war and political turmoil. In an attempt at revival, Vladimir Lenin initiated a series of controversial reforms, including permitting a bit of profit-making enterprise in some areas of the economy. This move naturally shocked many Bolsheviks, who had risked their lives in the Russian Revolution in order to advance communist principles. Eager to alleviate their concerns, Lenin addressed the communist-
21
The friedman foundation for Educational choice
edchoice.org
party faithful at a convention in 1922. He told them not to worry: The reforms were relatively modest, and the new Soviet state would always retain its control over what he called the ‘commanding heights’ of the economy.
“By ‘commanding heights,’ Lenin meant the critical sectors that dominated economic activity— primarily electricity generation, heavy manufacturing, mining, and transportation. Because these industries were the foremost drivers of employment, production, and consumption in Russia—and because they were the essential growth sectors in any economy of that era that sought to be called ‘modern’—government control of these particular sectors meant government dominance over the economic life of the nation. A communist government could afford to permit relatively free markets in less significant sectors, Lenin thought, because as long as it controlled those industries that formed the heart of the economy, it effectively controlled the whole.
“Throughout much of the 20th century, communist and socialist parties around the world continued to see government dominance of these industries as a key goal. The commanding heights of the economy became crucial battlegrounds in the struggle between advocates of central planning and defenders of market economics.
“In America today, few people champion government control of the industries Lenin saw as the commanding heights. On the contrary, these sectors have been largely deregulated, and market forces have, for the most part, been permitted to govern their development for decades. Defenders of the market might therefore imagine that they have won, and that the struggles that remain are peripheral debates.
“But such a declaration of victory would be dangerously premature. Over the past few decades, our economy has undergone some fundamental changes—with the result that the fight for control over the commanding heights of American economic
life is still very much with us. And it is a fight that, at least for now, the free-market camp appears to be losing.
“The commanding heights of our economy today are not heavy manufacturing, energy, and transportation. They are, rather, education and health care. These are our foremost growth sectors—the ones most central to employment and consumption; the ones that, increasingly, drive our economy. And it is in precisely these two sectors that the case for extensive government intervention and planning, if not outright control, is dominant—and becoming ever more so.
“If there is to be any hope of reversing this trend, champions of market economics must come to see these two sectors as the front lines in the battle for capitalism. At stake is not only an ideological or theoretical point, but also American prosperity. The historical record makes this clear: In the nations where it was practiced, government control of the old commanding heights of the economy made those industries less efficient and less innovative— bringing overall economic performance down with them.
“Today, America risks following the same course. Looking to the coming decades, it will simply not be possible to maintain a genuine free market—or a thriving, innovative, growing economy—if our education and health sectors are controlled by the government. Champions of the market thus have their work cut out for them.”
Kling and Shultz provide a fascinating historical context for the key issue facing K-12 education policy today: Should the government control the education sector of our economy or should parents and educators?
If Americans want to improve the long-run growth of our economy, one way to do that is to use its scarce resources more efficiently. As introductory economics textbooks indicate, less land, labor, and capital in unproductive activities frees those scarce resources

The School Staffing Surge: Decades of Employment Growth in America’s Public Schools 22
edchoice.org
for other uses that benefit members of society through more goods and services or better preservation of our natural environment. The public education system does not know the best way to allocate resources in K-12 schools; its track record on staffing levels—especially non-teaching staff—while student achievement has been flat or in decline proves that.
Given the public education system’s dismal record and the positive evidence on school choice, decision-making should be decentralized so that individual parents, teachers, and educators can decide how to best organize schools. Under school choice, educators would be free to design schools, and parents would be free to trust the education of their children to those teachers and schools they deem best. The political and bureaucratic forces that are imposed on and come from within public education have led to dramatic increases in staffing—especially large increases in administrative and other non-teaching personnel—without a concomitant increase in student outcomes. The accountability that was imposed on public education leadership under No Child Left Behind seems to have changed staffing to some degree—while personnel levels continued to rise rapidly, more of that increase was from hiring teachers. Prior to NCLB public schools hired administrators and other non-teaching staff at a much higher rate than teachers. In the NCLB era, the increase in teachers has been virtually identical to the increase in non-teaching personnel—although both increased at a rate more than twice as large as the increase in students.
Perhaps the even greater accountability that would result from school choice would incent public school leaders to allocate the taxpayer resources in their care in even better ways (e.g., in hiring and retaining only the best teachers) for American students—instead of just adding more and more employees.

23
The friedman foundation for Educational choice
edchoice.org
referencesBerliner, David C., and Bruce J. Biddle. “The Manufactured Crisis: Myths, Fraud, And The Attack On America’s Public Schools.” New York: Basic Books, 1995.
Burke, Lindsey A. “How Escalating Education Spending is Killing Crucial Reform.” Heritage Foundation, Backgrounder No. 2739, October 15, 2012.
Children’s Defense Fund. “The State of America’s Children: 2010.” Washington, D.C.: Children’s Defense Fund, 2010.
Farkas, Steve, and Ann Duffett. “How Americans Would Slim Down Public Education.” Thomas B. Fordham Institute, 2012.
Figlio, David. M., and Cassandra M.D. Hart. “Competitive Effects of Means-Tested School Vouchers.” Working Paper 16056, National Bureau of Economic Research, 2010.
Forster, Greg. “A Win-Win Solution: The Empirical Evidence on School Vouchers.” Indianapolis: Friedman Foundation for Educational Choice, 2011.
Freed, Chester W., and Mary E. Ketchem. “Teacher Paperwork Study: Type, Time and Difficulty.” ERIC Document 285681, 1987.
Goldin, Claudia, and Lawrence Katz. “The Race Between Education and Technology.” Cambridge: Belknap Press, 2008.
Hanushek, Eric. A. “Teacher Quality.” Teacher Quality. Edited by Lance T. Izumi and Williamson M. Evers. Palo Alto: Hoover Institution Press, 2002.
------. “The Economic Value of Higher Teacher Quality.” Working Paper 16606, National Bureau of Economic Research, 2010.
Hanushek, Eric. A. and Ludger Woessmann. “How Much Do Educational Outcomes Matter in OECD Countries?” Working Paper 16515, National Bureau of Economic Research, 2010.
Heckman, James J. “Schools, Skills, and Synapses.” Working Paper 14064, National Bureau of Economic Research, 2008.
Heckman, James J., and Paul LaFontaine. “The American High School Graduation Rate: Trends and Levels.” Review of Economics and Statistics 92, no. 2, 2010: pp. 244–262.
Hoxby, Caroline M. “School Choice and Competition: Evidence from the United States.” Swedish Economic Policy Review 10, 2003: pp. 9-65.
Johnson, William R., and Derek Neal. “Basic Skills and the Black-White Earnings Gap.” The Black White Test Score Gap. Edited by C. Jencks and M. Phillips. Washington, D.C.: Brookings Institution Press, 1998.
Klein, Sheri. “Reducing Special Education Paperwork.” Principal 84, no. 1, 2004: pp. 58-60.
Kling, Arnold, and Nick Shultz. “The New Commanding Heights.” National Affairs, Issue Number 8, Summer 2011: pp. 3-19.
Koedel, Cory, and Julian R. Betts. “Does Student Sorting Invalidate Value-Added Models of Teacher Effectiveness? An Extended Analysis of the Rothstein Critique.” The Journal of Education Finance and Policy 6, no. 1, 2011: pp. 18-42.
Levine, Arthur. “Dueling Goals for Education.” New York Times, April 7, 1999, A21.
McCartney, Robert. “Paperwork Burden Plagues Teachers.” Washington Post, November 12, 2011, http://www.washingtonpost.com/local/paperwork-burden-plagues-teachers/2011/11/11/gIQALB3aFN_story.html.
Rivkin, Steven G., Eric A. Hanushek, and John. A. Kain. “Teachers, Schools, and Academic Achievement.” Econometrica 73, no 2, 2005: pp. 417-458.
Scafidi, Benjamin. “The Fiscal Effects of School Choice Programs on Public School Districts.” Indianapolis: Friedman Foundation for Educational Choice, 2012.
U.S. Department of Education. Digest of Education Statistics, 2006. National Center for Education Statistics. http://nces.ed.gov/programs/digest/d10/.
------. Digest of Education Statistics, 2010. National Center for Education Statistics. http://nces.ed.gov/programs/digest/d10/.
------. Highlights from PISA 2009, 2011. http://nces.ed.gov/pubs2011/2011004.pdf.
The School Staffing Surge: Decades of Employment Growth in America’s Public Schools 24
edchoice.org
notes1. A good argument can be made that staffing in American public schools needed to increase from what was present decades ago. Prior to the racial integration of public schools, many African American children had little or no taxpayer funds spent in their segregated schools. Second, students in less wealthy school districts often had much less spent on their educations than students in more affluent areas. Third, students with special needs often had relatively few resources devoted to their educations and needs. However, court cases and changes in federal and state policy led to dramatic increases in public school staffing in the 1950s, 1960s, 1970s, and 1980s. Are these large surges in public school staffing—especially in non-teaching personnel—still warranted today? 2. Information on the “Broader, Bolder Approach to Education” can be retrieved from http://www.boldapproach.org/.
3. Arnold Kling and Nick Shultz, “The New Commanding Heights,” National Affairs, Issue Number 8, Summer 2011: pp 3-19.
4. Lindsey A. Burke, “How Escalating Education Spending is Killing Crucial Reform,” Heritage Foundation, Backgrounder No. 2739, October 15, 2012.
5. A description of the OECD and a list of member nations can be retrieved from http://www.oecd.org/.
6. Different countries may count some school personnel, such as bus drivers, as “other” instead of counting them as non-teaching personnel. However, even if the United States is more likely than other OECD nations to count bus drivers and other support personnel as “other,” the implication is the same—the U.S. spends significantly more operating spending on non-teaching personnel because the percentage of U.S. public school operating budgets devoted to the “other” category is only one-half of one percentage point different than the OECD average. Education at a Glance 2010: OECD Indicators, Table B62b, Organisation for Economic Co-operation and Development, Paris.
7. U.S. Department of Education, Highlights from PISA 2009, 2011, http://nces.ed.gov/pubs2011/2011004.pdf.
8. U.S. Department of Education, Digest of Education Statistics, 2010, National Center for Education Statistics, http://nces.ed.gov/programs/digest/d10/.
9. Eric. A. Hanushek and Ludger Woessmann, “How Much Do Educational Outcomes Matter in OECD Countries?” Working Paper 16515, National Bureau of Economic Research, 2010.
10. This information on public high school graduation rates comes from Table 112 of the 2010 Digest of Education Statistics and Table 101 of the 2006 Digest of Education Statistics, both from the National Center for Education Statistics at the U.S. Department of Education.
11. James J. Heckman and Paul LaFontaine, “The American High School Graduation Rate: Trends and Levels,” Review of Economics and Statistics 92, no. 2, 2010: pp. 244–262.
12. Claudia Goldin and Lawrence Katz, “The Race Between Education and Technology,” Cambridge, Belknap Press, 2008: pp. 6-7.
13. Goldin and Katz acknowledge that although many analysts of education look at the data and make conclusions such as mine and that those conclusions may be correct, they do not fully embrace them. What to do about the decrease in educational attainment in America is discussed on only a handful of pages in their almost 500-page book.
14. The NAEP Long-Term Trend Assessment is given every four years to a national sample of nine-, 13-, and 17-year-old students. This exam is better than the Main NAEP Assessment for analyzing national trends over time because the Long-Term Trend Assessment has been “relatively unchanged” since it was created, whereas the Main NAEP Assessment changes “about every decade to reflect changes in curriculum.” For a description of the NAEP Long-Term Trend Assessment and how it compares to the Main NAEP Assessment, see http://nces.ed.gov/nationsreportcard/about/ltt_main_diff.asp.
15. Caroline M. Hoxby, “School Choice and Competition: Evidence from the United States,” Swedish Economic Policy Review 10, 2003: pp. 16-18, 9-65.
16. Ibid, page 18. I know of no other study other than Hoxby’s that has examined this issue carefully.
17. The decline in childhood poverty rates from 1959 to 2009 was not linear. After significant decreases in the 1960s, the childhood poverty rate has experienced swings with changes in the U.S. macroeconomy. Information on childhood poverty trends is contained in Children’s Defense Fund, “The State of America’s Children: 2010,” Washington, D.C., Children’s Defense Fund, 2010.
18. This information on the percent of foreign-born children from the 1950 Census and 1990 Census can be accessed from http://www.census.gov/population/www/documentation/twps0029/tab07.html. This information from the 2010 Census can be accessed from http://www.census.gov/population/foreign/data/cps2010.html.
19. See http://www.census.gov/prod/2011pubs/p70-126.pdf.
20. Steven G. Rivkin, Eric A. Hanushek, and John A. Kain, “Teachers, Schools, and Academic Achievement,” Econometrica, 73, 2005: pp. 417-458. Cory Koedel and Julian R. Betts, “Does Student Sorting Invalidate Value-Added Models of Teacher Effectiveness? An Extended Analysis of the Rothstein Critique,” The Journal of Education Finance and Policy 6(1), 2011: pp. 18-42.
21. Eric A. Hanushek, “The Economic Value of Higher Teacher Quality,” Working Paper 16606, National Bureau of Economic Research, 2010: p. 3.
22. Ibid.
23. Eric A. Hanushek, “Teacher Quality,” Teacher Quality, Palo Alto, Hoover Institution Press, 2002: p. 3.
24. Robert McCartney, “Paperwork Burden Plagues Teachers,” Washington Post, November 12, 2011, http://www.washingtonpost.com/local/paperwork-burden-plagues teachers/2011/11/11/gIQALB3aFN_story.html.
25. Chester W. Freed and Mary E. Ketchem, “Teacher Paperwork Study: Type, Time and Difficulty,” ERIC Document 285681, 1987.
26. Sheri Klein, “Reducing Special Education Paperwork,” Principal 84, no. 1, 2004: p. 58.
27. Ibid.
28. Proponents of smaller class sizes typically cite the evidence from the Tennessee STAR experiment that finds that smaller class sizes in grades K-3 may lead to achievement gains for students. While this conclusion from that experiment is controversial, let’s suppose this interpretation of the research findings is accurate. If it is the case that this experiment that involved 11,600 students showed that class-size reductions boosted student achievement, that result should be translated into policy with care. A statewide, national, or other larger-scale reduction in class size could have different effects because of the very large number of new teachers that would have to be hired to create the smaller classes. It is likely that these new teachers would be less effective, on average, than the incumbent teachers. Based on the evidence that there are extremely large differences in teacher effectiveness, these new teachers could lead to lower average student achievement and offset any gains of smaller classes taught by the incumbent teachers. 29. For a discussion of the issue of fixed and variable costs in public education see Benjamin Scafidi, “The Fiscal Effects of School Choice Programs on Public School Districts,” Indianapolis, Friedman Foundation for Educational Choice, 2012.
30. Data on the employment costs of non-teaching and non-administrative personnel in public schools are not readily available. However, there is some information available for the state of Georgia. Public school employees in Georgia who are not employed as teachers and hold a valid teaching certificate (e.g., superintendents, assistant superintendents, principals, assistant principals, librarians, curriculum directors, etc.) are paid on average 1.38 times the salary than the average Georgia teacher. Source: author’s calculations from http://reportcard2009.gaosa.org/(S(eqwgssn1o2c3z0bbu4bum255))/k12/persfiscal.aspx?TestType=pers&ID=ALL:ALL. However, it is likely the public school employees who do not hold valid teaching certificates are paid less, on average, than teachers. In FY 2009, public school teachers in the United States were paid on average $54,319, according to the 2011 Digest of Education Statistics (Table 83). An average of $40,000 per employee in salary, benefit, and employment costs seems to be a large underestimate of the true costs per non-teaching employee in American public schools considering that a sizeable fraction of non-teaching personnel are paid well above teachers and that the $54,319 figure does not include benefits and other employment costs.
31. According to the 2011 Digest of Education Statistics, the average salary for public school teachers in FY 2009 was $54,319 (Table 83). In addition to salary, teachers receive health and retirement benefits. Further employment costs for teachers include professional development and the costs of classroom construction and maintenance. Given the average salary, $80,000 is likely too low of a figure to use as the average employment cost per teacher in American public schools. Of course, some school districts incur higher employment costs and some incur lower employment costs—but $80,000 appears to be a cautious assumption.
32. In March 2012, the Thomas B. Fordham Institute conducted a randomized, nationally representative survey of adults 18 and older and obtained a total of 1,009 responses. A description of the survey and the complete survey results can be found in Steve Farkas and Ann Duffett, “How Would Americans Slim Down Public Education,” Washington, D.C., Thomas B. Fordham Institute, 2012. The quotes in the text come from Farkas and Duffett, 2012: p. 2.
33. David M. Fliglio and Cassandra M. D. Hart, “Competitive Effects of Means-Tested School Vouchers,” Cambridge, National Bureau of Economic Research, WP 16056, 2010.
34. Greg Forster, “A Win-Win Solution: The Empirical Evidence on School Vouchers,” Indianapolis, Friedman Foundation for Educational Choice, 2011: p. 1.

about the authorBen Scafidi is a professor of economics and director of the Economics of Education Policy Center at Georgia College & State University. He is also a fellow with the Friedman Foundation for Educational Choice and the director of education policy for the Georgia Community Foundation, Inc. His research has focused on education and urban policy. Previously, he served as chair of the state of Georgia’s Charter Schools Commission, the education policy advisor to Gov. Sonny Perdue, on the staff of both of Gov. Roy Barnes’ Education Reform Study Commissions, and as an expert witness for the state of Georgia
in school funding litigation. He received his Ph.D. in economics from the University of Virginia and his B.A. in economics from the University of Notre Dame. Ben and Lori Scafidi and their four children reside in Milledgeville, Georgia.
I thank Jeff Reed, Amy Saxon, Susan Meyers, Michael Chartier, and especially Paul DiPerna for helpful comments and David Browne for expert research assistance. I also thank Drew Vessely for the report’s professional design and layout and Andrew St. Angelo for its accompanying resources on the Friedman Foundation website. All remaining errors are mine.
25
The friedman foundation for Educational choice
edchoice.org

commitment to methods & TransparencyThe Friedman Foundation for Educational Choice is committed to research that adheres to high scientific standards, and matters of methodology and transparency are taken seriously at all levels of our organization. We are dedicated to providing high-quality information in a transparent and efficient manner.
All individuals have opinions, and many organizations (like our own) have specific missions or philosophical orientations. Scientific methods, if used correctly and followed closely in well-designed studies, should neutralize these opinions and orientations. Research rules and methods minimize bias. We believe rigorous procedural rules of science prevent a researcher’s motives, and an organization’s particular orientation, from pre-determining results.
If research adheres to proper scientific and methodological standards, its findings can be relied upon no matter who has conducted it. If rules and methods are neither specified nor followed, then the biases of the researcher or an organization may become relevant, because a lack of rigor opens the door for those biases to affect the results.
The author welcomes any and all questions related to methods and findings.

One American SquareSuite 2420Indianapolis, IN 46282(317) 681-0745edchoice.org
Dr. milton friedman, founderNobel laureate
Dr. rose D. friedman, founderNoted Economist
BoarD of DirecTorS
Dr. Patrick Byrne, chairmanchairman of the Board & cEO, Overstock.com
Janet f. martel, Vice chairpersonAttorney
lawrence a. o’connor, Jr., treasurerExecutive Director, Butler Business Accelerator
J. Scott enright, SecretaryExec. VP & General counsel, Emmis communications corp.
robert c. enlowPresident & cEO, friedman foundation for Educational choice
charles h. BrunieBrunie Associates
Dr. David D. friedmanProfessor, Santa clara university
greg gianfortefounder, rightNow technologies
William J. humechairman of the Board, Basic American, Inc.
fred S. Klipschchairman, Klipsch Group, Inc.
fred reamsreams Asset Management
Virginia Walden fordEducation Activist
Dr. michael WalkerPresident, the fraser Institute foundation