the role of literacy and numeracy skills across gender and...
TRANSCRIPT
The role of literacy and numeracy skills across genderand countries
Giannina Vaccaro∗
16th April 2018
This is a preliminary draft.Please do not cite or distribute without permission of the author.
Abstract
New data availability on skills has opened the possibility to answer different research questionsthat were difficult to tackle before. The recent work of Hanushek et al. (2015) using the PIAACsurvey of adult skills has shown that returns to skills are heterogeneous for different countries.Most of the research has used only one skill type (often literacy or numeracy) to generalize theimpact of skills. This article aims to disentangle the differences of numeracy and literacy skills andits interaction effect on labor market outcomes in a context of technological change. By includingeducation in the analysis, I am also able to compare the impact of numeracy and literacy skills toeducation. The article focuses on the different impact of numeracy and literacy skills for labourmarket outcomes targeting particularly gender differences. Overall, results show that nowadays,numeracy and literacy skills matter significantly for men and women. However, numeracy pays offmore than literacy skills. Numeracy and literacy seem not to be complementary, except amongfemale non-graduates. And skill differences do not explain gender wage gap. Women receive alwaysa wage penalty, even among homogeneous skill groups such as STEM graduates.
Keywords: Skills and Human Capital, Labour productivity, Gender Wage Differentials, LabourForce CompositionJEL-Classification: I26, J16, J24, J31, J82
∗E-mail: [email protected]. Geneva School of Economics and Management (GSEM), University of Geneva.Swiss National Centre of Competence in Research LIVES - Overcoming vulnerability: life course perspectives (NCCRLIVES). I would like to thanks Michele Pellizzari for his continual guidance and Jose Ramirez for his invaluable comments.Many thanks to the participants of the internal PhD Seminar (GSEM) and LIVEs Doctorials 2016 (Lausanne). Aparticular thank you to Rafael Lalive, Matthias Kliegel and Giovanni Ferro-Luzzi for their helpful insights. I deeplythank the financial support of the Swiss National Centre of Competence in Research LIVEs - Overcoming vulnerability:life course perspectives, granted by the Swiss National Science Foundation. All remaining errors are mine.
1
1 Introduction
The causal relationship between education and earnings is usually explained through two channels.On the one hand, the human capital theory explains that, in perfect competitive markets, educationincreases the individual marginal productivity and thus leads to higher earnings (Schultz 1961; Becker1962). On the other hand, the contract or signalling theory argues that workers use educationalcredentials to signal their abilities to the employers. Employers believe that these credentials arepositively correlated to higher abilities which will make employees more productive and thereforejustify higher earnings (Spence 2002).1
Quantitative measures of skill level allow better identification of individual productivity, and to dis-entangle the impact of schooling attainment and cognitive abilities for labour market outcomes. Cog-nitive skill measures and cognitive tests usually try to estimate the capacity of reasoning and solveproblems. There are established measures of skills that account for different competences.2 The onesthat are used most are literacy (which usually measures reading comprehension and writing skills) andnumerical skills. Despite a large body of literature that investigates returns to cognitive skills, mostof the studies only use one skill measure and try to explain labour outcomes by this single indicator(Hause 1972; Bishop 1992; De Baldini Rocha and Ponczek 2011). They have either replaced educationby skills or added skills as explanation for wages (Blackburn and Neumark 1995; Murnane, Willettand Levy 1995). Only very few included both skill measures, but they failed to determine their jointeffect, measured by the interaction of numeracy and literacy skills (Taubman and Wales 1974; Willisand Rosen 1979; McIntosh and Vignoles 2001; Shomos 2010). Many agree on the positive impact ofpersonal skills for labour outcomes (Bronars and Oettinger 2006; Cameron and Heckman 1998; Greenand Riddell 2003). However, the evidence about the economic returns to numeracy and literacy skillsis far from conclusive (Bound, Griliches and Hall 1986). Being able to use and manipulate both wordsand numbers has become essential in the current society, but the joint effect of numeracy and literacyskills, as well as their independent and relative importance are not yet clear.
Hanushek et al. (2015) have been pioneers in using the survey of adult skills. This survey is part ofthe Programme for the International Assessment of Adult Competencies (PIAAC), an internationaladults survey that provides standard background information as well as comparable skill measuresof cognitive and workplace skills, to analyse the role of skills across countries. This dataset is thesame I use in my analysis. The main finding of their study documents that wage impacts of skillsare heterogeneous and vary significantly by country. Although they show that their results do notdepend on the choice of a particular skill measure, Hanushek et al. (2015) focus only on numeracy asmeasure of skills. This contrast to my study because their focus is neither to analyse the relationshipbetween numeracy and literacy skills nor their interaction effect for wage determination.
Fewer studies have analysed the differences between economic returns to numeracy and literacy acrossgender, particularly with regard to differences in skill importance to labour productivity. Bound,Griliches and Hall (1986) is one of the pioneer studies that looks explicitly at the differences ofschooling returns between men and women. Using IQ scores as proxy for abilities, they found thatthe IQ-schooling-wage relationship is essentially sex-blind. However, due to data limitations, they
1. Cognitive abilities can be determined by innate circumstances before birth, but also they can be acquired anddeveloped in the life course (Cunha and Heckman 2007).
2. For example, the Cognitive Abilities Test (CogAT) tries to assess student’s abilities in reasoning and problemsolving using verbal, quantitative, and non-verbal (spatial) symbols.
2
were unable to determine if ability is priced differently in the marketplace for men and women. Twogaps can be identified in the gender related literature. First, most of the studies that examine therelationship between gender differences and cognitive skills analyse the effect of gender differenceson skill acquisition, rather than the impact of those skills on labour market outcomes (Lindberg etal. 2010; Niederle and Vesterlund 2010). Second, from the few studies that investigate the economicreturns to skills, most of them concentrated on analysing the returns to numeracy skills than onliteracy skills and even fewer on studying the effect of the interaction between numeracy and literacyacross gender. This is probably because numeracy test scores have been largely confirmed to be agood predictor for schooling decisions and future income (Paglin and Rufolo 1990; Murnane, Willettand Levy 1995; Grogger and Eide 1995; Murnane, Willett and Levy 1995; Altonji and Blank 1999).3
This study has two main objectives. First, it aims to disentangle the differences of numeracy andliteracy skills and its interaction effect on labour market outcomes in a context of technologicalchange. By including education in the analysis, I will also be able to compare the impact of numeracyand literacy skills to education. Second, by studying groups with homogeneous skill distribution,the paper seeks to determine whether numeracy and literacy skills matter significantly for men andwomen. It will also examine if women are penalized in the labour market among groups of adultsthat have potentially the same skills, such as those who study Science, Technology, Engineering andMath (STEM) graduate programs.
The main goal of this research is to provide a descriptive overview of the impact of skills on earnings,rather than analysing their causal effect. In this article, I present a simple theoretical frameworkthat uses wages as measure of individual productivity, and literacy, numeracy and education as themain explanatory variables. This framework enlightens the interpretation of the various parametersof interest when not controlling by unobserved skills and other factors in the main specifications. Itshows that the estimated coefficients are compound measures of unobserved and observed factors.Hereby, I will talk about “returns” to skills to refer to non-causal estimates, as it has also been donein the literature.
Across different model specifications and cross-checks, five main results are confirmed in this paper:First, numeracy and literacy skills matter for wages. Numeracy though, have larger point estimatesthan literacy skills. Second, there is little complementarity between numeracy and literacy skills,except among female non-graduates. Third, non-linearity effects of skills seem to be present, but Ifound no clear pattern. Fourth, skill differences do not explain the gender wage gap. Thus, womenare penalized in the labour market, even when having similar skills distribution than men. Fifth,country-specific and quantile income analyses show that the role of skills is very heterogeneous acrosscountries.
The study is carried out as follows. First, I analyse the overall impact of skills across countriesand quantile income groups, and then study the role of skills for each country. Section 2 providesa literature review. Section 3 develops a theoretical framework to clarify the estimation strategy.Section 4 describes the PIAAC data, details the groups of analysis and presents descriptive statisticsof skills and labour market outcomes. Section 5 details the empirical strategy, the main results androbustness checks. Section 6 interprets and discusses the results; and section 7 concludes. Variabledescriptions and estimations results different from the basic models are included in the Appendix.
3. Few exceptions look at the role of literacy and earnings such as Green and Riddell (2003).
3
2 Literature review
The literature establishes that educational attainment and wages are well predicted by cognitiveskills. Cawley, Heckman and Vytlacil (2001) added that the impact of cognitive ability on wages,controlling for education, is small and varies by race and gender. The impact of cognitive skills isusually decomposed into different measures: achievement tests that aim to capture the rate at whichpeople learn, and IQ tests such as the Raven’s progressive matrices to capture acquired knowledge(Kautz et al. 2014). Further, these tests are influenced by effort and noncognitive skills (Heckman,Stixrud and Urzua 2006).4
To measure the impact of cognitive skills, empirical studies have either replaced education by skillmeasures or added skills as explanation for wages. Blackburn and Neumark (1995) is one of thepioneer studies that includes test scores as proxy for individual abilities on wage regressions. Theytried to assess endogeneity in test averages and schooling, adding a set of instruments, such as parentaleducational background, age of siblings, etc. Most of such studies have employed a single, genericmeasure of skills. Hause (1972) and Willis and Rosen (1979) examined the role of quantitativemeasures on earnings and found that they significantly affect earnings of high school and collegegraduates, but they did not include literacy skill measures. On the other hand, De Baldini Rochaand Ponczek (2011) examined the effects of adult literacy on individuals’ income and employability inBrazil using the PME monthly employment survey. They found that literacy increased wages by 4.4%points and the probability to be employed by 4.3% points. In this case, numeracy was not includedin the analysis.
The study of the combined effects of numerical and verbal skills started only relatively recently. Forinstance, McIntosh and Vignoles (2001) investigated the influence of mathematical and verbal skills onwages for the UK, and found that literacy and numeracy skills are positively associated with earnings.They tackled selection bias by estimating first the impact of skills into employment. Dougherty (2003)investigated the non-linear effects of numeracy and literacy on college attainment and hourly earnings.They found statistically significant non-linear effects of numeracy. However, no evidence of non-lineareffects of literacy were found.
Most of these studies have been carried out using national survey data such as the National Lon-gitudinal Survey of Youth (NLSY) (Dougherty 2003), the Project Talent data (US) (Hause 1972),the NBER-Thorndike-Hagen survey (Willis and Rosen 1979), or the OECD Survey of adult skills(PIAAC) on Australian population (Shomos 2010; Shomos and Forbes 2014). The two latter studiesanalysed the contribution of literacy and numeracy to schooling, employment and earnings using theAustralian PIAAC data. They found a high correlation between numeracy and literacy test scoresfor Australian data and highlight the strong links between numeracy and literacy skills, as well asbetween employment and wages. However, they did not differentiate between returns to each skillin their estimation analysis. Other cross-country data like the Programme for International StudentAssessment (PISA) has been used to measure school students’ achievements. Hanushek et al. (2015)has been the pioneer in using PIAAC data and measuring returns to skills across countries.
Gender differences are particularly important when studying the effects of skills in labour market
4. Although innate abilities are usually associated to those who are “in the genes”, from a psychological perspective,it is important to differentiate them from those which are inherited.
4
outcomes. After investigating extensively the gender differences in numerical performance and verbalability, psychologists have gathered solid evidence that no substantial differences exist in verbal andmathematical abilities between gender (Else-Quest, Hyde and Linn 2010; J. S. Hyde and M. C Linn1988; Lindberg et al. 2010). Economists, have recently studied the relationship between cognitiveskills and gender differences. Niederle and Vesterlund (2010) for example, argue that the reportedtest scores do not necessarily reflect the gender differences in math skills, but instead the gender gapin mathematics performance might be explained partly by the differential manner in which men andwomen respond to competitive test-tasking environments.
Although we know more about the drivers of potential differences or similarities between men andwomen on test scores, little research has looked at the impact of different skills on earnings acrossgender. One of the few exceptions is the study of Lindley (2012), who found that women lost outfrom technological change between 1997 and 2006, despite the large increase in educational attainment.This finding was explained by their low level of numeracy, literacy and other skills required to performtasks that are correlated with technical change such as computerization. Also, Almenberg and Dreber(2015) found that women participate less than men in the stock market and score lower on financialliteracy.5 The aim of this paper is to contribute to the existing literature by studying the impact ofdifferent skills such as numeracy and literacy on labour market outcomes for men and women. Byusing the new PIAAC data, this article also intends to give insights into the independent and jointeffects of numeracy and literacy skills on earnings across different countries and for groups at differentincome quantiles, and with different level of education.
3 Basic framework
Variables such as skills and schooling are central for determining labour market outcomes. However, itis very difficult to disentangle the causal effect of those variables in absence of experimental variation.The framework developed here is intended to guide the correct interpretation of the estimations carriedout in Section 5. Although this framework does not attempt to estimate causal relationships, I addresshere two main econometric concerns.
First, one may worry about reverse causality. While it is plausible to assume that education can bepre-determined at labour market entry, it is harder to make a similar assumption for skills which aremeasured contemporaneously with labour market outcomes. Using measures of skills for workers inthe labour force has many advantages, but it is indeed less likely that cognitive skills measured afterlabour market entry are not affected by job specific experience and training. To address this problem,this model assumes that the contemporaneous measures of experience capture the fact that skills arelearnt over time.
Second, it is natural to think about the potential bias driven by omitted variables. While measuresof numeracy and literacy skills help explaining wages, it is also very likely that other cognitive and
5. Other disciplines have also looked at the relationship between numeracy and literacy skills. For instance, Telfordet al. (2012) found strong evidence for positive relationships between literacy and numeracy scores at the school level,and cardioid-respiratory fitness. Carreiras et al. (2015) found different biochemical pathways for literacy and numeracy.Specifically, they detected brain activation differences for literacy and numeracy from early stages of processing in thetemporal-occipital and temporal-parietal regions.
5
non-cognitve skills, which are unobserved in the PIAAC data, might also matter significantly forearnings. One may wonder how the omission of other wage determinants affects OLS estimates ofnumeracy and literacy. The following framework allows to investigate the sign and magnitude of thispotential bias.
As starting point, let us assume a perfect competitive market where wages are determined by theindividual worker’s productivity. In this context, firm profit maximization of inputs will lead toequate the wage to the marginal product of labour. Equation 1 summarizes individual productivityas follows:
wi = f(li, ni, edui, oi, expi, χi) (1)
where wi refers to log wages for worker i, li and ni refer to general functions of literacy and numeracyskills respectively, edui to years of education, oi to all unobservables (which include individual cognitiveand non-cognitive skills other than numeracy and literacy), expi to experience, and χi to all othercontrol variables.6
To keep the framework very simple, let us assume a linear relationship between wages, skills andexogenous variables. Although the relationship between wages and experience is modelled in theempirical equation as a polynomial of second degree, and the empirical framework also includes theinteraction num ∗ lit, for simplicity equation 2 is presented here in its linear form:
wi = α0 + α1 ni + α2 li + α3 oi + α4 edui + α5 expi + α6 χi + εi (2)
where ni, li, oi, edui, expi and χi refer to the variables detailed before in equation 1, and additionallyα0 refers to the intercept, α1 to α6 to the coefficient estimates of the relevant variables, and εi to theerror term of this wage equation.
Since skills are not determined exogenously, literacy, numeracy and unobservable skills are modelledin a very general and flexible way. The following equations 3, 4, and 5 show that numeracy, literacyand unobservables depend, in fact, of all other variables included in the analysis.
As mentioned before, skills are determined by the level of experience. Also it is very likely that theydepend on the level of education and personal characteristics. Equations 3 to 4 make also explicitthe potential dependency of numeracy and literacy skills on unobservables (oi). Likewise, one canwell think that having good comprehension skills can help to score higher in numerical problems,and vice-versa. For this reason, the model allows for the interdependence of numeracy on literacyskills. Finally, equation 5 shows that both numeracy and literacy skills can affect achieving otherunobservable skill characteristics.
Hence, under the linearity assumption, numeracy, literacy and unobservables can be summarized asfollows:
li = βl0 + βl1 ni + βl2 oi + βl3 edui + βl4 expi + βl5 χi + µli (3)
ni = βn0 + βn1 li + βn2 oi + βn3 edui + βn4 expi + βn5 χi + µni (4)
oi = βo0 + βo1 ni + βo2 li + βo3 edui + βo4 expi + βo5 χi + µoi (5)
6. Unobservable skills which include cognitive and non-cognitive skills different from numeracy and literacy can beinnate or learnt. In the empirical exercise, the set of control variables includes experience (expi) and experience squared(exp2
i ), industry and occupational dummies, civil status, number of children, employment status of the partner, etc.
6
where µi refers to the error term of each respective equation. After substituting equation 5 intoequation 2 and grouping by independent variables, one obtains the following reduced form of thewage equation:
wi = α0 + [α1 + α3βo1 ] ni + [α2 + α3β
o2 ] li + [α4 + α3β
o3 ] edui + [α5 + α3β
o4 ] expi+
[α6 + α3βo5 ] χi + [εi + α3µ
oi ] (6)
where the estimated parameters of ni, li, edui, expi, and χi are summarized by:
ϕ1 = α1 + α3βo1 (7a)
ϕ2 = α2 + α3βo2 (7b)
ϕ3 = α4 + α3βo3 (7c)
ϕ4 = α5 + α3βo4 (7d)
ϕ5 = α6 + α3βo5 (7e)
ζi = εi + α3µoi (7f)
Certainly, without controlling for unobservables, the estimates of equation 6 will reflect the compoundeffects of different factors that determine skill acquisition and schooling investments. For simplicity,here I will focus only on numeracy estimates (ϕ1). Similar reasoning applies to other estimates.Equation 7a shows that:
• When the effect of unobservables on wages is zero (α3 = 0), then the OLS estimate of numeracyis identified by the direct effect of numeracy on wages (ϕ1 = α1).
• However, when unobservables are correlated with wages (α3 6= 0) and also correlated with otherobserved regressors such numeracy (βo1 6= 0), the numeracy OLS estimate (ϕ1) will be biased.The size of the bias will be given by the interaction of the direct and indirect effect of otherunobservable skills (α3β
o1).
In equation 6, the error term will be bigger due to unobservables. As shown in equation 7f, ζicomprises εi from equation 2 and µoi from equation 5. The interpretation of estimated coefficients isnow straightforward. The estimated ϕ1 captures the direct effect of numeracy (α1) and the directand indirect effect of unobservable skills on wages (α3β
o1), where α3 can be interpreted as the impact
of unobservables on wages, and β01 as the impact of unobservables on numeracy skills.
To investigate the direction of the bias, three possible scenarios are described below and summarizedin Table 1.
Case 1: α3 < 0, βo1 > 0 This case refers to the context in which unobservable skills correlate negat-ively with wages (α3 < 0) and positively with numeracy skills (βo1 > 0). This case could be attributedto very creative people who may be very good at performing numerical computations, but at the sametime they are egocentric. This particular behaviour turns to be noxious for achieving higher wages.However, it is hard to think about this type of skills.
Case 2: α3 > 0, βo1 > 0; or α3 < 0, βo1 < 0 In these cases, unobservable skills are either positively ornegatively correlated with numeracy and wages. Both scenarios will bias upward the OLS estimates.
7
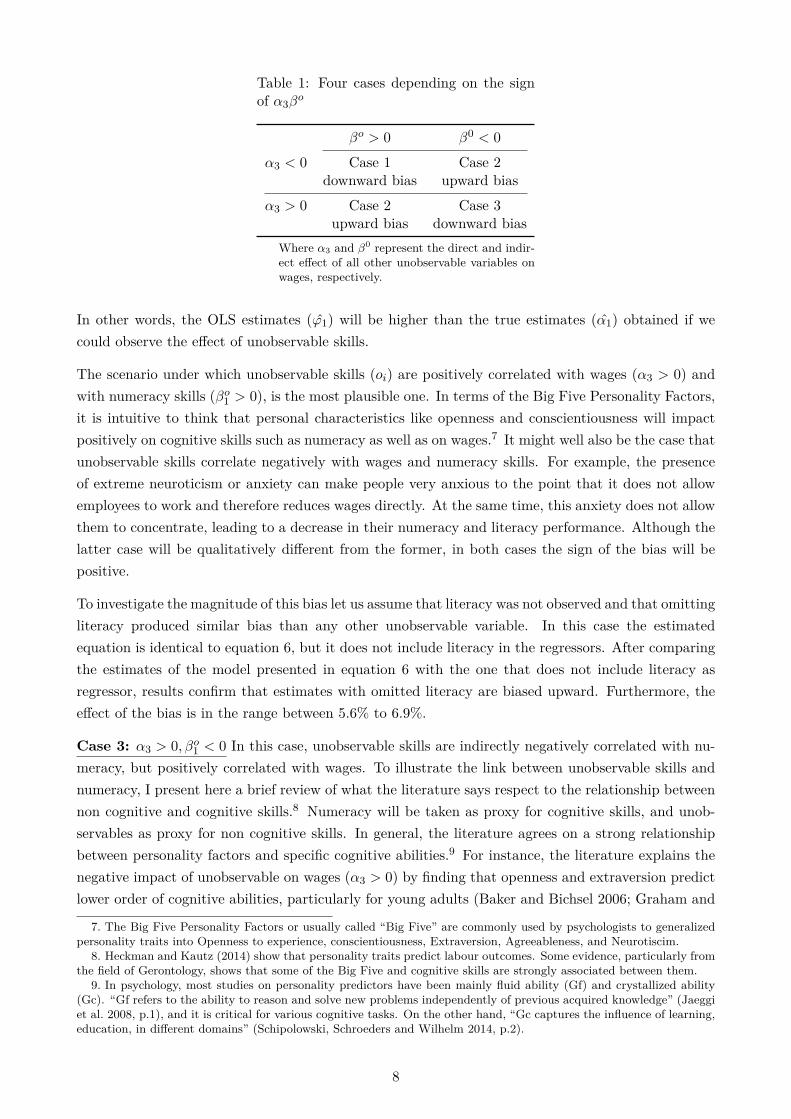
Table 1: Four cases depending on the signof α3β
o
βo > 0 β0 < 0
α3 < 0 Case 1 Case 2downward bias upward bias
α3 > 0 Case 2 Case 3upward bias downward bias
Where α3 and β0 represent the direct and indir-ect effect of all other unobservable variables onwages, respectively.
In other words, the OLS estimates (ϕ1) will be higher than the true estimates (α1) obtained if wecould observe the effect of unobservable skills.
The scenario under which unobservable skills (oi) are positively correlated with wages (α3 > 0) andwith numeracy skills (βo1 > 0), is the most plausible one. In terms of the Big Five Personality Factors,it is intuitive to think that personal characteristics like openness and conscientiousness will impactpositively on cognitive skills such as numeracy as well as on wages.7 It might well also be the case thatunobservable skills correlate negatively with wages and numeracy skills. For example, the presenceof extreme neuroticism or anxiety can make people very anxious to the point that it does not allowemployees to work and therefore reduces wages directly. At the same time, this anxiety does not allowthem to concentrate, leading to a decrease in their numeracy and literacy performance. Although thelatter case will be qualitatively different from the former, in both cases the sign of the bias will bepositive.
To investigate the magnitude of this bias let us assume that literacy was not observed and that omittingliteracy produced similar bias than any other unobservable variable. In this case the estimatedequation is identical to equation 6, but it does not include literacy in the regressors. After comparingthe estimates of the model presented in equation 6 with the one that does not include literacy asregressor, results confirm that estimates with omitted literacy are biased upward. Furthermore, theeffect of the bias is in the range between 5.6% to 6.9%.
Case 3: α3 > 0, βo1 < 0 In this case, unobservable skills are indirectly negatively correlated with nu-meracy, but positively correlated with wages. To illustrate the link between unobservable skills andnumeracy, I present here a brief review of what the literature says respect to the relationship betweennon cognitive and cognitive skills.8 Numeracy will be taken as proxy for cognitive skills, and unob-servables as proxy for non cognitive skills. In general, the literature agrees on a strong relationshipbetween personality factors and specific cognitive abilities.9 For instance, the literature explains thenegative impact of unobservable on wages (α3 > 0) by finding that openness and extraversion predictlower order of cognitive abilities, particularly for young adults (Baker and Bichsel 2006; Graham and
7. The Big Five Personality Factors or usually called “Big Five” are commonly used by psychologists to generalizedpersonality traits into Openness to experience, conscientiousness, Extraversion, Agreeableness, and Neurotiscim.
8. Heckman and Kautz (2014) show that personality traits predict labour outcomes. Some evidence, particularly fromthe field of Gerontology, shows that some of the Big Five and cognitive skills are strongly associated between them.
9. In psychology, most studies on personality predictors have been mainly fluid ability (Gf) and crystallized ability(Gc). “Gf refers to the ability to reason and solve new problems independently of previous acquired knowledge” (Jaeggiet al. 2008, p.1), and it is critical for various cognitive tasks. On the other hand, “Gc captures the influence of learning,education, in different domains” (Schipolowski, Schroeders and Wilhelm 2014, p.2).
8
Lachman 2012). In the same way, one might well think that βo1 < 0 is plausible when other factors suchas conscientiousness (“the tendency to be organized, responsible, and hard-working” (Heckman andKautz 2014, p.4)), agreeableness (“the tendency to act in a cooperative, unselfish manner”(Heckmanand Kautz 2014, p.4)) can positively matter for wages. Then, if the overall causal relationship betweentraits and cognitive skills is positive, the OLS estimates will be biased downward. As a result, we willobtain lower bound estimates of the real effect of skills on wages.
4 Data
This study uses the Survey of Adult Skills which is part of the Programme for the International As-sessment of Adult Competencies (PIAAC) conducted by the Organization for Economic Co-operationand Development (OECD). PIAAC is an international survey that assembles standard backgroundinformation as well as comparable skill measures of cognitive and workplace skills.In this survey, 166 000 adults aged between 16 and 65 years were interviewed, who represent the entirepopulation of adults living in households in 24 countries.
The first round of PIAAC was collected between August 2011 to March 2012 in most participatingcountries, and it includes Australia, Austria, Belgium (Flanders), Canada, Czech Republic, Denmark,Estonia, Finland, France, Germany, Ireland, Italy, Japan, Korea, Netherlands, Norway, Poland, Rus-sian Federation (Moscow), Slovak Republic, Spain, Sweden, United Kingdom (England and NorthernIreland), United States. PIAAC has been designed to be valid cross-culturally and cross-nationally.Participating countries were requested to adapt the questionnaires to nation-specific circumstancesin domains such as educational attainment and participation, labour-force participation and employ-ment. The analysis presented here includes all the countries for which public information was freelyavailable.10
The background questionnaire collected information in five different areas: basic demographic andbackground characteristics, educational attainment and participation, labour-force status and em-ployment, and social outcomes. The final section focused on literacy and numeracy practices as wellas the use of skills.
The main skills assessed by PIAAC are numeracy, literacy and technology-related problem solvingmeasures. Skills are defined as follows: Literacy is defined as “the ability to understand, evaluate, useand engage with written texts in different contexts in order to participate in society, achieve goals,develop knowledge and fulfill personal aspirations” (OECD 2012, p.20). Numeracy consists in “theability to access, use, interpret and communicate mathematical information and ideas in an periodwhere managing mathematical content and processing quantitative information and ideas is crucialfor daily life” (OECD 2012, p.34).
Proficiency scores for each skill range from 0 to 500 points. Levels are ranked from low to highproficiency, respectively (OECD 2013b). PIAAC data includes 10 different plausible values (PVs)of literacy, numeracy and problem solving in technology-rich environment. PVs are estimated pro-ficiency scores of each individual. More precisely, each PV replicates a probable score distribution
10. The study excludes the Russian Federation, since information on Moscow is not representative for all the country.This restriction has been also made by Hanushek et al. (2015).
9
that summarizes how well each respondent answered a small subset of the assessment items; and, howwell other respondents from a similar background performed on the rest of the assessment item pool(PIAAC 2015).11 PVs are strongly correlated across skills for each individual, which confirms thestability of proficiency scores. Results of this paper employ only one PV for each skill. Basic modelresults are tested by comparing the analysis using other PVs.
4.1 Descriptive statistics of the data
In this research, I am interested in studying the effect of skills on earnings, conditional and uncondi-tional on level of education. One objective of the analysis is to determine the mean impact of cognitiveskills on earnings and to compare the magnitude of this effect with schooling returns. In other words,to determine how much a change in skill scores and level of education will impact on mean wages ofmen and women. However, the effect of skills might vary substantially across groups with differentlevels of education. For this reason, the study will also investigate the effect of skills for differentgroups conditional on their educational level.
Furthermore, the impact to literacy and numeracy skills may vary for graduates from different fieldsof study. Dougherty (2003) pointed out that numeracy has higher impact on earnings mostly throughits effects on college attainment, but also directly. Indeed, the decision to go to college or to studya particular graduate program is not random and it can well be the case that the decision to investmore in education is influenced by higher earnings. Within educational programs such as Science,Technology, Engineering and Math (STEM) and Non-STEM, graduates have similar skill scores.12
Therefore, the analysis of skill scores and their impact for labour market outcomes is carried outfirst using the total sample (including education as an additional regressor), and separately for otherpopulation groups. The main groups of analysis are as follows:
• TOTAL: all adults between 16 and 65 years working full-time (at least 30h per week). Cross-checks used also workers with at least 15h of work per week.13
• GRADUATES: adults with tertiary-professional degree or more (minimum level of educationISCED4A-B-C).14
• Non-GRADUATES: all adults without higher education i.e. tertiary-professional degree ormore (maximum level of education ISCED 3A-B, C long).
• STEM: graduates completed educational programs such as science, mathematics, computing,engineering, and educational research.
11. They are computed at the population level, but cannot be used to estimate an individual’s proficiency because theuncertainty in the latent proficiency measure.
12. List of STEM disciplines varies by organization. I took as reference of STEM-eligible degrees, the one provided bythe US immigration office.
13. Hirsch (2005) showed that part-time workers receive considerably lower hourly earnings than do full-time workersmainly due to the role of worker-specific and occupational skill requirements. Since lack of this type of specific skillscharacteristics in the data and to avoid endogeneity issues risen from different preferences to work part-time or full-time,part-time workers with less than 15h per week have been excluded from the analysis.
14. ISCED refers to the International Standard Classification of Education divided in 7 categories: 1 - primary or less(ISCED 1 or less, 2 - lower secondary (ISCED 2, ISCED 3C short), 3 - upper secondary (ISCED 3A-B, C long), 4 - post-secondary, non-tertiary (ISCED 4A-B-C), 5 - tertiary âĂŞ professional degree (ISCED 5B), 6, - tertiary âĂŞ bachelordegree (ISCED 5A), 7 - tertiary âĂŞ master/research degree (ISCED 5A/6), 8 - tertiary - bachelor/master/researchdegree (ISCED 5A/6), .N - not stated or inferred.
10
• Non-STEM: graduates enrolled in other educational programs such as: general programs,teacher training, humanities, language and arts, social sciences, business and law, agricultureand veterinary, health and welfare, and services.
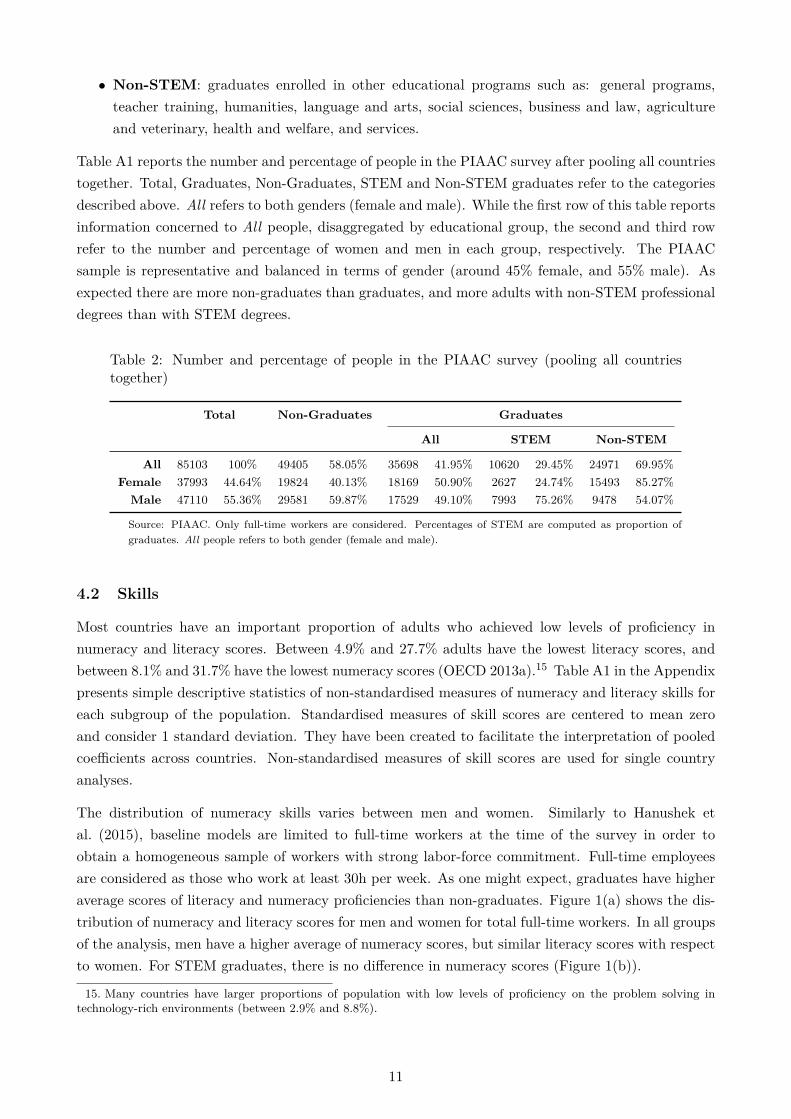
Table A1 reports the number and percentage of people in the PIAAC survey after pooling all countriestogether. Total, Graduates, Non-Graduates, STEM and Non-STEM graduates refer to the categoriesdescribed above. All refers to both genders (female and male). While the first row of this table reportsinformation concerned to All people, disaggregated by educational group, the second and third rowrefer to the number and percentage of women and men in each group, respectively. The PIAACsample is representative and balanced in terms of gender (around 45% female, and 55% male). Asexpected there are more non-graduates than graduates, and more adults with non-STEM professionaldegrees than with STEM degrees.
Table 2: Number and percentage of people in the PIAAC survey (pooling all countriestogether)
Total Non-Graduates Graduates
All STEM Non-STEM
All 85103 100% 49405 58.05% 35698 41.95% 10620 29.45% 24971 69.95%Female 37993 44.64% 19824 40.13% 18169 50.90% 2627 24.74% 15493 85.27%
Male 47110 55.36% 29581 59.87% 17529 49.10% 7993 75.26% 9478 54.07%
Source: PIAAC. Only full-time workers are considered. Percentages of STEM are computed as proportion ofgraduates. All people refers to both gender (female and male).
4.2 Skills
Most countries have an important proportion of adults who achieved low levels of proficiency innumeracy and literacy scores. Between 4.9% and 27.7% adults have the lowest literacy scores, andbetween 8.1% and 31.7% have the lowest numeracy scores (OECD 2013a).15 Table A1 in the Appendixpresents simple descriptive statistics of non-standardised measures of numeracy and literacy skills foreach subgroup of the population. Standardised measures of skill scores are centered to mean zeroand consider 1 standard deviation. They have been created to facilitate the interpretation of pooledcoefficients across countries. Non-standardised measures of skill scores are used for single countryanalyses.
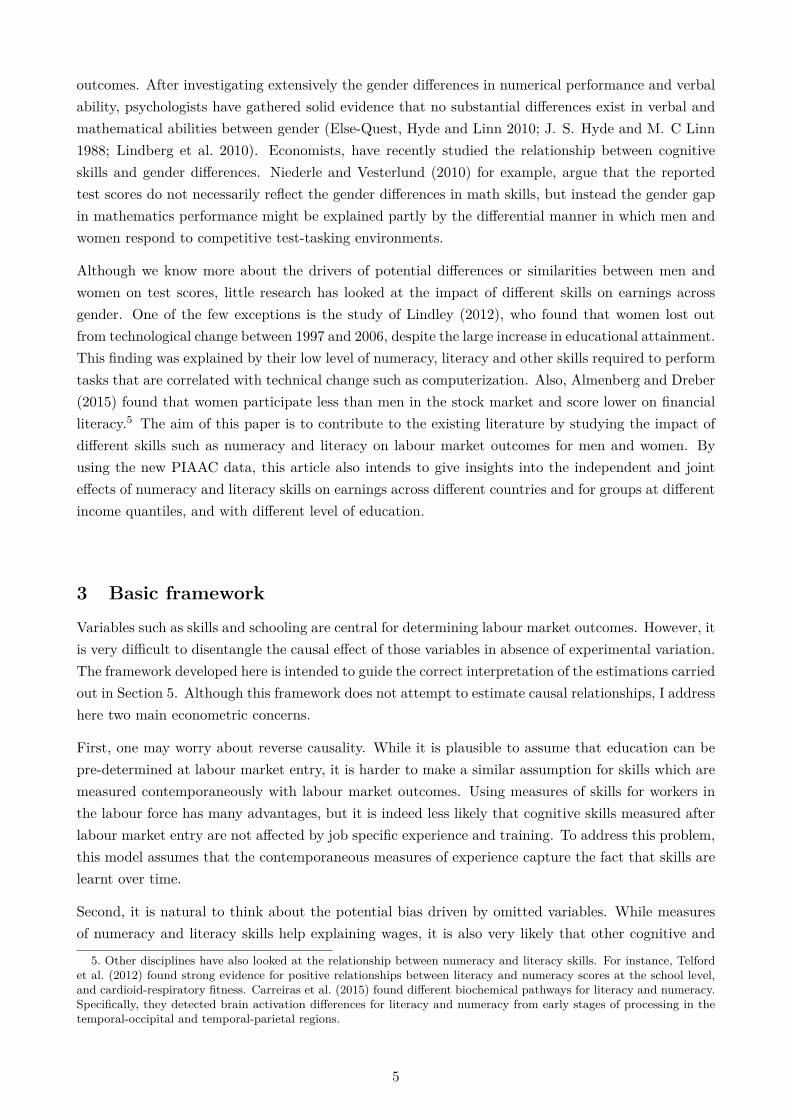
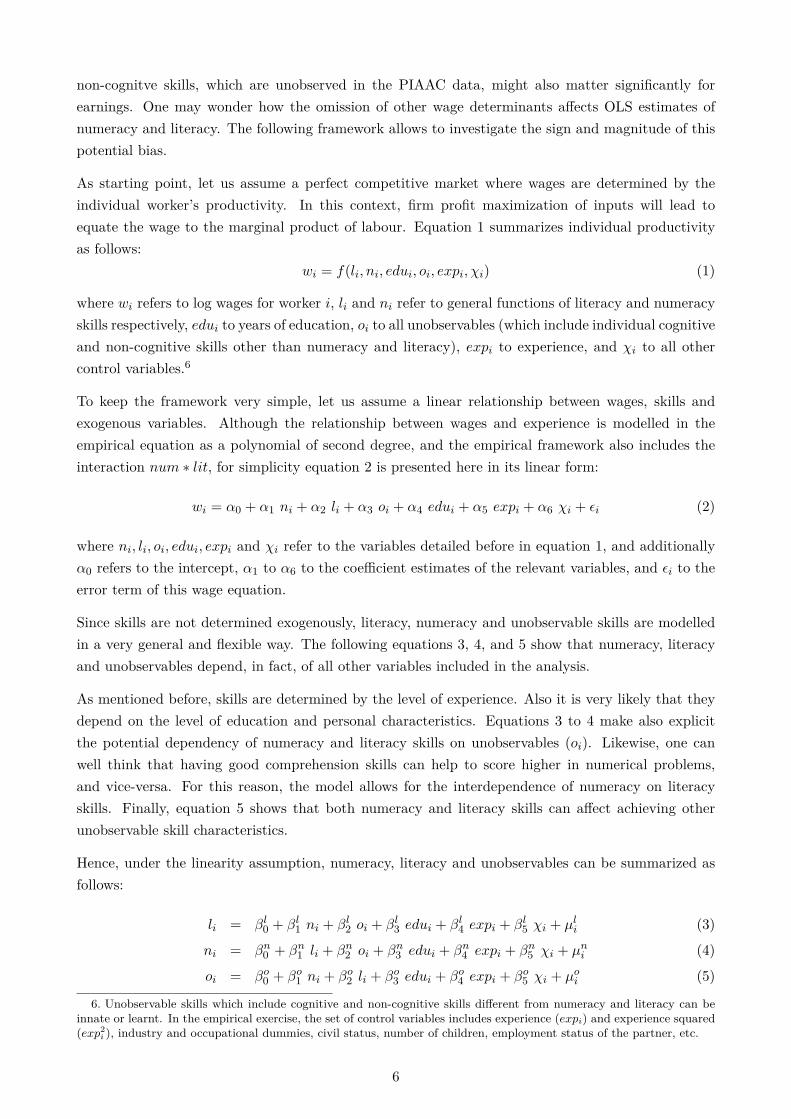
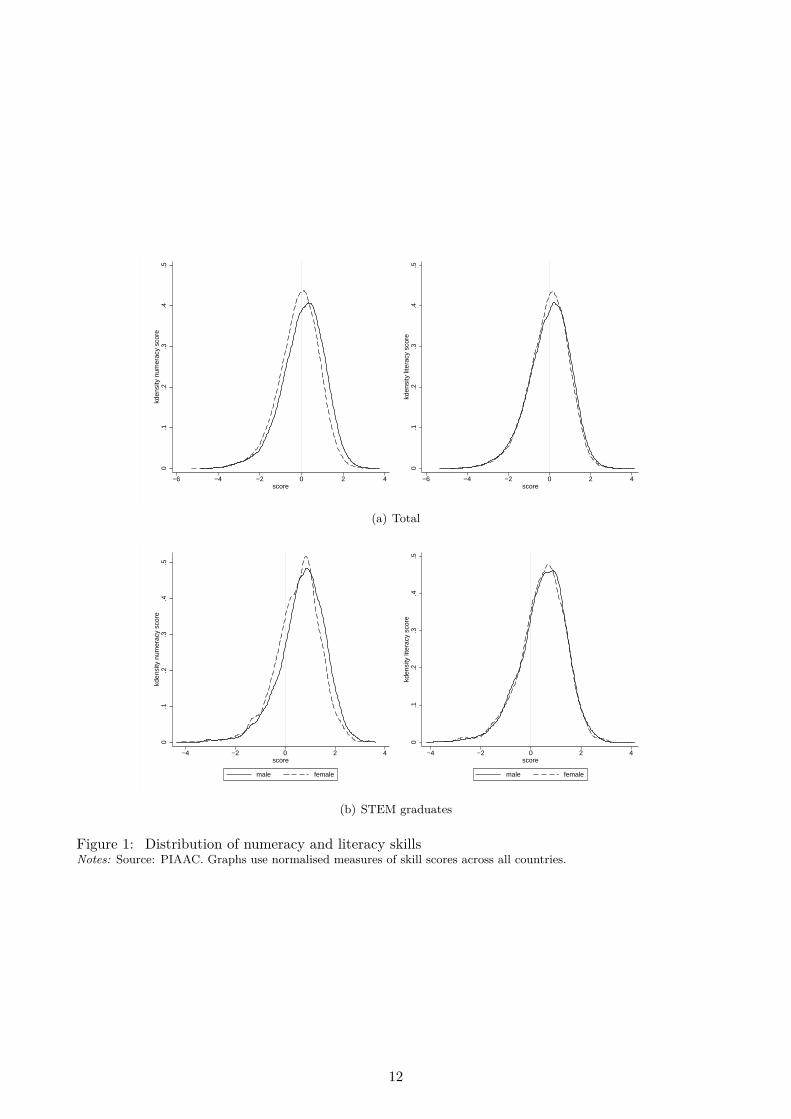
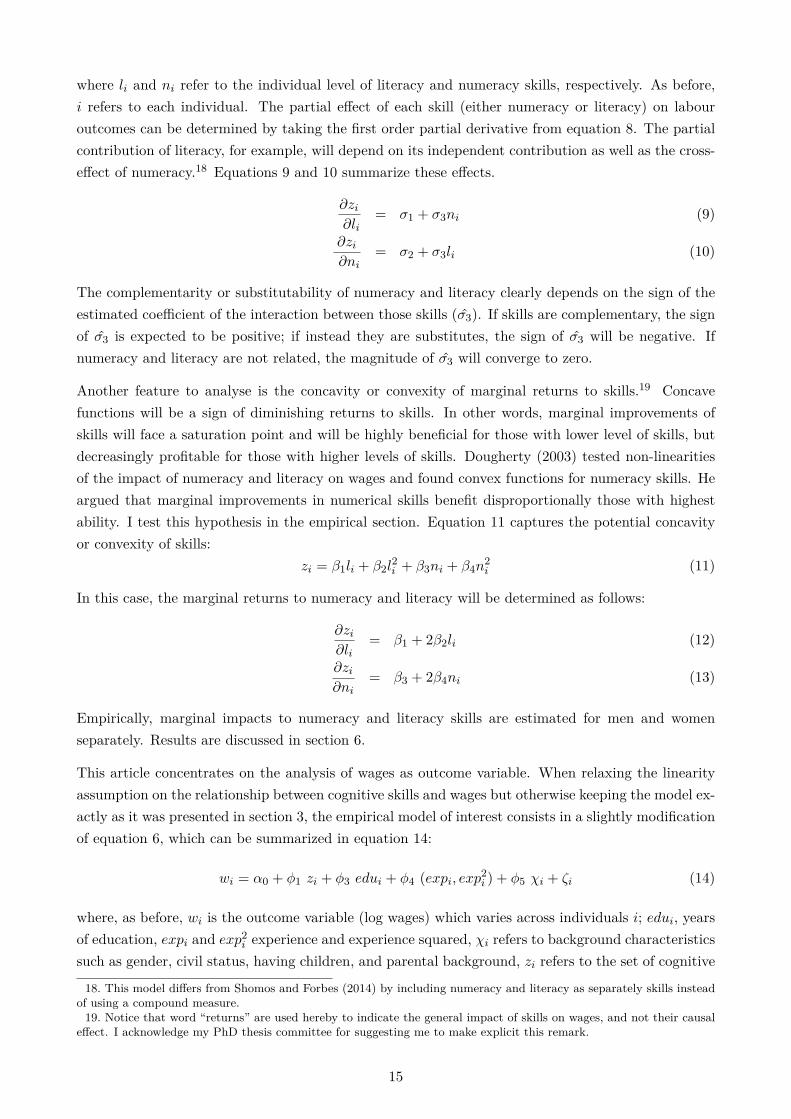
The distribution of numeracy skills varies between men and women. Similarly to Hanushek etal. (2015), baseline models are limited to full-time workers at the time of the survey in order toobtain a homogeneous sample of workers with strong labor-force commitment. Full-time employeesare considered as those who work at least 30h per week. As one might expect, graduates have higheraverage scores of literacy and numeracy proficiencies than non-graduates. Figure 1(a) shows the dis-tribution of numeracy and literacy scores for men and women for total full-time workers. In all groupsof the analysis, men have a higher average of numeracy scores, but similar literacy scores with respectto women. For STEM graduates, there is no difference in numeracy scores (Figure 1(b)).
15. Many countries have larger proportions of population with low levels of proficiency on the problem solving intechnology-rich environments (between 2.9% and 8.8%).
11
0.1
.2.3
.4.5
kden
sity
num
erac
y sc
ore
−6 −4 −2 0 2 4score
0.1
.2.3
.4.5
kden
sity
lite
racy
sco
re
−6 −4 −2 0 2 4score
(a) Total
0.1
.2.3
.4.5
kden
sity
num
erac
y sc
ore
−4 −2 0 2 4score
male female
0.1
.2.3
.4.5
kden
sity
lite
racy
sco
re
−4 −2 0 2 4score
male female
(b) STEM graduates
Figure 1: Distribution of numeracy and literacy skillsNotes: Source: PIAAC. Graphs use normalised measures of skill scores across all countries.
12
In order to understand better the relationship between numeracy and literacy skills, I analyse thecorrelation between these skills in the following section.
4.2.1 Correlations
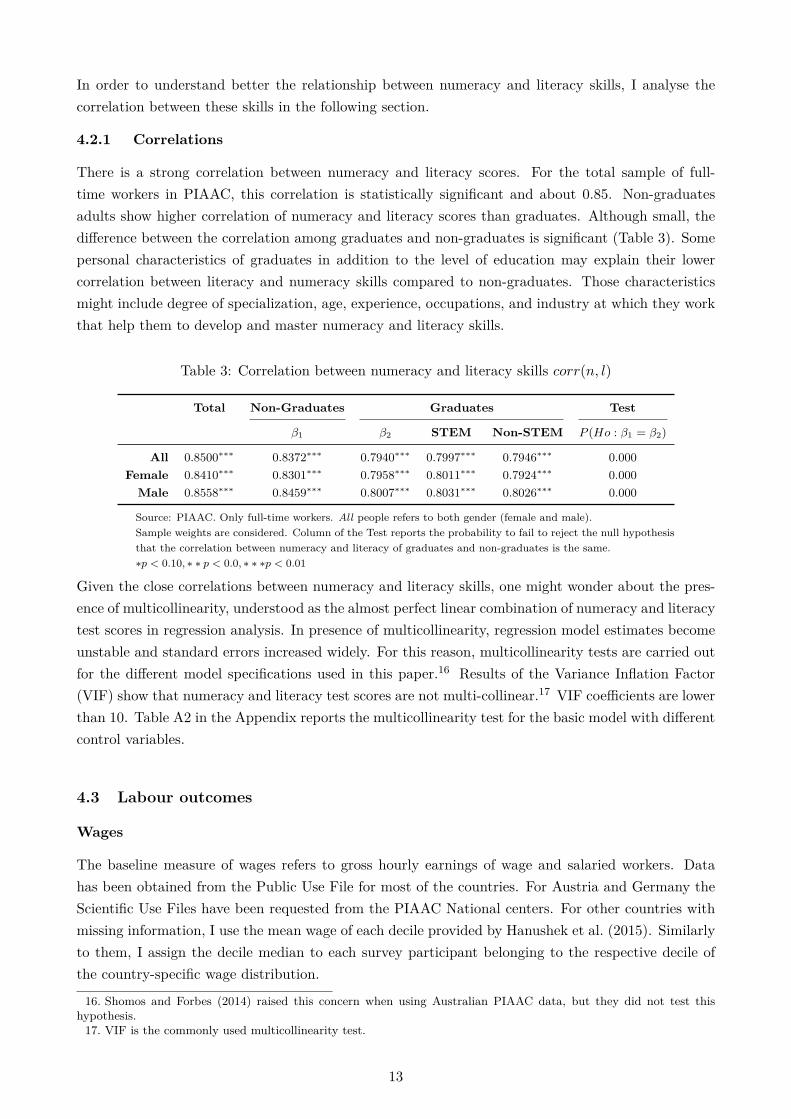
There is a strong correlation between numeracy and literacy scores. For the total sample of full-time workers in PIAAC, this correlation is statistically significant and about 0.85. Non-graduatesadults show higher correlation of numeracy and literacy scores than graduates. Although small, thedifference between the correlation among graduates and non-graduates is significant (Table 3). Somepersonal characteristics of graduates in addition to the level of education may explain their lowercorrelation between literacy and numeracy skills compared to non-graduates. Those characteristicsmight include degree of specialization, age, experience, occupations, and industry at which they workthat help them to develop and master numeracy and literacy skills.
Table 3: Correlation between numeracy and literacy skills corr(n, l)
Total Non-Graduates Graduates Test
β1 β2 STEM Non-STEM P (Ho : β1 = β2)
All 0.8500∗∗∗ 0.8372∗∗∗ 0.7940∗∗∗ 0.7997∗∗∗ 0.7946∗∗∗ 0.000Female 0.8410∗∗∗ 0.8301∗∗∗ 0.7958∗∗∗ 0.8011∗∗∗ 0.7924∗∗∗ 0.000
Male 0.8558∗∗∗ 0.8459∗∗∗ 0.8007∗∗∗ 0.8031∗∗∗ 0.8026∗∗∗ 0.000
Source: PIAAC. Only full-time workers. All people refers to both gender (female and male).Sample weights are considered. Column of the Test reports the probability to fail to reject the null hypothesisthat the correlation between numeracy and literacy of graduates and non-graduates is the same.∗p < 0.10, ∗ ∗ p < 0.0, ∗ ∗ ∗p < 0.01
Given the close correlations between numeracy and literacy skills, one might wonder about the pres-ence of multicollinearity, understood as the almost perfect linear combination of numeracy and literacytest scores in regression analysis. In presence of multicollinearity, regression model estimates becomeunstable and standard errors increased widely. For this reason, multicollinearity tests are carried outfor the different model specifications used in this paper.16 Results of the Variance Inflation Factor(VIF) show that numeracy and literacy test scores are not multi-collinear.17 VIF coefficients are lowerthan 10. Table A2 in the Appendix reports the multicollinearity test for the basic model with differentcontrol variables.
4.3 Labour outcomes
Wages
The baseline measure of wages refers to gross hourly earnings of wage and salaried workers. Datahas been obtained from the Public Use File for most of the countries. For Austria and Germany theScientific Use Files have been requested from the PIAAC National centers. For other countries withmissing information, I use the mean wage of each decile provided by Hanushek et al. (2015). Similarlyto them, I assign the decile median to each survey participant belonging to the respective decile ofthe country-specific wage distribution.
16. Shomos and Forbes (2014) raised this concern when using Australian PIAAC data, but they did not test thishypothesis.
17. VIF is the commonly used multicollinearity test.
13
Wages are measured as individual hourly wages as described in the Appendix. Descriptive statisticsof mean Purchasing Power Parity (PPP) wages across countries corrected by US dollars are presentedin Table A1.
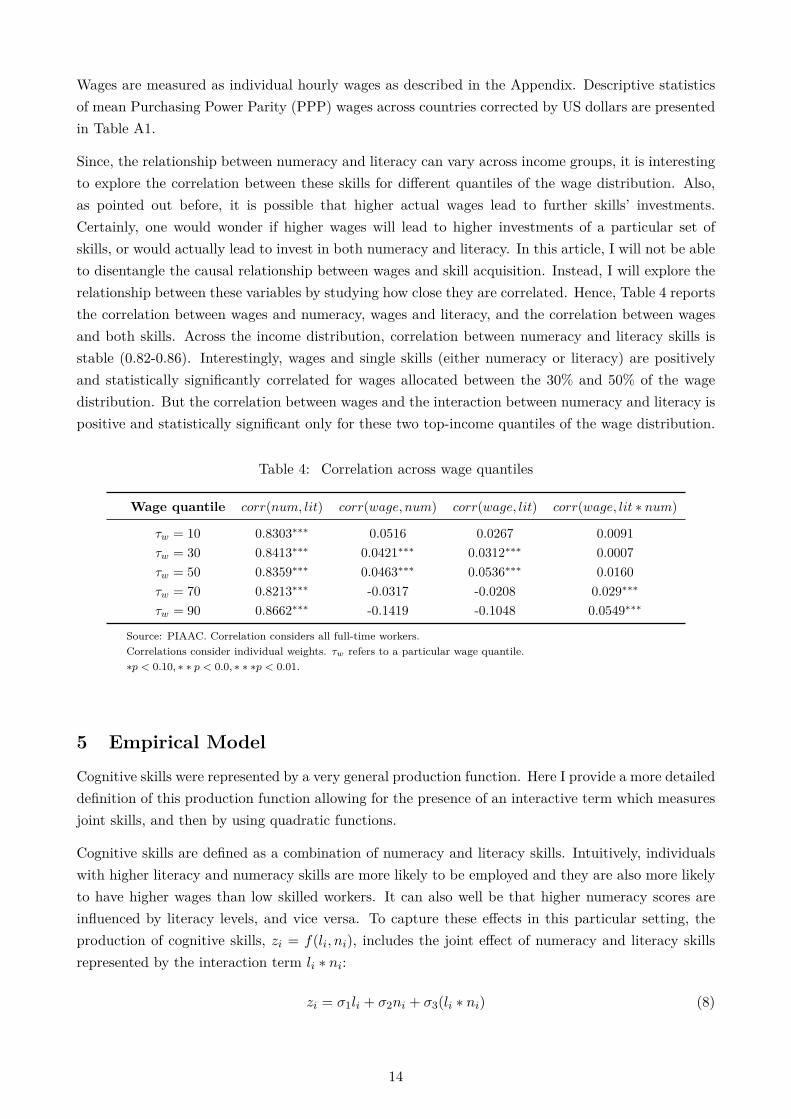
Since, the relationship between numeracy and literacy can vary across income groups, it is interestingto explore the correlation between these skills for different quantiles of the wage distribution. Also,as pointed out before, it is possible that higher actual wages lead to further skills’ investments.Certainly, one would wonder if higher wages will lead to higher investments of a particular set ofskills, or would actually lead to invest in both numeracy and literacy. In this article, I will not be ableto disentangle the causal relationship between wages and skill acquisition. Instead, I will explore therelationship between these variables by studying how close they are correlated. Hence, Table 4 reportsthe correlation between wages and numeracy, wages and literacy, and the correlation between wagesand both skills. Across the income distribution, correlation between numeracy and literacy skills isstable (0.82-0.86). Interestingly, wages and single skills (either numeracy or literacy) are positivelyand statistically significantly correlated for wages allocated between the 30% and 50% of the wagedistribution. But the correlation between wages and the interaction between numeracy and literacy ispositive and statistically significant only for these two top-income quantiles of the wage distribution.
Table 4: Correlation across wage quantiles
Wage quantile corr(num, lit) corr(wage, num) corr(wage, lit) corr(wage, lit ∗ num)
τw = 10 0.8303∗∗∗ 0.0516 0.0267 0.0091τw = 30 0.8413∗∗∗ 0.0421∗∗∗ 0.0312∗∗∗ 0.0007τw = 50 0.8359∗∗∗ 0.0463∗∗∗ 0.0536∗∗∗ 0.0160τw = 70 0.8213∗∗∗ -0.0317 -0.0208 0.029∗∗∗
τw = 90 0.8662∗∗∗ -0.1419 -0.1048 0.0549∗∗∗
Source: PIAAC. Correlation considers all full-time workers.Correlations consider individual weights. τw refers to a particular wage quantile.∗p < 0.10, ∗ ∗ p < 0.0, ∗ ∗ ∗p < 0.01.
5 Empirical Model
Cognitive skills were represented by a very general production function. Here I provide a more detaileddefinition of this production function allowing for the presence of an interactive term which measuresjoint skills, and then by using quadratic functions.
Cognitive skills are defined as a combination of numeracy and literacy skills. Intuitively, individualswith higher literacy and numeracy skills are more likely to be employed and they are also more likelyto have higher wages than low skilled workers. It can also well be that higher numeracy scores areinfluenced by literacy levels, and vice versa. To capture these effects in this particular setting, theproduction of cognitive skills, zi = f(li, ni), includes the joint effect of numeracy and literacy skillsrepresented by the interaction term li ∗ ni:
zi = σ1li + σ2ni + σ3(li ∗ ni) (8)
14
where li and ni refer to the individual level of literacy and numeracy skills, respectively. As before,i refers to each individual. The partial effect of each skill (either numeracy or literacy) on labouroutcomes can be determined by taking the first order partial derivative from equation 8. The partialcontribution of literacy, for example, will depend on its independent contribution as well as the cross-effect of numeracy.18 Equations 9 and 10 summarize these effects.
∂zi∂li
= σ1 + σ3ni (9)
∂zi∂ni
= σ2 + σ3li (10)
The complementarity or substitutability of numeracy and literacy clearly depends on the sign of theestimated coefficient of the interaction between those skills (σ3). If skills are complementary, the signof σ3 is expected to be positive; if instead they are substitutes, the sign of σ3 will be negative. Ifnumeracy and literacy are not related, the magnitude of σ3 will converge to zero.
Another feature to analyse is the concavity or convexity of marginal returns to skills.19 Concavefunctions will be a sign of diminishing returns to skills. In other words, marginal improvements ofskills will face a saturation point and will be highly beneficial for those with lower level of skills, butdecreasingly profitable for those with higher levels of skills. Dougherty (2003) tested non-linearitiesof the impact of numeracy and literacy on wages and found convex functions for numeracy skills. Heargued that marginal improvements in numerical skills benefit disproportionally those with highestability. I test this hypothesis in the empirical section. Equation 11 captures the potential concavityor convexity of skills:
zi = β1li + β2l2i + β3ni + β4n
2i (11)
In this case, the marginal returns to numeracy and literacy will be determined as follows:
∂zi∂li
= β1 + 2β2li (12)
∂zi∂ni
= β3 + 2β4ni (13)
Empirically, marginal impacts to numeracy and literacy skills are estimated for men and womenseparately. Results are discussed in section 6.
This article concentrates on the analysis of wages as outcome variable. When relaxing the linearityassumption on the relationship between cognitive skills and wages but otherwise keeping the model ex-actly as it was presented in section 3, the empirical model of interest consists in a slightly modificationof equation 6, which can be summarized in equation 14:
wi = α0 + φ1 zi + φ3 edui + φ4 (expi, exp2i ) + φ5 χi + ζi (14)
where, as before, wi is the outcome variable (log wages) which varies across individuals i; edui, yearsof education, expi and exp2
i experience and experience squared, χi refers to background characteristicssuch as gender, civil status, having children, and parental background, zi refers to the set of cognitive
18. This model differs from Shomos and Forbes (2014) by including numeracy and literacy as separately skills insteadof using a compound measure.
19. Notice that word “returns” are used hereby to indicate the general impact of skills on wages, and not their causaleffect. I acknowledge my PhD thesis committee for suggesting me to make explicit this remark.
15
skills (numeracy and literacy) and it is determined by equation 8 or equation 11, and ζi refers to theresidual term.20 The empirical specification also includes country, occupations (ISCO 2 codes), andindustry (ISIC 1 codes) dummies. Similarly, as demonstrated in section 3, the estimated parameters φimeasure the compound effect of unobserved skills and each individual variable (education, experience,and others) on wages.
To determine the average effects for all countries, regressions are estimated by pooling the data andperforming the analysis on this sample. Country-specific estimates are obtained by computing similarregressions for each country separately. Analyses are performed separately for the groups defined insection 4.1.
Since estimated coefficients can vary in presence of other explanatory variables and when using diversespecifications, different wage models are employed to verify the results. First, the basic linear modelthat uses level of education and experience as main control variables (Tables 5, 10 and A12). In asecond specification, I extend the basic model by including a set of control variables such as employ-ment status of the partner, parental background, and having a small child (2 years old or younger)(Tables 8 and 9). Third, I look at the returns to skills across different standard cohorts (16-34, 35-54,and 55-65 years old). Table A3 reports estimates for adults in prime age. Fourth, I estimate the effectof skills for each income quantile (Table 7). They will estimate the conditional mean of numericaland literacy skills at each specific quantile of the wage distribution. Fifth, I run separate regressionsfor each country (Tables A6, A7, A8, A10, and A11). Sixth, I test the concavity or convexity of skillreturns. Estimates of non-linear specifications are shown in Table 6.
6 Empirical results and Discussion
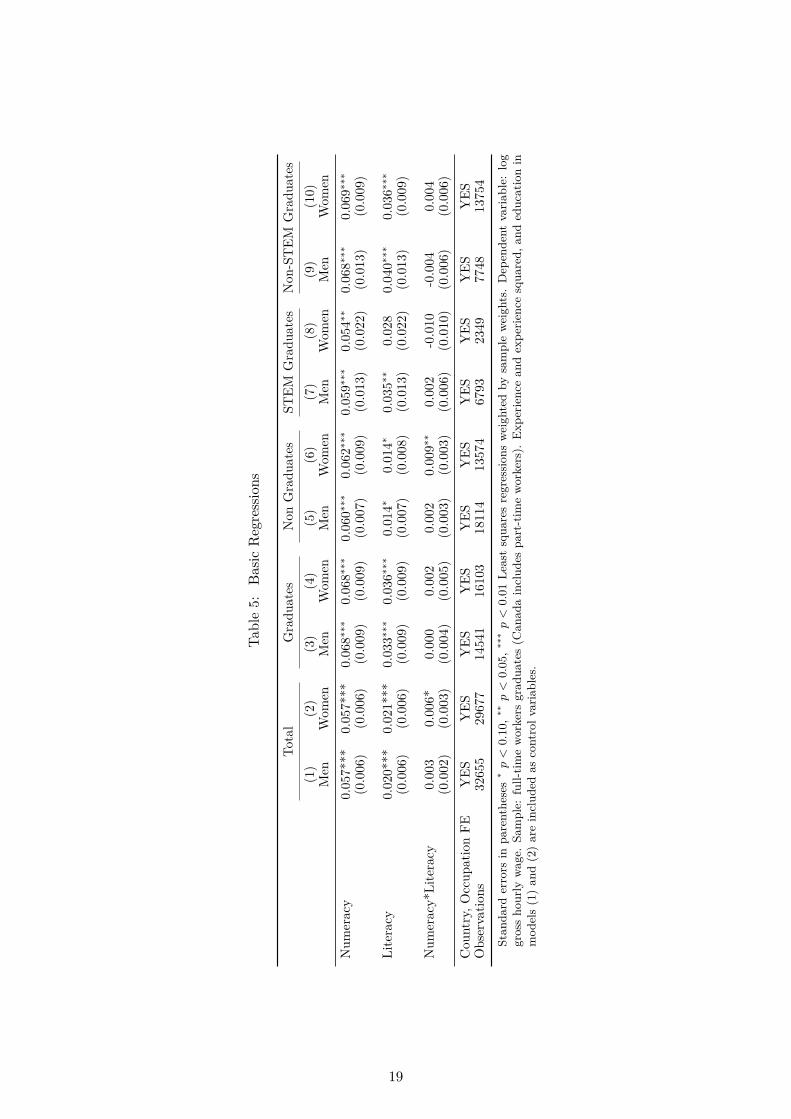
Table 5 reports a summary of the OLS estimation results of the main variables (numeracy, literacy)of the basic model, where the dependent variable refers to ln(wages), and the set of controls areexperience, experience squared, and in case of columns 1 and 2, also education. Additional controlsinclude country and occupational dummies. Estimates are computed separately for men and women.Odd columns show the results for men, while even columns show the results for women. Each pairof columns report the results for each population group: Total, Graduates, Non Graduates, STEMgraduates, and Non-STEM graduates. Skill measures reported in these Tables are standardised scoreswith mean of zero and standard deviation of one across countries; therefore point estimates shouldbe interpreted as the effect of a change in one standard deviation in skill scores on the average wageacross countries.
As demonstrated in section 3, the estimated parameters presented here measure the compound effectof unobserved skills and each individual regressor. Across most specifications and different populationgroups, results from Table 5 show positive and statistically significant economic returns to numeracyand literacy skills. Moreover, estimates for the economic returns to numeracy skills are larger thanthose from literacy by factor of two or three. Across all population groups, the effect of numeracyon wages ranges from 5.4% to 6.8%, while the estimates of literacy fall between 1.4% to 4%. These
20. In the PIAAC survey civil status is captured by the dichotomous variable of living with the partner or spouse. Forrobustness, similar analysis has been carried out, including age and age squared as proxy of experiences, which confirmedthese results.
16
results indicate that numeracy has a stronger role than literacy skills on wages. Additionally, thistable shows that returns to numeracy skills are larger for graduates (6.8%) than for non-graduates (6%approx.). Also, for STEM graduates, numeracy seems to pay out less (5.7% approx.) than for Non-STEM graduates (6.8% approx.). This can be explained by reduced marginal returns to numeracyskills after having followed a STEM program. Contrarily, for Non-STEM graduates, their dexterityin numerical skills could explain the wage difference among graduates of similar fields. Magnitudesof estimates of numeracy and literacy skills are very similar between men and women within eachpopulation group.
These results contrast with the ones found previously in the literature (McIntosh and Vignoles 2001;Dougherty 2003) which suggested that an additional standard deviation in literacy skills was associatedwith larger earnings than in numeracy skills. These dissimilar results can be explained due to the timeframe of the data used in those papers. McIntosh and Vignoles (2001) used data from the 1970 cohortinterviewed in 2004, and the analysis of Dougherty (2003) used data of the NLSY respondents from1988, 1992 and 1996 rounds. Finding larger returns to numeracy skills over literacy skills using PIAAC2013 can reflect the strong impact of technology and computerization which change task requirementsfor jobs (Lindley 2012), rise demand for workers who perform abstract tasks and master numericalskills, and reward more their productivity. My results are in-line with Paglin and Rufolo (1990) andMurnane, Willett and Levy (1995) and other studies that use more recent data sets (Antoni andHeineck 2012; Hanushek et al. 2015).As expected, returns to skills (numeracy and literacy) are larger for graduates than for non-graduates,since the former have larger levels of education and are likely to be employed in occupations thatrequire larger numerical and literacy skills.
Although the impact of informational and technological skills (ICT) has become increasingly import-ant with the technological change, in this article, I disregarded the analysis of ICT and focus only onthe contribution of numeracy and literacy skills. The main reasons for excluding ICT skills from theanalysis are the following: first, the traditional debate and the priority policies in terms of cognitiveskills have been concentrated mainly on the contributions of numeracy and literacy. These are indeedcompetences needed for lifelong learnings. Second, the evidence on the role of numeracy and literacyskills is still far from conclusive. Finally, by excluding ICT measures, we are able to compare ourestimates with single country studies which have focused only on numeracy and literacy skills.
Another important result from Table 5, also stable across different specifications, is the positivecoefficient of the interaction between numeracy and literacy skills. However, when disaggregating inpopulation subgroups, this estimate is only significant for female non-graduates (column 6). Thisresult can be interpreted as the absence of a complementary effect of numeracy and literacy skills onwages, except for female non-graduates. The skill complementarity means that high proficiency levelsof numeracy skills leads also to the achievement of higher levels of literacy skills and vice-verse.
This result can be explained with help of the theory of comparative advantage and specialization oflabour skills. The international trade theory predicts that individuals (or countries) gain more whenthey specialize in producing goods at which they have comparative advantages. Similar reasoningapplies here to understand the different effects for graduates and non-graduates. Graduates usuallyhave higher levels of numeracy and literacy skills than non-graduates; then, results show that it is moreprofitable for graduates to specialize in the use of either numeracy or literacy than for non-graduates.
17
Gender differences in magnitude and statistical significance of numeracyliteracy among non-graduatescan be interpreted in light of the literature that analyses the differences in the complementarity oftasks and technical change across gender. For instance, Lindley (2012) shows that a large range oftasks complementary to technical change are undertaken by men but not by women. She also founda large male bias in numeracy test scores independent of the level of education. This suggests thatspecialization can be more fruitful in terms of wages for men than for women.
The learning process and skill accumulation vary with age. On average, young children learn easilyand older persons learn less fast but achieve high levels of skills. In the labour market, experienceand tenure will also affect skill scores. For these reasons, one can expect that economic returns toskills vary by age (Cunha, Heckman and Lochner 2006). When further splitting the sample by agecohorts, similar results to the ones obtained before are found for prime age workers (35-54 years). Seetable A3 for details. However, similar evidence for other age cohorts was not statistically significant:entry-age (25-34 years) and exit-age (55-65 years). As pointed out by Hanushek et al. (2015), thismight be because returns to skills increase steadily with age until age 35 and they get only slightlysmaller beyond 55 years.
Different approaches that include instrumental variables and differences-in-differences (Diff-in-Diff) arenow commonly used to identify the causal relationship of skills on wages. Hanushek and Woessman(2012b), for example, carried out three different ways to interpret the strong relationship betweencognitive skills and growth.21 First, they use institutional school policies (such as the impact ofvarying Catholic church history) as instrument for identifying skill variation (see also Hanushek andWoessman (2012a)). Second, following Hanushek and kimko (2000), Hanushek and Woessman (2012b)implement a Diff-in-Diff approach to identify the reverse causality as well as the potential relationshipbetween cultural differences or economic institutions of national economies that could be correlatedwith favourable educational outcomes (Hanushek and Woessman 2012b, p. 6). Specifically, thisapproach compares the returns to skills of immigrants schooled in their country of origin to thoseof immigrants from the same country schooled within the United States. And finally, they exploita longitudinal data of test scores to analyse changes in growth rates by eliminating stable country-specific factors.
Given the cross-sectional dimension of the PIAAC data, and that this study does not use any additionaldataset, it has not been possible to asses causality in this framework.
6.1 Non-linear returns to skills
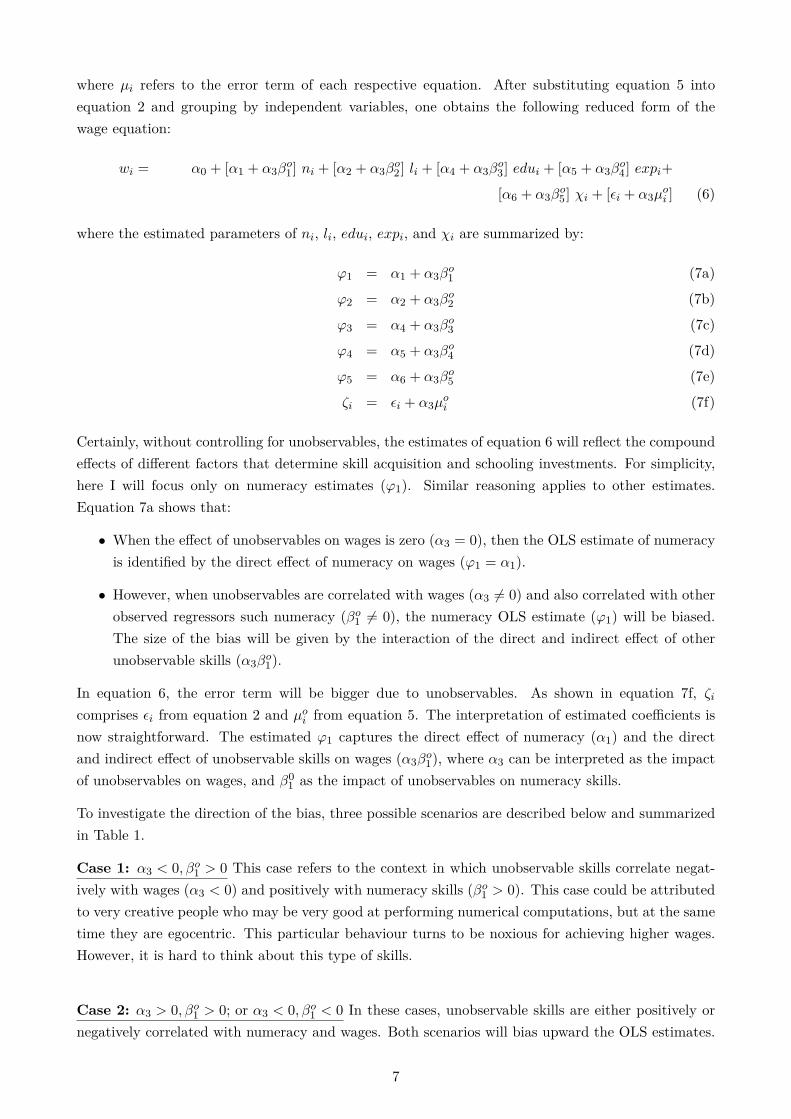
From the previous section we have learnt that numeracy and literacy skills matter for wages. Forthis reason, an interesting feature to investigate is the concavity or convexity of returns to skills. Theargument to test the non-linear impact of numeracy and literacy skills relies on the idea that skillincrement can benefit people differently across the skill distribution.
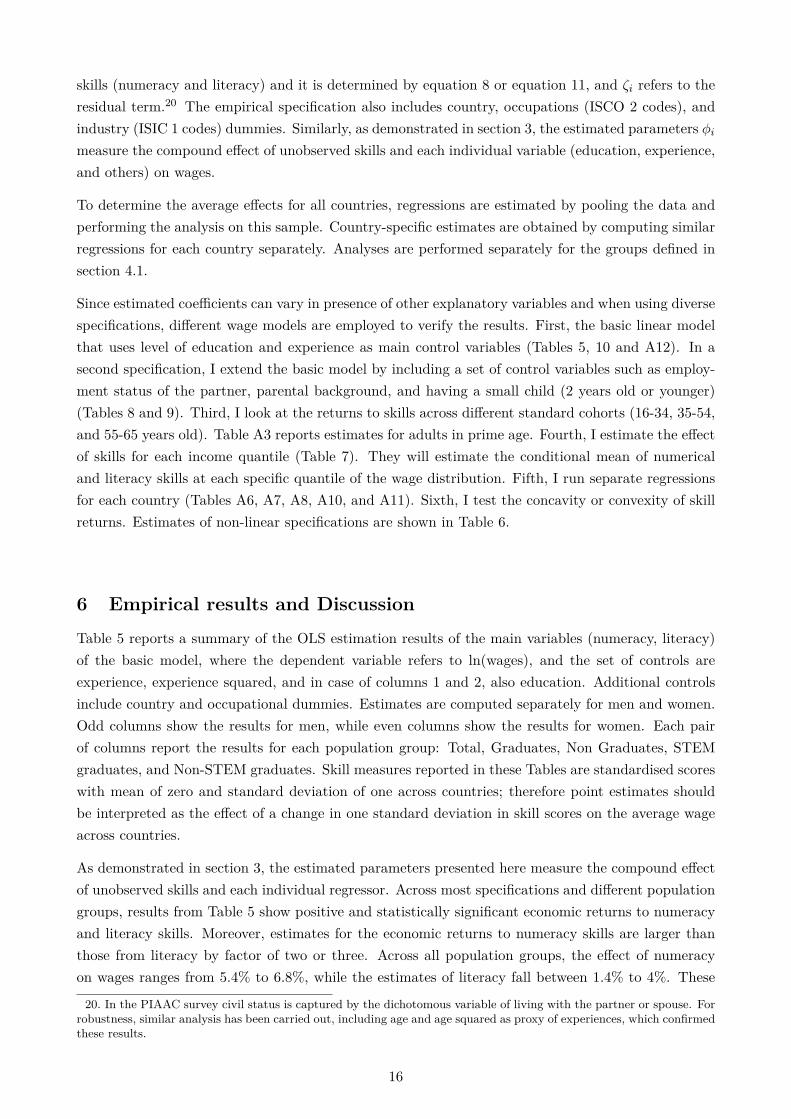
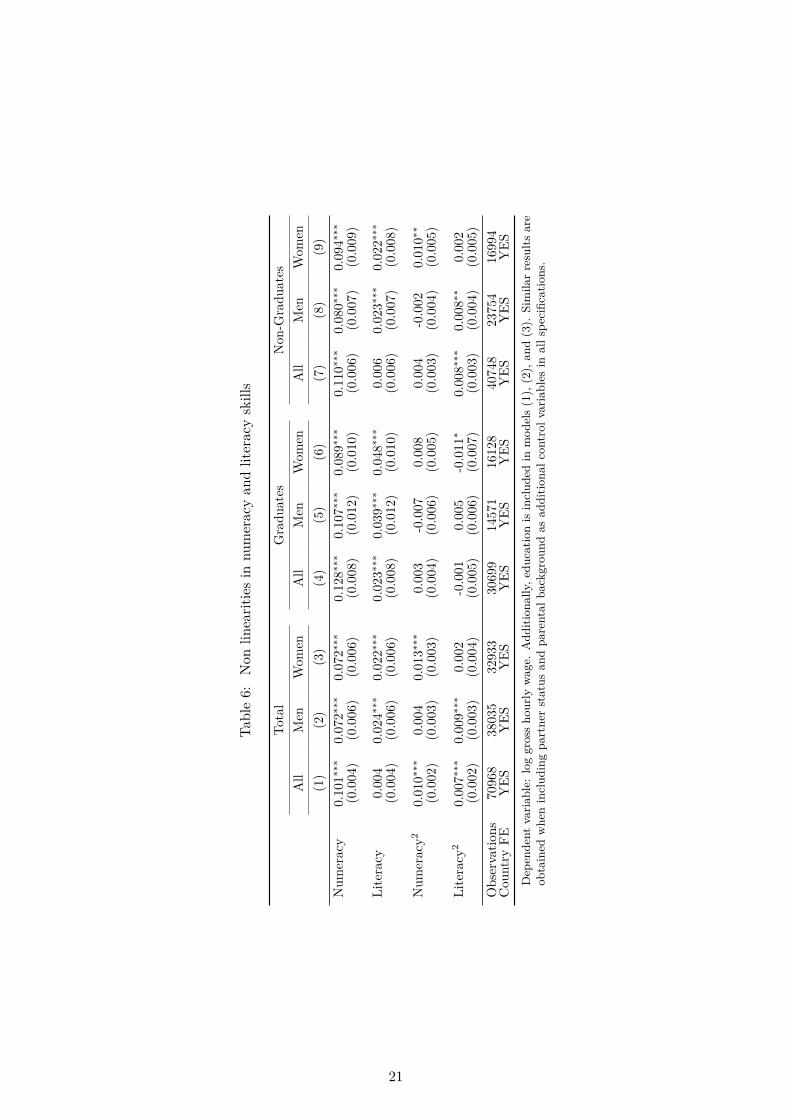
Table 6 shows the results from equation 11, which adds a quadratic term of each skill in the specific-ation of the skill production function. Regressions include control variables used in the basic model.Coefficients of linear terms of skills are positive and statistically significant for men and women in
21. Although variables such as growth and wages are different, they share similarly a positive relationship with skillsand they generate similar skepticism about the identification of their causal effects.
18
Tabl
e5:
Bas
icR
egre
ssio
ns
Tota
lG
radu
ates
Non
Gra
duat
esST
EMG
radu
ates
Non
-ST
EMG
radu
ates
(1)
(2)
(3)
(4)
(5)
(6)
(7)
(8)
(9)
(10)
Men
Wom
enM
enW
omen
Men
Wom
enM
enW
omen
Men
Wom
enN
umer
acy
0.05
7***
0.05
7***
0.06
8∗∗∗
0.06
8∗∗∗
0.06
0∗∗∗
0.06
2∗∗∗
0.05
9∗∗∗
0.05
4∗∗0.
068∗∗
∗0.
069∗∗
∗
(0.0
06)
(0.0
06)
(0.0
09)
(0.0
09)
(0.0
07)
(0.0
09)
(0.0
13)
(0.0
22)
(0.0
13)
(0.0
09)
Lite
racy
0.02
0***
0.02
1***
0.03
3∗∗∗
0.03
6∗∗∗
0.01
4∗0.
014∗
0.03
5∗∗0.
028
0.04
0∗∗∗
0.03
6∗∗∗
(0.0
06)
(0.0
06)
(0.0
09)
(0.0
09)
(0.0
07)
(0.0
08)
(0.0
13)
(0.0
22)
(0.0
13)
(0.0
09)
Num
erac
y*Li
tera
cy0.
003
0.00
6*0.
000
0.00
20.
002
0.00
9∗∗0.
002
-0.0
10-0
.004
0.00
4(0
.002
)(0
.003
)(0
.004
)(0
.005
)(0
.003
)(0
.003
)(0
.006
)(0
.010
)(0
.006
)(0
.006
)C
ount
ry,O
ccup
atio
nFE
YES
YES
YES
YES
YES
YES
YES
YES
YES
YES
Obs
erva
tions
3265
529
677
1454
116
103
1811
413
574
6793
2349
7748
1375
4St
anda
rder
rors
inpa
rent
hese
s∗p<
0.10
,∗∗p<
0.05
,∗∗∗p<
0.01
Leas
tsq
uare
sre
gres
sion
sw
eigh
ted
bysa
mpl
ew
eigh
ts.
Dep
ende
ntva
riabl
e:lo
ggr
oss
hour
lyw
age.
Sam
ple:
full-
time
wor
kers
grad
uate
s(C
anad
ain
clud
espa
rt-t
ime
wor
kers
).E
xper
ienc
ean
dex
perie
nce
squa
red,
and
educ
atio
nin
mod
els
(1)
and
(2)
are
incl
uded
asco
ntro
lvar
iabl
es.
19
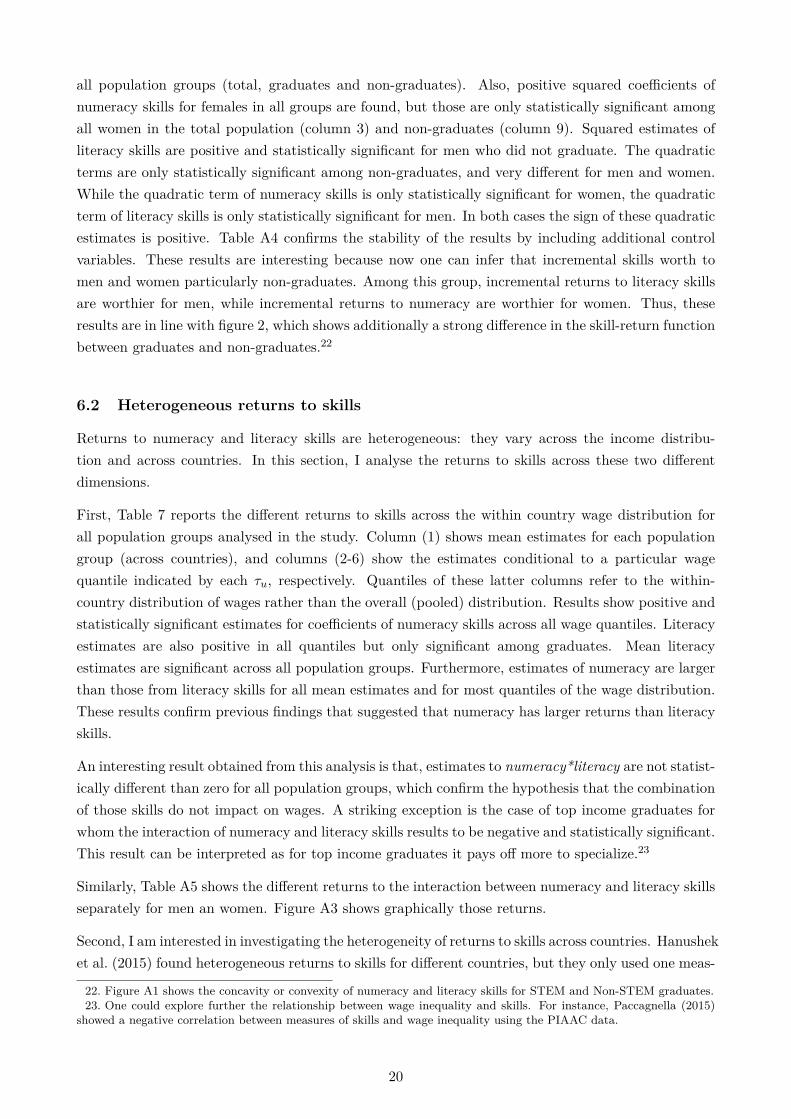
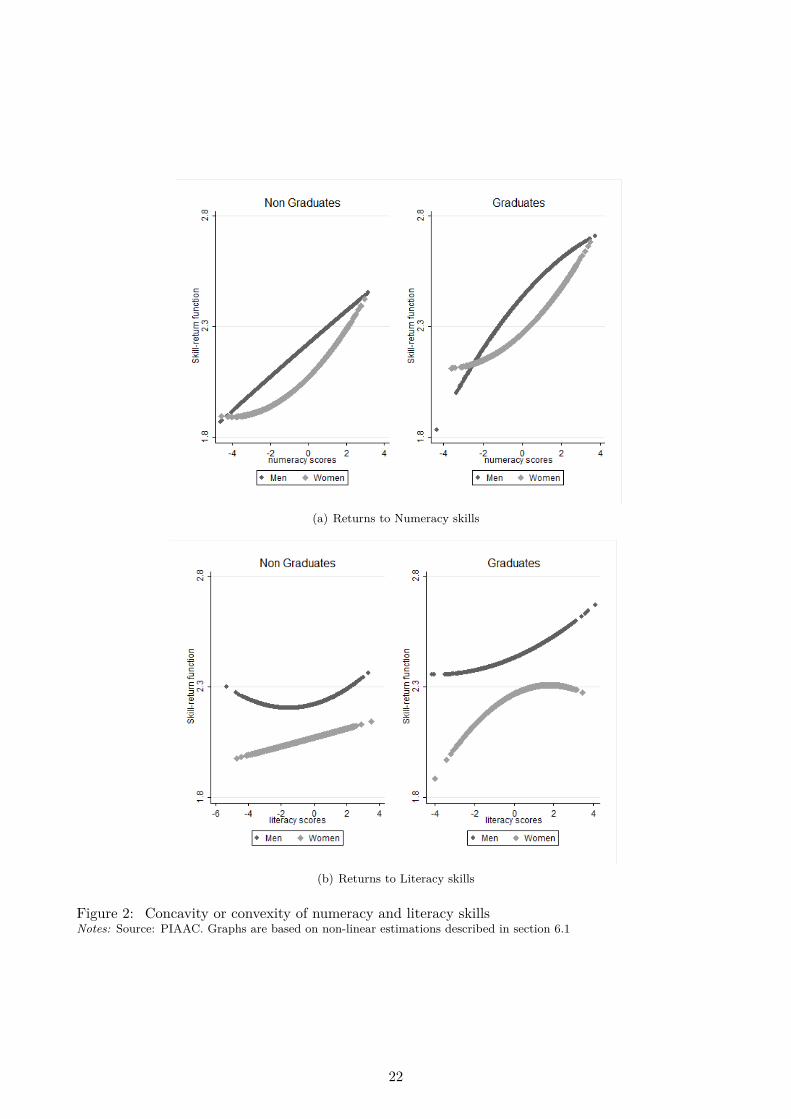
all population groups (total, graduates and non-graduates). Also, positive squared coefficients ofnumeracy skills for females in all groups are found, but those are only statistically significant amongall women in the total population (column 3) and non-graduates (column 9). Squared estimates ofliteracy skills are positive and statistically significant for men who did not graduate. The quadraticterms are only statistically significant among non-graduates, and very different for men and women.While the quadratic term of numeracy skills is only statistically significant for women, the quadraticterm of literacy skills is only statistically significant for men. In both cases the sign of these quadraticestimates is positive. Table A4 confirms the stability of the results by including additional controlvariables. These results are interesting because now one can infer that incremental skills worth tomen and women particularly non-graduates. Among this group, incremental returns to literacy skillsare worthier for men, while incremental returns to numeracy are worthier for women. Thus, theseresults are in line with figure 2, which shows additionally a strong difference in the skill-return functionbetween graduates and non-graduates.22
6.2 Heterogeneous returns to skills
Returns to numeracy and literacy skills are heterogeneous: they vary across the income distribu-tion and across countries. In this section, I analyse the returns to skills across these two differentdimensions.
First, Table 7 reports the different returns to skills across the within country wage distribution forall population groups analysed in the study. Column (1) shows mean estimates for each populationgroup (across countries), and columns (2-6) show the estimates conditional to a particular wagequantile indicated by each τu, respectively. Quantiles of these latter columns refer to the within-country distribution of wages rather than the overall (pooled) distribution. Results show positive andstatistically significant estimates for coefficients of numeracy skills across all wage quantiles. Literacyestimates are also positive in all quantiles but only significant among graduates. Mean literacyestimates are significant across all population groups. Furthermore, estimates of numeracy are largerthan those from literacy skills for all mean estimates and for most quantiles of the wage distribution.These results confirm previous findings that suggested that numeracy has larger returns than literacyskills.
An interesting result obtained from this analysis is that, estimates to numeracy*literacy are not statist-ically different than zero for all population groups, which confirm the hypothesis that the combinationof those skills do not impact on wages. A striking exception is the case of top income graduates forwhom the interaction of numeracy and literacy skills results to be negative and statistically significant.This result can be interpreted as for top income graduates it pays off more to specialize.23
Similarly, Table A5 shows the different returns to the interaction between numeracy and literacy skillsseparately for men an women. Figure A3 shows graphically those returns.
Second, I am interested in investigating the heterogeneity of returns to skills across countries. Hanusheket al. (2015) found heterogeneous returns to skills for different countries, but they only used one meas-
22. Figure A1 shows the concavity or convexity of numeracy and literacy skills for STEM and Non-STEM graduates.23. One could explore further the relationship between wage inequality and skills. For instance, Paccagnella (2015)
showed a negative correlation between measures of skills and wage inequality using the PIAAC data.
20
Tabl
e6:
Non
linea
ritie
sin
num
erac
yan
dlit
erac
ysk
ills
Tota
lG
radu
ates
Non
-Gra
duat
esA
llM
enW
omen
All
Men
Wom
enA
llM
enW
omen
(1)
(2)
(3)
(4)
(5)
(6)
(7)
(8)
(9)
Num
erac
y0.
101∗∗
∗0.
072∗∗
∗0.
072∗∗
∗0.
128∗∗
∗0.
107∗∗
∗0.
089∗∗
∗0.
110∗∗
∗0.
080∗∗
∗0.
094∗∗
∗
(0.0
04)
(0.0
06)
(0.0
06)
(0.0
08)
(0.0
12)
(0.0
10)
(0.0
06)
(0.0
07)
(0.0
09)
Lite
racy
0.00
40.
024∗∗
∗0.
022∗∗
∗0.
023∗∗
∗0.
039∗∗
∗0.
048∗∗
∗0.
006
0.02
3∗∗∗
0.02
2∗∗∗
(0.0
04)
(0.0
06)
(0.0
06)
(0.0
08)
(0.0
12)
(0.0
10)
(0.0
06)
(0.0
07)
(0.0
08)
Num
erac
y20.
010∗∗
∗0.
004
0.01
3∗∗∗
0.00
3-0
.007
0.00
80.
004
-0.0
020.
010∗∗
(0.0
02)
(0.0
03)
(0.0
03)
(0.0
04)
(0.0
06)
(0.0
05)
(0.0
03)
(0.0
04)
(0.0
05)
Lite
racy
20.
007∗∗
∗0.
009∗∗
∗0.
002
-0.0
010.
005
-0.0
11∗
0.00
8∗∗∗
0.00
8∗∗0.
002
(0.0
02)
(0.0
03)
(0.0
04)
(0.0
05)
(0.0
06)
(0.0
07)
(0.0
03)
(0.0
04)
(0.0
05)
Obs
erva
tions
7096
838
035
3293
330
699
1457
116
128
4074
823
754
1699
4C
ount
ryFE
YES
YES
YES
YES
YES
YES
YES
YES
YES
Dep
ende
ntva
riabl
e:lo
ggr
oss
hour
lyw
age.
Add
ition
ally
,edu
catio
nis
incl
uded
inm
odel
s(1
),(2
),an
d(3
).Si
mila
rre
sults
are
obta
ined
whe
nin
clud
ing
part
ner
stat
usan
dpa
rent
alba
ckgr
ound
asad
ditio
nalc
ontr
olva
riabl
esin
alls
peci
ficat
ions
.
21
(a) Returns to Numeracy skills
(b) Returns to Literacy skills
Figure 2: Concavity or convexity of numeracy and literacy skillsNotes: Source: PIAAC. Graphs are based on non-linear estimations described in section 6.1
22
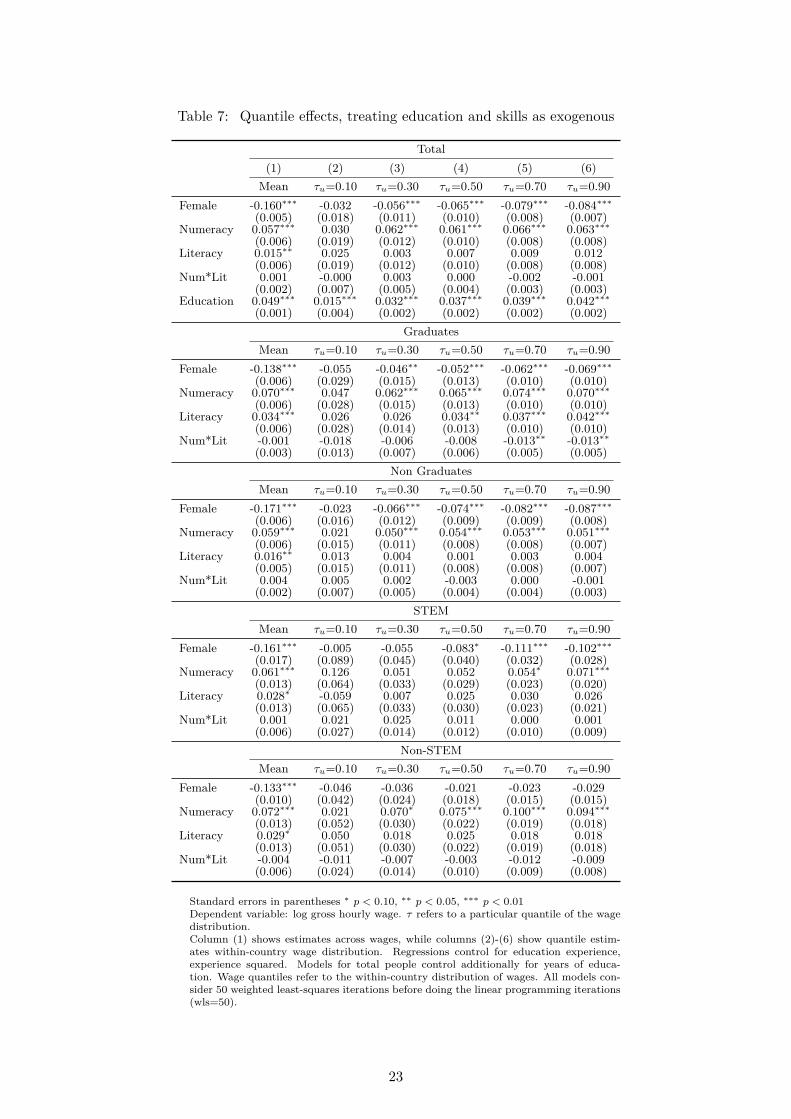
Table 7: Quantile effects, treating education and skills as exogenous
Total(1) (2) (3) (4) (5) (6)
Mean τu=0.10 τu=0.30 τu=0.50 τu=0.70 τu=0.90Female -0.160∗∗∗ -0.032 -0.056∗∗∗ -0.065∗∗∗ -0.079∗∗∗ -0.084∗∗∗
(0.005) (0.018) (0.011) (0.010) (0.008) (0.007)Numeracy 0.057∗∗∗ 0.030 0.062∗∗∗ 0.061∗∗∗ 0.066∗∗∗ 0.063∗∗∗
(0.006) (0.019) (0.012) (0.010) (0.008) (0.008)Literacy 0.015∗∗ 0.025 0.003 0.007 0.009 0.012
(0.006) (0.019) (0.012) (0.010) (0.008) (0.008)Num*Lit 0.001 -0.000 0.003 0.000 -0.002 -0.001
(0.002) (0.007) (0.005) (0.004) (0.003) (0.003)Education 0.049∗∗∗ 0.015∗∗∗ 0.032∗∗∗ 0.037∗∗∗ 0.039∗∗∗ 0.042∗∗∗
(0.001) (0.004) (0.002) (0.002) (0.002) (0.002)Graduates
Mean τu=0.10 τu=0.30 τu=0.50 τu=0.70 τu=0.90Female -0.138∗∗∗ -0.055 -0.046∗∗ -0.052∗∗∗ -0.062∗∗∗ -0.069∗∗∗
(0.006) (0.029) (0.015) (0.013) (0.010) (0.010)Numeracy 0.070∗∗∗ 0.047 0.062∗∗∗ 0.065∗∗∗ 0.074∗∗∗ 0.070∗∗∗
(0.006) (0.028) (0.015) (0.013) (0.010) (0.010)Literacy 0.034∗∗∗ 0.026 0.026 0.034∗∗ 0.037∗∗∗ 0.042∗∗∗
(0.006) (0.028) (0.014) (0.013) (0.010) (0.010)Num*Lit -0.001 -0.018 -0.006 -0.008 -0.013∗∗ -0.013∗∗
(0.003) (0.013) (0.007) (0.006) (0.005) (0.005)Non Graduates
Mean τu=0.10 τu=0.30 τu=0.50 τu=0.70 τu=0.90Female -0.171∗∗∗ -0.023 -0.066∗∗∗ -0.074∗∗∗ -0.082∗∗∗ -0.087∗∗∗
(0.006) (0.016) (0.012) (0.009) (0.009) (0.008)Numeracy 0.059∗∗∗ 0.021 0.050∗∗∗ 0.054∗∗∗ 0.053∗∗∗ 0.051∗∗∗
(0.006) (0.015) (0.011) (0.008) (0.008) (0.007)Literacy 0.016∗∗ 0.013 0.004 0.001 0.003 0.004
(0.005) (0.015) (0.011) (0.008) (0.008) (0.007)Num*Lit 0.004 0.005 0.002 -0.003 0.000 -0.001
(0.002) (0.007) (0.005) (0.004) (0.004) (0.003)STEM
Mean τu=0.10 τu=0.30 τu=0.50 τu=0.70 τu=0.90Female -0.161∗∗∗ -0.005 -0.055 -0.083∗ -0.111∗∗∗ -0.102∗∗∗
(0.017) (0.089) (0.045) (0.040) (0.032) (0.028)Numeracy 0.061∗∗∗ 0.126 0.051 0.052 0.054∗ 0.071∗∗∗
(0.013) (0.064) (0.033) (0.029) (0.023) (0.020)Literacy 0.028∗ -0.059 0.007 0.025 0.030 0.026
(0.013) (0.065) (0.033) (0.030) (0.023) (0.021)Num*Lit 0.001 0.021 0.025 0.011 0.000 0.001
(0.006) (0.027) (0.014) (0.012) (0.010) (0.009)Non-STEM
Mean τu=0.10 τu=0.30 τu=0.50 τu=0.70 τu=0.90Female -0.133∗∗∗ -0.046 -0.036 -0.021 -0.023 -0.029
(0.010) (0.042) (0.024) (0.018) (0.015) (0.015)Numeracy 0.072∗∗∗ 0.021 0.070∗ 0.075∗∗∗ 0.100∗∗∗ 0.094∗∗∗
(0.013) (0.052) (0.030) (0.022) (0.019) (0.018)Literacy 0.029∗ 0.050 0.018 0.025 0.018 0.018
(0.013) (0.051) (0.030) (0.022) (0.019) (0.018)Num*Lit -0.004 -0.011 -0.007 -0.003 -0.012 -0.009
(0.006) (0.024) (0.014) (0.010) (0.009) (0.008)
Standard errors in parentheses ∗ p < 0.10, ∗∗ p < 0.05, ∗∗∗ p < 0.01Dependent variable: log gross hourly wage. τ refers to a particular quantile of the wagedistribution.Column (1) shows estimates across wages, while columns (2)-(6) show quantile estim-ates within-country wage distribution. Regressions control for education experience,experience squared. Models for total people control additionally for years of educa-tion. Wage quantiles refer to the within-country distribution of wages. All models con-sider 50 weighted least-squares iterations before doing the linear programming iterations(wls=50).
23
ure of skills in their evaluations.24 After replicating the basic model reported in Table 5, I run similarregressions for each country similarly to Hanushek et al. (2015). In line with this study, my resultsconfirm that returns to numeracy are heterogeneous between countries, as well as returns to literacyskills. Also, when looking at the potential complementarity between numeracy and literacy skills,results vary across countries. Only Austria, Czech Republic, France and UK have positive interactioncoefficients of literacy and numeracy. Analyses for individual countries do not show conclusive evid-ence for skill complementarity among female non-graduates (see Table A9). The differences betweencountries might be due to different institutional settings (Hanushek et al. 2015). Future research willtry to understand the drivers of these differences. Returns to numeracy are larger than returns toliteracy in many countries as it was found for the average effects. Estimated numeracy coefficients arelarger than literacy coefficients across all population groups. Country specific results are reported inthe Appendix as follows: when consider the total sample (Table A6), only graduates (Table A7) andonly non-graduates (Table A8).
6.3 Female wage penalty
A well established literature states that men and women do not differ substantially in their verbaland numerical abilities (Lindberg et al. 2010; Niederle and Vesterlund 2010). Our previous resultsconfirm that skills differences do not explain the gender wage gap.
Gender discrimination has not been modeled in this article; however, the gender differences in wagesthat remain unexplained could be attributed to the female dummy included in the empirical set-up.To study how the economic returns differ across gender, this section investigates particularly thisfemale estimate. Results of the basic model are presented in Table 8. Also, since other variables,such as employment status of the partner, parental background, having a small child (2 years old oryounger) and industry dummies are particularly important for estimating gender wage differences,they are included as additional control variable.
The last row of Table 8 reports negative and statistically significant estimates of Female, a dummyvariable that takes the value of 1 in case a person is woman or 0 in case of man. Thus, they indicate apersistent female wage penalty across all population groups (total, graduates, STEM, and non-STEMgraduates). Columns 11 and 12 of Table 8 show negative and statistically significant estimates forthe interaction variable of Female*STEM, which confirm the wage cost of women even among STEMgraduates, despite the similar numerical and verbal skill distribution between gender (Figure 1). TableA12 shows sign and magnitudes of interacted coefficients of Female and STEM dummy variables, aswell as other variables included in the basic model for graduates. A similar female wage penalty isfound across specifications for single country analysis. Female penalty exists in most countries, evenamong STEM graduates (Table A10, A11).
Finding similar skill distributions (and potentially similar combination of skills) between men andwomen but stable female wage penalties is a worrying paradox. Adding different control variables tothe basic model helps to rule out those factors as potential drivers of gender discrimination; however,they do not explain the sources of the gender wage differences. For Gneezy, Niederle and Rustichini
24. In most of their specifications, they report returns to numeracy, but they reported having found similar heterogen-eous results when using literacy instead. Nevertheless, they did not report the use of both skills measures nor comparethe magnitude of returns in their country-specific regressions.
24
(2003), gender wage gap is explained by individual’s performance in competitive environments, and notby levels of skills themselves. Further analysis must try to understand the sources of this unexplainedfemale wage gap. For instance, one possible explanation can be the composition of labour in particularoccupations, and the intensity of using abstract, routine and manual tasks. This hypothesis couldbe explored by using a model that interacts wages gap with the dominant task components (routine,abstract, manual) of different occupations.
In Table 9, I replicate the estimates of Table 5 including more control variables and industry fixedeffects. Additionally to education, models from Table 9 include experience and experience squared,variables such as employment status of the partner, parental background, and having an small child (2years old or younger) and analytic weights. Magnitude of estimated coefficients of skills differ slightlyfrom the basic model, but the sign, statistical significance and the magnitude of point estimateswith respect to each other remain. Results from Table 9 confirm the larger economic returns tonumeracy compared to literacy, and the complementarity of numeracy and literacy skills for femalenon-graduates.25
6.4 Returns to skills vs. returns to schooling
In this section, I compare the returns to cognitive skills with returns to education.
The literature establishes that the effect of education on earnings is positive and of relatively largermagnitude than returns to other investments (Harmon, Oosterbeek and Walker 2003). Using theInternational Social Survey Programme (ISSP) data of 1995 which combines different national surveys,these authors found that returns to schooling in Europe are about 6% approximately.26 Country-specific estimates range between 3.9% to 14% for women, and between 4% to 8% for men.
A typical wage regression based on PIAAC data that includes numeracy yields returns to schoolingof similar magnitude (5.9% approx.) (Hanushek et al. 2015).27 Estimates from my model, whichincludes numeracy, literacy, and the interaction of both, go along with these findings. Columns (1)and (2) from Table 10 show that estimates, proxies for returns to education, are about 6.3% for menand 7% for women, which can be an indication of no serious bias in my specifications.
Mean estimates to returns to numeracy skills are higher than returns to education and account forabout 7% of the wage variation. After controlling for occupation, numeracy estimates reduce inapproximately 1.7%. Returns to literacy are smaller and about 2%. Interestingly, when controllingfor occupations, both returns to numeracy and literacy are identical for men and women (Columns(3) and (4), Table 10).
It is also well documented that returns to education are not the same for everybody. Webber (2014)stresses that returns to education differ substantially across different fields of study, and there is
25. External validity of the results here should be treated with some precaution because the analysis only considersfull-time workers. Mulligan and Rubinstein (2008) argue that increments in returns to skills from 70’s to 90’s change thelabour force participation patterns of women and consequently the observed gender wage gap. Intrinsic characteristicsof people who select themselves to work full-time might be related to their skill composition but are not accounted forin this study.
26. These authors include age, plant size and union, children and marriage, part-time work, year, region and industrydummies as control variables.
27. In this case, wage regressions include additionally experience, experience squared, and country fixed effects ascontrol variables.
25
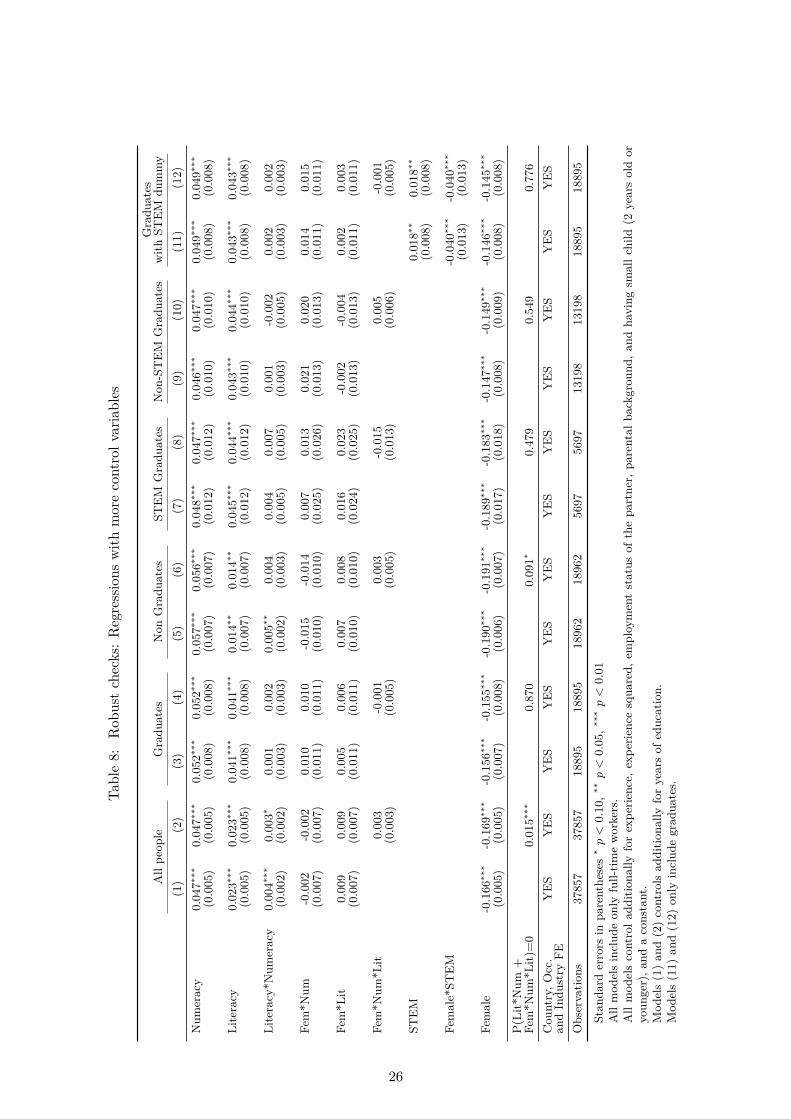
Tabl
e8:
Rob
ust
chec
ks:
Reg
ress
ions
with
mor
eco
ntro
lvar
iabl
es
Gra
duat
esA
llpe
ople
Gra
duat
esN
onG
radu
ates
STE
MG
radu
ates
Non
-ST
EM
Gra
duat
esw
ithST
EM
dum
my
(1)
(2)
(3)
(4)
(5)
(6)
(7)
(8)
(9)
(10)
(11)
(12)
Num
erac
y0.
047∗∗
∗0.
047∗∗
∗0.
052∗∗
∗0.
052∗∗
∗0.
057∗∗
∗0.
056∗∗
∗0.
048∗∗
∗0.
047∗∗
∗0.
046∗∗
∗0.
047∗∗
∗0.
049∗∗
∗0.
049∗∗
∗
(0.0
05)
(0.0
05)
(0.0
08)
(0.0
08)
(0.0
07)
(0.0
07)
(0.0
12)
(0.0
12)
(0.0
10)
(0.0
10)
(0.0
08)
(0.0
08)
Lite
racy
0.02
3∗∗∗
0.02
3∗∗∗
0.04
1∗∗∗
0.04
1∗∗∗
0.01
4∗∗0.
014∗∗
0.04
5∗∗∗
0.04
4∗∗∗
0.04
3∗∗∗
0.04
4∗∗∗
0.04
3∗∗∗
0.04
3∗∗∗
(0.0
05)
(0.0
05)
(0.0
08)
(0.0
08)
(0.0
07)
(0.0
07)
(0.0
12)
(0.0
12)
(0.0
10)
(0.0
10)
(0.0
08)
(0.0
08)
Lite
racy
*Num
erac
y0.
004∗∗
∗0.
003∗
0.00
10.
002
0.00
5∗∗0.
004
0.00
40.
007
0.00
1-0
.002
0.00
20.
002
(0.0
02)
(0.0
02)
(0.0
03)
(0.0
03)
(0.0
02)
(0.0
03)
(0.0
05)
(0.0
05)
(0.0
03)
(0.0
05)
(0.0
03)
(0.0
03)
Fem
*Num
-0.0
02-0
.002
0.01
00.
010
-0.0
15-0
.014
0.00
70.
013
0.02
10.
020
0.01
40.
015
(0.0
07)
(0.0
07)
(0.0
11)
(0.0
11)
(0.0
10)
(0.0
10)
(0.0
25)
(0.0
26)
(0.0
13)
(0.0
13)
(0.0
11)
(0.0
11)
Fem
*Lit
0.00
90.
009
0.00
50.
006
0.00
70.
008
0.01
60.
023
-0.0
02-0
.004
0.00
20.
003
(0.0
07)
(0.0
07)
(0.0
11)
(0.0
11)
(0.0
10)
(0.0
10)
(0.0
24)
(0.0
25)
(0.0
13)
(0.0
13)
(0.0
11)
(0.0
11)
Fem
*Num
*Lit
0.00
3-0
.001
0.00
3-0
.015
0.00
5-0
.001
(0.0
03)
(0.0
05)
(0.0
05)
(0.0
13)
(0.0
06)
(0.0
05)
STE
M0.
018∗∗
0.01
8∗∗
(0.0
08)
(0.0
08)
Fem
ale*
STE
M-0
.040
∗∗∗
-0.0
40∗∗
∗
(0.0
13)
(0.0
13)
Fem
ale
-0.1
66∗∗
∗-0
.169
∗∗∗
-0.1
56∗∗
∗-0
.155
∗∗∗
-0.1
90∗∗
∗-0
.191
∗∗∗
-0.1
89∗∗
∗-0
.183
∗∗∗
-0.1
47∗∗
∗-0
.149
∗∗∗
-0.1
46∗∗
∗-0
.145
∗∗∗
(0.0
05)
(0.0
05)
(0.0
07)
(0.0
08)
(0.0
06)
(0.0
07)
(0.0
17)
(0.0
18)
(0.0
08)
(0.0
09)
(0.0
08)
(0.0
08)
P(L
it*N
um+
Fem
*Num
*Lit)
=0
0.01
5∗∗∗
0.87
00.
091∗
0.47
90.
549
0.77
6C
ount
ry,O
cc.
YE
SY
ES
YE
SY
ES
YE
SY
ES
YE
SY
ES
YE
SY
ES
YE
SY
ES
and
Indu
stry
FEO
bser
vatio
ns37
857
3785
718
895
1889
518
962
1896
256
9756
9713
198
1319
818
895
1889
5
Stan
dard
erro
rsin
pare
nthe
ses
∗p<
0.10
,∗∗p<
0.05
,∗∗∗p<
0.01
All
mod
els
incl
ude
only
full-
time
wor
kers
.A
llm
odel
sco
ntro
ladd
ition
ally
for
expe
rienc
e,ex
perie
nce
squa
red,
empl
oym
ent
stat
usof
the
part
ner,
pare
ntal
back
grou
nd,a
ndha
ving
smal
lchi
ld(2
year
sol
dor
youn
ger)
,and
aco
nsta
nt.
Mod
els
(1)
and
(2)
cont
rols
addi
tiona
llyfo
rye
ars
ofed
ucat
ion.
Mod
els
(11)
and
(12)
only
incl
ude
grad
uate
s.
26
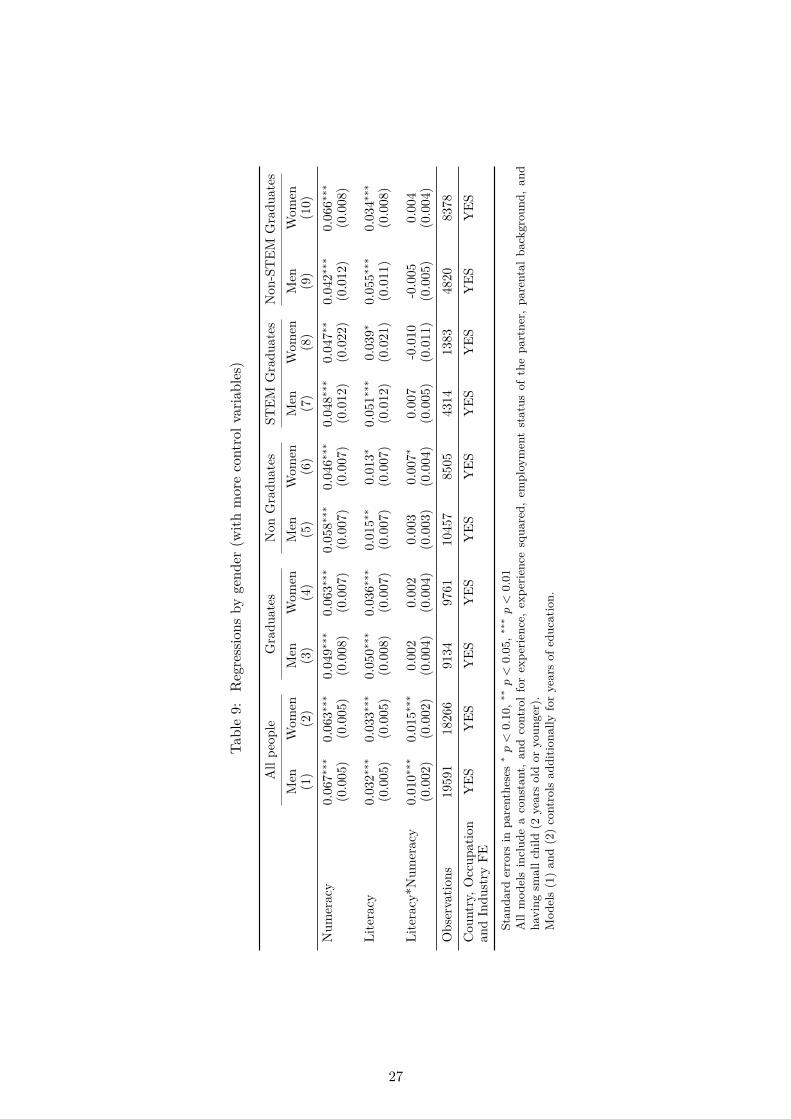
Tabl
e9:
Reg
ress
ions
byge
nder
(with
mor
eco
ntro
lvar
iabl
es)
All
peop
leG
radu
ates
Non
Gra
duat
esST
EMG
radu
ates
Non
-ST
EMG
radu
ates
Men
Wom
enM
enW
omen
Men
Wom
enM
enW
omen
Men
Wom
en(1
)(2
)(3
)(4
)(5
)(6
)(7
)(8
)(9
)(1
0)N
umer
acy
0.06
7∗∗∗
0.06
3∗∗∗
0.04
9∗∗∗
0.06
3∗∗∗
0.05
8∗∗∗
0.04
6∗∗∗
0.04
8∗∗∗
0.04
7∗∗0.
042∗∗
∗0.
066∗∗
∗
(0.0
05)
(0.0
05)
(0.0
08)
(0.0
07)
(0.0
07)
(0.0
07)
(0.0
12)
(0.0
22)
(0.0
12)
(0.0
08)
Lite
racy
0.03
2∗∗∗
0.03
3∗∗∗
0.05
0∗∗∗
0.03
6∗∗∗
0.01
5∗∗0.
013∗
0.05
1∗∗∗
0.03
9∗0.
055∗∗
∗0.
034∗∗
∗
(0.0
05)
(0.0
05)
(0.0
08)
(0.0
07)
(0.0
07)
(0.0
07)
(0.0
12)
(0.0
21)
(0.0
11)
(0.0
08)
Lite
racy
*Num
erac
y0.
010∗∗
∗0.
015∗∗
∗0.
002
0.00
20.
003
0.00
7∗0.
007
-0.0
10-0
.005
0.00
4(0
.002
)(0
.002
)(0
.004
)(0
.004
)(0
.003
)(0
.004
)(0
.005
)(0
.011
)(0
.005
)(0
.004
)O
bser
vatio
ns19
591
1826
691
3497
6110
457
8505
4314
1383
4820
8378
Cou
ntry
,Occ
upat
ion
YES
YES
YES
YES
YES
YES
YES
YES
YES
YES
and
Indu
stry
FESt
anda
rder
rors
inpa
rent
hese
s∗p<
0.10
,∗∗p<
0.05
,∗∗∗p<
0.01
All
mod
els
incl
ude
aco
nsta
nt,
and
cont
rol
for
expe
rienc
e,ex
perie
nce
squa
red,
empl
oym
ent
stat
usof
the
part
ner,
pare
ntal
back
grou
nd,
and
havi
ngsm
allc
hild
(2ye
ars
old
oryo
unge
r).
Mod
els
(1)
and
(2)
cont
rols
addi
tiona
llyfo
rye
ars
ofed
ucat
ion.
27
mixed evidence on the differences of schooling returns across types of institution. Since the choiceof schooling investments (i.e. decision to attend college and to pursue a particular academic degree)is not random, our empirical models estimate the effect of skills conditional on a particular level ofeducation (graduates, non-graduates, STEM and Non-STEM graduates). Results show that returnsto skills vary slightly among different educational groups.
7 Conclusions
This paper quantifies the contributions of numeracy and literacy skills and their joint effects onearnings. It determines the impact of skills on wages across different population groups (all people,graduates, non-graduates, and STEM and non-STEM graduates). It shows that both numeracy andliteracy skills matter significantly for men and women. It also pins down if women are penalized inthe labour market by examining groups with homogeneous skill distributions such as those graduatedfrom STEM programs.
A simple theoretical framework intends to shed light on the interpretation of the estimated coefficients.Results show higher returns for numeracy than for literacy skills across all populations groups. Tech-nological change and computerization have risen the demand for numerical skills, which appears toexplain this result. There is little complementarity among numeracy and literacy skills. The interac-tion of numeracy and literacy is positive and statistically significant only among female non-graduates.The study found graduates to have higher levels of numeracy and literacy skills than non-graduates.This result is explained because it seems more profitable for the former to specialize in the use ofeither numeracy or literacy than for latter ones.
An interesting but worrying result across all specifications (including pooled, quantile, and country-specific regressions) shows that skill differences do not explain wage gap. Women receive a wagepenalty even among STEM graduates, a group in which men and women have similar skill distribu-tions. Differences in non-linear skill-return functions between men and women bring new insights forunderstanding these differences in returns to cognitive skills. Quantile estimations confirmed thesefindings.
To complement this analysis, future avenues of research can explore differences in returns to skillsacross occupations. Also, it will be worth to study the links between the convexity or concavity of theskill-return functions and their complementarity. Furthermore, one can examine how migration canchange country-specific returns to skills in the country of origin and the receiving country. With theavailability of new longitudinal data and other sources, one will able to tackle the potential endogeneityof education and skill measures. Finally, it will be crucial to investigate the role of numeracy andliteracy for educational achievements and their returns on labour outcomes, such as employment.
28
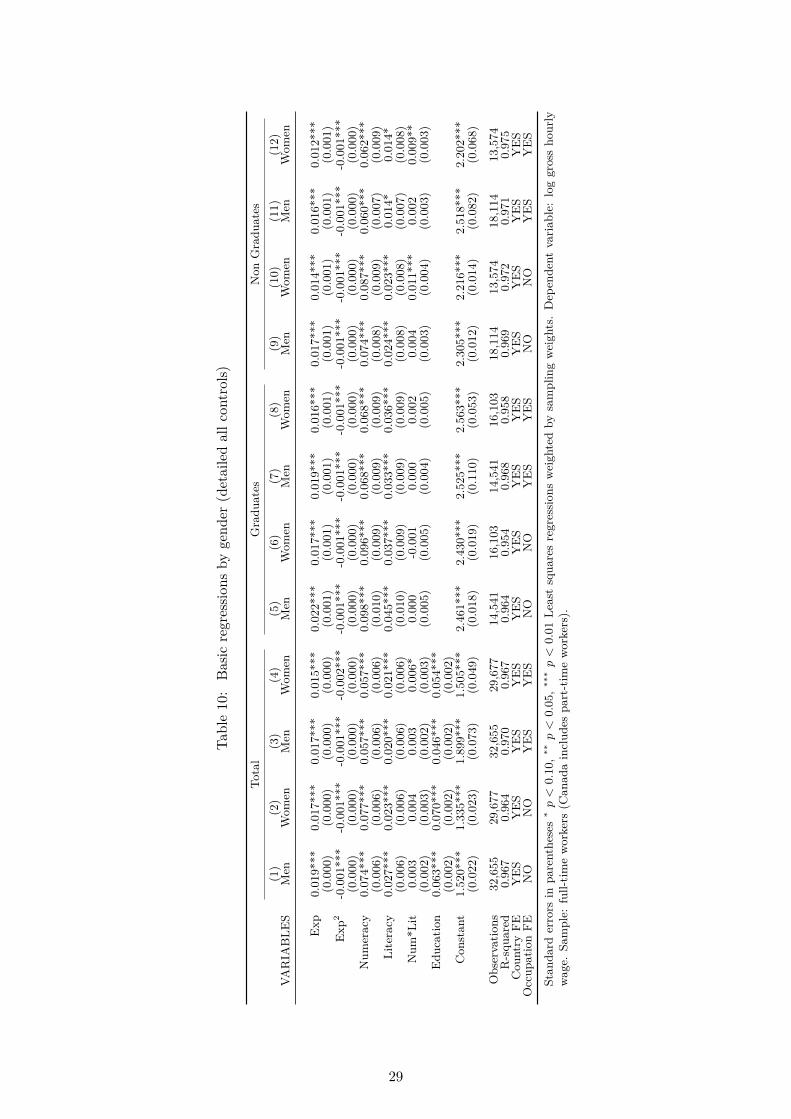
Tabl
e10
:B
asic
regr
essio
nsby
gend
er(d
etai
led
allc
ontr
ols)
Tota
lG
radu
ates
Non
Gra
duat
es(1
)(2
)(3
)(4
)(5
)(6
)(7
)(8
)(9
)(1
0)(1
1)(1
2)VA
RIA
BLE
SM
enW
omen
Men
Wom
enM
enW
omen
Men
Wom
enM
enW
omen
Men
Wom
en
Exp
0.01
9***
0.01
7***
0.01
7***
0.01
5***
0.02
2***
0.01
7***
0.01
9***
0.01
6***
0.01
7***
0.01
4***
0.01
6***
0.01
2***
(0.0
00)
(0.0
00)
(0.0
00)
(0.0
00)
(0.0
01)
(0.0
01)
(0.0
01)
(0.0
01)
(0.0
01)
(0.0
01)
(0.0
01)
(0.0
01)
Exp
2-0
.001
***
-0.0
01**
*-0
.001
***
-0.0
02**
*-0
.001
***
-0.0
01**
*-0
.001
***
-0.0
01**
*-0
.001
***
-0.0
01**
*-0
.001
***
-0.0
01**
*(0
.000
)(0
.000
)(0
.000
)(0
.000
)(0
.000
)(0
.000
)(0
.000
)(0
.000
)(0
.000
)(0
.000
)(0
.000
)(0
.000
)N
umer
acy
0.07
4***
0.07
7***
0.05
7***
0.05
7***
0.09
8***
0.09
6***
0.06
8***
0.06
8***
0.07
4***
0.08
7***
0.06
0***
0.06
2***
(0.0
06)
(0.0
06)
(0.0
06)
(0.0
06)
(0.0
10)
(0.0
09)
(0.0
09)
(0.0
09)
(0.0
08)
(0.0
09)
(0.0
07)
(0.0
09)
Lite
racy
0.02
7***
0.02
3***
0.02
0***
0.02
1***
0.04
5***
0.03
7***
0.03
3***
0.03
6***
0.02
4***
0.02
3***
0.01
4*0.
014*
(0.0
06)
(0.0
06)
(0.0
06)
(0.0
06)
(0.0
10)
(0.0
09)
(0.0
09)
(0.0
09)
(0.0
08)
(0.0
08)
(0.0
07)
(0.0
08)
Num
*Lit
0.00
30.
004
0.00
30.
006*
0.00
0-0
.001
0.00
00.
002
0.00
40.
011*
**0.
002
0.00
9**
(0.0
02)
(0.0
03)
(0.0
02)
(0.0
03)
(0.0
05)
(0.0
05)
(0.0
04)
(0.0
05)
(0.0
03)
(0.0
04)
(0.0
03)
(0.0
03)
Edu
catio
n0.
063*
**0.
070*
**0.
046*
**0.
054*
**(0
.002
)(0
.002
)(0
.002
)(0
.002
)C
onst
ant
1.52
0***
1.33
5***
1.89
9***
1.50
5***
2.46
1***
2.43
0***
2.52
5***
2.56
3***
2.30
5***
2.21
6***
2.51
8***
2.20
2***
(0.0
22)
(0.0
23)
(0.0
73)
(0.0
49)
(0.0
18)
(0.0
19)
(0.1
10)
(0.0
53)
(0.0
12)
(0.0
14)
(0.0
82)
(0.0
68)
Obs
erva
tions
32,6
5529
,677
32,6
5529
,677
14,5
4116
,103
14,5
4116
,103
18,1
1413
,574
18,1
1413
,574
R-s
quar
ed0.
967
0.96
40.
970
0.96
70.
964
0.95
40.
968
0.95
80.
969
0.97
20.
971
0.97
5C
ount
ryFE
YE
SY
ES
YE
SY
ES
YE
SY
ES
YE
SY
ES
YE
SY
ES
YE
SY
ES
Occ
upat
ion
FEN
ON
OY
ES
YE
SN
ON
OY
ES
YE
SN
ON
OY
ES
YE
S
Stan
dard
erro
rsin
pare
nthe
ses
∗p<
0.10
,∗∗p<
0.05
,∗∗∗p<
0.01
Leas
tsq
uare
sre
gres
sion
sw
eigh
ted
bysa
mpl
ing
wei
ghts
.D
epen
dent
varia
ble:
log
gros
sho
urly
wag
e.Sa
mpl
e:fu
ll-tim
ew
orke
rs(C
anad
ain
clud
espa
rt-t
ime
wor
kers
).
29
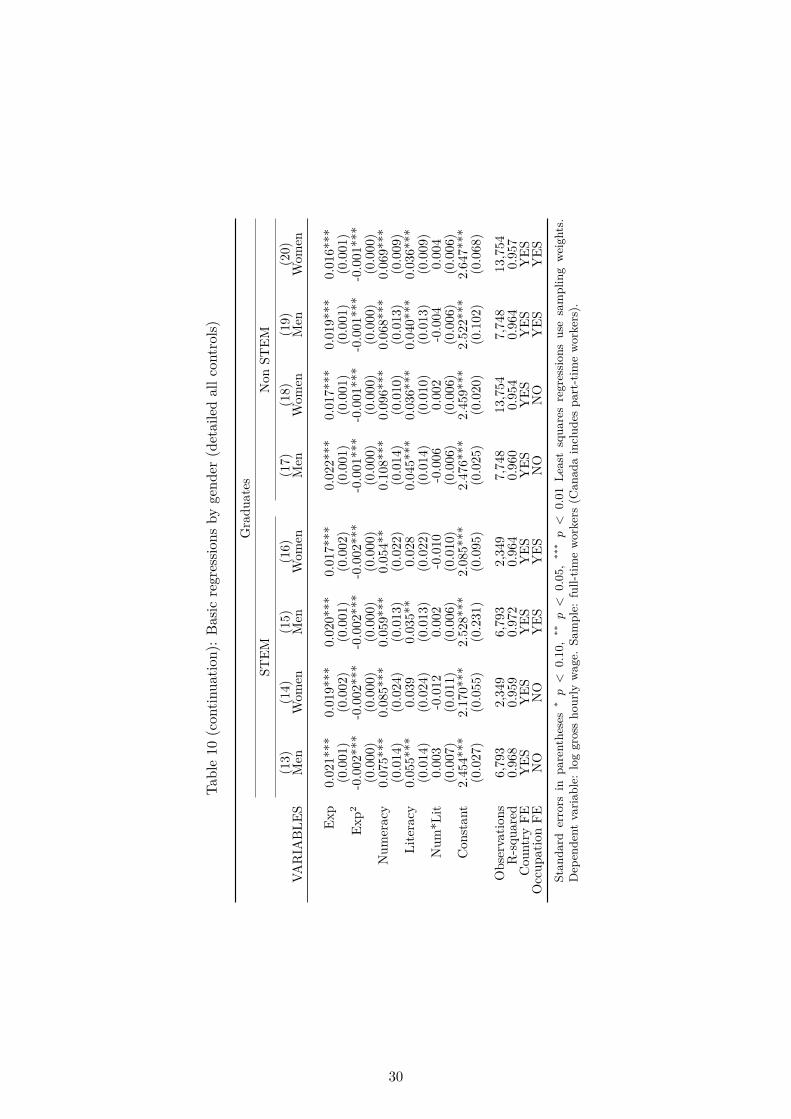
Tabl
e10
(con
tinua
tion)
:B
asic
regr
essio
nsby
gend
er(d
etai
led
allc
ontr
ols)
Gra
duat
esST
EMN
onST
EM(1
3)(1
4)(1
5)(1
6)(1
7)(1
8)(1
9)(2
0)VA
RIA
BLE
SM
enW
omen
Men
Wom
enM
enW
omen
Men
Wom
en
Exp
0.02
1***
0.01
9***
0.02
0***
0.01
7***
0.02
2***
0.01
7***
0.01
9***
0.01
6***
(0.0
01)
(0.0
02)
(0.0
01)
(0.0
02)
(0.0
01)
(0.0
01)
(0.0
01)
(0.0
01)
Exp2
-0.0
02**
*-0
.002
***
-0.0
02**
*-0
.002
***
-0.0
01**
*-0
.001
***
-0.0
01**
*-0
.001
***
(0.0
00)
(0.0
00)
(0.0
00)
(0.0
00)
(0.0
00)
(0.0
00)
(0.0
00)
(0.0
00)
Num
erac
y0.
075*
**0.
085*
**0.
059*
**0.
054*
*0.
108*
**0.
096*
**0.
068*
**0.
069*
**(0
.014
)(0
.024
)(0
.013
)(0
.022
)(0
.014
)(0
.010
)(0
.013
)(0
.009
)Li
tera
cy0.
055*
**0.
039
0.03
5**
0.02
80.
045*
**0.
036*
**0.
040*
**0.
036*
**(0
.014
)(0
.024
)(0
.013
)(0
.022
)(0
.014
)(0
.010
)(0
.013
)(0
.009
)N
um*L
it0.
003
-0.0
120.
002
-0.0
10-0
.006
0.00
2-0
.004
0.00
4(0
.007
)(0
.011
)(0
.006
)(0
.010
)(0
.006
)(0
.006
)(0
.006
)(0
.006
)C
onst
ant
2.45
4***
2.17
0***
2.52
8***
2.08
5***
2.47
6***
2.45
9***
2.52
2***
2.64
7***
(0.0
27)
(0.0
55)
(0.2
31)
(0.0
95)
(0.0
25)
(0.0
20)
(0.1
02)
(0.0
68)
Obs
erva
tions
6,79
32,
349
6,79
32,
349
7,74
813
,754
7,74
813
,754
R-s
quar
ed0.
968
0.95
90.
972
0.96
40.
960
0.95
40.
964
0.95
7C
ount
ryFE
YES
YES
YES
YES
YES
YES
YES
YES
Occ
upat
ion
FEN
ON
OY
ESY
ESN
ON
OY
ESY
ESSt
anda
rder
rors
inpa
rent
hese
s∗p<
0.10
,∗∗
p<
0.05
,∗∗
∗p<
0.01
Leas
tsq
uare
sre
gres
sion
sus
esa
mpl
ing
wei
ghts
.D
epen
dent
varia
ble:
log
gros
sho
urly
wag
e.Sa
mpl
e:fu
ll-tim
ew
orke
rs(C
anad
ain
clud
espa
rt-t
ime
wor
kers
).
30
8 Appendix
Variables description
• Wages: refers to the gross hourly earnings of wage and salaried workers. They excluded bonusesand are PPP corrected by US dollars. In computations, following Hanushek et al. (2015),measures of wages refer to trimmed hourly wages (continuous if possible, otherwise deciles).
• Education: highest level of education obtained imputed into years of education. Derivedvariable in PIAAC.
• Literacy: Plausible literacy score 1 in PIAAC. It takes values from 0 to 500.
• Numeracy: Plausible numeracy score 1 in PIAAC. It takes values from 0 to 500.
• Experience: years of paid work during lifetime.
• Age child: age of the youngest child: (1) aged 2 or younger, (2) aged 3-5, (3) aged 6-12, (4)aged 13 or older.
• Partner: dummy variable referring to the condition of living with spouse or couple. It takesthe value: 1 (yes), 0 (no).
• Partner status: categorical variable that refers to the work situation of spouse or partner. Itcould be unemployed (0), full-time (1), part-time (2), or other (3).
• Parental background: categorical variable referring to the highest level of education of theparents: neither parent has attained upper secondary (0), at least one parent has attainedsecondary school (1), at least one parent has attained tertiary education (3).
• Number of books at home: Having books at home: (1) 10 books or less, (2) 11 to 25 books,(3) 26 to 100 books, (4) 101 to 200 books, (5) 201 to 500 books, (6) more than 500 books.
• Occupational dummies: occupational classification of respondent’s current job at 2-digit level(ISCO 2008).
• Industry dummies: Industry classification of respondent’s job at 2-digit level (ISIC rev 4).
31
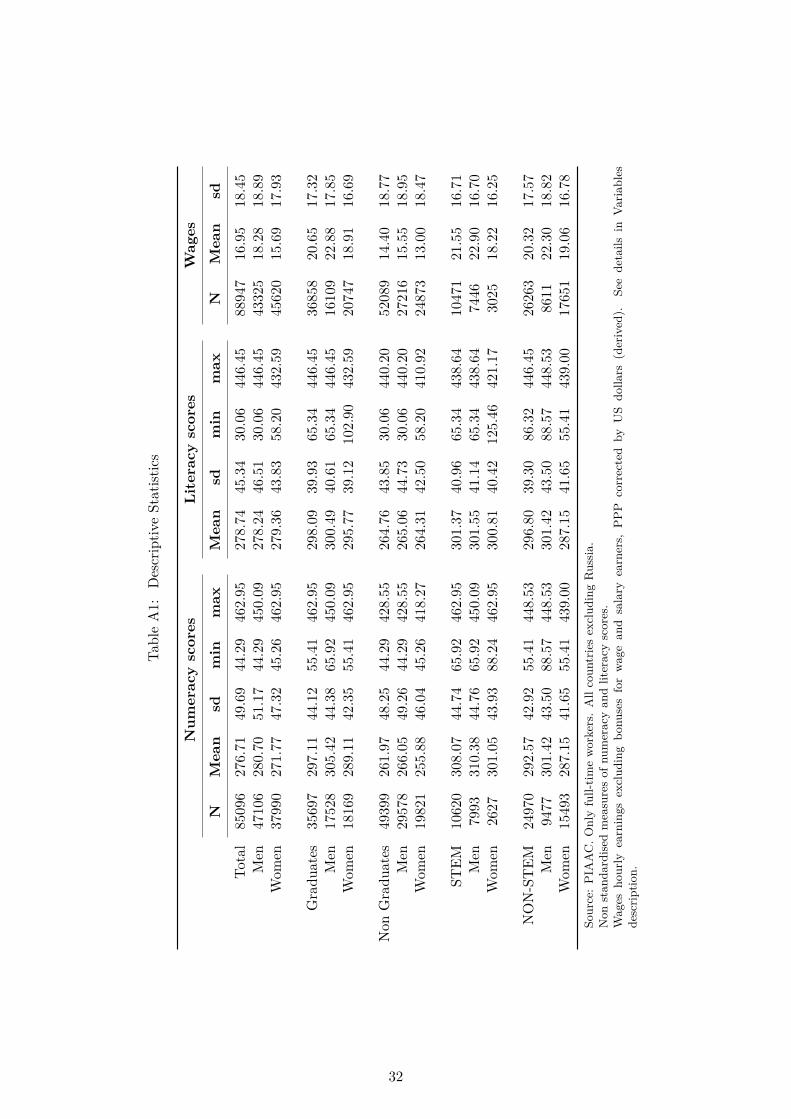
Tabl
eA
1:D
escr
iptiv
eSt
atist
ics
Num
erac
ysc
ores
Lit
erac
ysc
ores
Wag
es
NM
ean
sdm
inm
axM
ean
sdm
inm
axN
Mea
nsd
Tota
l85
096
276.
7149
.69
44.2
946
2.95
278.
7445
.34
30.0
644
6.45
8894
716
.95
18.4
5M
en47
106
280.
7051
.17
44.2
945
0.09
278.
2446
.51
30.0
644
6.45
4332
518
.28
18.8
9W
omen
3799
027
1.77
47.3
245
.26
462.
9527
9.36
43.8
358
.20
432.
5945
620
15.6
917
.93
Gra
duat
es35
697
297.
1144
.12
55.4
146
2.95
298.
0939
.93
65.3
444
6.45
3685
820
.65
17.3
2M
en17
528
305.
4244
.38
65.9
245
0.09
300.
4940
.61
65.3
444
6.45
1610
922
.88
17.8
5W
omen
1816
928
9.11
42.3
555
.41
462.
9529
5.77
39.1
210
2.90
432.
5920
747
18.9
116
.69
Non
Gra
duat
es49
399
261.
9748
.25
44.2
942
8.55
264.
7643
.85
30.0
644
0.20
5208
914
.40
18.7
7M
en29
578
266.
0549
.26
44.2
942
8.55
265.
0644
.73
30.0
644
0.20
2721
615
.55
18.9
5W
omen
1982
125
5.88
46.0
445
.26
418.
2726
4.31
42.5
058
.20
410.
9224
873
13.0
018
.47
STEM
1062
030
8.07
44.7
465
.92
462.
9530
1.37
40.9
665
.34
438.
6410
471
21.5
516
.71
Men
7993
310.
3844
.76
65.9
245
0.09
301.
5541
.14
65.3
443
8.64
7446
22.9
016
.70
Wom
en26
2730
1.05
43.9
388
.24
462.
9530
0.81
40.4
212
5.46
421.
1730
2518
.22
16.2
5
NO
N-S
TEM
2497
029
2.57
42.9
255
.41
448.
5329
6.80
39.3
086
.32
446.
4526
263
20.3
217
.57
Men
9477
301.
4243
.50
88.5
744
8.53
301.
4243
.50
88.5
744
8.53
8611
22.3
018
.82
Wom
en15
493
287.
1541
.65
55.4
143
9.00
287.
1541
.65
55.4
143
9.00
1765
119
.06
16.7
8So
urce
:P
IAA
C.O
nly
full-
time
wor
kers
.A
llco
untr
ies
excl
udin
gR
ussi
a.N
onst
anda
rdis
edm
easu
res
ofnu
mer
acy
and
liter
acy
scor
es.
Wag
esho
urly
earn
ings
excl
udin
gbo
nuse
sfo
rw
age
and
sala
ryea
rner
s,P
PP
corr
ecte
dby
US
dolla
rs(d
eriv
ed).
See
deta
ilsin
Varia
bles
desc
riptio
n.
32
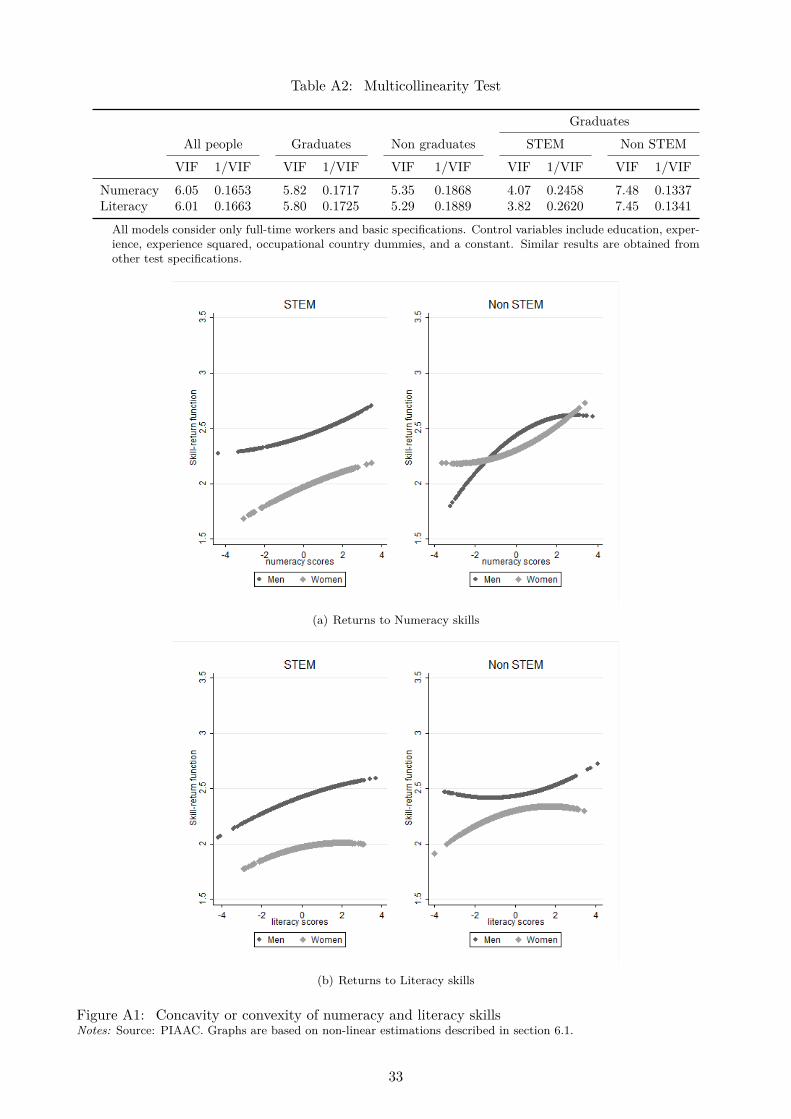
Table A2: Multicollinearity Test
Graduates
All people Graduates Non graduates STEM Non STEM
VIF 1/VIF VIF 1/VIF VIF 1/VIF VIF 1/VIF VIF 1/VIF
Numeracy 6.05 0.1653 5.82 0.1717 5.35 0.1868 4.07 0.2458 7.48 0.1337Literacy 6.01 0.1663 5.80 0.1725 5.29 0.1889 3.82 0.2620 7.45 0.1341
All models consider only full-time workers and basic specifications. Control variables include education, exper-ience, experience squared, occupational country dummies, and a constant. Similar results are obtained fromother test specifications.
(a) Returns to Numeracy skills
(b) Returns to Literacy skills
Figure A1: Concavity or convexity of numeracy and literacy skillsNotes: Source: PIAAC. Graphs are based on non-linear estimations described in section 6.1.
33
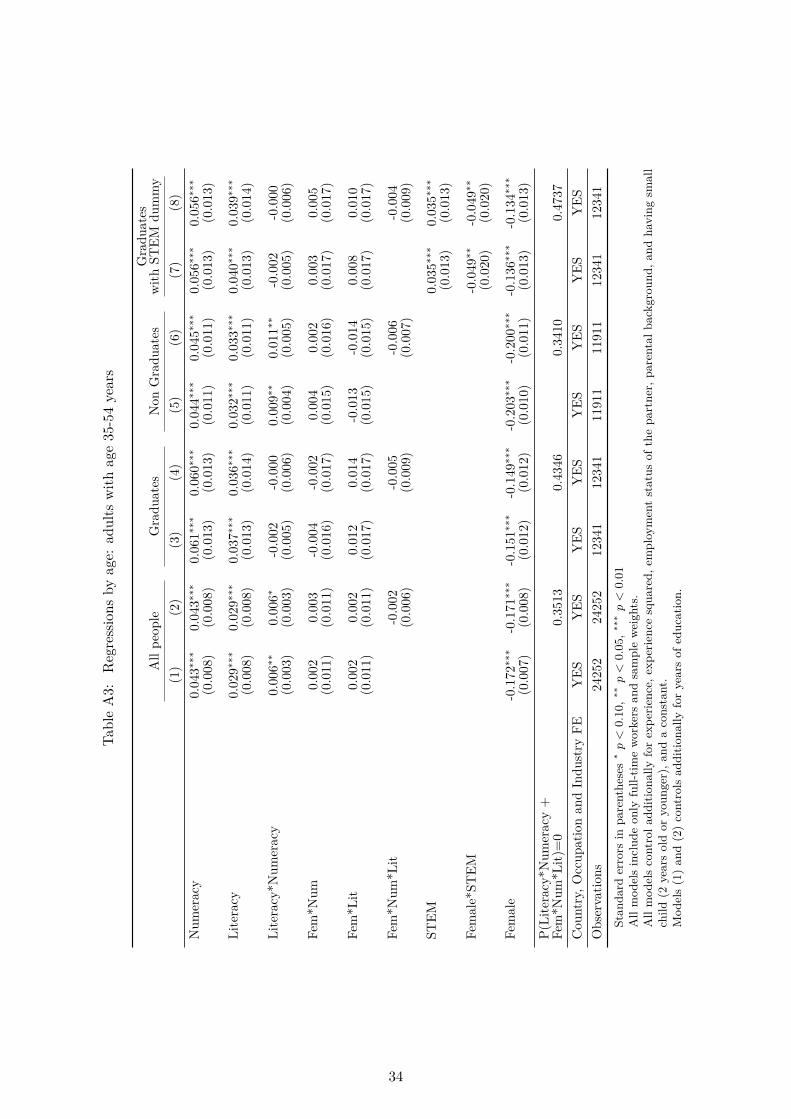
Tabl
eA
3:R
egre
ssio
nsby
age:
adul
tsw
ithag
e35
-54
year
s
Gra
duat
esA
llpe
ople
Gra
duat
esN
onG
radu
ates
with
STEM
dum
my
(1)
(2)
(3)
(4)
(5)
(6)
(7)
(8)
Num
erac
y0.
043∗∗
∗0.
043∗∗
∗0.
061∗∗
∗0.
060∗∗
∗0.
044∗∗
∗0.
045∗∗
∗0.
056∗∗
∗0.
056∗∗
∗
(0.0
08)
(0.0
08)
(0.0
13)
(0.0
13)
(0.0
11)
(0.0
11)
(0.0
13)
(0.0
13)
Lite
racy
0.02
9∗∗∗
0.02
9∗∗∗
0.03
7∗∗∗
0.03
6∗∗∗
0.03
2∗∗∗
0.03
3∗∗∗
0.04
0∗∗∗
0.03
9∗∗∗
(0.0
08)
(0.0
08)
(0.0
13)
(0.0
14)
(0.0
11)
(0.0
11)
(0.0
13)
(0.0
14)
Lite
racy
*Num
erac
y0.
006∗∗
0.00
6∗-0
.002
-0.0
000.
009∗∗
0.01
1∗∗-0
.002
-0.0
00(0
.003
)(0
.003
)(0
.005
)(0
.006
)(0
.004
)(0
.005
)(0
.005
)(0
.006
)
Fem
*Num
0.00
20.
003
-0.0
04-0
.002
0.00
40.
002
0.00
30.
005
(0.0
11)
(0.0
11)
(0.0
16)
(0.0
17)
(0.0
15)
(0.0
16)
(0.0
17)
(0.0
17)
Fem
*Lit
0.00
20.
002
0.01
20.
014
-0.0
13-0
.014
0.00
80.
010
(0.0
11)
(0.0
11)
(0.0
17)
(0.0
17)
(0.0
15)
(0.0
15)
(0.0
17)
(0.0
17)
Fem
*Num
*Lit
-0.0
02-0
.005
-0.0
06-0
.004
(0.0
06)
(0.0
09)
(0.0
07)
(0.0
09)
STEM
0.03
5∗∗∗
0.03
5∗∗∗
(0.0
13)
(0.0
13)
Fem
ale*
STEM
-0.0
49∗∗
-0.0
49∗∗
(0.0
20)
(0.0
20)
Fem
ale
-0.1
72∗∗
∗-0
.171
∗∗∗
-0.1
51∗∗
∗-0
.149
∗∗∗
-0.2
03∗∗
∗-0
.200
∗∗∗
-0.1
36∗∗
∗-0
.134
∗∗∗
(0.0
07)
(0.0
08)
(0.0
12)
(0.0
12)
(0.0
10)
(0.0
11)
(0.0
13)
(0.0
13)
P(Li
tera
cy*N
umer
acy
+Fe
m*N
um*L
it)=
00.
3513
0.43
460.
3410
0.47
37C
ount
ry,O
ccup
atio
nan
dIn
dust
ryFE
YES
YES
YES
YES
YES
YES
YES
YES
Obs
erva
tions
2425
224
252
1234
112
341
1191
111
911
1234
112
341
Stan
dard
erro
rsin
pare
nthe
ses
∗p<
0.10
,∗∗p<
0.05
,∗∗∗p<
0.01
All
mod
els
incl
ude
only
full-
time
wor
kers
and
sam
ple
wei
ghts
.A
llm
odel
sco
ntro
ladd
ition
ally
for
expe
rienc
e,ex
perie
nce
squa
red,
empl
oym
ent
stat
usof
the
part
ner,
pare
ntal
back
grou
nd,a
ndha
ving
smal
lch
ild(2
year
sol
dor
youn
ger)
,and
aco
nsta
nt.
Mod
els
(1)
and
(2)
cont
rols
addi
tiona
llyfo
rye
ars
ofed
ucat
ion.
34
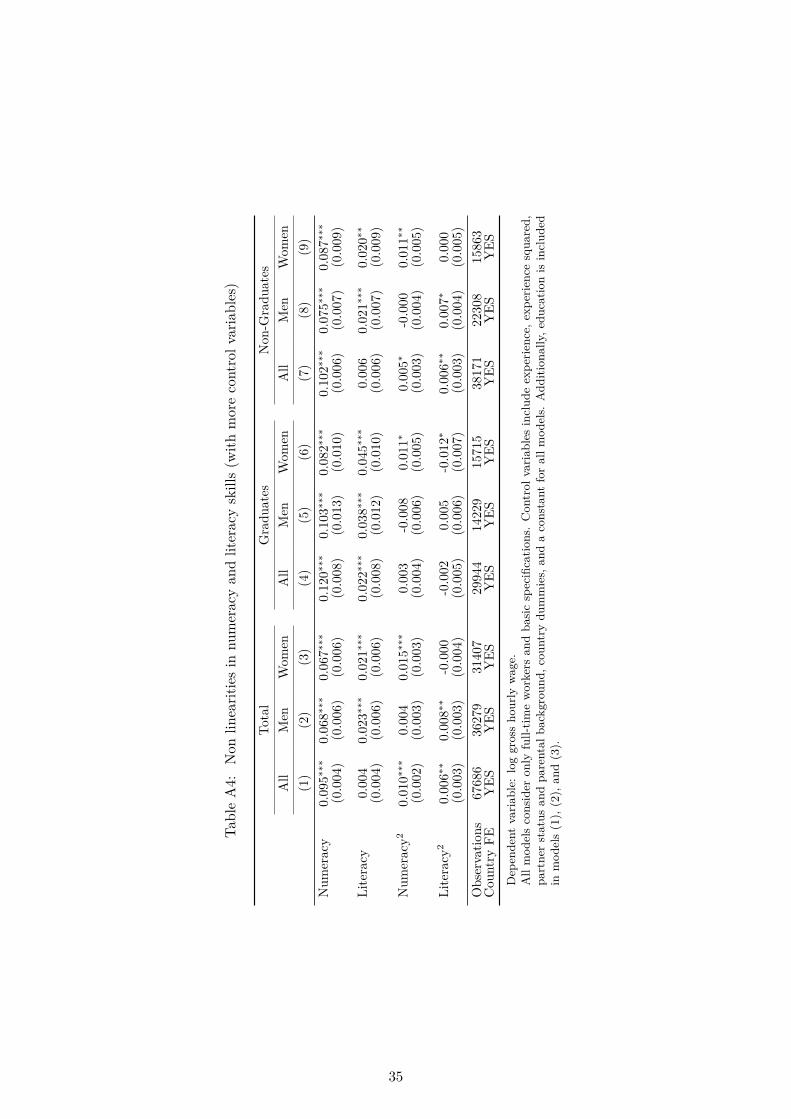
Tabl
eA
4:N
onlin
earit
ies
innu
mer
acy
and
liter
acy
skill
s(w
ithm
ore
cont
rolv
aria
bles
)
Tota
lG
radu
ates
Non
-Gra
duat
esA
llM
enW
omen
All
Men
Wom
enA
llM
enW
omen
(1)
(2)
(3)
(4)
(5)
(6)
(7)
(8)
(9)
Num
erac
y0.
095∗∗
∗0.
068∗∗
∗0.
067∗∗
∗0.
120∗∗
∗0.
103∗∗
∗0.
082∗∗
∗0.
102∗∗
∗0.
075∗∗
∗0.
087∗∗
∗
(0.0
04)
(0.0
06)
(0.0
06)
(0.0
08)
(0.0
13)
(0.0
10)
(0.0
06)
(0.0
07)
(0.0
09)
Lite
racy
0.00
40.
023∗∗
∗0.
021∗∗
∗0.
022∗∗
∗0.
038∗∗
∗0.
045∗∗
∗0.
006
0.02
1∗∗∗
0.02
0∗∗
(0.0
04)
(0.0
06)
(0.0
06)
(0.0
08)
(0.0
12)
(0.0
10)
(0.0
06)
(0.0
07)
(0.0
09)
Num
erac
y20.
010∗∗
∗0.
004
0.01
5∗∗∗
0.00
3-0
.008
0.01
1∗0.
005∗
-0.0
000.
011∗∗
(0.0
02)
(0.0
03)
(0.0
03)
(0.0
04)
(0.0
06)
(0.0
05)
(0.0
03)
(0.0
04)
(0.0
05)
Lite
racy
20.
006∗∗
0.00
8∗∗-0
.000
-0.0
020.
005
-0.0
12∗
0.00
6∗∗0.
007∗
0.00
0(0
.003
)(0
.003
)(0
.004
)(0
.005
)(0
.006
)(0
.007
)(0
.003
)(0
.004
)(0
.005
)O
bser
vatio
ns67
686
3627
931
407
2994
414
229
1571
538
171
2230
815
863
Cou
ntry
FEY
ESY
ESY
ESY
ESY
ESY
ESY
ESY
ESY
ESD
epen
dent
varia
ble:
log
gros
sho
urly
wag
e.A
llm
odel
sco
nsid
eron
lyfu
ll-tim
ew
orke
rsan
dba
sic
spec
ifica
tions
.C
ontr
olva
riabl
esin
clud
eex
perie
nce,
expe
rienc
esq
uare
d,pa
rtne
rst
atus
and
pare
ntal
back
grou
nd,c
ount
rydu
mm
ies,
and
aco
nsta
ntfo
ral
lmod
els.
Add
ition
ally
,edu
catio
nis
incl
uded
inm
odel
s(1
),(2
),an
d(3
).
35
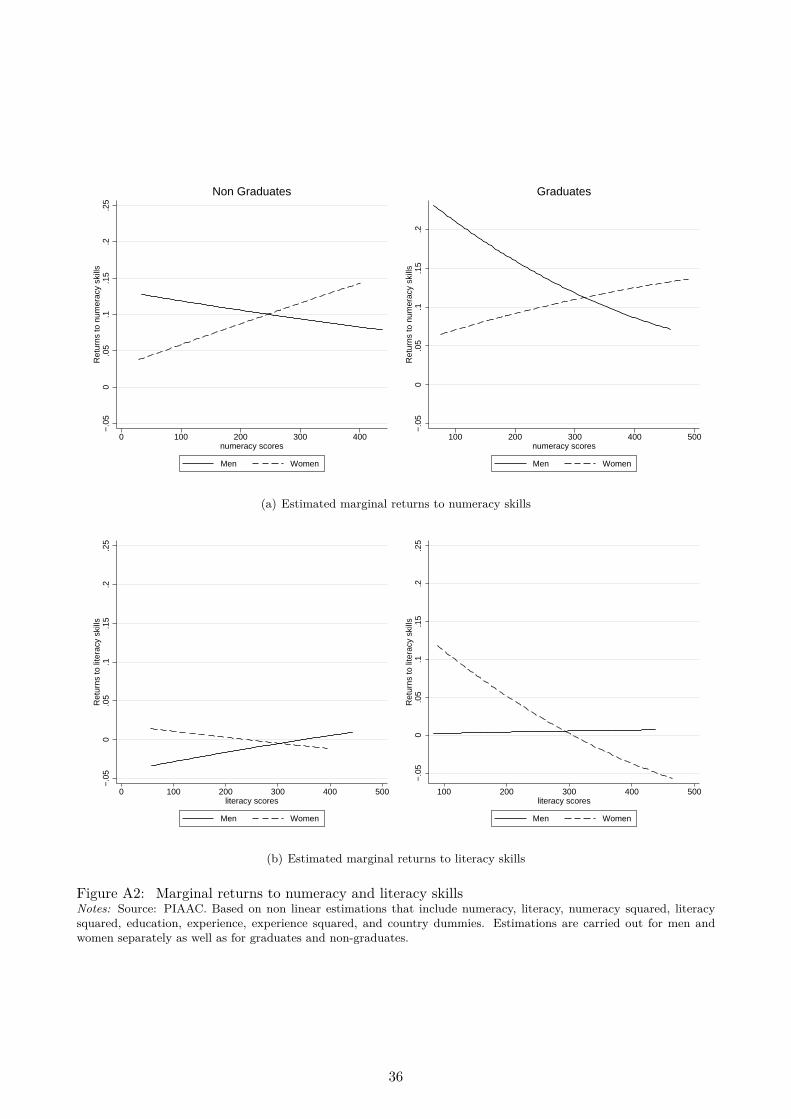
−.0
50
.05
.1.1
5.2
.25
Ret
urns
to n
umer
acy
skill
s
0 100 200 300 400numeracy scores
Men Women
Non Graduates
−.0
50
.05
.1.1
5.2
Ret
urns
to n
umer
acy
skill
s
100 200 300 400 500numeracy scores
Men Women
Graduates
(a) Estimated marginal returns to numeracy skills
−.0
50
.05
.1.1
5.2
.25
Ret
urns
to li
tera
cy s
kills
0 100 200 300 400 500literacy scores
Men Women
−.0
50
.05
.1.1
5.2
.25
Ret
urns
to li
tera
cy s
kills
100 200 300 400 500literacy scores
Men Women
(b) Estimated marginal returns to literacy skills
Figure A2: Marginal returns to numeracy and literacy skillsNotes: Source: PIAAC. Based on non linear estimations that include numeracy, literacy, numeracy squared, literacysquared, education, experience, experience squared, and country dummies. Estimations are carried out for men andwomen separately as well as for graduates and non-graduates.
36
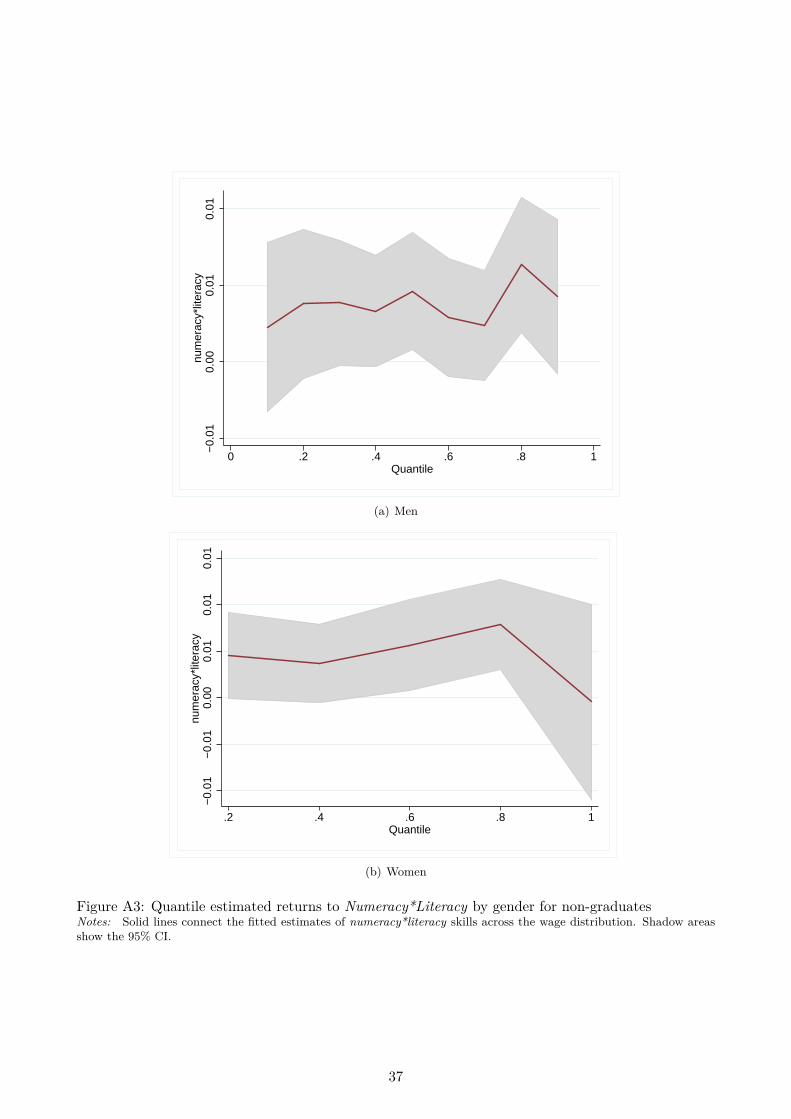
−0.
010.
000.
010.
01nu
mer
acy*
liter
acy
0 .2 .4 .6 .8 1Quantile
(a) Men
−0.
01−
0.01
0.00
0.01
0.01
0.01
num
erac
y*lit
erac
y
.2 .4 .6 .8 1Quantile
(b) Women
Figure A3: Quantile estimated returns to Numeracy*Literacy by gender for non-graduatesNotes: Solid lines connect the fitted estimates of numeracy*literacy skills across the wage distribution. Shadow areasshow the 95% CI.
37
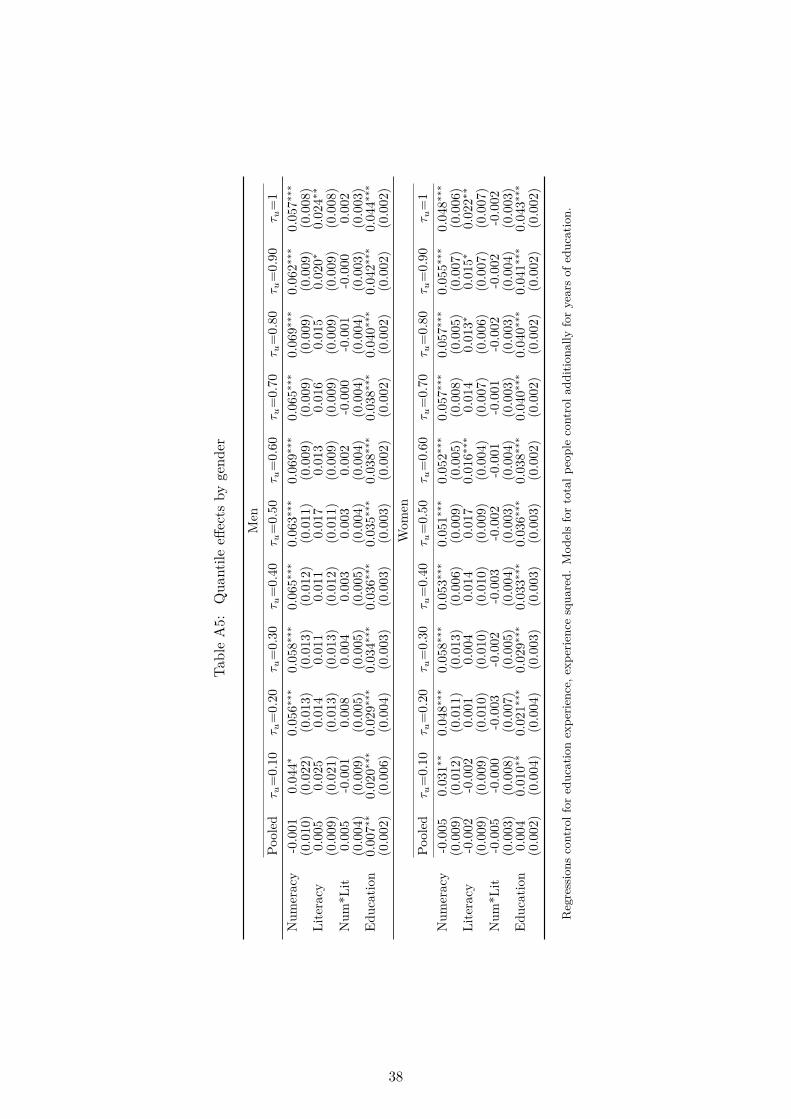
Tabl
eA
5:Q
uant
ileeff
ects
byge
nder
Men
Pool
edτ u
=0.
10τ u
=0.
20τ u
=0.
30τ u
=0.
40τ u
=0.
50τ u
=0.
60τ u
=0.
70τ u
=0.
80τ u
=0.
90τ u
=1
Num
erac
y-0
.001
0.04
4∗0.
056∗∗
∗0.
058∗∗
∗0.
065∗∗
∗0.
063∗∗
∗0.
069∗∗
∗0.
065∗∗
∗0.
069∗∗
∗0.
062∗∗
∗0.
057∗∗
∗
(0.0
10)
(0.0
22)
(0.0
13)
(0.0
13)
(0.0
12)
(0.0
11)
(0.0
09)
(0.0
09)
(0.0
09)
(0.0
09)
(0.0
08)
Lite
racy
0.00
50.
025
0.01
40.
011
0.01
10.
017
0.01
30.
016
0.01
50.
020∗
0.02
4∗∗
(0.0
09)
(0.0
21)
(0.0
13)
(0.0
13)
(0.0
12)
(0.0
11)
(0.0
09)
(0.0
09)
(0.0
09)
(0.0
09)
(0.0
08)
Num
*Lit
0.00
5-0
.001
0.00
80.
004
0.00
30.
003
0.00
2-0
.000
-0.0
01-0
.000
0.00
2(0
.004
)(0
.009
)(0
.005
)(0
.005
)(0
.005
)(0
.004
)(0
.004
)(0
.004
)(0
.004
)(0
.003
)(0
.003
)Ed
ucat
ion
0.00
7∗∗0.
020∗∗
∗0.
029∗∗
∗0.
034∗∗
∗0.
036∗∗
∗0.
035∗∗
∗0.
038∗∗
∗0.
038∗∗
∗0.
040∗∗
∗0.
042∗∗
∗0.
044∗∗
∗
(0.0
02)
(0.0
06)
(0.0
04)
(0.0
03)
(0.0
03)
(0.0
03)
(0.0
02)
(0.0
02)
(0.0
02)
(0.0
02)
(0.0
02)
Wom
enPo
oled
τ u=
0.10
τ u=
0.20
τ u=
0.30
τ u=
0.40
τ u=
0.50
τ u=
0.60
τ u=
0.70
τ u=
0.80
τ u=
0.90
τ u=
1N
umer
acy
-0.0
050.
031∗∗
0.04
8∗∗∗
0.05
8∗∗∗
0.05
3∗∗∗
0.05
1∗∗∗
0.05
2∗∗∗
0.05
7∗∗∗
0.05
7∗∗∗
0.05
5∗∗∗
0.04
8∗∗∗
(0.0
09)
(0.0
12)
(0.0
11)
(0.0
13)
(0.0
06)
(0.0
09)
(0.0
05)
(0.0
08)
(0.0
05)
(0.0
07)
(0.0
06)
Lite
racy
-0.0
02-0
.002
0.00
10.
004
0.01
40.
017
0.01
6∗∗∗
0.01
40.
013∗
0.01
5∗0.
022∗∗
(0.0
09)
(0.0
09)
(0.0
10)
(0.0
10)
(0.0
10)
(0.0
09)
(0.0
04)
(0.0
07)
(0.0
06)
(0.0
07)
(0.0
07)
Num
*Lit
-0.0
05-0
.000
-0.0
03-0
.002
-0.0
03-0
.002
-0.0
01-0
.001
-0.0
02-0
.002
-0.0
02(0
.003
)(0
.008
)(0
.007
)(0
.005
)(0
.004
)(0
.003
)(0
.004
)(0
.003
)(0
.003
)(0
.004
)(0
.003
)Ed
ucat
ion
0.00
40.
010∗∗
0.02
1∗∗∗
0.02
9∗∗∗
0.03
3∗∗∗
0.03
6∗∗∗
0.03
8∗∗∗
0.04
0∗∗∗
0.04
0∗∗∗
0.04
1∗∗∗
0.04
3∗∗∗
(0.0
02)
(0.0
04)
(0.0
04)
(0.0
03)
(0.0
03)
(0.0
03)
(0.0
02)
(0.0
02)
(0.0
02)
(0.0
02)
(0.0
02)
Reg
ress
ions
cont
rolf
ored
ucat
ion
expe
rienc
e,ex
perie
nce
squa
red.
Mod
els
for
tota
lpeo
ple
cont
rola
dditi
onal
lyfo
rye
ars
ofed
ucat
ion.
38
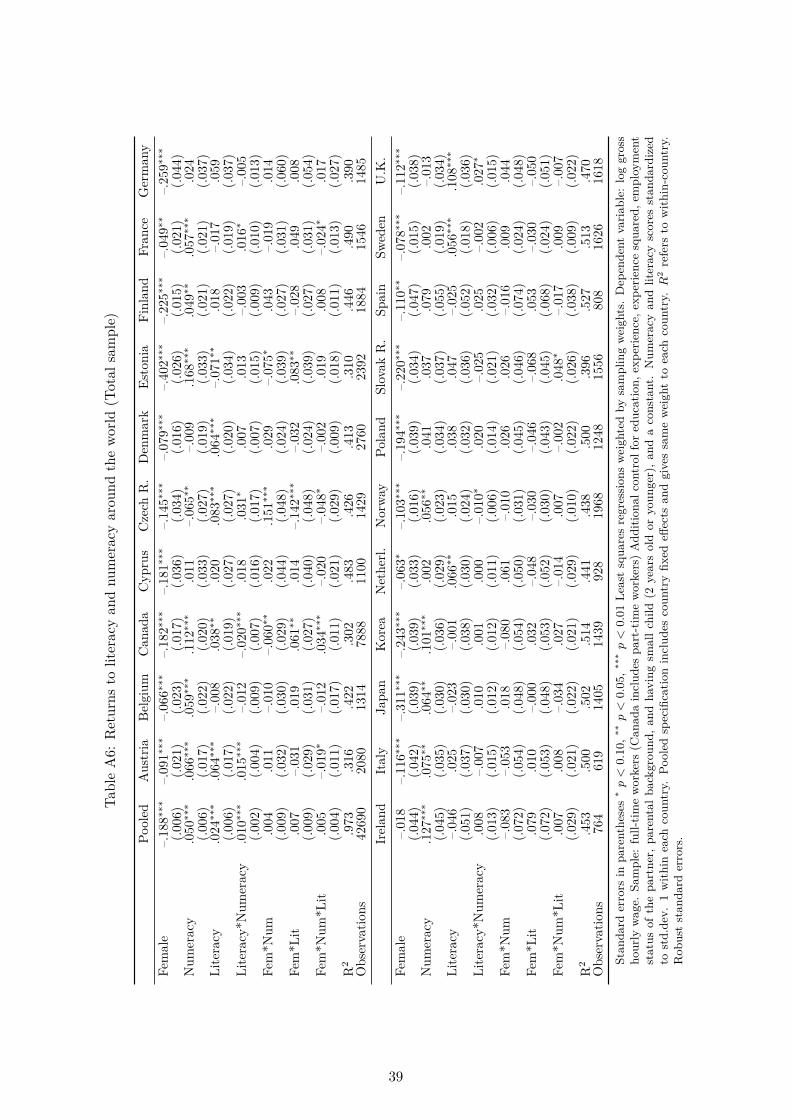
Tabl
eA
6:R
etur
nsto
liter
acy
and
num
erac
yar
ound
the
wor
ld(T
otal
sam
ple)
Pool
edA
ustr
iaB
elgi
umC
anad
aC
ypru
sC
zech
R.
Den
mar
kEs
toni
aFi
nlan
dFr
ance
Ger
man
yFe
mal
e–.
188∗∗
∗–.
091∗∗
∗–.
066∗∗
∗–.
182∗∗
∗–.
181∗∗
∗–.
145∗∗
∗–.
079∗∗
∗–.
402∗∗
∗–.
225∗∗
∗–.
049∗∗
–.25
9∗∗∗
(.006
)(.0
21)
(.023
)(.0
17)
(.036
)(.0
34)
(.016
)(.0
26)
(.015
)(.0
21)
(.044
)N
umer
acy
.050
∗∗∗
.066
∗∗∗
.059
∗∗∗
.112
∗∗∗
.011
–.06
5∗∗–.
009
.168
∗∗∗
.049
∗∗.0
57∗∗
∗.0
24(.0
06)
(.017
)(.0
22)
(.020
)(.0
33)
(.027
)(.0
19)
(.033
)(.0
21)
(.021
)(.0
37)
Lite
racy
.024
∗∗∗
.064
∗∗∗
–.00
8.0
38∗∗
.020
.083
∗∗∗
.064
∗∗∗
–.07
1∗∗.0
18–.
017
.059
(.006
)(.0
17)
(.022
)(.0
19)
(.027
)(.0
27)
(.020
)(.0
34)
(.022
)(.0
19)
(.037
)Li
tera
cy*N
umer
acy
.010
∗∗∗
.015
∗∗∗
–.01
2–.
020∗∗
∗.0
18.0
31∗
.007
.013
–.00
3.0
16∗
–.00
5(.0
02)
(.004
)(.0
09)
(.007
)(.0
16)
(.017
)(.0
07)
(.015
)(.0
09)
(.010
)(.0
13)
Fem
*Num
.004
.011
–.01
0–.
060∗∗
.022
.151
∗∗∗
.029
–.07
5∗.0
43–.
019
.014
(.009
)(.0
32)
(.030
)(.0
29)
(.044
)(.0
48)
(.024
)(.0
39)
(.027
)(.0
31)
(.060
)Fe
m*L
it.0
07–.
031
.019
.061
∗∗.0
14–.
142∗∗
∗–.
032
.083
∗∗–.
028
.049
.008
(.009
)(.0
29)
(.031
)(.0
27)
(.040
)(.0
48)
(.024
)(.0
39)
(.027
)(.0
31)
(.054
)Fe
m*N
um*L
it.0
05–.
019∗
–.01
2.0
34∗∗
∗–.
020
–.04
8∗–.
002
.019
.008
–.02
4∗.0
17(.0
04)
(.011
)(.0
17)
(.011
)(.0
21)
(.029
)(.0
09)
(.018
)(.0
11)
(.013
)(.0
27)
R2
.973
.316
.422
.302
.483
.426
.413
.310
.446
.490
.390
Obs
erva
tions
4269
020
8013
1478
8811
0014
2927
6023
9218
8415
4614
85Ir
elan
dIt
aly
Japa
nK
orea
Net
herl.
Nor
way
Pola
ndSl
ovak
R.
Spai
nSw
eden
U.K
.Fe
mal
e–.
018
–.11
6∗∗∗
–.31
1∗∗∗
–.24
3∗∗∗
–.06
3∗–.
103∗∗
∗–.
194∗∗
∗–.
220∗∗
∗–.
110∗∗
–.07
8∗∗∗
–.11
2∗∗∗
(.044
)(.0
42)
(.039
)(.0
39)
(.033
)(.0
16)
(.039
)(.0
34)
(.047
)(.0
15)
(.038
)N
umer
acy
.127
∗∗∗
.075
∗∗.0
64∗∗
.101
∗∗∗
.002
.056
∗∗.0
41.0
37.0
79.0
02–.
013
(.045
)(.0
35)
(.030
)(.0
36)
(.029
)(.0
23)
(.034
)(.0
37)
(.055
)(.0
19)
(.034
)Li
tera
cy–.
046
.025
–.02
3–.
001
.066
∗∗.0
15.0
38.0
47–.
025
.056
∗∗∗
.108
∗∗∗
(.051
)(.0
37)
(.030
)(.0
38)
(.030
)(.0
24)
(.032
)(.0
36)
(.052
)(.0
18)
(.036
)Li
tera
cy*N
umer
acy
.008
–.00
7.0
10.0
01.0
00–.
010∗
.020
–.02
5.0
25–.
002
.027
∗
(.013
)(.0
15)
(.012
)(.0
12)
(.011
)(.0
06)
(.014
)(.0
21)
(.032
)(.0
06)
(.015
)Fe
m*N
um–.
083
–.05
3.0
18–.
080
.061
–.01
0.0
26.0
26–.
016
.009
.044
(.072
)(.0
54)
(.048
)(.0
54)
(.050
)(.0
31)
(.045
)(.0
46)
(.074
)(.0
24)
(.048
)Fe
m*L
it.0
79.0
10–.
000
.032
–.04
8–.
030
–.04
6–.
068
.053
–.03
0–.
050
(.072
)(.0
53)
(.048
)(.0
53)
(.052
)(.0
30)
(.043
)(.0
45)
(.068
)(.0
24)
(.051
)Fe
m*N
um*L
it.0
07.0
08–.
034
.027
–.01
4.0
07–.
002
.048
∗–.
017
.009
–.00
7(.0
29)
(.021
)(.0
22)
(.021
)(.0
29)
(.010
)(.0
22)
(.026
)(.0
38)
(.009
)(.0
22)
R2
.453
.500
.502
.514
.441
.438
.500
.396
.527
.513
.470
Obs
erva
tions
764
619
1405
1439
928
1968
1248
1556
808
1626
1618
Stan
dard
erro
rsin
pare
nthe
ses
∗p<
0.10
,∗∗p<
0.05
,∗∗∗p<
0.01
Leas
tsq
uare
sre
gres
sion
sw
eigh
ted
bysa
mpl
ing
wei
ghts
.D
epen
dent
varia
ble:
log
gros
sho
urly
wag
e.Sa
mpl
e:fu
ll-tim
ew
orke
rs(C
anad
ain
clud
espa
rt-t
ime
wor
kers
)A
dditi
onal
cont
rolf
ored
ucat
ion,
expe
rienc
e,ex
perie
nce
squa
red,
empl
oym
ent
stat
usof
the
part
ner,
pare
ntal
back
grou
nd,a
ndha
ving
smal
lchi
ld(2
year
sol
dor
youn
ger)
,and
aco
nsta
nt.
Num
erac
yan
dlit
erac
ysc
ores
stan
dard
ized
tost
d.de
v.1
with
inea
chco
untr
y.Po
oled
spec
ifica
tion
incl
udes
coun
try
fixed
effec
tsan
dgi
ves
sam
ew
eigh
tto
each
coun
try.R
2re
fers
tow
ithin
-cou
ntry
.R
obus
tst
anda
rder
rors
.
39
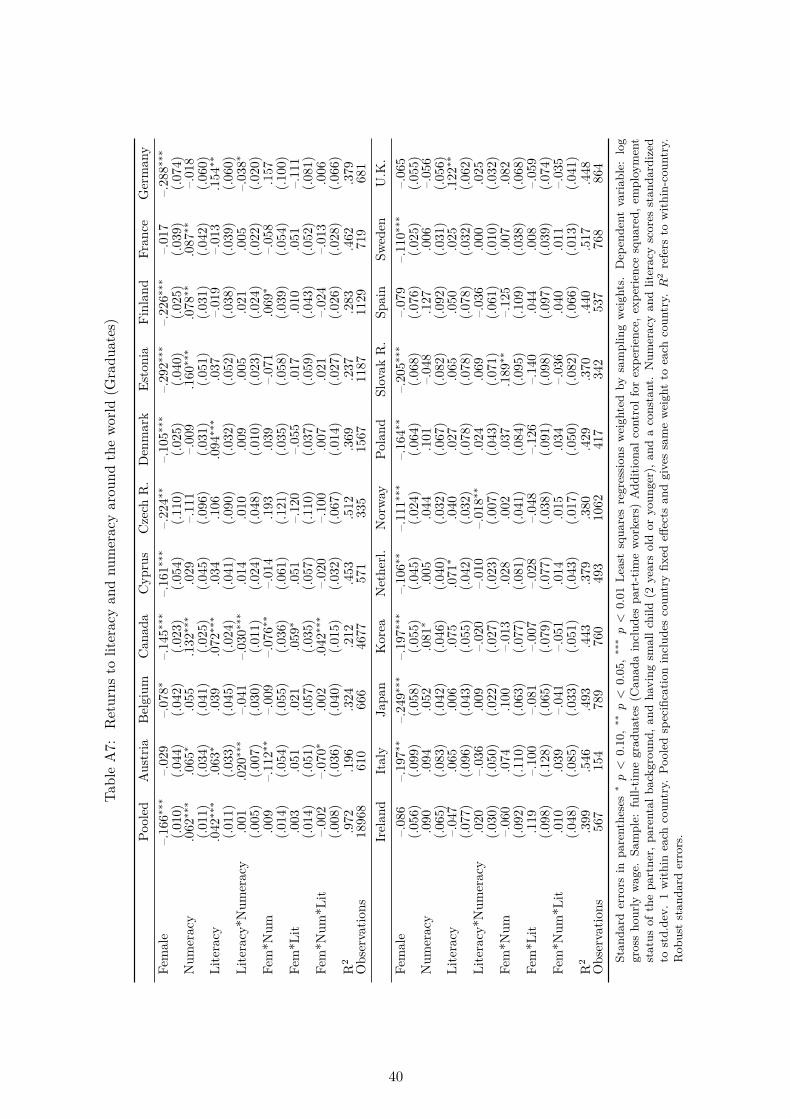
Tabl
eA
7:R
etur
nsto
liter
acy
and
num
erac
yar
ound
the
wor
ld(G
radu
ates
)
Pool
edA
ustr
iaB
elgi
umC
anad
aC
ypru
sC
zech
R.
Den
mar
kEs
toni
aFi
nlan
dFr
ance
Ger
man
yFe
mal
e–.
166∗∗
∗–.
029
–.07
8∗–.
145∗∗
∗–.
161∗∗
∗–.
224∗∗
–.10
5∗∗∗
–.29
2∗∗∗
–.22
6∗∗∗
–.01
7–.
288∗∗
∗
(.010
)(.0
44)
(.042
)(.0
23)
(.054
)(.1
10)
(.025
)(.0
40)
(.025
)(.0
39)
(.074
)N
umer
acy
.062
∗∗∗
.065
∗.0
55.1
32∗∗
∗.0
29–.
111
–.00
9.1
60∗∗
∗.0
78∗∗
.087
∗∗–.
018
(.011
)(.0
34)
(.041
)(.0
25)
(.045
)(.0
96)
(.031
)(.0
51)
(.031
)(.0
42)
(.060
)Li
tera
cy.0
42∗∗
∗.0
63∗
.039
.072
∗∗∗
.034
.106
.094
∗∗∗
.037
–.01
9–.
013
.154
∗∗
(.011
)(.0
33)
(.045
)(.0
24)
(.041
)(.0
90)
(.032
)(.0
52)
(.038
)(.0
39)
(.060
)Li
tera
cy*N
umer
acy
.001
.020
∗∗∗
–.04
1–.
030∗∗
∗.0
14.0
10.0
09.0
05.0
21.0
05–.
038∗
(.005
)(.0
07)
(.030
)(.0
11)
(.024
)(.0
48)
(.010
)(.0
23)
(.024
)(.0
22)
(.020
)Fe
m*N
um.0
09–.
112∗∗
–.00
9–.
076∗∗
–.01
4.1
93.0
39–.
071
.069
∗–.
058
.157
(.014
)(.0
54)
(.055
)(.0
36)
(.061
)(.1
21)
(.035
)(.0
58)
(.039
)(.0
54)
(.100
)Fe
m*L
it.0
03.0
51.0
21.0
59∗
.051
–.12
0–.
055
.017
.010
.051
–.11
1(.0
14)
(.051
)(.0
57)
(.035
)(.0
57)
(.110
)(.0
37)
(.059
)(.0
43)
(.052
)(.0
81)
Fem
*Num
*Lit
–.00
2–.
070∗
.002
.042
∗∗∗
–.02
0–.
100
.007
.021
–.02
4–.
013
.006
(.008
)(.0
36)
(.040
)(.0
15)
(.032
)(.0
67)
(.014
)(.0
27)
(.026
)(.0
28)
(.066
)R
2.9
72.1
96.3
24.2
12.4
53.5
12.3
69.2
37.2
83.4
62.3
79O
bser
vatio
ns18
968
610
666
4677
571
335
1567
1187
1129
719
681
Irel
and
Ital
yJa
pan
Kor
eaN
ethe
rl.N
orw
ayPo
land
Slov
akR
.Sp
ain
Swed
enU
.K.
Fem
ale
–.08
6–.
197∗∗
–.24
9∗∗∗
–.19
7∗∗∗
–.10
6∗∗–.
111∗∗
∗–.
164∗∗
–.20
5∗∗∗
–.07
9–.
110∗∗
∗–.
065
(.056
)(.0
99)
(.058
)(.0
55)
(.045
)(.0
24)
(.064
)(.0
68)
(.076
)(.0
25)
(.055
)N
umer
acy
.090
.094
.052
.081
∗.0
05.0
44.1
01–.
048
.127
.006
–.05
6(.0
65)
(.083
)(.0
42)
(.046
)(.0
40)
(.032
)(.0
67)
(.082
)(.0
92)
(.031
)(.0
56)
Lite
racy
–.04
7.0
65.0
06.0
75.0
71∗
.040
.027
.065
.050
.025
.122
∗∗
(.077
)(.0
96)
(.043
)(.0
55)
(.042
)(.0
32)
(.078
)(.0
78)
(.078
)(.0
32)
(.062
)Li
tera
cy*N
umer
acy
.020
–.03
6.0
09–.
020
–.01
0–.
018∗∗
.024
.069
–.03
6.0
00.0
25(.0
30)
(.050
)(.0
22)
(.027
)(.0
23)
(.007
)(.0
43)
(.071
)(.0
61)
(.010
)(.0
32)
Fem
*Num
–.06
0.0
74.1
00–.
013
.028
.002
.037
.189
∗∗–.
125
.007
.082
(.092
)(.1
10)
(.063
)(.0
77)
(.081
)(.0
41)
(.084
)(.0
95)
(.109
)(.0
38)
(.068
)Fe
m*L
it.1
19–.
100
–.08
1–.
007
–.02
8–.
048
–.12
6–.
140
.044
.008
–.05
9(.0
98)
(.128
)(.0
65)
(.079
)(.0
77)
(.038
)(.0
91)
(.098
)(.0
97)
(.039
)(.0
74)
Fem
*Num
*Lit
.010
.039
–.04
1–.
051
.014
.015
.034
–.03
6.0
40.0
11–.
035
(.048
)(.0
85)
(.033
)(.0
51)
(.043
)(.0
17)
(.050
)(.0
82)
(.066
)(.0
13)
(.041
)R
2.3
99.5
46.4
93.4
43.3
79.3
80.4
29.3
70.4
40.5
17.4
48O
bser
vatio
ns56
715
478
976
049
310
6241
734
253
776
886
4St
anda
rder
rors
inpa
rent
hese
s∗p<
0.10
,∗∗p<
0.05
,∗∗
∗p<
0.01
Leas
tsq
uare
sre
gres
sion
sw
eigh
ted
bysa
mpl
ing
wei
ghts
.D
epen
dent
varia
ble:
log
gros
sho
urly
wag
e.Sa
mpl
e:fu
ll-tim
egr
adua
tes
(Can
ada
incl
udes
part
-tim
ew
orke
rs)
Add
ition
alco
ntro
lfor
expe
rienc
e,ex
perie
nce
squa
red,
empl
oym
ent
stat
usof
the
part
ner,
pare
ntal
back
grou
nd,a
ndha
ving
smal
lchi
ld(2
year
sol
dor
youn
ger)
,and
aco
nsta
nt.
Num
erac
yan
dlit
erac
ysc
ores
stan
dard
ized
tost
d.de
v.1
with
inea
chco
untr
y.Po
oled
spec
ifica
tion
incl
udes
coun
try
fixed
effec
tsan
dgi
ves
sam
ew
eigh
tto
each
coun
try.R
2re
fers
tow
ithin
-cou
ntry
.R
obus
tst
anda
rder
rors
.
40
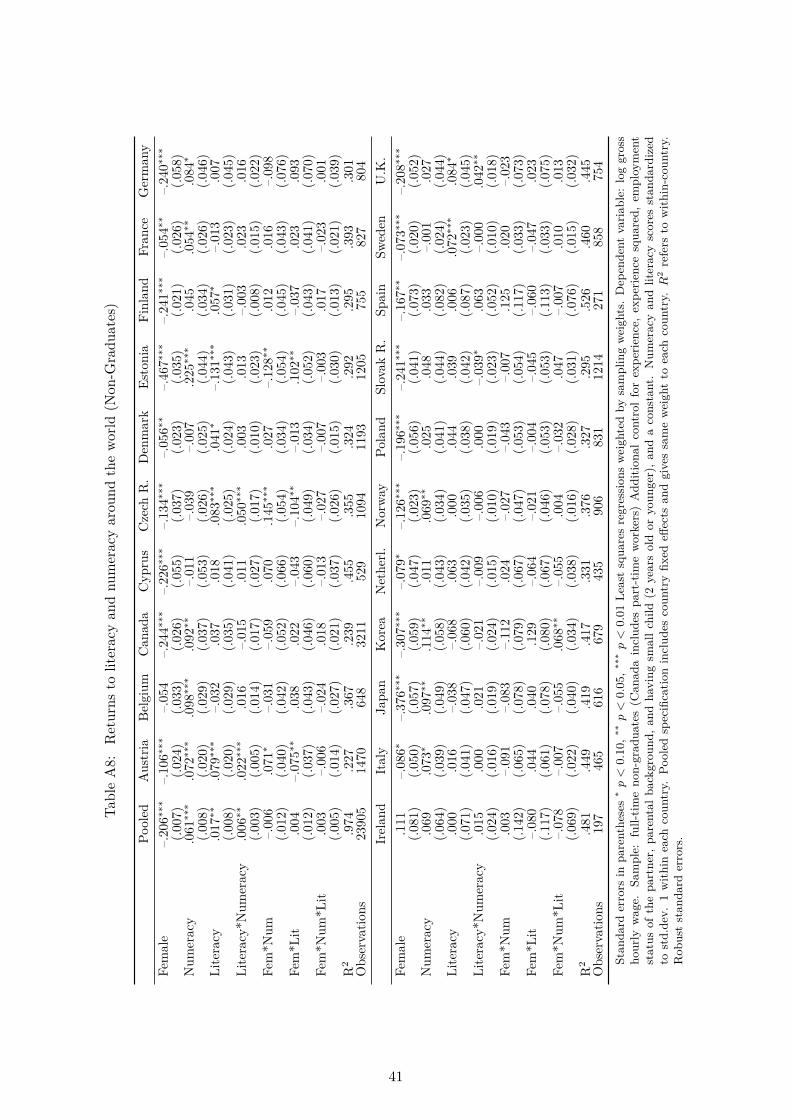
Tabl
eA
8:R
etur
nsto
liter
acy
and
num
erac
yar
ound
the
wor
ld(N
on-G
radu
ates
)
Pool
edA
ustr
iaB
elgi
umC
anad
aC
ypru
sC
zech
R.
Den
mar
kEs
toni
aFi
nlan
dFr
ance
Ger
man
yFe
mal
e–.
206∗∗
∗–.
106∗∗
∗–.
054
–.24
4∗∗∗
–.22
6∗∗∗
–.13
4∗∗∗
–.05
6∗∗–.
467∗∗
∗–.
241∗∗
∗–.
054∗∗
–.24
0∗∗∗
(.007
)(.0
24)
(.033
)(.0
26)
(.055
)(.0
37)
(.023
)(.0
35)
(.021
)(.0
26)
(.058
)N
umer
acy
.061
∗∗∗
.072
∗∗∗
.098
∗∗∗
.092
∗∗–.
011
–.03
9–.
007
.225
∗∗∗
.045
.054
∗∗.0
84∗
(.008
)(.0
20)
(.029
)(.0
37)
(.053
)(.0
26)
(.025
)(.0
44)
(.034
)(.0
26)
(.046
)Li
tera
cy.0
17∗∗
.079
∗∗∗
–.03
2.0
37.0
18.0
83∗∗
∗.0
41∗
–.13
1∗∗∗
.057
∗–.
013
.007
(.008
)(.0
20)
(.029
)(.0
35)
(.041
)(.0
25)
(.024
)(.0
43)
(.031
)(.0
23)
(.045
)Li
tera
cy*N
umer
acy
.006
∗∗.0
22∗∗
∗.0
16–.
015
.011
.050
∗∗∗
.003
.013
–.00
3.0
23.0
16(.0
03)
(.005
)(.0
14)
(.017
)(.0
27)
(.017
)(.0
10)
(.023
)(.0
08)
(.015
)(.0
22)
Fem
*Num
–.00
6.0
71∗
–.03
1–.
059
.070
.145
∗∗∗
.027
–.12
8∗∗.0
12.0
16–.
098
(.012
)(.0
40)
(.042
)(.0
52)
(.066
)(.0
54)
(.034
)(.0
54)
(.045
)(.0
43)
(.076
)Fe
m*L
it.0
04–.
075∗∗
.038
.022
–.04
3–.
104∗∗
–.01
3.1
02∗∗
–.03
7.0
23.0
93(.0
12)
(.037
)(.0
43)
(.046
)(.0
60)
(.049
)(.0
34)
(.052
)(.0
43)
(.041
)(.0
70)
Fem
*Num
*Lit
.003
–.00
6–.
024
.018
–.01
3–.
027
–.00
7–.
003
.017
–.02
3.0
01(.0
05)
(.014
)(.0
27)
(.021
)(.0
37)
(.026
)(.0
15)
(.030
)(.0
13)
(.021
)(.0
39)
R2
.974
.227
.367
.239
.455
.355
.324
.292
.295
.393
.301
Obs
erva
tions
2390
514
7064
832
1152
910
9411
9312
0575
582
780
4Ir
elan
dIt
aly
Japa
nK
orea
Net
herl.
Nor
way
Pola
ndSl
ovak
R.
Spai
nSw
eden
U.K
.Fe
mal
e.1
11–.
086∗
–.37
6∗∗∗
–.30
7∗∗∗
–.07
9∗–.
126∗∗
∗–.
196∗∗
∗–.
241∗∗
∗–.
167∗∗
–.07
3∗∗∗
–.20
8∗∗∗
(.081
)(.0
50)
(.057
)(.0
59)
(.047
)(.0
23)
(.056
)(.0
41)
(.073
)(.0
20)
(.052
)N
umer
acy
.069
.073
∗.0
97∗∗
.114
∗∗.0
11.0
69∗∗
.025
.048
.033
–.00
1.0
27(.0
64)
(.039
)(.0
49)
(.058
)(.0
43)
(.034
)(.0
41)
(.044
)(.0
82)
(.024
)(.0
44)
Lite
racy
.000
.016
–.03
8–.
068
.063
.000
.044
.039
.006
.072
∗∗∗
.084
∗
(.071
)(.0
41)
(.047
)(.0
60)
(.042
)(.0
35)
(.038
)(.0
42)
(.087
)(.0
23)
(.045
)Li
tera
cy*N
umer
acy
.015
.000
.021
–.02
1–.
009
–.00
6.0
00–.
039∗
.063
–.00
0.0
42∗∗
(.024
)(.0
16)
(.019
)(.0
24)
(.015
)(.0
10)
(.019
)(.0
23)
(.052
)(.0
10)
(.018
)Fe
m*N
um.0
03–.
091
–.08
3–.
112
.024
–.02
7–.
043
–.00
7.1
25.0
20–.
023
(.142
)(.0
65)
(.078
)(.0
79)
(.067
)(.0
47)
(.053
)(.0
54)
(.117
)(.0
33)
(.073
)Fe
m*L
it–.
080
.044
.040
.129
–.06
4–.
021
–.00
4–.
045
–.06
0–.
047
.023
(.117
)(.0
61)
(.078
)(.0
80)
(.067
)(.0
46)
(.053
)(.0
53)
(.113
)(.0
33)
(.075
)Fe
m*N
um*L
it–.
078
–.00
7–.
055
.068
∗∗–.
055
.004
–.03
2.0
47–.
007
.010
.013
(.069
)(.0
22)
(.040
)(.0
34)
(.038
)(.0
16)
(.028
)(.0
31)
(.076
)(.0
15)
(.032
)R
2.4
81.4
49.4
19.4
17.3
31.3
76.3
27.2
95.5
26.4
60.4
45O
bser
vatio
ns19
746
561
667
943
590
683
112
1427
185
875
4St
anda
rder
rors
inpa
rent
hese
s∗p<
0.10
,∗∗p<
0.05
,∗∗∗p<
0.01
Leas
tsq
uare
sre
gres
sion
sw
eigh
ted
bysa
mpl
ing
wei
ghts
.D
epen
dent
varia
ble:
log
gros
sho
urly
wag
e.Sa
mpl
e:fu
ll-tim
eno
n-gr
adua
tes
(Can
ada
incl
udes
part
-tim
ew
orke
rs)
Add
ition
alco
ntro
lfo
rex
perie
nce,
expe
rienc
esq
uare
d,em
ploy
men
tst
atus
ofth
epa
rtne
r,pa
rent
alba
ckgr
ound
,and
havi
ngsm
allc
hild
(2ye
ars
old
oryo
unge
r),a
nda
cons
tant
.N
umer
acy
and
liter
acy
scor
esst
anda
rdiz
edto
std.
dev.
1w
ithin
each
coun
try.
Pool
edsp
ecifi
catio
nin
clud
esco
untr
yfix
edeff
ects
and
give
ssa
me
wei
ght
toea
chco
untr
y.R
2re
fers
tow
ithin
-cou
ntry
.R
obus
tst
anda
rder
rors
.
41
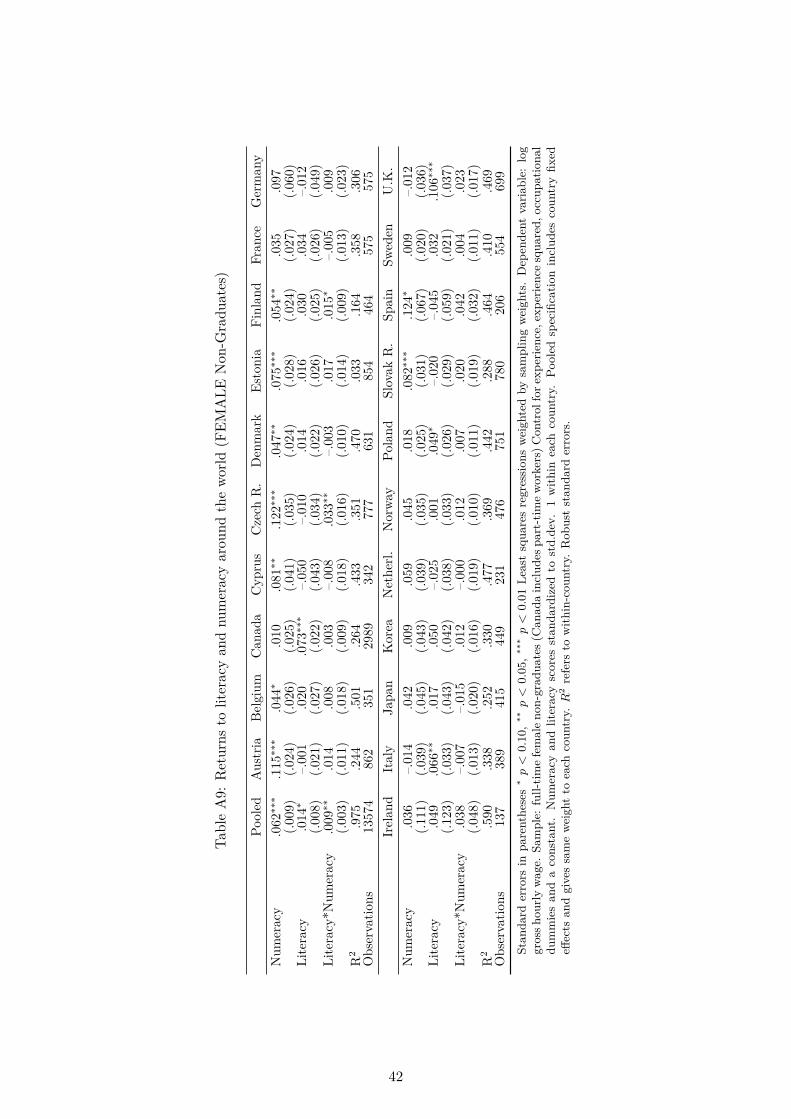
Tabl
eA
9:R
etur
nsto
liter
acy
and
num
erac
yar
ound
the
wor
ld(F
EMA
LEN
on-G
radu
ates
)
Pool
edA
ustr
iaB
elgi
umC
anad
aC
ypru
sC
zech
R.
Den
mar
kEs
toni
aFi
nlan
dFr
ance
Ger
man
yN
umer
acy
.062
∗∗∗
.115
∗∗∗
.044
∗.0
10.0
81∗∗
.122
∗∗∗
.047
∗∗.0
75∗∗
∗.0
54∗∗
.035
.097
(.009
)(.0
24)
(.026
)(.0
25)
(.041
)(.0
35)
(.024
)(.0
28)
(.024
)(.0
27)
(.060
)Li
tera
cy.0
14∗
–.00
1.0
20.0
73∗∗
∗–.
050
–.01
0.0
14.0
16.0
30.0
34–.
012
(.008
)(.0
21)
(.027
)(.0
22)
(.043
)(.0
34)
(.022
)(.0
26)
(.025
)(.0
26)
(.049
)Li
tera
cy*N
umer
acy
.009
∗∗.0
14.0
08.0
03–.
008
.033
∗∗–.
003
.017
.015
∗–.
005
.009
(.003
)(.0
11)
(.018
)(.0
09)
(.018
)(.0
16)
(.010
)(.0
14)
(.009
)(.0
13)
(.023
)R
2.9
75.2
44.5
01.2
64.4
33.3
51.4
70.0
33.1
64.3
58.3
06O
bser
vatio
ns13
574
862
351
2989
342
777
631
854
464
575
575
Irel
and
Ital
yJa
pan
Kor
eaN
ethe
rl.N
orw
ayPo
land
Slov
akR
.Sp
ain
Swed
enU
.K.
Num
erac
y.0
36–.
014
.042
.009
.059
.045
.018
.082
∗∗∗
.124
∗.0
09–.
012
(.111
)(.0
39)
(.045
)(.0
43)
(.039
)(.0
35)
(.025
)(.0
31)
(.067
)(.0
20)
(.036
)Li
tera
cy.0
49.0
66∗∗
.017
.050
–.02
5.0
01.0
49∗
–.02
0–.
045
.032
.106
∗∗∗
(.123
)(.0
33)
(.043
)(.0
42)
(.038
)(.0
33)
(.026
)(.0
29)
(.059
)(.0
21)
(.037
)Li
tera
cy*N
umer
acy
.038
–.00
7–.
015
.012
–.00
0.0
12.0
07.0
20.0
42.0
04.0
23(.0
48)
(.013
)(.0
20)
(.016
)(.0
19)
(.010
)(.0
11)
(.019
)(.0
32)
(.011
)(.0
17)
R2
.590
.338
.252
.330
.477
.369
.442
.288
.464
.410
.469
Obs
erva
tions
137
389
415
449
231
476
751
780
206
554
699
Stan
dard
erro
rsin
pare
nthe
ses
∗p<
0.10
,∗∗p<
0.05
,∗∗∗p<
0.01
Leas
tsq
uare
sre
gres
sion
sw
eigh
ted
bysa
mpl
ing
wei
ghts
.D
epen
dent
varia
ble:
log
gros
shou
rlyw
age.
Sam
ple:
full-
time
fem
ale
non-
grad
uate
s(C
anad
ain
clud
espa
rt-t
ime
wor
kers
)Con
trol
fore
xper
ienc
e,ex
perie
nce
squa
red,
occu
patio
nal
dum
mie
san
da
cons
tant
.N
umer
acy
and
liter
acy
scor
esst
anda
rdiz
edto
std.
dev.
1w
ithin
each
coun
try.
Pool
edsp
ecifi
catio
nin
clud
esco
untr
yfix
edeff
ects
and
give
ssa
me
wei
ght
toea
chco
untr
y.R
2re
fers
tow
ithin
-cou
ntry
.R
obus
tst
anda
rder
rors
.
42
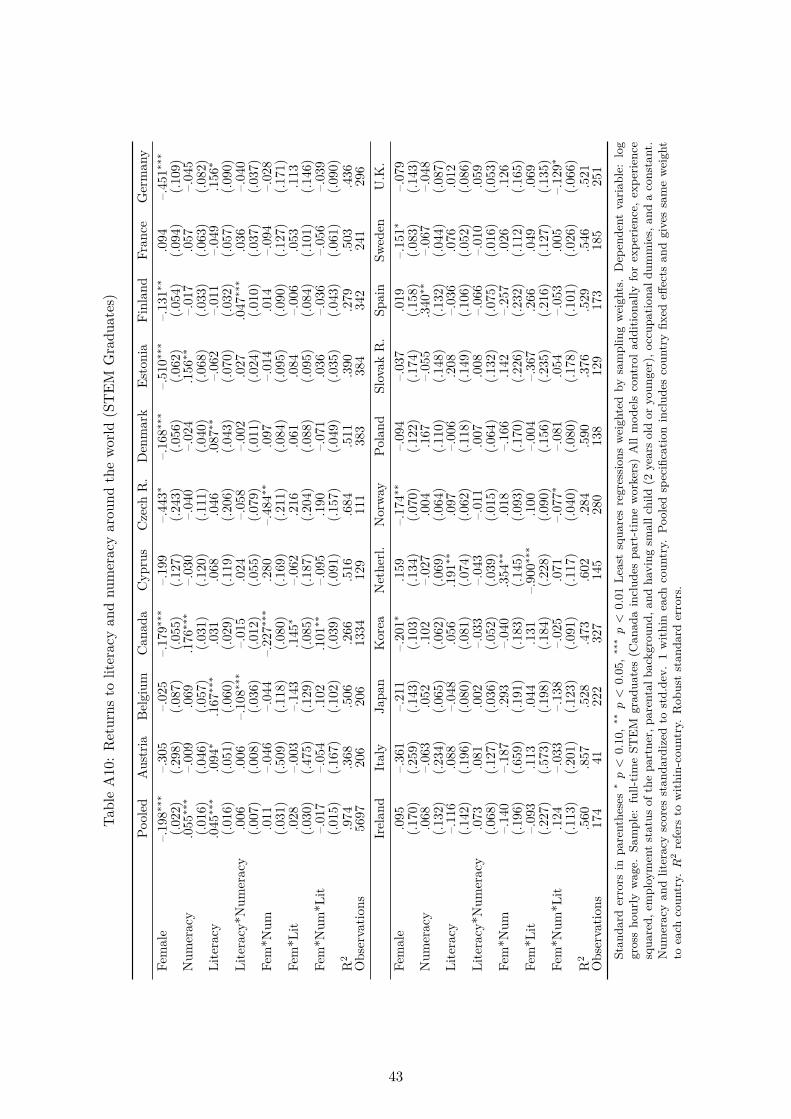
Tabl
eA
10:
Ret
urns
tolit
erac
yan
dnu
mer
acy
arou
ndth
ew
orld
(ST
EMG
radu
ates
)
Pool
edA
ustr
iaB
elgi
umC
anad
aC
ypru
sC
zech
R.
Den
mar
kEs
toni
aFi
nlan
dFr
ance
Ger
man
yFe
mal
e–.
198∗∗
∗–.
305
–.02
5–.
179∗∗
∗–.
199
–.44
3∗–.
168∗∗
∗–.
510∗∗
∗–.
131∗∗
.094
–.45
1∗∗∗
(.022
)(.2
98)
(.087
)(.0
55)
(.127
)(.2
43)
(.056
)(.0
62)
(.054
)(.0
94)
(.109
)N
umer
acy
.055
∗∗∗
–.00
9.0
69.1
76∗∗
∗–.
030
–.04
0–.
024
.156
∗∗–.
017
.057
–.04
5(.0
16)
(.046
)(.0
57)
(.031
)(.1
20)
(.111
)(.0
40)
(.068
)(.0
33)
(.063
)(.0
82)
Lite
racy
.045
∗∗∗
.094
∗.1
67∗∗
∗.0
31.0
68.0
46.0
87∗∗
–.06
2–.
011
–.04
9.1
56∗
(.016
)(.0
51)
(.060
)(.0
29)
(.119
)(.2
06)
(.043
)(.0
70)
(.032
)(.0
57)
(.090
)Li
tera
cy*N
umer
acy
.006
.006
–.10
8∗∗∗
–.01
5.0
24–.
058
–.00
2.0
27.0
47∗∗
∗.0
36–.
040
(.007
)(.0
08)
(.036
)(.0
12)
(.055
)(.0
79)
(.011
)(.0
24)
(.010
)(.0
37)
(.037
)Fe
m*N
um.0
11–.
046
–.04
4–.
227∗∗
∗.2
80–.
484∗∗
.097
–.01
4.0
14–.
094
–.02
8(.0
31)
(.509
)(.1
18)
(.080
)(.1
69)
(.211
)(.0
84)
(.095
)(.0
90)
(.127
)(.1
71)
Fem
*Lit
.028
–.00
3–.
143
.145
∗–.
062
.216
.061
.084
–.00
6.0
53.1
13(.0
30)
(.475
)(.1
29)
(.085
)(.1
87)
(.204
)(.0
88)
(.095
)(.0
84)
(.101
)(.1
46)
Fem
*Num
*Lit
–.01
7–.
054
.102
.101
∗∗–.
095
.190
–.07
1.0
36–.
036
–.05
6–.
039
(.015
)(.1
67)
(.102
)(.0
39)
(.091
)(.1
57)
(.049
)(.0
35)
(.043
)(.0
61)
(.090
)R
2.9
74.3
68.5
06.2
66.5
16.6
84.5
11.3
90.2
79.5
03.4
36O
bser
vatio
ns56
9720
620
613
3412
911
138
338
434
224
129
6Ir
elan
dIt
aly
Japa
nK
orea
Net
herl.
Nor
way
Pola
ndSl
ovak
R.
Spai
nSw
eden
U.K
.Fe
mal
e.0
95–.
361
–.21
1–.
201∗
.159
–.17
4∗∗–.
094
–.03
7.0
19–.
151∗
–.07
9(.1
70)
(.259
)(.1
43)
(.103
)(.1
34)
(.070
)(.1
22)
(.174
)(.1
58)
(.083
)(.1
43)
Num
erac
y.0
68–.
063
.052
.102
–.02
7.0
04.1
67–.
055
.340
∗∗–.
067
–.04
8(.1
32)
(.234
)(.0
65)
(.062
)(.0
69)
(.064
)(.1
10)
(.148
)(.1
32)
(.044
)(.0
87)
Lite
racy
–.11
6.0
88–.
048
.056
.191
∗∗.0
97–.
006
.208
–.03
6.0
76.0
12(.1
42)
(.196
)(.0
80)
(.081
)(.0
74)
(.062
)(.1
18)
(.149
)(.1
06)
(.052
)(.0
86)
Lite
racy
*Num
erac
y.0
73.0
81.0
02–.
033
–.04
3–.
011
.007
.008
–.06
6–.
010
.059
(.068
)(.1
27)
(.036
)(.0
52)
(.039
)(.0
15)
(.064
)(.1
32)
(.075
)(.0
16)
(.053
)Fe
m*N
um–.
140
–.18
7.2
93–.
040
.354
∗∗.0
18–.
166
.142
–.25
7.0
26.1
26(.1
96)
(.659
)(.1
91)
(.183
)(.1
45)
(.093
)(.1
70)
(.226
)(.2
32)
(.112
)(.1
65)
Fem
*Lit
–.09
3.1
13.0
44.1
31–.
900∗∗
∗.1
00–.
004
–.36
7.2
66.0
49.0
69(.2
27)
(.573
)(.1
98)
(.184
)(.2
28)
(.090
)(.1
56)
(.235
)(.2
16)
(.127
)(.1
35)
Fem
*Num
*Lit
.124
–.03
3–.
138
–.02
5.0
71–.
077∗
–.08
1.0
54–.
053
.005
–.12
9∗
(.113
)(.2
01)
(.123
)(.0
91)
(.117
)(.0
40)
(.080
)(.1
78)
(.101
)(.0
26)
(.066
)R
2.5
60.8
57.5
28.4
73.6
02.2
84.5
90.3
76.5
29.5
46.5
21O
bser
vatio
ns17
441
222
327
145
280
138
129
173
185
251
Stan
dard
erro
rsin
pare
nthe
ses
∗p<
0.10
,∗∗p<
0.05
,∗∗∗p<
0.01
Leas
tsq
uare
sre
gres
sion
sw
eigh
ted
bysa
mpl
ing
wei
ghts
.D
epen
dent
varia
ble:
log
gros
sho
urly
wag
e.Sa
mpl
e:fu
ll-tim
eST
EM
grad
uate
s(C
anad
ain
clud
espa
rt-t
ime
wor
kers
)A
llm
odel
sco
ntro
ladd
ition
ally
for
expe
rienc
e,ex
perie
nce
squa
red,
empl
oym
ent
stat
usof
the
part
ner,
pare
ntal
back
grou
nd,a
ndha
ving
smal
lchi
ld(2
year
sol
dor
youn
ger)
,occ
upat
iona
ldum
mie
s,an
da
cons
tant
.N
umer
acy
and
liter
acy
scor
esst
anda
rdiz
edto
std.
dev.
1w
ithin
each
coun
try.
Pool
edsp
ecifi
catio
nin
clud
esco
untr
yfix
edeff
ects
and
give
ssa
me
wei
ght
toea
chco
untr
y.R
2re
fers
tow
ithin
-cou
ntry
.R
obus
tst
anda
rder
rors
.
43
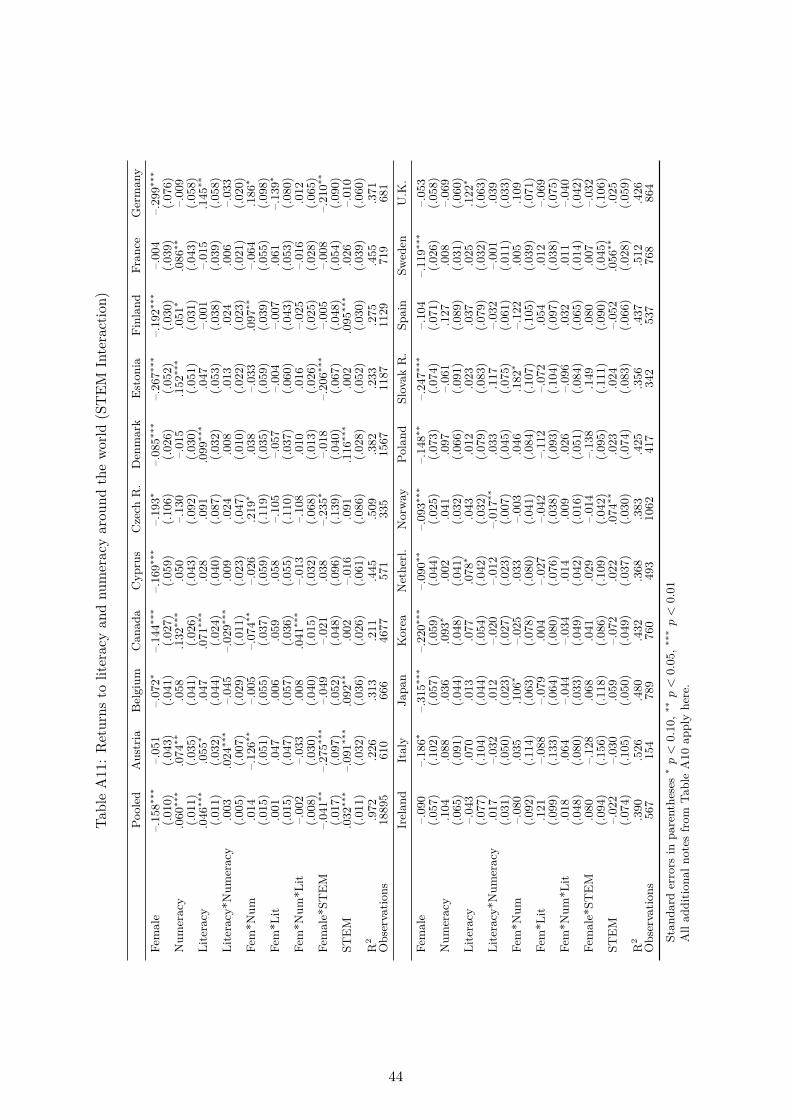
Tabl
eA
11:
Ret
urns
tolit
erac
yan
dnu
mer
acy
arou
ndth
ew
orld
(ST
EMIn
tera
ctio
n)
Pool
edA
ustr
iaB
elgi
umC
anad
aC
ypru
sC
zech
R.
Den
mar
kE
ston
iaFi
nlan
dFr
ance
Ger
man
yFe
mal
e–.
158∗∗
∗–.
051
–.07
2∗–.
144∗∗
∗–.
169∗∗
∗–.
193∗
–.08
5∗∗∗
–.26
7∗∗∗
–.19
2∗∗∗
–.00
4–.
299∗∗
∗
(.010
)(.0
43)
(.041
)(.0
27)
(.059
)(.1
06)
(.026
)(.0
52)
(.030
)(.0
39)
(.076
)N
umer
acy
.060
∗∗∗
.074
∗∗.0
58.1
32∗∗
∗.0
50–.
130
–.01
5.1
52∗∗
∗.0
51∗
.086
∗∗–.
009
(.011
)(.0
35)
(.041
)(.0
26)
(.043
)(.0
92)
(.030
)(.0
51)
(.031
)(.0
43)
(.058
)Li
tera
cy.0
46∗∗
∗.0
55∗
.047
.071
∗∗∗
.028
.091
.099
∗∗∗
.047
–.00
1–.
015
.145
∗∗
(.011
)(.0
32)
(.044
)(.0
24)
(.040
)(.0
87)
(.032
)(.0
53)
(.038
)(.0
39)
(.058
)Li
tera
cy*N
umer
acy
.003
.024
∗∗∗
–.04
5–.
029∗∗
∗.0
09.0
24.0
08.0
13.0
24.0
06–.
033
(.005
)(.0
07)
(.029
)(.0
11)
(.023
)(.0
47)
(.010
)(.0
22)
(.023
)(.0
21)
(.020
)Fe
m*N
um.0
14–.
126∗∗
–.00
5–.
074∗∗
–.02
6.2
19∗
.038
–.03
3.0
97∗∗
–.06
4.1
86∗
(.015
)(.0
51)
(.055
)(.0
37)
(.059
)(.1
19)
(.035
)(.0
59)
(.039
)(.0
55)
(.098
)Fe
m*L
it.0
01.0
47.0
06.0
59.0
58–.
105
–.05
7–.
004
–.00
7.0
61–.
139∗
(.015
)(.0
47)
(.057
)(.0
36)
(.055
)(.1
10)
(.037
)(.0
60)
(.043
)(.0
53)
(.080
)Fe
m*N
um*L
it–.
002
–.03
3.0
08.0
41∗∗
∗–.
013
–.10
8.0
10.0
16–.
025
–.01
6.0
12(.0
08)
(.030
)(.0
40)
(.015
)(.0
32)
(.068
)(.0
13)
(.026
)(.0
25)
(.028
)(.0
65)
Fem
ale*
STE
M–.
041∗∗
–.27
5∗∗∗
–.04
9–.
021
.038
–.23
5∗–.
018
–.20
6∗∗∗
–.00
5–.
008
–.21
0∗∗
(.017
)(.0
97)
(.052
)(.0
48)
(.096
)(.1
39)
(.040
)(.0
67)
(.048
)(.0
54)
(.090
)ST
EM
.032
∗∗∗
–.09
1∗∗∗
.092
∗∗.0
02–.
016
.091
.116
∗∗∗
.002
.095
∗∗∗
.026
–.01
0(.0
11)
(.032
)(.0
36)
(.026
)(.0
61)
(.086
)(.0
28)
(.052
)(.0
30)
(.039
)(.0
60)
R2
.972
.226
.313
.211
.445
.509
.382
.233
.275
.455
.371
Obs
erva
tions
1889
561
066
646
7757
133
515
6711
8711
2971
968
1Ir
elan
dIt
aly
Japa
nK
orea
Net
herl.
Nor
way
Pola
ndSl
ovak
R.
Spai
nSw
eden
U.K
.Fe
mal
e–.
090
–.18
6∗–.
315∗∗
∗–.
220∗∗
∗–.
090∗∗
–.09
3∗∗∗
–.14
8∗∗–.
247∗∗
∗–.
104
–.11
9∗∗∗
–.05
3(.0
57)
(.102
)(.0
57)
(.059
)(.0
44)
(.025
)(.0
73)
(.074
)(.0
71)
(.026
)(.0
58)
Num
erac
y.1
04.0
88.0
36.0
93∗
.002
.041
.097
–.06
1.1
27.0
08–.
069
(.065
)(.0
91)
(.044
)(.0
48)
(.041
)(.0
32)
(.066
)(.0
91)
(.089
)(.0
31)
(.060
)Li
tera
cy–.
043
.070
.013
.077
.078
∗.0
43.0
12.0
23.0
37.0
25.1
22∗
(.077
)(.1
04)
(.044
)(.0
54)
(.042
)(.0
32)
(.079
)(.0
83)
(.079
)(.0
32)
(.063
)Li
tera
cy*N
umer
acy
.017
–.03
2.0
12–.
020
–.01
2–.
017∗∗
.033
.117
–.03
2–.
001
.039
(.031
)(.0
50)
(.023
)(.0
27)
(.023
)(.0
07)
(.045
)(.0
75)
(.061
)(.0
11)
(.033
)Fe
m*N
um–.
080
.035
.106
∗–.
025
.033
–.00
3.0
46.1
82∗
–.12
2.0
05.1
09(.0
92)
(.114
)(.0
63)
(.078
)(.0
80)
(.041
)(.0
84)
(.107
)(.1
05)
(.039
)(.0
71)
Fem
*Lit
.121
–.08
8–.
079
.004
–.02
7–.
042
–.11
2–.
072
.054
.012
–.06
9(.0
99)
(.133
)(.0
64)
(.080
)(.0
76)
(.038
)(.0
93)
(.104
)(.0
97)
(.038
)(.0
75)
Fem
*Num
*Lit
.018
.064
–.04
4–.
034
.014
.009
.026
–.09
6.0
32.0
11–.
040
(.048
)(.0
80)
(.033
)(.0
49)
(.042
)(.0
16)
(.051
)(.0
84)
(.065
)(.0
14)
(.042
)Fe
mal
e*ST
EM
.080
–.12
8.0
68.0
41.0
29–.
014
–.13
8.1
49.0
80.0
07–.
032
(.094
)(.1
56)
(.118
)(.0
86)
(.109
)(.0
42)
(.095
)(.1
11)
(.090
)(.0
45)
(.106
)ST
EM
–.02
2–.
030
.059
–.07
2.0
22.0
74∗∗
.023
.024
–.05
2.0
56∗∗
.025
(.074
)(.1
05)
(.050
)(.0
49)
(.037
)(.0
30)
(.074
)(.0
83)
(.066
)(.0
28)
(.059
)R
2.3
90.5
26.4
80.4
32.3
68.3
83.4
25.3
56.4
37.5
12.4
26O
bser
vatio
ns56
715
478
976
049
310
6241
734
253
776
886
4
Stan
dard
erro
rsin
pare
nthe
ses
∗p<
0.10
,∗∗p<
0.05
,∗∗∗p<
0.01
All
addi
tiona
lnot
esfr
omTa
ble
A10
appl
yhe
re.
44
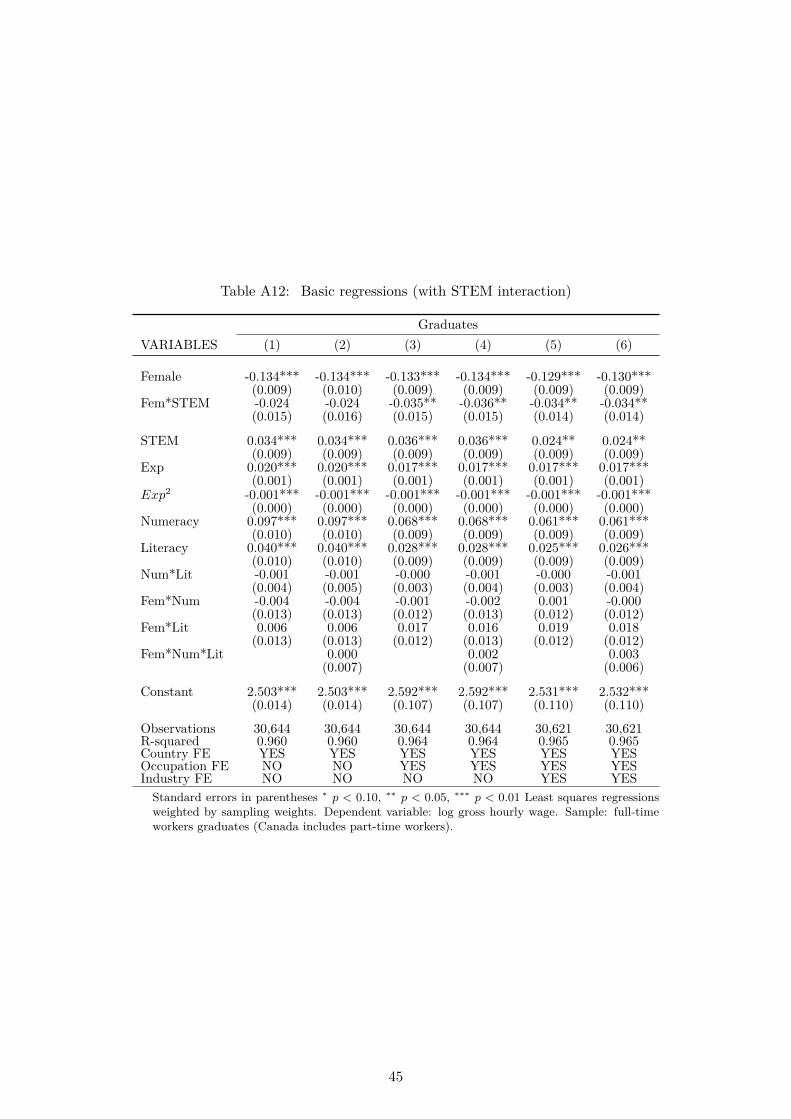
Table A12: Basic regressions (with STEM interaction)
GraduatesVARIABLES (1) (2) (3) (4) (5) (6)
Female -0.134*** -0.134*** -0.133*** -0.134*** -0.129*** -0.130***(0.009) (0.010) (0.009) (0.009) (0.009) (0.009)
Fem*STEM -0.024 -0.024 -0.035** -0.036** -0.034** -0.034**(0.015) (0.016) (0.015) (0.015) (0.014) (0.014)
STEM 0.034*** 0.034*** 0.036*** 0.036*** 0.024** 0.024**(0.009) (0.009) (0.009) (0.009) (0.009) (0.009)
Exp 0.020*** 0.020*** 0.017*** 0.017*** 0.017*** 0.017***(0.001) (0.001) (0.001) (0.001) (0.001) (0.001)
Exp2 -0.001*** -0.001*** -0.001*** -0.001*** -0.001*** -0.001***(0.000) (0.000) (0.000) (0.000) (0.000) (0.000)
Numeracy 0.097*** 0.097*** 0.068*** 0.068*** 0.061*** 0.061***(0.010) (0.010) (0.009) (0.009) (0.009) (0.009)
Literacy 0.040*** 0.040*** 0.028*** 0.028*** 0.025*** 0.026***(0.010) (0.010) (0.009) (0.009) (0.009) (0.009)
Num*Lit -0.001 -0.001 -0.000 -0.001 -0.000 -0.001(0.004) (0.005) (0.003) (0.004) (0.003) (0.004)
Fem*Num -0.004 -0.004 -0.001 -0.002 0.001 -0.000(0.013) (0.013) (0.012) (0.013) (0.012) (0.012)
Fem*Lit 0.006 0.006 0.017 0.016 0.019 0.018(0.013) (0.013) (0.012) (0.013) (0.012) (0.012)
Fem*Num*Lit 0.000 0.002 0.003(0.007) (0.007) (0.006)
Constant 2.503*** 2.503*** 2.592*** 2.592*** 2.531*** 2.532***(0.014) (0.014) (0.107) (0.107) (0.110) (0.110)
Observations 30,644 30,644 30,644 30,644 30,621 30,621R-squared 0.960 0.960 0.964 0.964 0.965 0.965Country FE YES YES YES YES YES YESOccupation FE NO NO YES YES YES YESIndustry FE NO NO NO NO YES YES
Standard errors in parentheses ∗ p < 0.10, ∗∗ p < 0.05, ∗∗∗ p < 0.01 Least squares regressionsweighted by sampling weights. Dependent variable: log gross hourly wage. Sample: full-timeworkers graduates (Canada includes part-time workers).
45
9 References
Almenberg, Johan, and Anna Dreber. 2015. ‘Gender, stock market participation and financial literacy’.00021, Economics Letters 137 (C): 140–142. https : / / ideas . repec . org / a / eee / ecolet /
v137y2015icp140-142.html.
Altonji, Joseph G., and Rebecca M. Blank. 1999. ‘Chapter 48 Race and gender in the labor market’,vol. 3, Part C, 3143–3259. Handbook of Labor Economics. 00000. Elsevier. http://www.scienc
edirect.com/science/article/pii/S1573446399300390.
Antoni, Manfred, and Guido Heineck. 2012. Do Literacy and Numeracy Pay Off? On the Relationshipbetween Basic Skills and Earnings 6882. 00000. IZA, October. http://papers.ssrn.com/sol3/
papers.cfm?abstract_id=2158292.
Baker, Thomas, and Jacqueline Bichsel. 2006. ‘Personality predictors of intelligence: Differencesbetween young and cognitively healthy older adults’. Personality and Individual Differences 41(1): 861–871.
Becker, Gary S. 1962. ‘Investment in Human Capital: A Theoretical Analysis’. 06177, Journal ofPolitical Economy 70 (5): 9–49. issn: 00223808, 1537534X. JSTOR: 1829103.
Bishop, John. 1992. ‘The impact of academic competencies on wages, unemployment, and job perform-ance’. 00140, Carnegie-Rochester Conference Series on Public Policy 37:127–194. issn: 0167-2231.doi:10.1016/0167-2231(92)90006-5.
Blackburn, McKinley L., and David Neumark. 1995. ‘Are OLS Estimates of the Return to SchoolingBiased Downward? Another Look’. 00240, The Review of Economics and Statistics 77 (2): 217–230. issn: 00346535, 15309142. JSTOR: 2109861.
Bound, John, Zvi Griliches and Bronwyn H. Hall. 1986. ‘Wages, Schooling and IQ of Brothers andSisters: Do the Family Factors Differ?’ 00100, International Economic Review 27 (1): 77–105.issn: 00206598, 14682354. JSTOR: 2526608.
Bronars, Stephen G., and Gerald S. Oettinger. 2006. ‘Estimates of the return to schooling and ability:evidence from sibling data’. 00039, Labour Economics 13 (1): 19–34. issn: 0927-5371. doi:10.
1016/j.labeco.2004.07.003.
Cameron, Stephen V., and James Heckman. 1998. ‘Life Cycle Schooling and Dynamic Selection Bias:Models and Evidence for Five Cohorts of American Males’. 00000, Journal of Political Economy106 (2): 262–333. http://EconPapers.repec.org/RePEc:ucp:jpolec:v:106:y:1998:i:2:p:
262-333.
Carreiras, Manuel, Philip J. Monahan, Mikel Lizarazu, Jon Andoni Dunabeitia and Nicola Molin-aro. 2015. ‘Numbers are not like words: Different pathways for literacy and numeracy’. 00000,NeuroImage 118:79–89. issn: 1053-8119. doi:10.1016/j.neuroimage.2015.06.021.
Cawley, John, James Heckman and Edward Vytlacil. 2001. ‘Three observations on wages and measuredcognitive ability’. 00262, Labour Economics 8 (4): 419–442. issn: 0927-5371. doi:10.1016/S0927-
5371(01)00039-2.
46
Cunha, Flavio, and James Heckman. 2007. ‘The Technology of Skill Formation’. 01511, The AmericanEconomic Review 97 (2): 31–47. issn: 00028282. JSTOR: 30034418.
Cunha, Flavio, James J. Heckman and Lance Lochner. 2006. ‘Interpreting the Evidence on Life CycleSkill Formation’, edited by Erik Hanushek and F. Welch, 1:697–812. Handbook of the Economicsof Education. 01331. Elsevier, May. https://ideas.repec.org/h/eee/educhp/1-12.html.
De Baldini Rocha, Mauna Soares, and Vladimir Ponczek. 2011. ‘The effects of adult literacy onearnings and employment’. 00007, Economics of Education Review 30, no. 4 (August): 755–764.https://ideas.repec.org/a/eee/ecoedu/v30y2011i4p755-764.html.
Dougherty, Christopher. 2003. ‘Numeracy, literacy and earnings: evidence from the National Lon-gitudinal Survey of Youth’. 00051, Economics of Education Review 22 (5): 511–521. http://
EconPapers.repec.org/RePEc:eee:ecoedu:v:22:y:2003:i:5:p:511-521.
Else-Quest, N. M., J. S. Hyde and M. C. Linn. 2010. ‘Cross-national patterns of gender differences inmathematics: A meta-analysis’. 00513, Psychological Bulletin, no. 136: 103–127.
Gneezy, Uri, Muriel Niederle and Aldo Rustichini. 2003. ‘Performance in Competitive Environments:Gender Differences’. The Quarterly Journal of Economics 118 (3): 1049–1074. doi:10.1162/
00335530360698496. eprint: http://qje.oxfordjournals.org/content/118/3/1049.full.
pdf+html. http://qje.oxfordjournals.org/content/118/3/1049.abstract.
Graham, Eileen K., and Margie E. Lachman. 2012. ‘Personality stability is associated with bettercognitive performance in adulthood: Are the stable more able?’ [In English (US)]. Journals ofGerontology - Series B Psychological Sciences and Social Sciences 67 B, no. 5 (January): 545–554.issn: 1079–5014. doi:10.1093/geronb/gbr149.
Green, David A., and W. Craig Riddell. 2003. ‘Literacy and earnings: an investigation of the interactionof cognitive and unobserved skills in earnings generation’. 00135 European Association of LabourEconomists, 14th Annual Conference, 2002, Labour Economics 10 (2): 165–184. issn: 0927-5371.doi:10.1016/S0927-5371(03)00008-3.
Grogger, Jeff, and Eric Eide. 1995. ‘Changes in College Skills and the Rise in the College WagePremium’. 00422, The Journal of Human Resources 30 (2): 280–310. issn: 0022166X. JSTOR:146120.
Hanushek, Eric A., Guido Schwerdt, Simon Wiederhold and Ludger Woessmann. 2015. ‘Returns toskills around the world: Evidence from PIAAC’. 00000, European Economic Review 73 (C): 103–130. https://ideas.repec.org/a/eee/eecrev/v73y2015icp103-130.html.
Hanushek, Eric, and Dennis D. kimko. 2000. ‘Schooling, Labor Force Quality, and the Growth ofNations’. American Economic Review 90 (5): 1184–1208.
Hanushek, Eric, and Ludger Woessman. 2012a. ‘Schooling, Educational Achievement, and the LatinAmerican Growth Puzzle’. Journal of Development Economics 99 (2): 497–512.
. 2012b. ‘The Economic Benefit of Educational Reform in the European Union’. CESifo Eco-nomic Studies 58:73–109.
47
Harmon, Colm P., Hessel Oosterbeek and Ian Walker. 2003. ‘The Returns to Education: Microeco-nomics’. 00444, Journal of Economic Surveys 17 (April): 115–156. http://papers.ssrn.com/
sol3/papers.cfm?abstract_id=416648.
Hause, John C. 1972. ‘Earnings Profile: Ability and Schooling’. 00000, Journal of Political Economy80 (3): S108–S138. issn: 00223808, 1537534X. JSTOR: 1831254.
Heckman, James J., and Tim Kautz. 2014. ‘Fostering and Measuring Skills: Interventions that ImproveCharacter and Cognition’, 341–430. The Myth of Achievement Tests: The GED and the Role ofCharacter in American Life. University of Chicago Press.
Heckman, James J., Jora Stixrud and Sergio Urzua. 2006. ‘The Effects of Cognitive and NoncognitiveAbilities on Labor Market Outcomes and Social Behavior’. 02018, Journal of Labor Economics24 (3): 411–482. issn: 0734306X, 15375307. doi:10.1086/504455.
Hirsch, Barry T. 2005. ‘Why do part-time workers earn less? The role of workers and job skills’.Industrial Labour Relations Review 58 (4): 525–551.
J. S. Hyde and M. C Linn. 1988. ‘Gender differences in verbal ability: A meta-analysis’. 00000,Psychological Bulletin, no. 104: 53–69.
Jaeggi, Sussanne M., Martin Buschkuehl, Jhon Jonides and Walter Perrig. 2008. ‘Improving fluidintelligence with training on working memory’. Proceedings of the National Academy of Sciences105 (19): 6829–6833.
Kautz, Tim, James J. Heckman, Ron Diris, Bas ter Weel and Lex Borghans. 2014. ‘Fostering andMeasuring Skills: Improving Cognitive and Non-cognitive Skills to Promote Lifetime Success’,no. 110 (November). https://ideas.repec.org/p/oec/eduaab/110-en.html.
Lindberg, S. M., J. S. Hyde, J. Petersen and M. C. Linn. 2010. ‘New trends in gender and mathematicsperformance: A meta-analysis.’ 00228, Psychological Bulletin.
Lindley, Joanne. 2012. ‘The gender dimension of technical change and the role of task inputs’. 00000European Association of Labour Economists 23rd annual conference, Paphos, Cyprus, 22-24thSeptember 2011, Labour Economics 19 (4): 516–526. issn: 0927-5371. doi:10.1016/j.labeco.
2012.05.005.
McIntosh, Steven, and Anna Vignoles. 2001. ‘Measuring and assessing the impact of basic skills onlabour market outcomes’. 00186, Oxford Economic Papers 53 (3): 453–481. doi:10.1093/oep/
53.3.453.
Mulligan, Casey B., and Yona Rubinstein. 2008. ‘Selection, Investment, and Women’s Relative WagesOver Time’. 00200, The Quarterly Journal of Economics 123 (3): 1061–1110. doi:10.1162/qjec.
2008.123.3.1061.
Murnane, Richard J., John B. Willett and Frank Levy. 1995. ‘The Growing Importance of CognitiveSkills in Wage Determination’. 01194, The Review of Economics and Statistics 77 (2): 251–266.issn: 00346535, 15309142. JSTOR: 2109863.
Niederle, Muriel, and Lise Vesterlund. 2010. ‘Explaining the Gender Gap in Math Test Scores: TheRole of Competition, The’. 00177, Journal of Economic Perspectives: 129–144.
48
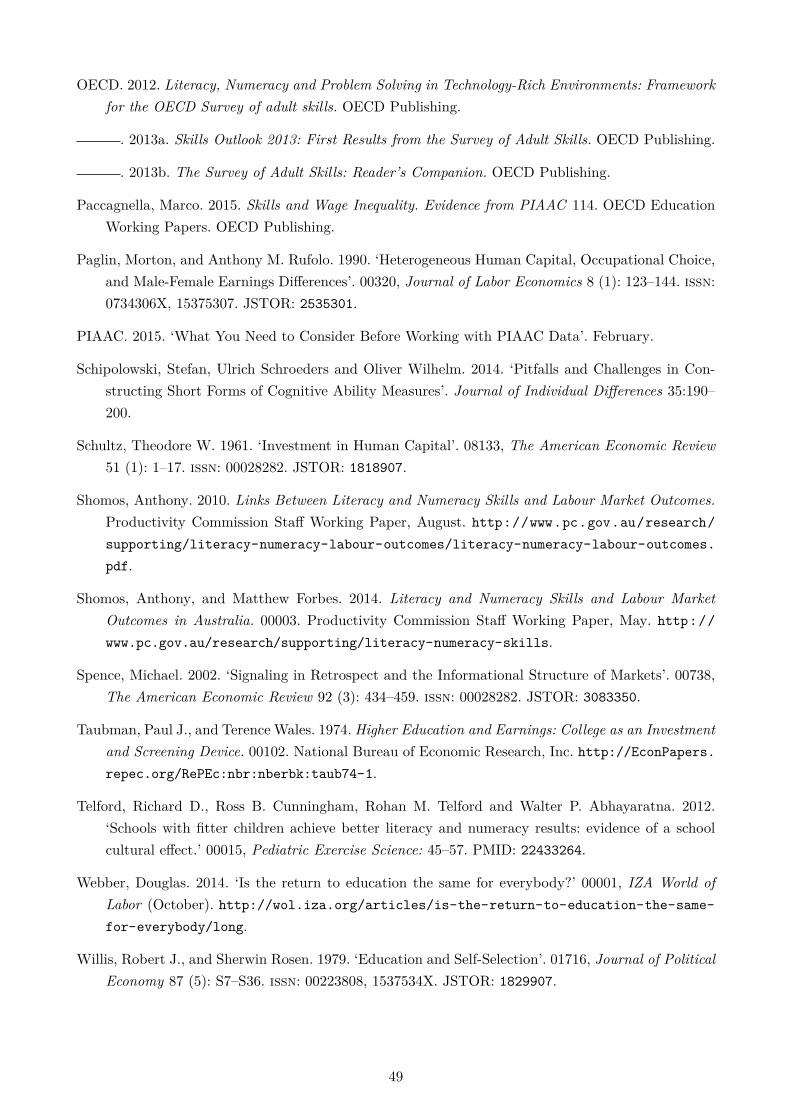
OECD. 2012. Literacy, Numeracy and Problem Solving in Technology-Rich Environments: Frameworkfor the OECD Survey of adult skills. OECD Publishing.
. 2013a. Skills Outlook 2013: First Results from the Survey of Adult Skills. OECD Publishing.
. 2013b. The Survey of Adult Skills: Reader’s Companion. OECD Publishing.
Paccagnella, Marco. 2015. Skills and Wage Inequality. Evidence from PIAAC 114. OECD EducationWorking Papers. OECD Publishing.
Paglin, Morton, and Anthony M. Rufolo. 1990. ‘Heterogeneous Human Capital, Occupational Choice,and Male-Female Earnings Differences’. 00320, Journal of Labor Economics 8 (1): 123–144. issn:0734306X, 15375307. JSTOR: 2535301.
PIAAC. 2015. ‘What You Need to Consider Before Working with PIAAC Data’. February.
Schipolowski, Stefan, Ulrich Schroeders and Oliver Wilhelm. 2014. ‘Pitfalls and Challenges in Con-structing Short Forms of Cognitive Ability Measures’. Journal of Individual Differences 35:190–200.
Schultz, Theodore W. 1961. ‘Investment in Human Capital’. 08133, The American Economic Review51 (1): 1–17. issn: 00028282. JSTOR: 1818907.
Shomos, Anthony. 2010. Links Between Literacy and Numeracy Skills and Labour Market Outcomes.Productivity Commission Staff Working Paper, August. http://www.pc.gov.au/research/
supporting/literacy-numeracy-labour-outcomes/literacy-numeracy-labour-outcomes.
pdf.
Shomos, Anthony, and Matthew Forbes. 2014. Literacy and Numeracy Skills and Labour MarketOutcomes in Australia. 00003. Productivity Commission Staff Working Paper, May. http://
www.pc.gov.au/research/supporting/literacy-numeracy-skills.
Spence, Michael. 2002. ‘Signaling in Retrospect and the Informational Structure of Markets’. 00738,The American Economic Review 92 (3): 434–459. issn: 00028282. JSTOR: 3083350.
Taubman, Paul J., and Terence Wales. 1974. Higher Education and Earnings: College as an Investmentand Screening Device. 00102. National Bureau of Economic Research, Inc. http://EconPapers.
repec.org/RePEc:nbr:nberbk:taub74-1.
Telford, Richard D., Ross B. Cunningham, Rohan M. Telford and Walter P. Abhayaratna. 2012.‘Schools with fitter children achieve better literacy and numeracy results: evidence of a schoolcultural effect.’ 00015, Pediatric Exercise Science: 45–57. PMID: 22433264.
Webber, Douglas. 2014. ‘Is the return to education the same for everybody?’ 00001, IZA World ofLabor (October). http://wol.iza.org/articles/is-the-return-to-education-the-same-
for-everybody/long.
Willis, Robert J., and Sherwin Rosen. 1979. ‘Education and Self-Selection’. 01716, Journal of PoliticalEconomy 87 (5): S7–S36. issn: 00223808, 1537534X. JSTOR: 1829907.
49