the role of endoplasmic reticulum stress in type 1 diabetes
TRANSCRIPT

THE ROLE OF ENDOPLASMIC RETICULUM STRESS IN TYPE 1 DIABETES: IDENTIFICATION OF GLUCOSE REGULATED PROTEIN 78 AS THE
AUTOANTIGEN FOR BDC-2.5 T CELL CLONE.
by
Sheila Marie Schreiner
B.S., Bridgewater State College, 2002
Submitted to the Graduate Faculty of
School of Medicine in partial fulfillment
of the requirements for the degree of
Doctor of Philosophy
University of Pittsburgh
2007

ii
UNIVERSITY OF PITTSBURGH
THE SCHOOL OF MEDICINE
This dissertation was presented
by
Sheila Marie Schreiner
It was defended on
November 6th 2007
and approved by
Nick Giannoukakis PhD Assistant Professor, Cellular and Molecular Pathology
Tim D. Oury MD/PhD
Associate Professor, Cellular and Molecular Pathology
Massimo Trucco MD Hillman Professor of Pediatric Immunology
Division Head of Immunogenetics, Immunology
Committee Chair: Wendy M. Mars PhD Associate Professor, Cellular and Molecular Pathology
Thesis Director: Jon D. Piganelli PhD
Assistant Professor, Cellular and Molecular Pathology

iii
Environmental triggers, such as viral infection and environmental toxins, have been proposed to
initiate the autoimmune disease of Type 1 Diabetes (T1D), however, the mechanism is unknown.
The identification of novel autoantigens may provide insight to the mechanism of environmental
triggers and pathogenesis of T1D. I identified the antigen recognized by the diabetogenic BDC-
2.5 T cell clone using a novel in vivo reconstitution system, Restricted Immune System via
Adoptive Transfer (RISAT). In RISAT, immunodeficient mice are adoptive transferred with a
single T cell clone and an open repertoire of B cells. Reconstituted mice are immunized with an
antigenic protein preparation. This system will drive an antibody response to the cognate antigen
for the T and B cell through the co-stimulatory pathways involved in linked recognition. For the
BDC-2.5 RISAT, non-obese diabetic (NOD).Rag-/- mice were adoptive transferred with the
diabetogenic BDC-2.5 T cells and NOD B cells and then immunized with an antigenic beta cell
membrane preparation (βmem) to drive an antibody response. The resulting antibodies
recognized the endoplasmic reticulum (ER) stress associated protein glucose regulated protein 78
(GRP78) from βmem. To determine if ER stress plays a role in the antigenic response of the
BDC-2.5 T cell clone, the non-antigenic NOD insulinoma cell line, NIT-1, were treated with
thapsigargin, which induces ER stress. The treatment of NIT-1 with thapsigargin led to
increased GRP78 synthesis, correlating with antigenic recognition by the BDC-2.5 T cell clone.
THE ROLE OF ENDOPLASMIC RETICULUM STRESS IN TYPE 1 DIABETES:
IDENTIFICATION OF GLUCOSE REGULATED PROTEIN 78 AS THE
AUTOANTIGEN FOR BDC-2.5 T CELL CLONE.
Sheila Marie Schreiner, PhD
University of Pittsburgh, 2007

iv
The antibodies from the BDC-2.5 TCR-Tg recognizes a subset of GRP78 which is modified with
phosphoserine. The data presented in this thesis demonstrates a mechanistic link between ER
stress and environmental triggers leading to the initiation of TID through the novel autoantigen,
GRP78. Also the technique, RISAT, can be used to identify additional potential autoantigens of
isolated T cell clones in both T1D and other autoimmune diseases.

v
TABLE OF CONTENTS
PREFACE............................................................................................................................ XIV
1.0 INTRODUCTION ........................................................................................................... 1
1.1 DIABETES & GLUCOSE METABOLISM........................................................... 1
1.2 NON-AUTOIMMUNE DIABETES........................................................................ 3
1.3 TYPE 1 DIABETES................................................................................................. 4
1.3.1 Insulin Replacement Therapy ...................................................................... 5
1.3.2 Islet Replacement Therapy........................................................................... 6
1.4 GENETICS OF TYPE 1 DIABETES ..................................................................... 7
1.4.1 HLA Susceptibility........................................................................................ 7
1.4.2 Non-MHC Genes........................................................................................... 8
1.5 ENIVRONMENTAL FACTORS............................................................................ 9
1.5.1 Viral Infections ............................................................................................. 9
1.5.2 Noninfectious Environmental Triggers...................................................... 10
1.6 IMMUNOLOGY OF TYPE 1 DIABETES........................................................... 11
1.6.1 Central Tolerance ....................................................................................... 13
1.6.1.1 Principles of clonal deletion............................................................. 13
1.6.2 Peripheral Tolerance .................................................................................. 15
1.6.2.1 Clonal Anergy and Adaptive Tolerance.......................................... 15

vi
1.6.2.2 Regulation. ....................................................................................... 16
1.6.2.3 Ignorance. ........................................................................................ 17
1.6.3 Acquired Tolerance .................................................................................... 17
1.7 B CELL DEVELOPMENT AND ANTIBODY MATURATION........................ 17
1.8 AUTOIMMUNITY: BREAKDOWN OF THE IMMUNE SYSTEM.................. 20
1.9 AUTOANTIBODIES & AUTOANTIGENS ASSOCIATED WITH T1D .......... 20
1.9.1 Glutamic Acid Decarboxylase (GAD65) .................................................... 22
1.9.2 Insulinoma-associated protein 2 (IA-2)...................................................... 22
1.9.3 Insulin.......................................................................................................... 23
1.9.4 Islet Cell Autoantigen of 69 kDA (ICA69) ................................................. 24
1.9.5 Other autoantigens ..................................................................................... 25
1.9.5.1 Heat shock protein 70 (HSP70). ...................................................... 27
1.9.5.2 Islet-specific Glucose-6-phosphatase catalytic subunit-Related
Protein (IGRP). .............................................................................................. 27
1.10 TYPE 1 DIABETES MOUSE MODEL .............................................................. 28
1.10.1 Non-Obese Diabetic (NOD) Mouse Model ............................................... 28
1.10.2 BDC-2.5 T Cell Clone ............................................................................... 29
1.10.3 BDC-2.5 TCR-Transgenic Mouse Model ................................................. 31
1.11 PROTEIN TRAFFICKING ................................................................................ 33
1.12 ENDOPLASMIC RETICULUM STRESS PATHWAY .................................... 34
1.12.1 Unfolded Protein Response (UPR) ........................................................... 36
1.12.2 Translational attenuation ......................................................................... 36
1.12.3 ER associated degradation ...................................................................... 37

vii
1.12.4 ER stress-apoptosis ................................................................................... 37
1.13 ER STRESS AND THE BETA CELL ................................................................ 38
1.14 ER STRESS AND DISEASE............................................................................... 39
2.0 HYPOTHESIS AND SPECIFIC AIMS........................................................................ 40
3.0 MATERIALS AND METHOD ..................................................................................... 41
3.1 ANIMALS.............................................................................................................. 41
3.2 T- AND B-CELL ISOLATION, T CELL CLONE CULTURE, AND ANTIGEN-
SPECIFIC T CELL ASSAY. ......................................................................................... 41
3.3 RISAT RECONSTITUTION VIA ADOPTIVE TRANSFERS,
IMMUNIZATION, AND SERA COLLECTION. ........................................................ 42
3.4 IMMUNOBLOT ANALYSIS................................................................................ 43
3.5 SCREENING SERUM FOR AUTOANTIBODIES ............................................. 44
3.6 IMMUNOPRECIPITATION OF AUTOANTIGENS ......................................... 45
3.7 PROTEOMIC ASSAYS FOR IDENTIFICATION OF CANDIDATE
AUTOANTIGEN............................................................................................................ 45
3.8 INDUCTION AND DETECTION OF ER STRESS AND/OR APOPTOSIS IN
CELL LINES.................................................................................................................. 46
3.9 GRP78 PEPTIDE LIBRARY................................................................................ 47
3.10 ATP 8-AH SEPHAROSE PURIFICATION OF GRP78 ................................... 48
3.11 REMOVAL OF O-LINKED GLYCOSYLATION ............................................ 48
3.12 CITRULLINATION DETECTION ASSAY ...................................................... 49
4.0 GLUCOSE REGULATED PROTEIN 78 (GRP78): A CANDIDATE ANTIGEN FOR
THE DIABETOGENIC T CELL CLONE, BDC-2.5............................................................ 50

viii
4.1 INTRODUCTION ................................................................................................. 50
4.2 RESULTS............................................................................................................... 53
4.2.1 Proof of concept: RISAT with the DO11.10 T cell. ................................... 53
4.2.2 RISAT-generated sera from NOD.Rag-/- mice immunoprecipitates GRP78
from βmem............................................................................................................. 56
4.2.3 NOD and NOD.BDC-2.5 TCR-Tg mouse sera contain autoantibodies to
GRP78..................................................................................................................... 62
4.2.4 E.coli expressed recombinant GRP78 did not elicit IFN-γ production from
the BDC-2.5 T cell clone......................................................................................... 64
4.2.5 Increased GRP78 production induced by ER stress, but not apoptosis, in
the beta cell adenoma line NIT-1 and non-beta cell line HeLa enhances IFN-γ
expression by BDC-2.5. .......................................................................................... 64
4.3 DISCUSSION......................................................................................................... 69
5.0 POSTTRANSLATIONAL MODIFICATION OF GLUCOSE REGULATED
PROTEIN 78 IS RECOGNIZED BY THE BDC-2.5 TCR-TG SERA. ................................ 74
5.1 INTRODUCTION ................................................................................................. 74
5.2 RESULTS............................................................................................................... 78
5.2.1 Individual peptides from GRP78 peptide library fail to stimulate the
BDC-2.5 T cell clone............................................................................................... 78
5.2.2 Freshly ATP 8-AH purified GRP78 is antigenic to the BDC-2.5 T cell
clone… .................................................................................................................... 81
5.2.3 Thapsigargin treatment alters antibody recognition to GRP78 in HeLa
cells…...................................................................................................................... 86
ix
5.2.4 N-linked and o-linked glycosylation does not play a role in induction of
antigenic.................................................................................................................. 86
5.2.5 GRP78 is citrullinated in NIT-1 cells. ........................................................ 88
5.2.6 Phosphorylation of serine residues............................................................. 89
5.3 DISCUSSION......................................................................................................... 92
6.0 CONCLUSIONS............................................................................................................ 95
6.1 PROPOSED MODEL OF GRP78 AND BDC-2.5 INTERACTION ................... 95
6.2 EVIDENCE TO SUPPORT THE MODEL OF INTERACTION ....................... 98
6.3 FUTURE DIRECTIONS OF RISAT TECHNIQUE ......................................... 100
6.4 FUTURE DIRECTIONS FOR GRP78 AND TYPE 1 DIABETES ................... 101
6.5 FINDINGS OF THE THESIS ............................................................................. 105
BIBLIOGRAPHY ................................................................................................................ 106

x
LIST OF TABLES
TABLE 1.I. THE TYPES OF INSULIN AND THEIR ONSET, PEAKTIME, AND
DURATION. ..................................................................................................................... 6
TABLE 1.II MECHANISMS OF TOLERANCE IN B AND T LYMPHOCYTES............ 12
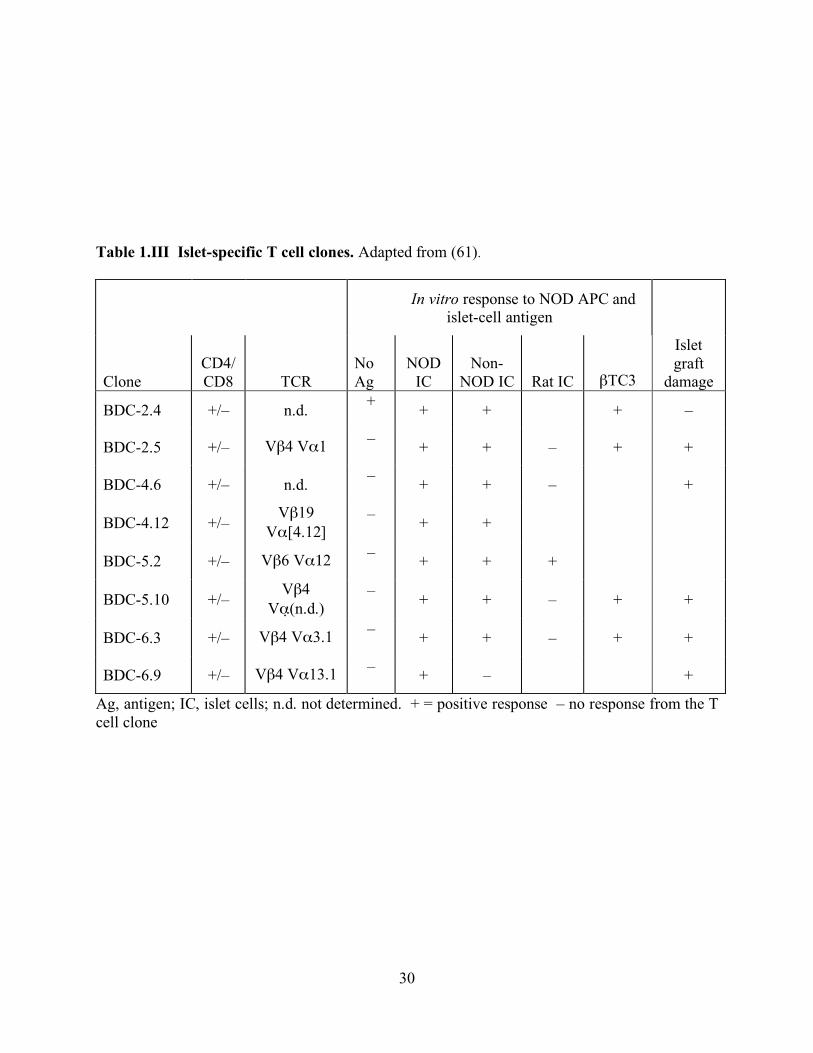
TABLE 1.III ISLET-SPECIFIC T CELL CLONES.. ......................................................... 30
TABLE 4.I IDENTIFICATION OF 70KDA PROTEIN BAND WITH MALDI-TOF. ..... 59
TABLE 4.II DEATH ASSAY WITH NIT-1 CELLS TREATED WITH THAPSIGARGIN
OR TPEN. ....................................................................................................................... 67
TABLE 5.I PEPTIDE LIBRARY FOR GRP78. .................................................................. 79
TABLE 5.II PEPTIDE POOL OF GRP78 PEPTIDE LIBRARY. ...................................... 80

xi
LIST OF FIGURES
FIGURE 1.1 PANCREATIC HORMONES REGULATE BLOOD GLUCOSE.................. 2
FIGURE 1.2 BETA CELL LOSS CORRESPONDS WITH THE LEVEL OF
AUTOREACTIVITY IN T1D. ......................................................................................... 5
FIGURE 1.3 CLONAL DELETION OF LYMPHOCYTES. .............................................. 14
FIGURE 1.4 INTERACTIONS OF T AND B CELL IN ANTIBODY ISOTYPE
SWITCHING. ................................................................................................................. 19
FIGURE 1.5 DIAGRAMMATIC REPRESENTATION OF THE EFFECT OF
MULTIPLE AUTOANTIBODIES (GAD65, IA-2, OR INSULIN) ON THE RISK OF
DEVELOPING T1D. ...................................................................................................... 21
FIGURE 1.6 T-CELL EPITOPES FOR INSULIN, THE ‘ORIGINAL’ AUTOANTIGEN.
......................................................................................................................................... 24
FIGURE 1.7 SUBCELLULAR LOCALIZATION OF BETA CELL ANTIGENS............ 26
FIGURE 1.8 DIABETES INCIDENCE FOR THE BDC-2.5 TCR-TG ON NOD,
NOD.SCID, AND B6G7 BACKGROUNDS. ................................................................... 32
FIGURE 1.9 SIGNAL SEQUENCES. ................................................................................... 34
FIGURE 1.10 THE ER STRESS PATHWAY. ..................................................................... 35

xii
FIGURE 4.1 TIMELINE OF TRANSFERS AND IMMUNIZATION SCHEDULE FOR
DO11.10 RISAT. ............................................................................................................. 54
FIGURE 4.2 SCREENING DO11.10 RISAT MOUSE SERUM FOR ANTIBODY
PRODUCTION............................................................................................................... 55
FIGURE 4.3 DO11.10 RISAT GENERATED SERUM RECOGNIZES ITS COGNATE
ANTIGEN, OVA............................................................................................................. 56
FIGURE 4.4 SCREENING FOR ANTIBODY PRODUCTION IN THE BDC-2.5 RISAT
MICE............................................................................................................................... 57
FIGURE 4.5 IMMUNOBLOT OF NIT-1 LYSATE AND ΒMEM WITH BDC-2.5 RISAT
SERUM. .......................................................................................................................... 58
FIGURE 4.6 IMMUNOPRECIPITATION TO CONFIRM THAT BDC-2.5 RISAT
SERUM RECOGNIZES GRP78.................................................................................... 61
FIGURE 4.7 NOD AND NOD.BDC-2.5 TCR TG CONFIRM ANTI-GRP78 RESULTS
WITH BDC-2.5 RISAT GENERATED SERUM. ......................................................... 63
FIGURE 4.8 UPREGULATION OF GRP78 IN NIT-1 AND HELA CELLS WHEN
TREATED WITH THAPSIGARGIN TO INDUCE ER STRESS. .............................. 65
FIGURE 4.9 UPREGULATION OF ER STRESS IN NIT-1 AND HELA CELLS LEADS
TO AN ANTIGENIC RESPONSE BY THE BDC-2.5 T CELL CLONE. ................... 66
FIGURE 5.1 BDC-2.5 T CELL ASSAY OF PURIFIED GRP78 FROM NIT-1
THAPSIGARGIN TREATED LYSATES. NIT-1 CELLS WERE TREATED WITH
THAPSIGARGIN FOR 1 HOUR AT 5µM.. ................................................................. 82
FIGURE 5.2 SILVER STAIN OF PURIFIED GRP78 FROM NIT-1 THAPSIGARGIN
TREATED LYSATES. ................................................................................................... 83

xiii
FIGURE 5.3 IMMUNOBLOT OF PURIFIED GRP78 FROM NIT-1 THAPSIGARGIN
TREATED LYSATES. ................................................................................................... 84
FIGURE 5.4 THAPSIGARGIN ALTERS ANTIBODIES ABILITY TO DETECT GRP78
PULLED DOWN BY BDC-2.5 TCR-TG....................................................................... 85
FIGURE 5.5 REMOVAL OF O-LINKED GLYCOSYLATION SITES ON GRP78......... 87
FIGURE 5.6 GRP78 IS CITRULLINATED. ....................................................................... 89
FIGURE 5.7 PHOSPHOSERINE IS SPECIFIC TO GRP78 PULLED DOWN BY BDC-
2.5 TCR-TG. ................................................................................................................... 91
FIGURE 6.1 PROPOSED MODEL OF GRP78 AND BDC-2.5 INTERACTION.............. 97

xiv
PREFACE
I am reminded of a story my Mom tells me about when I was a child. It was the first day of
kindergarten. My Mom came back at the end of the day to pick me up. She sees me in tears.
Her first thought was that I hated school. How was she going to convince me to come back
tomorrow? In between sobbing, I explained that we painted today. I thought we were going to
learn something.
To everyone at the Diabetes Institute, Rangos Research Center, INTBP, CMP, everyone
from the Trucco’s to the Shari’s, thank you. I wouldn’t have been able to accomplish everything
if Darleen did not corner me for my signature on form, my mice cages weren’t clean or my redos
of my manuscript weren’t emptied from the trashcan. Special thanks to my thesis committee, Dr.
Wendy Mars, Dr. Tim Oury, Dr. Nick Giannoukakis, and Dr. Massimo Trucco, thank you for
keeping me on track. Everyone that has passed through the Piganelli Laboratory, thank you, Dr.
Hubert Tse, Martha Milton-Sklavos, Jen Profozich, and Gina Coudriet, thank you for your help
with everything, scientific and non-scientific. Jon, I know you were always looking out for me
and doing what was in my best interest, thank you.
To those who saw my potential and challenged me, thank you. You have shaped who I
am and will be. Mr. Murray (Silver Lake Regional High School Biology Teacher), Dr. Jeffery

xv
Bowen (undergraduate mentor at Bridgewater State College), my parents (Dr. Kenneth E Roberts
aka Dad and Linda Roberts aka Mom), my sisters (Sarah and Stephanie), and my husband, Jason.
To friends and family who love me and have dealt with me through this roller coaster
called graduate school, thank you. Tara, thank you for our lunches. Gina, thank you for being
my Pittsburgh sister. For my husband’s family, especially Linda, thank you for everything you
have done for my family and me. I was able to go to work knowing that my children were in
good hands.
To my reason for getting up when I would love to sleep in, my family, thank you. Jason,
thank you for my most precious gifts, Abigail and Caleb.

1
1.0 INTRODUCTION
1.1 DIABETES & GLUCOSE METABOLISM
Diabetes is a metabolic disorder that affects how the body metabolizes glucose due to altered
insulin production or sensitivity. Typically, food is broken down into glucose, a form of sugar in
the blood. The hormone insulin is responsible for facilitating the transport of the glucose into
cells, which use it for energy and growth. As the main site of hormone regulation of blood
glucose, the pancreas, an endocrine organ, is comprised of several cell types that secrete specific
hormones to regulate blood glucose levels (Figure 1.1).
There are three pancreatic cell types, which secrete hormones into the blood to regulate
blood glucose. The alpha cells secrete glucagon during a state of low blood glucose, or
hypoglycemia. Glucagon signals the liver to convert glycogen into glucose for release into the
blood. The beta cells produce and secrete insulin. Elevated blood glucose levels, or
hyperglycemia, activates secretion of insulin. Insulin signals liver and muscle cells to take up
and store excess glucose in the form of glycogen. This also leads to fat cell up take of blood
lipids that are converted into triglycerides. Lastly, the delta cells produce somatostatin, which is
responsible for the release of both glucagon and insulin. In individuals with normal metabolism,
after a meal, insulin is released to activate cells to utilize and store glucose. After several hours
when blood glucose levels are starting to decrease, glucagon is secreted causing the release of

2
Figure 1.1 Pancreatic hormones regulate blood glucose. Regulation of blood glucose or sugar level is regulated by glucagon and insulin. Insulin acts on tissue cells to stimulate glucose uptake from blood lowering blood glucose. Low blood sugar promotes glucagon secretion. Glucagon stimulates the breakdown of glycogen to glucose in the liver. Glucose is released into the blood. High blood glucose promotes the release of insulin. 1
1 From www.howstuffworks.com/ diabetes1.htm Courtsey of HowStuffWorks.com
3
stored glucose. The importance of this ability to tightly regulate blood glucose levels has
allowed humans to survive periods of feast and famine.
1.2 NON-AUTOIMMUNE DIABETES
There are 3 main types of Diabetes: Type 1 Diabetes (T1D), Type 2 Diabetes (T2D), and
gestational diabetes. The primary difference between the three types of diabetes is how insulin is
produced and metabolized. The most common form of diabetes is T2D with approximately 90 to
95 percent of the disease falling under this classification (1). Previously, T2D was only
diagnosed in older individuals; however, more children and adolescents are being diagnosed with
T2D. This shift in the onset of T2D correlates with an increasing population of overweight
children. At onset, individuals with T2D produce insulin levels equal to non-diabetics, however
they have lost the ability to utilize insulin efficiently and consequently suffer from insulin
resistance.
The third type of diabetes, gestational diabetes, occurs in 3 to 8 percent of pregnant
women in the United States during the last trimester. It develops due to insufficient insulin
production and/or changes in hormones due to pregnancy. After the baby is born, gestational
diabetes usually disappears. These individuals are at a higher risk of developing T2D.2
2 http://www.diabetes.org/gestational-diabetes.jsp

4
1.3 TYPE 1 DIABETES
T1D, also known as Insulin-dependent diabetes mellitus (IDDM) or juvenile-onset-diabetes,
accounts for 5 to 10 percent of diabetes in the United States (2). The disease is characterized by
the autoimmune destruction of the islet-beta cells responsible for the production of insulin,
typically, at a young age. The average age of onset is 20 years old with individuals as young as
newborn to 30 years old (3). The destruction of the beta cell mass by the immune system leads
to a lack of insulin production, unregulated glucose metabolism and hyperglycemia. As shown
in Figure 1.2, diabetes is not clinically recognized until 80 to 85% of beta cell mass has been
destroyed (2, 3), therefore, newly diagnosed patients are left with exogenous insulin injection or
islet replacement therapy as their only available treatment option. As new cellular and genetic
markers and therapies become available, the goal is to identify diabetes either before any damage
is done to the beta cell mass or while the majority of the beta cell mass is intact.

5
Figure 1.2 Beta cell loss corresponds with the level of autoreactivity in T1D. The progressive loss of beta cell mass (black line) correlates with an increased frequency of pathogenic CD4+ and CD8+ T cells (gray line). When approximately 85–90% of the beta cell mass has been destroyed, overt diabetes is manifested. Adapted from (4).
1.3.1 Insulin Replacement Therapy
Since first being isolated in 1920, exogenous insulin continues to be the primary treatment for
T1D coupled with diet and exercise. There are two options patients have for treatment: multiple,
daily subcutaneous injections or insulin pumps programmed to deliver insulin subcutaneously.
Most recently, companies are beginning to test new devices that use a sensor, which is inserted
under the skin to monitor glucose levels and signal the insulin pump when to deliver insulin.
The sensor replaces the need for multiple finger pricks to read blood glucose levels. The sensor
and pump work together in hope of creating an “artificial pancreas” that more closely mimics
regulation of blood glucose.
Besides changes in how insulin is delivered, various forms of insulin have changed how
individuals regulate their blood glucose with insulin replacement. The different forms of insulin

6
vary by their onset, peak time, and duration as outlined in Table 1.I. The combination of the
various forms of insulin allow for better regulation of blood glucose levels.
Table 1.I. The types of insulin and their onset, peaktime, and duration.3
Type Onset Peaktime Duration Rapid-acting 5 min 1 hr 2 to 4 hrs
Regular/Short-acting 30 min 2 to 3 hrs 3 to 6 hrs
Intermediate-acting 2 to 4 hrs 4 to 12 hrs 12 to 18 hrs
Long-acting 6 to 10 hrs No peak 20 to 24 hrs
1.3.2 Islet Replacement Therapy
Another more experimental treatment strategy is islet replacement. This potential therapy is
achieved by either whole organ pancreas transplantation or isolated pancreatic islet
transplantation. Islet transplantation has shown some success, 10% of patients at a 5-year follow-
up are able to be insulin free (5). However, in order to avoid rejection, patients are put on an
immunosuppressive regiment. Suppression of the immune system can lead to undesirable
complications such as gastrointestinal problems, bacterial and viral infections, and cancer (6).
Another challenge of transplant therapy is a shortage of islets available for transplantation. Of
the 6,000-donor pancreata, less than half are suitable candidates for whole organ pancreas
transplantation (6). Furthermore, the remaining pancreata are subjected to experimental
3 Adapted form the American Diabetes Association website. www.diabetes.org

7
assessment to determine whether they can be used for islet isolation and transplantation into
diabetic patients. When islets are isolated from the pancreas, two to four pancreata are needed to
isolate enough islets to regulate blood glucose (6). Even if all donated pancreata were used for
either whole organ or isolated islet transplantation, there would still be a shortage. The shortage
of viable human organs has lead to emerging research on xenotransplantation, using non-human
animals as organ donors. Some success has been shown with the use of pig islets for the
xenotransplant (7).
1.4 GENETICS OF TYPE 1 DIABETES
It is clear that T1D is a polygenetic multifactorial disease. Although, the presence of T1D
susceptible genes does not equate to 100% penetrance, the importance of genetic factors is
unmistakable.
1.4.1 HLA Susceptibility
There are a number of genes that have been implicated in the development of T1D. One of the
most studied markers is the human leukocytes antigen (HLA) or the human major
histocompatibility complex (MHC) that is encoded on chromosome 6. This marker is an
attractive target because it has been determined that it is the major locus for type 1 diabetes
susceptibility providing up to 40-50% of the inheritable diabetes risk (1, 2). HLA-A, -B, and –C
encode for the MHC Class I molecules that are expressed on most cell types and are critical for
the presentation of endogenously derived antigens as a result of infection by intracellular

8
pathogens. They recognize and present antigens from sources the immune system sees as
foreign, i.e. bacteria, viruses, parasites, self-proteins in autoimmunity and donor proteins in
transplantation. HLA-DR, -DP, and –DQ encode for the MHC Class II molecules expressed on
antigen presenting cells (APC). Antigens presented via Class II are recognized by CD4+ T
lymphocytes with Class I recognized by CD8+ T lymphocytes.
T1D is an inheritable autoimmune disease with association between certain HLA loci
leads to an increased susceptibility and/or protection against development of disease. Certain
HLA loci such as DQB1*0602 alleles have demonstrated protection against T1D with 20% of
the general population expressing this haplotype. Only 1% of type I diabetics express
DQB1*0602 (8). While HLA-DR3 or DR4 are expressed by 45% of the general population,
94% of T1D patients express these HLA (3). It is interesting to note that the association of HLA
with disease development decreases in strength with increasing age of onset (9).
1.4.2 Non-MHC Genes
Besides HLA, the genetic importance of insulin and other non-MHC genes has been researched.
Polymorphisms in the IDDM2 locus are associated with risk of T1D. IDDM2 codes for variable
nucleotide tandem repeat (VNTR) 5 of the proinsulin gene or INS-VNTR5. There are three
classes of INS-VNTR5. Class I contains 26-63 repeats up to 570 bases in length. Class III
contains 140-200 repeats up to 2,200 bases in length with the length of Class II falling between
the lengths of Class I and Class III. Class III, or long-form of INS-VNTR5, is protective against
development of T1D as it increases the amount of insulin messenger RNA expressed in the
thymus, causing enhanced antigen-driven negative selection of insulin-specific autoreactive T
cells. Class I INS-VNTR5 increases T1D susceptibility as it decreases the amount of insulin

9
expressed in the thymus (2). Additional genes have been investigated for their genetic role in the
development of T1D, such as cytotoxic T-lymphocyte-associated protein 4 (CTLA-4), interferon
induced with helicase C domain 1 (IFIH1), inositol 1,4,5-triphosphate receptor 3 (ITPR3), IL-2
receptor, protein tyrosine phosphatase nonreceptor type 22 (PTPN22) (1, 2). The 1858T allele of
PTPN22, an inhibitor of T cell activation, leads to increased susceptibility for T1D. This same
polymorphism also increases the risk for other autoimmune diseases such as rheumatoid arthritis
and lupus erythematosus (10). CTLA-4 plays a vital role in the immune system as a negative
regulator of T cell activation coded on chromosome 2 at locus IDDM12. The A6230G single
nucleotide polymorphism in the 3’ flanking region of CTLA4 has shown to have a strong
correlation with T1D (11).
1.5 ENIVRONMENTAL FACTORS
It is apparent from identical twin studies that genetic risk is not enough to develop T1D. In less
than 50% of cases, both identical twins develop T1D, indicating that environmental factors must
play a critical role in penetrance of T1D (12, 13). Some potential triggering events that have
been proposed are drug or chemical exposure, viral infection, and certain food exposure.
1.5.1 Viral Infections
There is increasing evidence that infection with enterovirus, cytomegalovirus, coxsackie virus,
parvovirus B19, and rotavirus in genetically susceptible individuals may act as a triggering
event. The process of such infections in initiating an autoimmune response is not fully

10
understood. There are several popular theories on how these infections lead to diabetes onset.
Beta cells infected with viruses, due to a pancreatic tropism or random infections, are targeted by
the immune system to clear the viral load from the host, thus killing the beta cells (14, 15). An
infection may “accidentally” cause destruction of the beta cells, also known as molecular
mimicry. Molecular mimicry occurs when the sequence of viral proteins and native proteins
have high homology. The viral protein from coxsackie virus B4, 2C (CVB4-2C), shares
homologous regions with glutamic acid decarboxylase (GAD65). Anti-GAD65 antibody from
diabetic patients cross-reacting with CVB4-2C can lead to molecular mimicry, as CVB4-2C
specific lymphocytes are not able to distinguish the two proteins from one another and thus,
mount an immune response to the self-protein (16, 17). Another theory speculates that the beta
cells are killed in a bystander mechanism. Viral-specific T cells are activated and release
cytokines such as interferon-gamma (IFN-γ), the hallmark T helper (Th) cell cytokine. The
production of IFN-γ could shift the balance between Th1 and Th2 cell lineages, pushing the
generation of a previously non-activated diabetogenic Th1 cell to emerge. Additionally, antigen
expression on the surface of the beta cell is enhanced by IFN-γ. Coupled with genetic
predisposition, the autoreactive Th1 cell is able to interact with its cognate antigen and becomes
activated leading to beta cell destruction (18, 19).
1.5.2 Noninfectious Environmental Triggers
Numerous studies have explored the role of noninfectious environmental triggers such as
exposure to cow’s milk, breast-feeding, soy or wheat products, environmental toxins and vitamin
D intake with only anecdotal results. Individuals exposed to cow’s milk (CM) in the first year of
infancy are more likely to develop T1D. Conversely, individuals who are breast-fed for the first

11
year of infancy are less likely to become diabetic. There are several key differences between
cow and human milk (13). Due to high levels of casein, the protein concentration is higher in
CM. Beta-lactoglobulin (BLG), the main whey protein component in CM is not present in
human milk. Bovine albumin differs in amino acid sequence from human. There are three
amino acid differences between bovine and human insulin, which are present in both milks.
These differences may lead to immune system activation in an individual with autoreactive T
cells (13).
Evidence for many different environmental triggers has been proposed. It is very likely
that just as there are many genetic components to T1D, there is not one single environmental
trigger responsible for disease onset. More likely, there is a common cellular event between
various environmental triggers that initiates T1D through the induction of autoantigens.
1.6 IMMUNOLOGY OF TYPE 1 DIABETES
As previously mentioned, T1D is an autoimmune disease. Autoimmune diseases are
characterized by the immune system attacking self-tissue. There is a break in immunological
tolerance to allow this to happen. Immunological tolerance is the process by which the immune
system does not respond to an antigen and is important for preventing autoimmunity. Tolerance
can be divided into three distinct forms: central tolerance, peripheral tolerance and acquired
tolerance. As Table 1.II demonstrates there is a distinct difference between the maturation of T
and B lymphocytes (20).

12
Table 1.II Mechanisms of Tolerance in B and T lymphocytes. Adapted from (20).
B lymphocytes T lymphocytes
Main site of tolerance induction Bone marrow; periphery Thymus; periphery
Tolerance sensitive stage of maturation
Immature (IgM+ IgD-) B lymphocyte CD4+CD8+ thymocyte
Stimuli for Tolerance induction
Central High-avidity recognition of antigen in bone marrow
High-avidity recognition of antigen in thymus
Peripheral Antigen recognition without T-cell help
Antigen presentation without co-stimulators; repeated
stimulation by antigen Main Mechanisms of Tolerance
Central Apoptosis (clonal deletion); receptor editing Apoptosis (clonal deletion)
Peripheral Anergy (blocked signal
transduction); failure to enter lymphoid follicles
Anergy; apoptosis (activation-induced death);
suppression

13
1.6.1 Central Tolerance
Central tolerance is the selection of immature adaptive immune cells, both T and B lymphocytes,
which occurs during the differentiation of both subsets of immune cells (21, 22). After central
tolerance selection, these T and B lymphocytes seed the periphery where they take up residence
in peripheral lymph nodes and the spleen, as well as circulate throughout the body where
peripheral mechanisms are able to regulate their expansion.
1.6.1.1 Principles of clonal deletion.
Clonal deletion is the main mechanism regulating central tolerance and is comprised of negative
and positive selection (Figure 1.3). T lymphocytes undergo selection in the thymus. Self-
peptides are presented on the MHC of cortical thymic epithelial cells. T cells with moderate
affinity TCRs are signaled to differentiate and undergo positive selection; however, T cells with
high affinity TCRs undergo negative selection, through an apoptotic mechanism. Apoptosis-
promoting factor is upregulated, which leads to programmed cell death. Additionally, T cells
with low affinity TCRs are also eliminated due to “death by neglect” as they are neither signaled
to proliferate or apoptosis (21, 22).

14
Figure 1.3 Clonal deletion of lymphocytes.4
4 adapted from http://www-immuno.path.cam.ac.uk/~immuno/part1/lec08/lec8_97.html

15
1.6.2 Peripheral Tolerance
Not every protein in the body is expressed in the thymus or bone marrow, therefore, to further
reduce autoreactive lymphocytes in circulation, lymphocytes are further selected against self-
tissue once they have migrated into the periphery by peripheral tolerance mechanisms. There are
at least four known mechanisms responsible for peripheral tolerance: anergy, ignorance,
regulation and deletion.
1.6.2.1 Clonal Anergy and Adaptive Tolerance.
Anergy is the state of non-responsiveness by T and B cells to a specific antigen. In T cells,
anergy is simply characterized by normal IL-2 receptor expression but insufficient IL-2
production (23). T cell anergy can be divided into two broad categories: clonal anergy and
adaptive tolerance or in vivo anergy (24). Clonal anergy arises from incomplete T cell
activation. A block in the Ras/MAP kinase pathway maintains this arrest state. T cells can be
rescued from anergy by addition of IL-2 or anti-OX40 signaling. For CD8+ T cells, clonal
anergy does not inhibit the effector functions. In adaptive tolerance, naïve T cells are stimulated
in an environment deficient in costimulation or high coinhibition occurring in either the thymus
or the periphery. T cells proliferate and differentiate to varying degrees, however, in the
presence of persistent antigen, T cells downregulate proliferation and differentiation. A block in
tyrosine kinase activation, which inhibits calcium mobilization, results in anergy. Additionally,
signaling through the IL-2 receptor is blocked. Adaptive tolerance reverses in the absence of
antigen (25).
16
1.6.2.2 Regulation.
Regulatory T (Treg) cells achieve suppression of circulating lymphocytes. Treg can be natural
occurring (nTreg) or adaptively induced. nTreg are Foxp3pos and selected for in the thymus.
Although they recognize self-proteins, they do not lead to autoimmunity. Adaptive Treg cells
exit the thymus as non-regulatory Foxp3neg T cells. In the periphery, these T cells under the right
conditions are pushed to express Foxp3 and are able to suppress other immune cells. It is not
fully understood what conditions are necessary to induce this switch. It appears that antigen-
TCR stimulation and the presence of cytokines, such as TGFβ and IL-10 play a role in the switch
from non-regulatory to regulatory T cells (26).
Various phenotypic markers have been identified. Initially, CD4+ and CD25+ were
standard markers for Treg, however, if the immune system is already activated and/or in an
inflammatory state, CD25 or IL-2 receptor is a poor marker as it is upregulated upon activation
(26, 27). Low expression of IL-7 receptor α is used to identify human Treg (28). Glucocorticoid
induced tumor necrosis factor (GITR), cytotoxic T lymphocyte associated receptor (CTLA)-4,
lymphocyte activating gene 3 (LAG3), CD45RB and neuropilin are additional markers for Treg,
however, they are also expressed on other T cell populations (26). The most specific Treg
marker is the forkhead box transcription factor (Foxp3) (29-31). When traditional CD4+ and
CD8+ are induced to express Foxp3, they are reprogrammed to become suppressors (32).
Although, Treg secretes IL-10, direct contact, not secretion of cytokines, is required for
suppression of other immune cells, primarily APC. CTLA-4 on the Treg surface triggers the
production of indolamine 2,3-dioxygenase (33) that generates an immunosuppressive
environment (34). Treg are present in T1D (35), however, it remains to be seen if there is a
defect in T1D Treg that leads to immune system dysregulation.

17
1.6.2.3 Ignorance.
Ignorance occurs when a T or B lymphocyte fails to respond to its cognate antigen, even when
the antigen is present in circulation. If the antigen is present at a low concentration, the receptor
occupancy threshold that is necessary to trigger a response may not be met. Thus the
lymphocyte does not sense the antigen. Another reason for ignorance is that the antigen is
present in an immunologically privileged site, such as the eye, brain, testis and uterus. Cells in
immunologically privileged sites express FasL on their surface, which upon binding signals
cytotoxic T cells to apoptosis (36). Additionally, molecular mimicry can induce ignorance as the
immune system sees foreign proteins as self due to sequence similarities.
1.6.3 Acquired Tolerance
Acquired tolerance is beyond the scope of this thesis, though for completeness, acquired
tolerance is the immune system’s tolerance for external antigens i.e. in transplantation. Acquired
tolerance occurs through the mechanisms of ignorance, regulation, anergy, and apoptosis (37).
Therapeutic treatments of transplant patients aim to induce tolerance to eliminate rejection of
donor tissue.
1.7 B CELL DEVELOPMENT AND ANTIBODY MATURATION
Similar to T lymphocytes, B lymphocytes go through clonal deletion, however this is achieved in
the bone marrow. Immature B cells express surface immunoglobulin M (IgM) as their antigen
receptor or B cell receptor (BCR). If the IgM molecules are able to crosslink with their cognate

18
antigen during development in the bone marrow, the immature B cell undergoes receptor
rearrangement, or receptor editing. If, after receptor editing, the immature B cell still recognizes
self-proteins, it becomes apoptotic. This mechanism leads to immature B cells that do not
recognize self-proteins in the periphery.
In the periphery, the immature B cells undergo further selection against self-proteins.
Immature B cells that fail to react against self-proteins mature into mature B cells that express
IgD in addition to IgM. The naïve B cells are able to bind foreign proteins or self-proteins on its
B cell receptor (BCR). Upon recognition of its cognate antigen, the naïve B cell is activated and
expresses CD40 on its surface (Figure 1.4). T helper cells, Th, are able to interact with the B
cell through the CD40L and CD40 (38). This interaction is only achieved if the Th and B cell
are able to bind their cognate antigen at the same time. The B cell will present the antigen on its
MHC class II allowing the Th cells to bind the antigen on its T cell receptor (TCR). The Th cell
secretes cytokines to stimulate proliferation of the B cell. The release of IFN-γ promotes IgG
isotype switching (39). The B cell matures to a plasma cell that secretes IgG antibodies, which
are able to diffuse into the blood and tissues (36, 40).

19
Figure 1.4 Interactions of T and B cell in antibody isotype switching.

20
1.8 AUTOIMMUNITY: BREAKDOWN OF THE IMMUNE SYSTEM
Autoimmunity is characterized by a break in both central and peripheral tolerance resulting in
the recognition of self-tissue as foreign. The immune system is a dynamic system with the
above-mentioned mechanisms occurring simultaneously. In autoimmunity, it is not the failure of
a specific branch of tolerance that leads to the progression of this disease (41). In T1D,
autoreactivity ensues as a result of the escape of self-reactive T cells that recognize beta cell
antigens. Autoreactive B cells fail to be selected against in the bone marrow. Once in
circulation the autoreactive lymphocytes evade peripheral tolerance detection. When B cells
come across their cognate antigen, the lymphocytes are stimulated and proliferate. The B cells
will produce autoantibodies that mark the beta cells for destruction. Though Treg are present in
the circulation, they are unable to suppress the autoreactive lymphocytes from initiating the
destruction of beta cells (26).
1.9 AUTOANTIBODIES & AUTOANTIGENS ASSOCIATED WITH T1D
Islet-cell cytoplasmic autoantibodies (ICA) were first discovered in T1D patients in 1974. Sera
from type I diabetic patients revealed detectable islet proteins in frozen pancreas sections by
indirect immunofluorescence. Two of the ICA antigens were identified as glutamic acid
decarboxylase (GAD65) and insulinoma-associated protein 2 (IA-2). The ICA
immunofluorescence test was commonly used as the diagnostic gold standard until recombinant
proteins for GAD65 and IA-2 became available (3, 42). The advent of the highly sensitive and
less cumbersome radioimmunoassay with recombinant GAD65 and IA-2 allows for a high-

21
throughput assay to determine whether a patient is autoantibody positive. This assay set a major
milestone in the progression toward identification of patients at risk for progression to T1D prior
to disease onset. Insulin was identified as an autoantigen later in the development of T1D
because during the preparation of the frozen section slides for ICA immunofluorescence test,
insulin, along with c-peptide, is leached from the cytoplasm of the sections. At present GAD65,
IA-2 and insulin autoantibodies are standard markers for diagnosis of T1D. These antibodies are
also used to assess an individual’s risk of developing diabetes (Figure 1.5). GAD65 and IA-2
positive individuals demonstrate a 50% likelihood of developing T1D within 5 years (43). When
all three autoantibodies are present, the risk of developing diabetes within 5 years increases to
70% (44).
Figure 1.5 Diagrammatic representation of the effect of multiple autoantibodies (GAD65, IA-2, or insulin) on the risk of developing T1D. Percent diabetes represents an approximation from several longitudinal studies on first-degree relatives of T1D patients. Adapted from (3).
22
1.9.1 Glutamic Acid Decarboxylase (GAD65)
More specifically, GAD is expressed in two isoforms, GAD65 and GAD67. The molecular
weight of GAD65 and GAD67 are 65 kDa and 67 kDa, respectively and the isoforms are 65%
identical. GAD functions to convert glutamic acid to gamma-aminobutyric acid (GABA), a
major inhibitory neurotransmitter. Both isoforms are equally expressed in neurons, however,
GAD65 is predominately expressed in the beta cells. In beta cells, GAD is modified by lipids
and anchored to the cytosolic face of synaptic-like microvesicles that store and secrete GABA.
Autoantibodies present in the sera of type I diabetics recognize the middle (amino acids 245-449)
and C-terminal (amino acids 450-585) regions of GAD65, which is 585 amino acids long. There
is some cross-reactivity with the autoantibodies to GAD67 (3). GAD65 autoantibodies are
present at the onset of diabetes and in at-risk first-degree relatives of type I diabetics (42). Thus,
the presence of these autoantibodies provides limited insight to the pathogenesis of the disease.
1.9.2 Insulinoma-associated protein 2 (IA-2)
IA-2, also known as ICA-512, is a member of the receptor-type protein tyrosine phosphatase
family. The predicted structure of IA-2 contains a luminal domain (amino acids 1-576), a single
transmembrane domain (amino acids 577-601) and a cytoplasmic tail (amino acids 602-979),
which includes a tyrosine phosphatase motif (42). Unlike other members of the receptor-type
protein tyrosine phosphate family, IA-2 lacks a functional catalytic domain due to an Ala to Asp
substitution at position 911 (3). In addition to the pancreatic alpha and beta cells, IA-2 is
expressed in neuroendocrine cells and is localized to the secretory vesicles of both cell types. It

23
is speculated that IA-2 is involved in the trafficking and maturation of insulin secretory granules
as IA-2 is found in insulin granules membranes (42).
1.9.3 Insulin
Insulin autoantibodies recognize “conformational” epitopes, which is an epitope that is only
present when the protein is folded in a tertiary structure. This is also the case with GAD65 and
IA-2 autoantibodies. The A and B chain of insulin is derived from preproinsulin (Figure 1.6).
The leader peptide is removed from preproinsulin and two endoproteolytic cleavages excise the
c-peptide region. The B chain is processed by carboxypeptidase E (CPE) to yield its final form.
The A and B chain are held together covalently with two disulfide bonds. Autoantibodies, CD4+
and CD8+ T cells specific for insulin, all recognize epitopes on the B chain. Due to the
formation of antibodies to exogenous insulin following insulin replacement therapy, analysis of
the presence of insulin autoantibodies needs to be done prior to insulin replacement.

24
Figure 1.6 T-cell epitopes for insulin, the ‘original’ autoantigen. Human preproinsulin (top left) and murine preproinsulin 2 (top right). Epitopes for CD4+ T cells are indicated by different shading patterns, and the beginning and ending residues for each epitope are labeled. Broken red arrows denote CD8+ T-cell epitopes. As is true for certain other beta cell antigens, certain preproinsulin peptides are antigenic in both humans and NOD mice (including the CD4+ T-cell epitope B9–23), and CD8+ T-cell epitopes overlap those for CD4+ T cells. Human insulin (bottom left) and murine insulin 2 (bottom right). Disulfide bonds are represented by solid black lines. Adapted from (42).
1.9.4 Islet Cell Autoantigen of 69 kDA (ICA69)
The autoantibodies of islet cell autoantigen of 69 kDA (ICA69) have the potential to yield
tremendous insight regarding the pathogenesis of the T1D, as they are detectable in prediabetic
individuals. ICA69 was first discovered from the sera of three prediabetic relatives of a T1D
patient; all three later became diabetic (45). Screening of sera from subjects at risk for T1D were
positive for ICA69 autoantibodies in 43% (10 of 23) of ICA+ first-degree relatives, who later
developed T1D. The potential of ICA69 being a marker indicative of development of T1D, was
somewhat undermined by studies conducted in the non-obese diabetic (NOD) mouse, which
demonstrated that ICA69null NOD mice developed diabetes with the same kinetics as wild-type
NOD littermates (46). It, however, has yet to be determined if the role of ICA69 is the same in
humans, but it remains a very hot topic in T1D research.

25
1.9.5 Other autoantigens
Numerous other autoantigens have been identified through autoantibodies and autoreactive CD4+
and CD8+ T cells. The target antigens are located in a variety of compartments with various
functions in the beta cells as shown in Figure 1.7. Nine out of twenty-four antigens are
associated with the insulin secretory granules. Heat shock protein 70 (HSP-70) and islet-specific
glucose-6-phosphatase catalytic subunit-related protein (IGRP) are two autoantigens that are
primarily located in the ER and thus are of special interest in this thesis.

26
Figure 1.7 Subcellular localization of beta cell antigens. The proteins and lipids to which T1D patients and/or NOD mice have demonstrated immune responses are each denoted by a different symbol in this schematic representation of a beta cell. The position of each symbol within the beta cell indicates the cellular compartment in which that particular antigen is primarily localized. Although antigens are located throughout the beta cell, the highest number sof antigens (nine of 24) are associated with the secretory granules (42).

27
1.9.5.1 Heat shock protein 70 (HSP70).
HSP70 antibodies and autoreactive T cells have been detected in children (under the age of 18)
with T1D. Two major epitopes, p27 (amino acids 391-410) and p35 (amino acids 511-530),
have been identified for HSP70 (47). It is not known how HSP70 becomes antigenic, however,
it has been documented that even control individuals have some detectable IgG specific-
antibodies for HSP70 with 45% of type I diabetic children expressing significantly higher HSP70
IgG levels (47). Abulafia-Lapid et al proposes that this may be due to immunological
homunculus (48), naturally occurring autoimmunity in healthy individuals (47). One could
speculate that aberrant peripheral regulation of these naturally occurring autoimmune cells
contributes to organ-specific autoimmunity of T1D.
1.9.5.2 Islet-specific Glucose-6-phosphatase catalytic subunit-Related Protein (IGRP).
IGRP specific CD8+ T cells have been isolated from NOD islets at the earliest stages of
detectable islet infiltration (49), supporting the notion that IGRP may be an early target in the
pathogenesis of T1D. Additionally, the presence of CD4+ and CD8+ T cells and the CD8+ T cell
epitopes have been confirmed in humans and NOD mice (49-52). Most recently, a considerable
effort has been put forth toward understanding the role of ER stress in the induction of increased
IGRP expression (53).

28
1.10 TYPE 1 DIABETES MOUSE MODEL
1.10.1 Non-Obese Diabetic (NOD) Mouse Model
With the diagnosis of diabetes being made when approximately 80% of beta cell mass has been
destroyed by the immune system, animal models have played a pivotal role in elucidating the
pathogenesis of T1D. The non-obese diabetic (NOD) mouse is the most commonly used mouse
model in T1D research (12, 42, 54, 55). The NOD mouse was developed unexpectedly through
the breeding of a cataract-free CTS (Cataract Shionogi mouse) strain (12, 56). The utility of the
NOD mouse model is born out of the similarities this strain has to human T1D, in that NOD and
humans spontaneously develop diabetes, produce islet-specific antibodies, and generate T cells
that recognize islet-beta cell associated antigens leading to beta cell destruction. Beta cell loss
leads to hyperglycemia and clinically apparent diabetes. The presence of multiple susceptibility
loci has been associated with the progression of T1D in the NOD mouse. For example Idd1 has
mapped to the MHC II region. The NOD mouse has a distinct haplotype at the MHC II, which is
characterized by the unique class II molecule I-Ag7. This class II molecule is unique in that the
aspartic acid at position 57 in the ß-chain is substituted with a non-aspartic acid residue, which
has been hypothesized to play a major role in the predisposition to T1D (12). Furthermore, it is
known that NOD mouse’s macrophages have a number of defects including processing and
presentation (57, 58). Specifically, NOD macrophages are defective in engulfing and clearing
apoptotic bodies that result from dead cells. It is proposed that poor clearance leads to the
presentation of self-proteins to the autoreactive T and B cells. Approximately 80% of the female

29
and 20% of male mice in a NOD colony are diabetic by 6 months of age; however, the average
age of onset is 12 weeks of age (12, 54). The sex difference in the diabetes incidence is unique
to the NOD. It has been proposed that this is due to the effect of sex hormones. This is
supported by studies in which castration increases the incidence of diabetes in male mice. For
female mice, ovariectomy and administration of testosterone decreases the incidence of diabetes
(59, 60). These studies demonstrate that increased estrogen levels lead to higher levels of T1D
incidence and testosterone has a protective effect.
1.10.2 BDC-2.5 T Cell Clone
A number of cellular reagents from the NOD mouse have been isolated and utilized
experimentally to elucidate the mechanism of T1D. For example, the generation of autoreactive
T cells have been instrumental in increasing our understanding of the T cell mediated
pathogenesis that occurs in the T1D autoimmune attack. One particular panel of T cell clones
that have been studied extensively is the panel of autoreactive T cells outlined in Table 1.III.
These autoreactive T cells induce diabetes when adoptively transferred into mouse strains such
as the NOD, allowing studies to investigate early pathogenesis of T1D before disease onset. One
diabetogenic T cell clone that has been extensively researched is the BDC-2.5 T cell clone,
derived in 1989 (61). The BDC-2.5 T cell clone has a known T cell receptor (TCR), vβ4 vα1,
and was originally derived from the spleen and lymph node of a newly diabetic NOD female. A
beta granule membrane antigen is present in the context of the NOD MHC class II IA-g7 (62).
30
Table 1.III Islet-specific T cell clones. Adapted from (61).
In vitro response to NOD APC and islet-cell antigen
Clone CD4/ CD8 TCR
No Ag
NOD IC
Non- NOD IC Rat IC βTC3
Islet graft
damage
BDC-2.4 +/– n.d. + + + + –
BDC-2.5 +/– Vβ4 Vα1 – + + – + +
BDC-4.6 +/– n.d. – + + – +
BDC-4.12 +/– Vβ19
Vα[4.12] – + +
BDC-5.2 +/– Vβ6 Vα12 – + + +
BDC-5.10 +/– Vβ4
Vα (n.d.) – + + – + +
BDC-6.3 +/– Vβ4 Vα3.1 – + + – + +
BDC-6.9 +/– Vβ4 Vα13.1 – + – +
Ag, antigen; IC, islet cells; n.d. not determined. + = positive response – no response from the T cell clone

31
Culturing the clone with islet cells and NOD APCs induces the production of IL-2, IFN-γ, and
TNF-α, but not IL-4, indicative of a Th1 phenotype. When adoptively transferred into NOD or
NOD.scid mice between 7 to 14 days of age, animals develop extensive insulitis and
hyperglycemia. However, if the NOD recipient is over 3 weeks of age or an adult NOD.scid, a
co-transfer of diabetic splenocytes needs to accompany the clone to successfully induce diabetes.
Insulitis and hyperglycemia is a result of an autoimmune pancreatic infiltrate consisting of CD4+
T cells, CD8+ T cells, B cells, and macrophages.
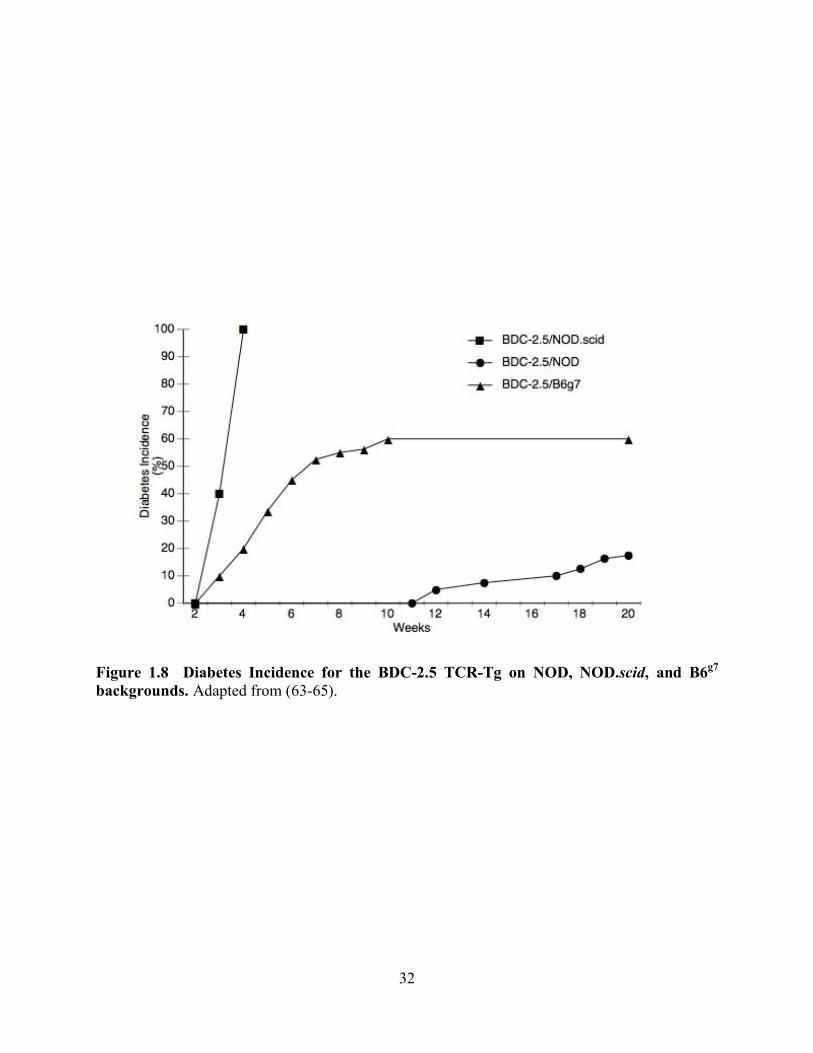
1.10.3 BDC-2.5 TCR-Transgenic Mouse Model
To more invasively investigate the role BDC-2.5 plays in diabetes development, the BDC-2.5 T
cell has been developed into a TCR-transgenic mouse. The BDC-2.5 TCR-Tg has been bred
onto the NOD, NOD.scid and B6g7 backgrounds (Figure 1.8). On the NOD background, only
10-15% of BDC-2.5/NOD animals spontaneously develop diabetes. By 3-5 weeks of age 100%
of BDC-2.5 mice bred to the NOD.scid background develop diabetes (63). The BDC-2.5/B6g7
begins to develop diabetes at 3 weeks of age, with the average onset at 6 weeks. The diabetes
incidence at 10 weeks is approximately 60% in the BDC-2.5/B6g7. BDC-2.5/B6g7 animals that
were free of diabetes at 10 weeks of age remain resistant (64).
32
Figure 1.8 Diabetes Incidence for the BDC-2.5 TCR-Tg on NOD, NOD.scid, and B6g7 backgrounds. Adapted from (63-65).
33
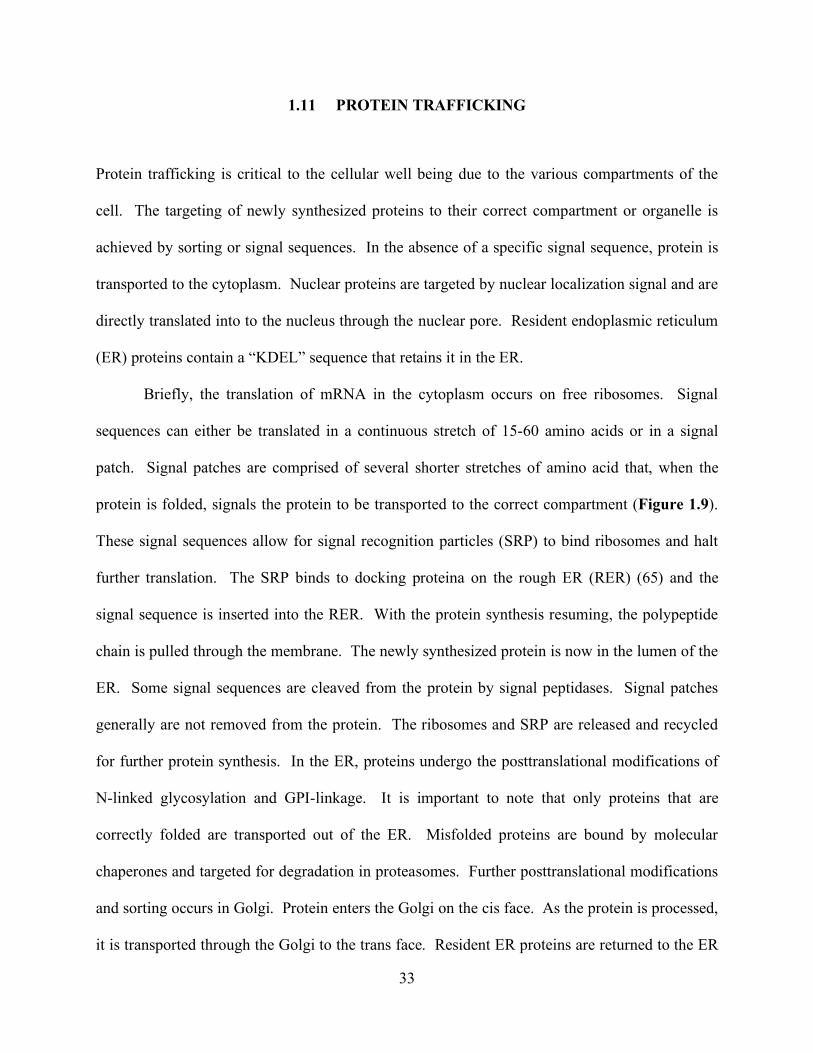
1.11 PROTEIN TRAFFICKING
Protein trafficking is critical to the cellular well being due to the various compartments of the
cell. The targeting of newly synthesized proteins to their correct compartment or organelle is
achieved by sorting or signal sequences. In the absence of a specific signal sequence, protein is
transported to the cytoplasm. Nuclear proteins are targeted by nuclear localization signal and are
directly translated into to the nucleus through the nuclear pore. Resident endoplasmic reticulum
(ER) proteins contain a “KDEL” sequence that retains it in the ER.
Briefly, the translation of mRNA in the cytoplasm occurs on free ribosomes. Signal
sequences can either be translated in a continuous stretch of 15-60 amino acids or in a signal
patch. Signal patches are comprised of several shorter stretches of amino acid that, when the
protein is folded, signals the protein to be transported to the correct compartment (Figure 1.9).
These signal sequences allow for signal recognition particles (SRP) to bind ribosomes and halt
further translation. The SRP binds to docking proteina on the rough ER (RER) (65) and the
signal sequence is inserted into the RER. With the protein synthesis resuming, the polypeptide
chain is pulled through the membrane. The newly synthesized protein is now in the lumen of the
ER. Some signal sequences are cleaved from the protein by signal peptidases. Signal patches
generally are not removed from the protein. The ribosomes and SRP are released and recycled
for further protein synthesis. In the ER, proteins undergo the posttranslational modifications of
N-linked glycosylation and GPI-linkage. It is important to note that only proteins that are
correctly folded are transported out of the ER. Misfolded proteins are bound by molecular
chaperones and targeted for degradation in proteasomes. Further posttranslational modifications
and sorting occurs in Golgi. Protein enters the Golgi on the cis face. As the protein is processed,
it is transported through the Golgi to the trans face. Resident ER proteins are returned to the ER

34
in the vesicles. Secretory proteins are also packaged into vesicles for export to the cell surface
(66).
Figure 1.9 Signal Sequences. A) A signal sequence can be a continuous stretch of animo acids. B) Or a signal patch may be responsible for the targeting of a protein. Signal patches are made up of several regions that, when the protein is folded, signal for transport. Adapted from (66).
1.12 ENDOPLASMIC RETICULUM STRESS PATHWAY
The cellular organelle, ER, is an interconnected network of tubules, vesicles, and cisternae that
connects the nucleus to the Golgi. As previously mentioned, the ER is the site of protein
translation, protein folding, and posttranslational modifications. Secreted and membrane
associated proteins pass through the ER on their way to the Golgi for further processing. The ER
also acts as a storage location for calcium, glycogen, steroids, and other macromolecules (67).
Importantly, the ER contains numerous molecular chaperones and catalysts to aid in the folding
and posttranslational modifications of proteins (68).

35
Cells have developed signaling pathways and effector mechanisms to deal with the
temporal and developmental variation in ER protein load. The ER stress pathway regulates this
balancing act in four specific ways, 1) induction of ER chaperones through the unfolded protein
response (UPR), 2) translational attenuation, 3) ER associated degradation (ERAD) (69), and 4)
apoptosis (Figure 1.10) (70).
Figure 1.10 The ER stress pathway. In order to cope with the buildup of misfolded proteins, there are four cellular responses. A. Induction of ER chaperones and accessory proteins. B. Translational attenuation. C. Misfolded proteins are degraded through ERAD. D. Activation of apoptosis. Adapted from (70).

36
1.12.1 Unfolded Protein Response (UPR)
Upon accumulation of unfolded and misfolded proteins, UPR is activated in order to upregulate
ER chaperones. The increased number of chaperones is able to re-process the proteins that were
unfolded or misfolded. The ER stress transducer proteins, inositol requiring-1 (IRE-1),
activating transcription factor-6 (ATF6), and PKR-like ER kinase (PERK) are activated. IRE1
and PERK are released from GRP78 (Glucose regulated protein 78 kDa)/BIP (Immunoglobulin
binding protein). ATF6 is activated by a two-step cleavage by Site-1 protease (S1P) and Site-2
protease (S2P). IRE1 initiates XBP-1 to activate the transcription of target genes for molecular
chaperones and accessory proteins such as catalysts. ATF6 and PERK initiate the transcription
factors, p50ATF6 and ATF4, respectively, which activate transcript of additional molecular
chaperones and catalysts (68, 70, 71).
1.12.2 Translational attenuation
Translational attenuation lowers the load of client proteins by halting protein translation, thus
giving the cell more time to process the unfolded proteins. PERK induces phosphorylation of
eukaryotic initiation factor-2a (eIF-2a), which blocks translation initiation (70, 71).

37
1.12.3 ER associated degradation (ERAD)
ERAD is the pathway in which misfolded are designated for degradation. Unsalvageable
proteins are transported to the proteasome by molecular chaperones. Misfolded proteins are
transported out of the ER by GRP78 through the Sec61 complex to the cytosol. The misfolded
proteins are ubiquitinated marking them for degradation by the 26S proteasome (70, 71).
1.12.4 ER stress-apoptosis
If a cell is unable to deal with the unfolded proteins, the ER stress pathway will initiate
programmed cell death, or apoptosis (72). There are three known apoptosis pathways triggered
by ER stress: (1) CHOP(C/EBP homologous protein)/GADD153, pathway, (2) cJUN NH2-
terminal kinase (JNK) pathway, and (3) caspase-12 pathway. CHOP is the transcription factor
that regulates one of the pathways. CHOP levels are temporally regulated from limited detection
to strong expression upon ER stress activation. CHOP promotes apoptosis in response to ER
stress as determined by overexpression and targeted disruption of the CHOP gene (70, 73, 74). It
is not known what the exact targets of CHOP are that result in apoptosis, however, Marciniak et
al demonstrate that CHOP acts on GADD34 to promote protein synthesis and alter the oxidation
balance in the cell leading to ERO1 (ER oxidase 1) activation (75).
The JNK pathway is another means that leads to ER stress-apoptosis. JNKs are signal
transduction proteins that regulate gene expression and participate in apoptosis/survival
pathways in response to stressors. Upstream of JNK activation, the ER stress protein, Ire1
recruits TRAF2 and ASK1. The three proteins form a complex to activate JNK to induce
apoptosis (70, 73).

38
The final ER stress-apoptosis pathway is through caspase activation, specifically caspase-
12 in rodents (73, 76). Caspase-12 is activated by m-calpain (77), IRE1a/TRAF2 (78), or
caspase-7 (79). Death receptor-mediated or mitochondria-targeted apoptotic signals are not
responsible for caspase-12 activated when stimulated by ER stress (70, 73).
1.13 ER STRESS AND THE BETA CELL
Secretory cells, like islet beta cells and plasma cells, have a more developed ER in order to
manage the continuous pressure of protein processing, which leads to continuous ER stress, due
to upregulation of chaperones and accessory proteins required to maintain ER homeostasis (80).
In islet beta cells, disequilibrium in the ER leading to activation of ER stress occurs in response
to a number of cellular events. There is increasing evidence that cytokines, reactive oxygen
species (ROS), viral infection, and drug/toxin exposure results in activation of ER stress. ROS
has been shown to be important in beta cell death in T1D. Oyadomari et al demonstrated that
MIN6, a mouse insulinoma cell line, produces nitric oxide (NO) in response to treatment with a
cocktail of IL-1β, TNF-α, and IFN-γ cytokines. The production of NO correlates with the
activation of ER stress, signified by the upregulation of GRP78, IRE1α, and PERK (74).

39
1.14 ER STRESS AND DISEASE
The role of ER stress in the pathogenesis of various diseases has begun to be elucidated.
‘Conformational diseases’ or ‘folding diseases’ are diseases caused by the misfolding of cellular
protein causing aggregates that can initiate ER stress. Neurodegenerative diseases, bipolar
disorder, T1D, T2D, atherosclerosis, ischemia, heart disease, liver disease, kidney disease, and
other inflammatory diseases have shown to alter ER stress response. During T1D, inflammation
plays a critical role in disease progression and, in some instances, is associated with ER stress.
During inflammation NO-induced apoptosis, mediated by ER stress and CHOP, has been
documented in beta cells (70, 81, 82) (69, 75). In the inflammatory disease, rheumatoid arthritis,
GRP78 is a target autoantigen for T and B cells. Blass et al. reported that 63% of the 400 RA
patients tested for T cell reactivity to GRP78 demonstrated specific T cell reactivity, when
challenged with biochemically purified GRP78 from mammalian cells, in addition to GRP78
autoantibodies (83).
40
2.0 HYPOTHESIS AND SPECIFIC AIMS
It is long been proposed that there are environmental triggers that initiate the antigen-driven
autoimmunity, which is responsible for the loss of beta cell mass in Type 1 Diabetes (T1D). A
number of the environmental triggers are associated with T1D, however, there does not appear to
be a common link between these environmental triggers. I hypothesize that identification of
additional autoantigens will yield a greater understanding of the pathogenesis of T1D
specifically the antigen for the BDC-2.5 T cell clone.
Specific Aim 1: Based on the concept of linked recognition, I will utilize the novel technique
Restricted Immune System via Adoptive Transfer (RISAT) to drive an antibody response to the
cognate antigen for the BDC-2.5 T cell clone.
Specific Aim 2: Using the antibodies from the BDC-2.5 RISAT mice, I will identify candidate
antigens for the BDC-2.5 T cell clone. Proteomic analysis will be used to identify the protein(s)
recognized by the RISAT antibodies.
Specific Aim 3: BDC-2.5 T cell assay will be preformed with candidate antigens to confirm their
antigenicity to the BDC-2.5 T cell clone. The source of antigen will be from purified
preparations or through in vivo upregulation in the non-antigenic NIT-1 cells.

41
3.0 MATERIALS AND METHOD
3.1 ANIMALS
BALB/c, DO11.10, CB17.scid, NOD, BDC-2.5/NOD TCR-Tg, and NOD.Rag-/- mice (Jackson
Laboratory, Bar Harbor, ME) were housed and bred under specific pathogen-free conditions in
the animal Facility of the Rangos Research Center at the University of Pittsburgh. BALB/c,
DO11.10, CB17.scid mice were used to develop the DO11.10 Restricted Immune System via
Adoptive Transfer (RISAT) mouse model. NOD and NOD.Rag-/- mice were used for the BDC-
2.5 RISAT mouse model. BDC-2.5/NOD TCR-Tg mice were used to collect serum. Blood was
collected for sera as approved by the University of Pittsburgh IACUC.
3.2 T- AND B-CELL ISOLATION, T CELL CLONE CULTURE, AND ANTIGEN-
SPECIFIC T CELL ASSAY.
T-cells from DO-11.10 mice and B cells from BALB/c and NOD mice were purified from
spleens by negative selection using MACS magnetic beads. The T and B cell purity was greater

42
than 95% (data not shown). BDC-2.5 T-cell clones were used after restimulation in culture with
antigen/APC and further expansion in subculture with additional IL-2 as previously described
(84). BDC-2.5 T cell clones were stimulated every 2 weeks with beta cell antigen and irradiated
NOD splenocytes were used as APCs in complete media (62, 85). The antigen was in the form
of a βmem made from beta-cell adenomas (62).
For antigen-specific assays, BDC-2.5 T cell clones were cultured in 96-well flat-bottom
plates at a density of 2 x 10⁴ cells/well, with or without 5 x 10⁵ irradiated NOD splenocytes as
APC and a source of antigen, such as untreated and thapsigargin treated NIT-1 cells (see below,
under Induction and Detection of ER stress and/or Apoptosis in Cell Lines), or recombinant
GRP78 (Stressgen; Victoria, BC) at 100µg/ml or 62.5µg/ml. The assay plates were incubated at
37°C for 72 hrs before the supernatants were harvested. IFN-γ production by the BDC-2.5 T
cells was assessed by sandwich enzyme-linked immunosorbent assay (ELISA).
3.3 RISAT RECONSTITUTION VIA ADOPTIVE TRANSFERS, IMMUNIZATION,
AND SERA COLLECTION.
CB17.scid mice were injected retro-orbitally with 2 x10⁷ DO11.10 T-cells, followed by purified
BALB/c B cells (2x10⁷) 72 hrs later. The immunization agents were either whole OVA or as a
negative control, pigeon cytochrome c (PCC). CB17.scid mice were immunized with 300µg
OVA or 100µg PCC in Complete Freund’s Adjuvant (CFA) into the base of the tail. On day 14,
CB17.scid mice were re-immunized with 150µg OVA or 50µg PCC in Incomplete Freund’s
Adjuvant (IFA), and an additional boost of 100µg OVA or 100µg PCC in IFA was administered
at day 53. “Pre”, “post”, “1st”, and “2nd” immunization sera were collected and on day 58, a

43
post-“3rd” bleed was collected. The resultant sera was screened by Western blot for
immunoglobulin production after each treatment.
Adult NOD.Rag-/- mice were pre-bled prior to receiving 2x10⁷ BDC-2.5 T cells (day -7)
retro-orbitally. Control animals received HBSS only. On day -5 all NOD.Rag-/- animals
received purified NOD B cells (2x10⁷) by retro-orbital injection. On day 0, serum was again
collected from all animals by centrifugation (14,000 x g) of peripheral blood, and the
reconstituted NOD.Rag-/- mice were immunized with 100µg of a βmem derived from beta cell
adenoma cells as previously described (62), in CFA in the base of the tail (day 0). On day 14, a
post-“1st” immunization bleed was collected, and all mice were boosted with 50µg of βmem in
IFA (day 14). On day 21, a post-“2nd” boost bleed was collected.
3.4 IMMUNOBLOT ANALYSIS
50µg, unless otherwise noted, of protein was separated on a 12% SDS-PAGE prep gel using
Mini-Protean II electrophoresis (Bio-Rad, Hercules, CA) at 150V for 1 h. Proteins were
transferred onto 0.45µm charged polyvinylidene fluoride (PVDF) membranes using a Mini
Trans-Blot electrophoretic transfer apparatus (Bio-Rad) at 100V for 1 hr at 4°C in Transfer
Buffer (containing 25mM Tris-HCl, 192mM glycine, 10% methanol, pH=8.3). Membranes were
stained with Ponceau S stain (0.1% (w/v) in 1.5% trichloracetic acid (v/v)) to visualize protein
bands and rinsed with 40% methanol and 7.5% glacial acetic acid to remove excess stain.
Membranes were blocked in 5% milk in PBS containing 0.05% Tween-20 (PBST) for 1 hr at
room temperature. Primary antibodies, commercially available or sera, were diluted in 5% BSA

44
in PBST, then incubated with membranes overnight at 4°C. Membranes were probed with
secondary antibodies diluted in 5% milk in PBST and bands were detected with ECL Plus
reagent (Amersham Pharmacia Biotech, Buckinghamshire, UK) according to the manufacturer’s
protocol. Phosphoserine (P-ser), phosphotyrosine (P-tyr) and phosphothreonine (P-thr) were
detected with Sigma phospho-specific antibodies.
3.5 SCREENING SERUM FOR AUTOANTIBODIES
Sera from RISAT reconstituted CB17.scid, NOD.Rag-/-, NOD (2 months non-diabetic, 4 months
diabetic, and 6 months diabetic), and NOD.BDC-2.5 TCR-Tg mice were screened for antibodies
against either OVA or βmem. The screening method was similar to immunoblot analysis
described in “Immunoblot Analysis” except for the following steps. 50µg OVA or βmem were
separated on a 12% SDS-PAGE prep gel and then transferred onto PVDF membranes.
Membranes were blocked in 5% milk in PBST for 1 hr at room temperature. The membrane was
placed into the Mini-Protean II Multiscreen Apparatus (Bio-Rad). Sera from the RISAT-treated,
NOD or NOD.BDC-2.5 TCR-Tg mice were diluted in 5% BSA in PBST and added into a
specific slot of the Multiscreen blotter, then incubated overnight at 4°C. After the slots were
flushed with PBST, membranes were removed from the apparatus and probed with goat anti-
mouse HRP secondary antibody and bands were detected with ECL Plus reagent (Amersham
Pharmacia Biotech, Buckinghamshire, UK) according to the manufacturer’s protocol.

45
3.6 IMMUNOPRECIPITATION OF AUTOANTIGENS
50µg of βmem, NIT-1 untreated or treated with thapsigargin (1µM or 5µM) or HeLa untreated or
treated with thapsigargin (1µM or 5µM) lysate was incubated with 50µl NOD.BDC-2.5 TCR-Tg
mouse sera overnight at 4°C. The following day, 25µl of washed Protein G Sepharose (Sigma)
was incubated with the protein:antibody complexes for 2 hrs at 4°C. The immunoprecipitates
were collected by centrifugation at 540x g, washed twice with RIPA (Radio-
Immunoprecipitation Assay) Buffer (containing 1% Nonidet P-40 or Igepal CA-630, 0.5%
sodium deoxycholate, 0.1% SDS, and protease inhibitor cocktail (1x, Roche, Nutley, NJ) in
PBS), and then heated in Laemmli buffer at 100°C for 5 min. The immunoprecipitated proteins
were separated on 4-20% gradient SDS-PAGE gels. Immunoblot analysis was preformed as
described in “Immunoblot Analysis”.
3.7 PROTEOMIC ASSAYS FOR IDENTIFICATION OF CANDIDATE
AUTOANTIGEN.
For MALDI-ToF, protein bands on a 4-20% gradient gel were stained with GelCode® Blue
reagent (Pierce Biotechnology, Rockford, IL). The Proteomics Core Lab at the University of
Pittsburgh preformed MALDI-ToF analysis on bands of interest. For Edman analysis, protein
bands were transferred onto 0.45µm charged PVDF membranes using a Mini Trans-Blot
electrophoretic transfer apparatus (Bio-Rad) at 100V for 1 hr at 4°C in Transfer Buffer.
Membranes were stained with GelCode® Blue reagent to visualize protein bands. The

46
Laboratory of John Hempel (Department of Biological Sciences, University of Pittsburgh)
preformed Edman degradation on bands of interest.
3.8 INDUCTION AND DETECTION OF ER STRESS AND/OR APOPTOSIS IN
CELL LINES.
NIT-1 cells (passage 27) (86) (ATCC, Manassas, VA) were propagated in 75-cm2 flasks at 37°C
in culture media (CM). Cells were fed with new medium every other day and were grown to
confluence in the tissue culture flasks, at which time they were harvested using non-enzymatic
Cell Dissociation Buffer (Invitrogen, Carlsbad, CA) and transferred to the appropriate culture
dishes, either for expansion or for the described experiments. To induce ER stress and/or
apoptosis, cells were treated with 1 or 5µM thapsigargin for 60 min or 10, 25 or 50µM N,N,N',N-
tetrakis(2-pyridylmethyl) ethylenediamine (TPEN) for 4 hr and then washed with CM three
times. Cells were centrifuged and collected for biochemical assays after two washes with PBS or
transferred to 96-well plates for T cell assays.
Induction of ER stress was identified by immunoblotting and detecting GRP78 levels.
50µg of NIT-1 or HeLa lysates in RIPA buffer (containing 1% Nonidet P-40 or Igepal CA-630,
0.5% sodium deoxycholate, 0.1% SDS, and protease inhibitor cocktail (1x, Roche, Nutley, NJ) in
PBS) were separated on a 4-20% gradient SDS-PAGE gel. Immunoblot analysis was followed
as described in “Immunoblot Analysis”. The following primary antibodies were used anti-
BiP/GRP78 antibody (Stressgen; Victoria, BC, 1:1000; Santa Cruz (N-20), Santa Cruz (C-20), or
Santa Cruz (H129); Santa Cruz, CA, 1:1000), or anti-beta actin antibody (Sigma; 1:15,000) in
5% BSA in PBST. Goat anti-rabbit, rabbit anti-goat and goat anti-mouse (1:15,000) IgG

47
polyclonal antibody conjugated to HRP were used as secondary antibodies.
In order to identify the NIT-1 cells as apoptotic or necrotic after treatment with
thapsigargin or TPEN, a quantitative fluorescent assay was performed as previously described
(84). Cells were harvested and transferred to a microcentrifuge tube and centrifuged for 5 min at
200g. Supernatants were aspirated carefully, leaving 25 µl for resuspension of the cell pellets by
gentle shaking of the tube. After addition of 2 µl of DNA intercalating dye mix (100 µg/ml
acridine orange & 100 µg/ml of ethidium bromide in PBS), 10 µl of the NIT-1 cell suspension
was transferred to a clean microscope slide, and a coverslip was placed on the suspension. Using
a fluorescence microscope with a FITC/TRITC filter, cells were scored for morphological
evidence of apoptosis versus necrosis by visualization of the cell for both the color and the state
of the nucleus, using a mixture of the DNA intercalating dyes acridine orange and ethidium
bromide. The criteria we used to score the cells after treatment were as follows: 100 cells
(minimum) were scored into one of four categories: Viable cells with normal nuclei (green
nuclei), necrotic cells with normal nuclei (orange nuclei), apoptotic cells with intact membranes
(highly condensed green nuclei), and apoptotic cells with damaged membranes (highly
condensed orange nuclei). The percentages of the morphological categories were then
calculated.
3.9 GRP78 PEPTIDE LIBRARY
Overlapping 15mer peptides of murine GRP78 (ID P20029) were synthesis by Mimotope
(Clayton Victoria, Australia). Peptides were pooled into groups of 12 or 13 peptides. Peptide
pools were assessed at 2.8, 1.4, and 0.7ug of peptide per well in T cell clone assays as previously

48
described in “T- and B-cell isolation, T cell clone culture, and antigen-specific T cell assay”.
Individual and surrounding peptides were assayed if they stimulated the T cells in both pools, i.e.
p32, p33, p34, p35, p36, p37, p38.
3.10 ATP 8-AH SEPHAROSE PURIFICATION OF GRP78
GRP78 was selectively purified by JenaBioscience ATP 8-AH sepharose. NIT-1 cells treated
with 5µM were lysed with Triton X-114 (87). Lysates were dialyzed against 20 mM Tris pH
7.5, 20 mM NaCl, 10 mM MgSO4, 14 mM 2-ME at 40C overnight in a (0.5 – 3 mL) 10K MWCO
slide-a-lyzer with several buffer exchanges. Dialyzed lysates were mixed with 1mL of ATP 8-
AH sepharose and incubated overnight at 40C on a rocking platform. The columns were washed
and ATP-binding proteins were eluted with 10-20mM ATP. Eluted proteins were analyzed by
silver stain, immunoblot, and T cell assay as described in “Immunoblot Analysis” and “T- and
B-cell isolation, T cell clone culture, and antigen-specific T cell assay”. Silver stain was
preformed with Amersham Silver Stain Plus according to manufacture’s protocol.
3.11 REMOVAL OF O-LINKED GLYCOSYLATION
NIT-1 cells were treated with 5µM thapsigargin. Lysates were prepared in RIPA buffer. To
remove sites of O-linked glycosylation cells were treated as described in Mansour et al (88).
Briefly, lysates were incubated with 0.1M NaOH at 370C for 0 and 3 hours. 0.1M glacial acetic
acid was added to neutralize NaOH. Immunoblots and T cell assays were performed with lysates

49
as described in “Immunoblot Analysis” and “T- and B-cell isolation, T cell clone culture, and
antigen-specific T cell assay”. For immunoblot, anti-mouse O-linked N-acetylglucosamine
antibody (CTD110.6, Abcam, Cambridge, MA; 1:1000) or Stressgen anti-GRP78 was used as
primary antibody. Goat anti-mouse and goat anti-rabbit were used as secondary antibodies,
respectively.
3.12 CITRULLINATION DETECTION ASSAY
To detect citrullinated protein in our lysates, we used the anti-citrulline (modified) detection kit
(Upstate, Lake Placid, NY) according to manufacture’s protocol. Protein samples were
separated on a 4-20% gradient SDS-PAGE gel using Mini-Protean II electrophoresis (Bio-Rad,
Hercules, CA) at 150V for 1 h. Proteins were transferred onto 0.45µm charged PVDF
membranes using a Mini Trans-Blot electrophoretic transfer apparatus (Bio-Rad) at 100V for 1
hr at 4°C in 25mM Tris-Hcl, 192mM glycine, 10% methanol, pH=8.3. Membranes were
modified overnight in water bath at 37ºC in a 50/50 mixture of Reagent A and B. Reagent A is
0.025% FeCl3 in a solution of sterile, distilled water/98% H2SO4/85% H3PO4. Reagent B is 0.5%
2,3-butanedione monoxime, 0.25% antipyrine, 0.5M acetic acid. After 4 washes with water,
membranes were then block in 3% Milk-TBS (TBS-MLK) for 30 minutes. Membranes were
incubated for 30 minutes with Anti-citrulline (modified) antibody, which was diluted at 1:1000
in TBS-MLK. Two washes with water were followed with a 45 minutes incubation with goat
anti-rabbit HRP conjugated IgG (1:5000). The membranes were then washed twice with water,
followed by a wash with TBS-0.05% Tween-20 for 3 minutes. The membranes were washed 4
times with water before bands were detected with ECL Plus.
50
4.0 GLUCOSE REGULATED PROTEIN 78 (GRP78): A CANDIDATE ANTIGEN FOR THE
DIABETOGENIC T CELL CLONE, BDC-2.5.
Adapted from manuscript. Sheila Schreiner*, Hubert M. Tse†, Gina M. Coudriet*,
Jennifer L. Profozich†, Gene Barbour
‡, Brenda Bradley
‡, Kathryn Haskins
‡ and Jon D.
Piganelli*†2
* Department of Pathology, University of Pittsburgh, Pittsburgh, PA, 15213-3205. † Diabetes Institute, Division of Immunogenetics, Department of Pediatrics, Children’s Hospital of Pittsburgh, University of Pittsburgh, Pittsburgh, PA, 15213-3205. ‡ Department of Immunology, University of Colorado Health Sciences Center/National Jewish Medical and Research Center, 1400 Jackson Street, K823, Denver, CO 80206.
4.1 INTRODUCTION
Type 1 Diabetes (T1D) is initiated by T cell recognition of pancreatic beta cell antigens and is
characterized by T cell-mediated leukocytic infiltrate into the pancreatic islets, beta cell
destruction, and ultimately hyperglycemia. It has been well established in T1D patients and
recapitulated in animal models of T1D that human HLA class II / mouse MHC II is a major
determinant of susceptibility (55, 89). The importance of MHC class II is reinforced by the fact
that diabetogenic CD4+ T cells are absolutely critical for the initiation of T1D in open T cell
repertoire animal models (85, 90). Thus knowledge gained, regarding self-antigen interaction
51
with these class II molecules will provide insight into the events that precipitate the breakdown
of self-tolerance in T1D. The NOD mouse is a well-characterized model of T1D that closely
resembles the human form of the disease.
To investigate the role of CD4+ T cells and the autoantigens to which they respond in T1D, a
panel of CD4+ Th1 T cell clones recognizing islet beta cells as antigen and able to rapidly cause
diabetes in very young (<10 day-old) NOD recipients was produced (61, 85). The properties of
these T cell clones have been described in a number of publications and, in the case of one clone,
BDC-2.5, a TCR-transgenic (91) model (92) has made possible a variety of in vivo studies (85).
The CD4+ BDC-2.5 T cell clone responds to antigen in the form of whole mouse islet cells, or
membrane preparations from beta tumor cells (βmem), presented in the context of IAg7 (62, 93).
Although it has been 20 years since this clone was first reported, neither the natural
peptide ligand nor the protein source of the peptide antigen has been identified. On the other
hand, various peptide mimotopes that can stimulate activity of the BDC-2.5 clone or 2.5 TCR-Tg
T cells have been reported. Judkowski et al described a series of peptides that were able to
induce responses of varying magnitude in T cells from the 2.5 TCR-Tg mice (94). It was of note
in this study that based on homology to a GAD peptide sequence, the authors speculated that
GAD was the source of the natural antigen ligand for BDC-2.5. Since other studies, however,
have failed to confirm any antigenic activity with GAD, or sequential peptides from GAD, with
the BDC-2.5 T cell clone, it is doubtful that GAD is the source of antigen for this clone (85).
Yoshida et al reported on several peptide mimotopes, identified through screening of a
combinatorial peptide library, that activated clones from two panels of NOD-derived CD4+ T cell
clones isolated from two separate labs (95). These peptides behaved as agonists, eliciting strong
responses from several clones in the panels. Since no homology could be found between

52
sequences in these mimotopes and peptides in data banks, proteins could not be identified as
candidate antigens from this study.
Despite extensive investigation, the events that trigger T1D remain unknown. What is
becoming evident in at risk individuals and in animal models is that events leading to the
presentation of beta cell associated oligopeptide antigens to autoreactive T cells during the
initiation of T1D may result from normal physiological actions during the development of beta
cells or routine beta cell metabolic function. The production of neo-antigens, coupled to
defective APC function may be a recipe for beta cell selective autoimmunity (96) (57, 58, 97).
T1D, as manifested in the NOD model, has been described as a progression through a series of
checkpoints. First there is the expansion of the autoreactive pool (checkpoint 1), followed by
homing of the T cells to the pancreas (checkpoint 2), and finally the transition from peri-insulitis
to invasive, destructive insulitis (checkpoint 3) (98). To better understand the initiating events
and the role of CD4+ T cells in the pathogenesis of T1D, I have utilized BDC-2.5 T cell clones,
in a T cell:B cell model system, which I have termed Restricted Immune System via Adoptive
Transfer (RISAT). It is well established that long-lived B cells circulate through the blood and
lymph nodes until they encounter their specific antigen that has been ferried to the T cell areas of
the lymph node or spleen by macrophages and/or dendritic cells. Interaction with antigen
inhibits B cell migration and leads to BCR-specific internalization of antigen (99, 100). Naïve
antigen-specific Th cells are also activated in these locations, by antigen-presenting dendritic
cells. During T cell-dependent activation, an APC presents a processed antigen to a Th cell
resulting in T cell priming. When a B cell processes and presents the same antigen to the primed
Th cell, it leads to formation of stable T and B cell conjugates, termed linked-recognition,
including the interaction of CD40L and CD40 on the T cells and antigen-specific B cells,

53
respectively (101). These signals induce B cells to proliferate and terminally differentiate into
antibody-secreting cells. By using only the BDC-2.5 T cell clone to provide help to B cells after
immunization with a previously described (62) antigenic beta cell membrane preparation
(βmem) in NOD.Rag-/- mice, I was able to utilize linked recognition to drive antigen specific
antibody production. The resultant serum contained an antibody that immunoprecipitated the
ER-associated protein GRP78 within the βmem. This study suggests that the BDC-2.5 T cell
recognizes the autoantigen, GRP78, during the normal physiological process of ER stress in
pancreatic beta cells.
4.2 RESULTS
4.2.1 Proof of concept: RISAT with the DO11.10 T cell.
To test the RISAT model, the OVA-specific DO11.10 T cell receptor transgenic mouse model
was utilized (102). CB17.scid mice, which lack T cells and mature B cells, were reconstituted
with DO11.10 T-cells and BALB/c B-cells, followed 10 days after transfer, by immunization
with either OVA or the non-related antigen PCC (Figure 4.1). Again, by reconstituting the scid
mice with a single T cell clone, an open repertoire of B cells and then immunizing the mice with
their cognate antigen, through linked recognition the T cells should lend help to the B cells to
produce IgG antibodies against the cognate antigen.

54
Figure 4.1 Timeline of transfers and immunization schedule for DO11.10 RISAT.
Sera from the DO11.10 RISAT mice were collected prior to and after each immunization,
and then screened for antibody production by Western blot analysis. Antibody production in the
DO11.10 RISAT model was detected after the first boost of whole OVA using a secondary
antibody that is specific for the light chain of mouse IgG, and was absent prior to the adoptive
transfer of DO11.10 T-cells and BALB/c B-cells and, before immunization. Animals immunized
with the irrelevant antigen PCC did not produce IgG light chain, supporting the linked
recognition strategy (Figure 4.2). Furthermore, animals immunized with OVA generated only
OVA-specific antibodies that had no specific cross-reactivity to PCC (Figure 4.3).

55
Figure 4.2 Screening DO11.10 RISAT mouse serum for antibody production. To screen DO11.10 RISAT mouse serum for antibody production, sera from four mice (A-D) were run on a gradient gel and transferred to a PVDF membrane. The membrane was probed with an anti-mouse antibody to determine which mice (1-4) were producing antibodies after transfer of DO11.10 T-cells and BALB/c B-cells and immunization with whole OVA. Control mice received DO11.10 T-cells and BALB/c B-cells and were immunized with PCC (pigeon cytochrome-c). Pre, before adoptive transfers and immunization; Post, after adoptive transfers of T-cells and B-cells, before immunization; 1st, after adoptive transfers and 1st immunization.
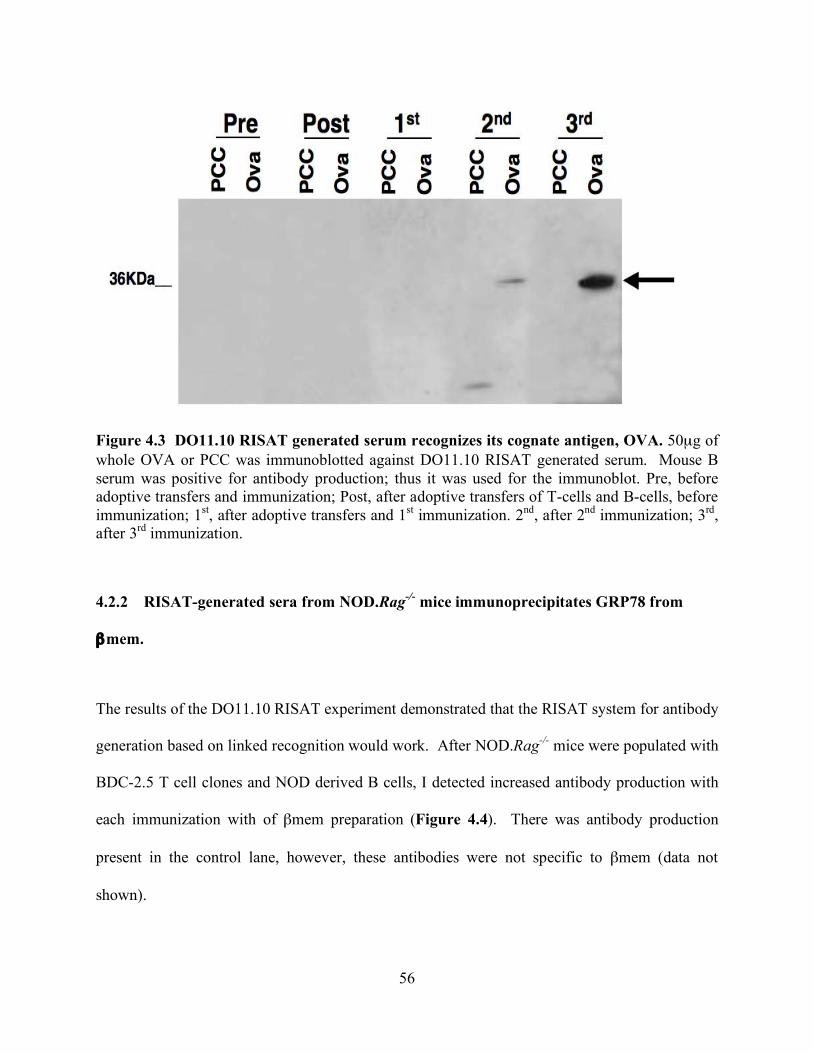
56
Figure 4.3 DO11.10 RISAT generated serum recognizes its cognate antigen, OVA. 50µg of whole OVA or PCC was immunoblotted against DO11.10 RISAT generated serum. Mouse B serum was positive for antibody production; thus it was used for the immunoblot. Pre, before adoptive transfers and immunization; Post, after adoptive transfers of T-cells and B-cells, before immunization; 1st, after adoptive transfers and 1st immunization. 2nd, after 2nd immunization; 3rd, after 3rd immunization.
4.2.2 RISAT-generated sera from NOD.Rag-/- mice immunoprecipitates GRP78 from
βmem.
The results of the DO11.10 RISAT experiment demonstrated that the RISAT system for antibody
generation based on linked recognition would work. After NOD.Rag-/- mice were populated with
BDC-2.5 T cell clones and NOD derived B cells, I detected increased antibody production with
each immunization with of βmem preparation (Figure 4.4). There was antibody production
present in the control lane, however, these antibodies were not specific to βmem (data not
shown).

57
Figure 4.4 Screening for antibody production in the BDC-2.5 RISAT mice. To screen the BDC-2.5 RISAT generated serum for antibody production; sera were run on a gel and transferred to a PVDF membrane. The membrane was probed with an anti-mouse antibody in order to determine if the BDC-2.5 RISAT mice (A, B, and C) were producing antibodies after reconstitution with both BDC-2.5 T cells and NOD B cells and immunization with βmem. Control sera are from mice that received only NOD B cells and immunized with βmem.
Sera from RISAT mice were screened for antibody production against antigenic βmem
and non-antigenic NIT-1 lysate. Control mice did not produce antibodies that recognized protein
in either βmem or NIT-1 lysate (data not shown). Serum from BDC-2.5 RISAT mouse A
produced βmem specific antibodies. Therefore, it was used to perform a traditional immunoblot
with NIT-1 lysates and βmem to determine which protein(s) were recognized by the immune
serum. The serum recognized a protein at molecular weight 70kDa in the βmem fraction, but
failed to respond strongly to any proteins in the NIT-1 lysate (Figure 4.5).
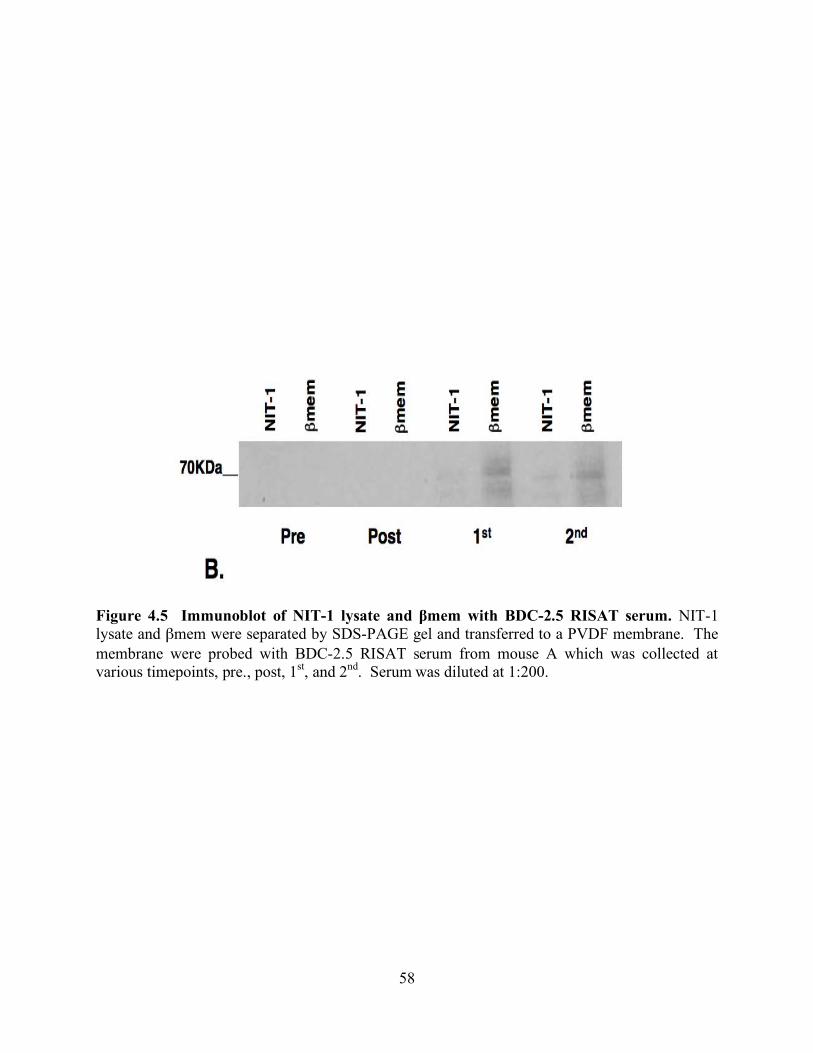
58
Figure 4.5 Immunoblot of NIT-1 lysate and βmem with BDC-2.5 RISAT serum. NIT-1 lysate and βmem were separated by SDS-PAGE gel and transferred to a PVDF membrane. The membrane were probed with BDC-2.5 RISAT serum from mouse A which was collected at various timepoints, pre., post, 1st, and 2nd. Serum was diluted at 1:200.

59
Table 4.I Identification of 70kDa protein band with MALDI-ToF.
Amino Acid position
Observed
Mr (expected)
Mr (calculate
d)
Δdaltons Start End Peptide Sequence
1191.67 1190.67 1190.63 0.04 466 475 VYEGERPLTK
1210.63 1209.62 1209.58 0.04 378 387 EFFNGKEPSR
1316.69 1315.68 1315.68 0.00 523 533 NKITITNDQNR
1329.70 1328.69 1328.61 0.08 328 337 FEELNMDLFR
1397.84 1396.83 1396.78 0.05 623 634 ELEEIVQPIISK
1430.73 1429.72 1429.68 0.04 103 114 TWNDPSVQQDIK
1460.81 1459.80 1459.75 0.05 355 368 SDIDEIVLVGGSTR
1512.80 1511.80 1511.74 0.05 326 337 AKFEELNMDLFR
1528.80 1527.79 1527.74 0.05 326 337 AKFEELNMDLFR
1536.85 1535.84 1535.79 0.05 140 153 TFAPEEISAMVLTK
1552.84 1551.83 1551.79 0.04 140 153 TFAPEEISAMVLTK
1566.84 1565.83 1565.77 0.05 62 75 ITPSYVAFTPEGER
1588.92 1587.91 1587.85 0.06 354 368 KSDIDEIVLVGGSTR
1604.90 1603.90 1603.86 0.04 125 139 TKPYIQVDIGGGQTK
1659.92 1658.92 1658.89 0.03 199 214 IINEPTAAAIAYGLDK
1677.87 1676.86 1676.80 0.06 83 97 NQLTSNPENTVFDAK
1816.05 1816.05 1814.99 0.06 199 215 IINEPTAAAIAYGLDKR
1836.99 1835.99 1835.93 0.06 449 465 SQIFSTASDNQPTVTIK
1888.04 1887.03 1886.96 0.07 166 182 VTHAVVTVPAYFNDAQR
1903.98 1902.98 1903.12 -0.14 1 18 MMKFTVVAAALLLLGAVR
1934.08 1933.07 1933.01 0.07 476 493 DNHLLGTFDLTGIPPAPR
1974.98 1973.98 1973.90 0.08 603 618 IEWLESHQDADIEDFK
1999.16 1998.15 1998.08 0.07 494 511 GVPQIEVTFEIDVNGIIR
2016.16 2015.15 2015.06 0.09 165 182 KVTHAVVTVPAYFNDAQR
2149.07 2148.06 2147.99 0.07 308 325 IEIESRREGEDFSETLTR
2174.13 2173.12 2173.03 0.09 603 620 IEWLESHQDADIEDFKAK
2178.07 2177.07 2176.96 0.10 635 655 LYGSGGPPPTGEEDTSEKDEL
Band immunoprecipitated and visualized with Gel Code Blue in Figure 4.6A and later identified in Figure 4.6B as GRP78 by immunoblot was excised from SDS-PAGE gel stained with Gel Code Blue. MALDI-ToF was preformed on excised band. Band was identified as GRP78 with a score of 191 with complete coverage using Matrix Science Mascot database-searching program.

60
The BDC-2.5 RISAT generated serum was used in an immunoprecipitation assay with the βmem
preparation. Immunoprecipitated proteins were subjected to SDS-PAGE and then visualized by
GelCode® Blue staining (Figure 4.6A). A 70kDa band present on the gel was subjected to
MALD-TOF analysis. MALDI-TOF spectrometry and analysis of the peaks via the Matrix
Science Mascot database-searching program determined the protein to be GRP78 with a high
degree of probability (Table 4.I).
The results from the MALDI-ToF analysis were also confirmed by Edman degradation
with immunoprecipitated βmem protein with BDC-2.5 RISAT generated serum (data not
shown). To demonstrate that the BDC-2.5 RISAT produced sera contained generated antibodies
specific to GRP78, they were used as primary antibodies in an immunoprecipitation reaction
with βmem protein. The resultant immunoprecipitated protein was transferred to a PVDF-
membrane and probed with a commercially available antibody to GRP78 via immunoblot
(Figure 4.6B).

61
Figure 4.6 Immunoprecipitation to confirm that BDC-2.5 RISAT serum recognizes GRP78. A) Protein bands were visualized with Gel Code Blue. Lane 1 (L1): βmem, L2: Immunoprecipitated βmem. For immunoprecipitation, βmem was incubated with BDC-2.5 RISAT generated serum. Protein:antibody complexes were pulled down with Protein G and separated on a SDS-PAGE gel and stained with Gel Code Blue. B) Immunoblot of immunoprecipitated βmem. Immunoprecipitated βmem was run out on a SDS-PAGE gel and transferred to a PVDF membrane, blocked and probed with Stressgen anti-GRP78 antibody. After incubation with an anti-rabbit antibody, a signal was detected using ECL Plus reagent.

62
4.2.3 NOD and NOD.BDC-2.5 TCR-Tg mouse sera contain autoantibodies to GRP78.
To confirm the immunoprecipitation results achieved with the RISAT-produced serum, I
analyzed serum from different aged NOD and NOD.BDC-2.5 TCR-Tg mice to determine if they
inherently produced autoantibodies to GRP78. Figure 4.7A demonstrates that serum from
female NOD mice display autoantibodies against numerous βmem proteins including GRP78 as
early as 2 months of age. This pattern of antibody reactivity would be expected since the
standard NOD mouse has a full T and B cell repertoire that could potentially allow T cell
reactivity to give help to a multitude of B cells in generating autoantibody synthesis.
Interestingly, when I used serum from NOD.BDC-2.5 TCR-Tg mice as a primary antibody
against βmem protein in a Western blot, autoantibody specificity against GRP78 was detected in
these mice (Figure 4.7B). These results demonstrate that both NOD and NOD.BDC-2.5 TCR-
Tg mice are capable of producing autoantibodies to GRP78, further confirming the relevance of
the BDC-2.5 RISAT results and the potential for ER stress induction of autoantigen synthesis.
63
Figure 4.7 NOD and NOD.BDC-2.5 TCR Tg confirm anti-GRP78 results with BDC-2.5 RISAT generated serum. A) Serum from NOD mice at 2, 4, and 6 months and B) serum from three different NOD.BDC-2.5 TCR Tg mice were screened for anti-GRP78 antibodies. Letter designations above lanes represent individual mice. For both panels, 50µg of βmem were run out on a SDS-PAGE preparative gel and transferred to a PVDF membrane. Serum samples were diluted at 1:50 and 1:200 with 5% BSA in PBST and incubated overnight. Then the membranes were incubated with an anti-mouse secondary antibody, which was detected with ECL Plus reagent.

64
4.2.4 E.coli expressed recombinant GRP78 did not elicit IFN-γ production from the BDC-
2.5 T cell clone.
To confirm whether the BDC-2.5 T cell recognizes GRP78, commercially available recombinant
GRP78 produced in E.coli was assessed for antigenicity in an in vitro T cell assay using the
NOD.BDC-2.5 TCR-Tg mouse derived T cells. Unexpectedly, the recombinant GRP78 failed to
elicit a detectable IFN-γ response from NOD.BDC-2.5 TCR-Tg mouse derived T cells (data not
shown), however, protein expression in E.coli differs from mammalian cells. Hence, these
differences, i.e. posttranslational modification of proteins, may alter the antigenic epitope of
GRP78.
4.2.5 Increased GRP78 production induced by ER stress, but not apoptosis, in the beta
cell adenoma line NIT-1 and non-beta cell line HeLa enhances IFN-γ expression by BDC-
2.5.
The results suggest that the BDC-2.5 T cell responds to a GRP78 peptide in vivo and supports the
production of GRP78-specific autoantibodies, but the clone does not react to a recombinant form
of GRP78 in vitro. As GRP78 is a key protein involved in the regulation of ER stress and since
pancreatic beta cells are subject to secretory cell induced ER stress that results in a higher level
of ER stress (73, 80, 103), I decided to test whether induction of ER stress in a beta cell
insulinoma would lead to the necessary modification of the GRP78 and confer antigenic
recognition for the BDC-2.5 T cell. ER stress was induced in NIT-1 cells with thapsigargin to
increase GRP78 synthesis. Thapsigargin is an irreversible inhibitor of the ER Ca2+-ATPase

65
(104), which leads to elevated cytosolic calcium concentration within the cell, and ultimately
leads to ER stress.
Figure 4.8 Upregulation of GRP78 in NIT-1 and HeLa cells when treated with thapsigargin to induce ER stress. NIT-1 and HeLa cells were treated for 60 min with 0, 1, or 5µM thapsigargin. Cells were lysed with RIPA buffer. 50µg of lysate was separated on a SDS-PAGE gel and transferred to a PVDF membrane, blocked and probed with anti-GRP78 or anti-beta actin (as a loading control) antibody. For NIT-1 cells, the Stressgen anti-GRP78 antibody was used. For HeLa cells, the Santa Cruz anti-GRP78 (N-20) antibody was used as it recognizes human GRP78. After the incubation with the secondary antibody, bands were detected using ECL Plus reagent. For detection of BDC-2.5 GRP78, 50µg of the above mentioned lysate was immunoprecipitated with 50µl of BDC-2.5 TCR Tg serum. Protein:antibody complexes were pulled down with Protein G and was separated by SDS-PAGE gel. After transferring to a PVDF membrane, the membrane was probed with Santa Cruz anti-GRP78 (C-20) antibody. After incubation with the secondary antibody, bands were detected using ECL Plus reagent.

66
Figure 4.9 Upregulation of ER stress in NIT-1 and HeLa cells leads to an antigenic response by the BDC-2.5 T cell clone. In Vitro T Cell Assay: 2x10⁴ BDC-2.5 T cell clones and 5x10⁵ irradiated (3500 RAD) NOD splenocytes were incubated with one thousand (1K) NIT-1 cells treated with 0, 1, or 5µM thapsigargin or 25, or 50µM TPEN or 1K HeLa cells treated with 0, 1, or 5µM thapsigargin or 25, or 50µM TPEN. On day three, supernatants were collected for IFN-γ ELISA. The data are the average of three experiments.

67
Table 4.II Death Assay with NIT-1 cells treated with thapsigargin or TPEN.
Live Cells Apoptotic Cells Membrane Damaged Cells
Membrane Damaged/Dead
Cells
Control 58.3 0 21 18
1µM Thaps. 61 1 21.6 32
5µM Thaps. 59.6 1 17.6 23
10µM TPEN 25 22.5 29.75 10.2
50µM TPEN 30.75 16.5 20 33.6
NIT-1 cells were treated with 1 or 5µM thapsigargin for 1hr or 10 or 50µM TPEN for 4hr. Cells were then assessed by death assay using DNA intercalating dye mix. 100 cells were scored. Percentage for the morphological catergories, (1) viable cells with normal nuclei, (2) necrotic cells with normal nuclei, (3) apoptotic cells with intact membrane, and (4) apoptotic cells with damaged membrane, were calculated and reported.

68
Induction of ER stress in NIT-1 cells by thapsigargin treatment increases GRP78 expression
(Figure 4.8), and positively correlates with an antigenic response from the BDC-2.5 T cell, as
demonstrated by the increase in IFN-γ production compared to non-thapsigargin treated NIT-1
cells (Figure 4.9). An immunoprecipitation reaction using BDC-2.5 TCR Tg serum proved to
pull down increasing amounts of the GRP78, from NIT-1 cells treated with increasing
concentrations of thapsigargin compared to untreated NIT-1 lysate (Figure 4.8). Since GRP78 is
not unique to the islet beta cell, I asked whether the neo-antigenicity demonstrated by ER stress
induction in the NIT-1 cells could also be demonstrated in non-beta cells by treating HeLa cells
with thapsigargin and using them as a source of antigen in the BDC-2.5 T cell assay.
Thapsigargin treated HeLa cells also elicited an antigenic response from BDC-2.5 as determined
by elevated IFN-γ production (Figure 4.9). This response was not as marked as in the NIT-1
cells, however, the increase in overall GRP78 expression with thapsigargin treatment was not as
robust as was demonstrated by the NIT-1 cells (Figure 4.8). This may be attributed to the HeLa
cells being not of islet origin or because they are human in origin. In marked contrast, both non-
thapsigargin treated NIT-1 and HeLa cells were unable to stimulate the BDC-2.5 T cell clone
above background levels (Figure 4.9). Furthermore, to prove that this antigenicity induced by
thapsigargin treatment was a result of ER stress and not apoptosis, NIT-1 cells were treated with
TPEN, a zinc chelator capable of initiating apoptosis in cells (105). TPEN-induced apoptosis of
NIT-1 cells did not increase antigenicity for the BDC-2.5 T cell clone (Figure 4.9), even though
10 and 50µM TPEN treatment resulted in 22.5% and 16.5% apoptotic cells, respectively.
Interestingly, 1 and 5µM thapsigargin treatment only rendered 1% of NIT-1 cells apoptotic
(Table 4.II) even though BDC-2.5-dependent IFN-γ synthesis increased 5 and 13-fold,
respectively (Figure 4.9).

69
4.3 DISCUSSION
Autoimmune diseases arise as a result of a complex interplay of factors, but it is often considered
that the failure of the immune system to recognize ‘self’ leads to a breakdown in tolerance.
Exploiting this breakdown in self-tolerance, I have developed a novel technique, termed RISAT,
to reconstitute NOD.Rag-/- mice with BDC-2.5 T cells and an open repertoire of NOD B cells.
Upon multiple immunizations with βmem, a previously described antigenic protein prep for the
BDC-2.5 T cell (62, 85), I was able to induce the production of antibodies that
immunoprepicated the ER stress induced protein GRP78 from βmem as identified by MALDI-
ToF analysis and Edman degradation. Additional bands detected by BDC-2.5 RISAT antibodies
were not identified by MALDI-ToF or Edman degradation analysis. There are several reasons
that I may not have been able to identify these proteins; these additional bands may be
breakdown products or truncated proteins. Due to the techniques used, the failure to identify the
bands may be the result of N-terminal blockage that is commonly the result of acetyl groups
(106). Serum from non-immunized NOD.BDC-2.5 TCR Tg mice recognized GRP78 in the
βmem preparation, confirming the RISAT-reconstitution results.
To determine if purified GRP78 protein could elicit a response in vitro from BDC-2.5 T
cells, I obtained a commercially available recombinant form of the protein produced in E. coli.
The E. coli produced recombinant protein failed to stimulate the production of IFN-γ by the
BDC-2.5 T cell clone above background levels in an in vitro T cell assay. Since the RISAT data
demonstrated that BDC-2.5 T cells could support T cell-dependent autoantibody production to

70
GRP78, I deduced that eukaryotic-dependent post-translational modification (PTM) of the
protein might be necessary to confer antigenic recognition of GRP78 by BDC-2.5, an alteration
to the protein that would be absent in a prokaryotic expression system. Support for this
hypothesis comes from work in Rheumatoid Arthritis (RA). It is known that GRP78 is a target
autoantigen in RA and both T and B cell autoreactivity has been demonstrated (83). Moreover,
Blass et al., (83) reported that 63% of the 400 RA patients tested for T cell reactivity to GRP78
demonstrated specific T cell reactivity when challenged with biochemically purified GRP78
from mammalian cells. However, when these GRP78-specific T cells were screened against an
E. coli derived GRP78 (the same commercially available source used in the BDC-2.5 T cell
clone assays), there was no antigenic response, thus indicating that a PTM occurring in
mammalian cells confers the antigenicity for this protein as an auto-antigenic target. These
results may explain the lack of response from BDC-2.5 with the recombinant produced GRP78.
The results provide evidence that the BDC-2.5 T cell responds to GRP78 in vivo, but not
to recombinant GRP78 in vitro. I therefore decided to test the hypothesis that induction of ER
stress in a beta cell line would lead to the necessary modification of the target protein, GRP78,
and confer antigenic recognition for the BDC-2.5 T cell. Since the BDC-2.5 T cells are not
responsive towards NIT-1, a NOD-derived insulinoma cell line, I chose this line to test the
hypothesis. NIT-1 cells treated with the ER stress inducer thapsigargin, demonstrated an
increase in GRP78 expression, concomitant with increased IFN-γ secretion from BDC-2.5 T
cells after stimulation with thapsigargin treated NIT-1 cells. Thapsigargin induced ER stress in
HeLa cells also proved to elicit an IFN-γ response from the BDC-2.5 T cells, demonstrating that
the ER stress induced upregulation of GRP78 confers antigenicity for the BDC-2.5, even in a

71
non-beta cell line. These results further support the hypothesis that a eukaryotic dependent
modification of GRP78 is likely necessary for neo-antigenic recognition by BDC-2.5.
Although some of the identified autoantigens in T1D have proven to be unique to islet
beta cells, other antigens have been determined to be widely expressed proteins, including for
example the recently identified T cell antigen, dystrophia myotonica kinase (DMK). DMK is the
antigen for the highly pathogenic CD8 T cell clones AI4 and its expression is not limited to islet
beta cells (107). Interestingly, the recognition of widely expressed proteins leading to specific
beta cell destruction point to the unique physiology of beta cells as a possible predisposing factor
to auto-aggressive T cell reactivity, (96, 97, 108) that is highlighted by an increase in continuous
ER stress. This further supports the idea that a unique post translational modification of the
target protein GRP78 may confirm neoantigenicity. These results, demonstrating that ER stress
induction of the beta cell adenoma NIT-1 leads to induced antigenic recognition by the BDC-2.5
T cell clone, point to the fascinating possibility that this physiological response in beta cell
function during cellular stress may set in motion the activation of an autoreactive repertoire
leading to beta cell destruction in individuals genetically predisposed for autoimmunity. Recent
reports have highlighted that many of the hypothesized environmental triggers that induce T1D
through beta cell apoptosis, also lead to ER stress (70, 73, 96). It is therefore tempting to
speculate that at least for the diabetogenic T cell clone, BDC-2.5, that ER stress induction is
necessary for antigenic recognition and adaptive immune effector function.
The increased antigenicity observed with thapsigargin treated NIT-1 cells was not due to
apoptosis since treatment of NIT-1 cells with the apoptosis-inducing agent TPEN did not
increase the response of BDC-2.5 T cells. These results support the hypothesis that cellular
stresses, which disrupt normal ER function and activate the ER stress cascade, are a prerequisite

72
for antigenic-recognition by the BDC-2.5 T cell clone. Bypassing ER stress induction through
direct apoptosis may not allow for a threshold level of GRP78 to be attained for efficient
activation of BDC-2.5 T cells. Yet prolonged ER stress can eventually lead to apoptosis
induction (71, 109, 110), which would facilitate the release of beta cell antigens that could be
picked up by dendritic cells and ultimately presented to autoreactive T cells (96). Expanding on
those observations further, I emphasize that the induction of ER stress in beta cells initiates the
release of antigen(s) and generates an appropriate threshold level of antigen that activates an
autoreactive repertoire of T cells, such as the BDC-2.5 T cell. Recently, Wang et al published
that exposure of NIT-1 cells to streptozotocin (STZ) led to their upregulation of GRP78, as a
protective mechanism against cell death (111). This effort to protect against beta cell death by
inducing the ER stress protective program may be an inherent defense mechanism by the islet
against environmental stressors. A predisposition toward autoimmunity, however, may result in
activating the autoimmune system to the related stress proteins, such as GRP78, breaking self-
tolerance, and initiating the self-destruction of the islet beta cells. Further support for this theory
comes from Coxsackie viral-mediated diabetes induction models in the NOD.BDC-2.5 TCR Tg
mice. Horwitz et al demonstrated that in the absence of direct viral-induced beta cell apoptosis,
infection of NOD.BDC-2.5 TCR Tg mice with Coxsackie CB4 led to rapid development of
diabetes by a non-specific bystander mechanism (112, 113). I would speculate that viral-induced
ER stress would increase GRP78 expression over a threshold and activate NOD.BDC-2.5 TCR
Tg T cells to promote beta cell destruction (114).
It has long been proposed that a number of environmental triggers (viral infection, drugs,
and chemical inducers of oxidative stress) lead to the onset of T1D (114, 115), but a common
link between these triggers has not been revealed. The data demonstrates that a key ER-

73
associated protein, GRP78, is an auto-antigenic target of the BDC-2.5 T cell clone in the RISAT-
reconstituted immune system, and after chemically inducing ER stress in the non-antigenic NIT-
1 cells. In both cases, an elevation of GRP78 expression resulted in a concomitant increase in
antigenic recognition by BDC-2.5 T cell clone. In conclusion, these results strongly support ER
stress as a mechanistic link for environmental triggers leading to the initiation of T cell-mediated
beta cell recognition, destruction, and death in those individuals that are genetically predisposed
to autoimmunity.

74
5.0 POSTTRANSLATIONAL MODIFICATION OF GLUCOSE REGULATED PROTEIN 78
IS RECOGNIZED BY THE BDC-2.5 TCR-TG SERA.
5.1 INTRODUCTION
‘Conformational diseases’ or ‘folding diseases’ are diseases caused by the misfolding of cellular
protein, which leads to protein aggregates that initiate ER stress. It has become clear that ER
stress plays a critical role in a number of diseases and efforts to elucidate the pathological
contribution of ER stress are now under investigation. ER stress induction occurs under a
specific program as follows, 1) induction of ER chaperones through the unfolded protein
response (UPR), 2) transitional attenuation, 3) ER associated degradation (69), and 4) apoptosis
(70).
IRE1 and PERK are held in the ER by GRP78 (Glucose regulated protein 78 kDa)/BIP
(Immunoglobulin binding protein) and, upon ER stress induction, and released by GRP78 from
the inner ER membrane to initiate the cascade of ER stress induced protein processing
regulation. ATF6 is activated by a two-step cleavage by Site-1 protease (S1P) and Site-2
protease (S2P) and is the transcription factor necessary for the activation of new GRP78 m-RNA.
IRE1 initiates XBP-1 to activate the transcription of target genes for molecular chaperones and
accessory proteins such catalysts (68). The increased number of chaperones is able to re-process
the proteins that were unfolded or misfolded.

75
Alterations in ER stress response have been shown in neurodegenerative diseases, bipolar
disorder, diabetes both T1D and T2D, atherosclerosis, ischemia, heart disease, liver disease,
kidney disease and inflammatory diseases. In T1D, inflammation plays a critical role in the
disease progression and in some instances is associated with ER stress. It has been reported that
during inflammation NO-induced apoptosis, mediated by ER stress and CHOP, has been
demonstrated in beta cells (70, 81, 82) (69, 75). ER stress has also been reported to be important
in autoimmunity. In rheumatoid arthritis, GRP78 a key regulatory protein in the ER stress
pathway as a target autoantigen with both T and B cell autoreactivity, with reports of up to 63%
of the RA patients demonstrating a specific T cell reactivity when challenged with biochemically
purified GRP78 from mammalian cells (83).
Secretory cells, like islet beta cells and plasma cells, have a more developed ER in order
to manage the continuous pressure of protein processing. This leads to continuous ER stress
with upregulation of chaperones and accessory proteins in order to maintain ER homeostasis
(80). In islet beta cells, disequilibrium in the ER leading to activation of ER stress occurs due to
a number of different cellular events. There is increasing evidence that cytokines, reactive
oxygen species (ROS), viral infection, and drug/toxin exposure results in activation of ER stress.
ROS has been shown to be important in beta cell death in type 1 diabetes. Oyadomari et al
demonstrated that the mouse insulinoma cell line, MIN6, produces nitric oxide (NO) in response
to treatment with the cytokines, IL-1β, TNF-α, and IFN-γ. The production of NO correlates with
the activation of ER stress, as was demonstrated by the upregulation of GRP78, IRE1a, and
PERK (74).
Interestingly, caspase-12 mediated apoptosis has been theorized as a possible mechanism
of antigen release for the mouse derived diabetogenic T cell clone BDC-2.5 T cell, a

76
diabetogenic CD4+ Th1 T cell clone derived from a diabetic non-obese diabetic (NOD) female
mouse (96). The BDC-2.5 recognizes islet beta cells and results in the induction of rapid
diabetes in very young (<10 days-old) NOD recipients. The BDC-2.5 T cell clone however, fails
to initiate diabetes in adult NOD.scid mice unless co-transferred with CD8+ T cells from a
diabetic NOD mouse. Both the RISAT technique and the BDC-2.5 TCR-transgenic (91) model
demonstrate the BDC-2.5 T cell lends help to B cells to drive the production of IgG antibodies
specific for GRP78. Additionally, the induction of GRP78 by the calcium flux caused by
thapsigargin treatment leads to the BDC-2.5 T cell clone producing IFN-γ.
There is evidence that post-translational modifications (PTM) can lead to the formation
of a neoantigen. PTM such as glycosylation, phosphorylation, and deamidation regulate the
structure and function of proteins. Phosphorylation regulates enzyme activity, activates signal
transduction and is involved in protein-protein interactions. Glycosylation is critical for protein
stability, solubility, and secretion signals. Protein activity and interactions are also regulated by
citrullination or deamidation.
Although these PTM have a functional cellular role, the protein changes that are caused
by the PTM can elicit an immune response. Phosphorylation of lupus antigens is required for
antibody recognition in the lupus mouse model, MRL/lpr (116). Viruses have coat viral proteins
with N-linked glycosylation sites enabling these proteins to go undetected by the immune
system, however, when the viral proteins are deglycosylated target epitopes become available for
immune detection (117). There are cohorts of T cells that recognize citrullinated proteins in
rheumatoid arthritis (RA) (118). Antibodies specific for anti-citrullinated proteins are also
present in RA patients (119). These antibodies may arise from increased citrullinated proteins as
a result of apoptotic events (33, 120).

77
There are several theories on the mechanism of PTM initiating an immune response (91).
1) The absence of PTM in the thymus during T cell maturation does not allow for T cells which
recognize PTM epitopes to be negatively selected against. 2) PTMs affect antigen processing
and thus presentation of antigenic epitopes. Cleavage sites necessary for antigenic epitope
presentation can be blocked by PTM. For example, this occurs with myelin basic protein
(MBP), an autoantigen in multiple sclerosis (31). Citrullination sites block cathepsin D from
digesting MBP, thus altering how the protein is processed and presented by APCs to T cells (91,
121). 3) The binding of antigens in the MHC-II groove is affected by PTMs. Citrullinated RA
antigens have a 20-100 times higher affinity to the RA-associated MHC-II molecules
(DRB1*0404, *0401 and *0101) compared to unmodified antigens (122). 4) There is an
association of PTM with cellular stress and apoptosis. Utz et al demonstrated that proteins
phosphorylated during stress inducing apoptosis are autoantibody targets in lupus (123). PTM
antigens are concentrated in blebs from apoptotic cells (124, 125) and may enable the levels of
antigen to exceed the antigen threshold necessary for triggering the autoreactive immune
response. Hence, I explored the role of several different PTM to determine if they play a role in
the development of GRP78 becoming antigenic for the BDC-2.5 T cell clone.
In order to further understand how the global expressed GRP78 may lead to an organ-
specific destruction, I attempted to purify stress-induced GRP78. Through immunoblot analysis,
I was able to determine that GRP78 has sites of o-linked glycosylation and citrullination. I also
confirmed that GRP78 is phosphorylated on threonine and serine residues in NIT-1 cells.
Additionally, I found the BDC-2.5 TCR-Tg antibodies recognize a subset of GRP78 which is
modified with phosphoserine. The data presented further elucidates how GRP78 develops into
the neoantigen for the BDC-2.5 T cell clone.

78
5.2 RESULTS
5.2.1 Individual peptides from GRP78 peptide library fail to stimulate the BDC-2.5 T cell
clone.
15mer peptides were synthesized for the GRP78 (Table 5.I). The 161-15mers were pooled into
26 sets of twelve to thirteen peptides (Table 5.II). Pools were tested for antigenicity against the
BDC-2.5 T cell clone. Pools IX and XVI resulted in stimulation of IFN-γ production, however,
when I looked at the common (p35) and surrounding peptides (p32 to p37), they failed to
stimulate the BDC-2.5 T cell clone.

79
Table 5.I Peptide Library for GRP78.
ID # Sequence ID # Sequence ID # Sequence 1 MMKFTVVAAALLLLGA 55 GEKNILVFDLGGGTFD 109 VMTKLIPRNTVVPTKK 2 TVVAAALLLLGAVRAE 56 ILVFDLGGGTFDVSLL 110 LIPRNTVVPTKKSQIF 3 AALLLLGAVRAEEEDK 57 DLGGGTFDVSLLTIDN 111 NTVVPTKKSQIFSTAS 4 LLGAVRAEEEDKKEDV 58 GTFDVSLLTIDNGVFE 112 PTKKSQIFSTASDNQP 5 VRAEEEDKKEDVGTVV 59 VSLLTIDNGVFEVVAT 113 SQIFSTASDNQPTVTI 6 EEDKKEDVGTVVGIDL 60 TIDNGVFEVVATNGDT 114 STASDNQPTVTIKVYE 7 KEDVGTVVGIDLGTTY 61 GVFEVVATNGDTHLGG 115 DNQPTVTIKVYEGERP 8 GTVVGIDLGTTYSCVG 62 VVATNGDTHLGGEDFD 116 TVTIKVYEGERPLTKD 9 GIDLGTTYSCVGVFKN 63 NGDTHLGGEDFDQRVM 117 KVYEGERPLTKDNHLL 10 GTTYSCVGVFKNGRVE 64 HLGGEDFDQRVMEHFI 118 GERPLTKDNHLLGTFD 11 SCVGVFKNGRVEIIAN 65 EDFDQRVMEHFIKLYK 119 LTKDNHLLGTFDLTGI 12 VFKNGRVEIIANDGGN 66 QRVMEHFIKLYKKKTG 120 NHLLGTFDLTGIPPAP 13 GRVEIIANDGGNRITP 67 EHFIKLYKKKTGKDVR 121 GTFDLTGIPPAPRGVP 14 IIANDGGNRITPSYVA 68 KLYKKKTGKDVRKDNR 122 LTGIPPAPRGVPQIEV 15 DGGNRITPSYVAFTPE 69 KKTGKDVRKDNRAVQK 123 PPAPRGVPQIEVTFEI 16 RITPSYVAFTPEGERL 70 KDVRKDNRAVQKLRRE 124 RGVPQIEVTFEIDVNG 17 SYVAFTPEGERLIGDA 71 KDNRAVQKLRREVEKA 125 QIEVTFEIDVNGILRV 18 FTPEGERLIGDAAKNQ 72 AVQKLRREVEKAKRAL 126 TFEIDVNGILRVTAED 19 GERLIGDAAKNQLTSN 73 LRREVEKAKRALSSQH 127 DVNGILRVTAEDKGTG 20 IGDAAKNQLTSNPENT 74 VEKAKRALSSQHQARI 128 ILRVTAEDKGTGNKNK 21 AKNQLTSNPENTVFDA 75 KRALSSQHQARIEIES 129 TAEDKGTGNKNKITIT 22 LTSNPENTVFDAKRLI 76 SSQHQARIEIESFFEG 130 KGTGNKNKITITNDQN 23 PENTVFDAKRLIGRTW 77 QARIEIESFFEGEDFS 131 NKNKITITNDQNRLTP 24 VFDAKRLIGRTWNDPS 78 EIESFFEGEDFSETLT 132 ITITNDQNRLTPEEIE 25 KRLIGRTWNDPSVQQK 79 FFEGEDFSETLTRAKF 133 NDQNRLTPEEIERMVN 26 GRTWNDPSVQQKIKFL 80 EDFSETLTRAKFEELN 134 RLTPEEIERMVNDAEK 27 NDPSVQQKIKFLPFKV 81 ETLTRAKFEELNMDLF 135 EEIERMVNDAEKFAEE 28 VQQKIKFLPFKVVEKK 82 RAKFEELNMDLFRSTM 136 RMVNDAEKFAEEDKKL 29 IKFLPFKVVEKKTKPY 83 EELNMDLFRSTMKPVQ 137 DAEKFAEEDKKLKERI 30 PFKVVEKKTKPYIQVD 84 MDLFRSTMKPVQKVLE 138 FAEEDKKLKERIDTRN 31 VEKKTKPYIQVDIGGG 85 RSTMKPVQKVLEDSDL 139 DKKLKERIDTRNELES 32 TKPYIQVDIGGGGTKT 86 KPVQKVLEDSDLKKSD 140 KERIDTRNELESYAYS 33 IQVDIGGGQTKTFAPE 87 KVLEDSDLKKSDIDEI 141 DTRNELESYAYSLKNQ 34 IGGGQTKTFAPEEISA 88 DSDLKKSDIDEIVLVG 142 ELESYAYSLKNQIGDK 35 QTKTFAPEEISAMVLT 89 KKSDIDEIVLVGGSTR 143 YAYSLKNQIGDKEKLG 36 FAPEEISAMVLTKMKE 90 IDEIVLVGGSTRIPKI 144 LKNQIGDKEKLGGKLS 37 EISAMVLTKMKETAEA 91 VLVGGSTRIPKIQQLV 145 IGDKEKLGGKLSSEDK 38 MVLTKMKETAEAYLGK 92 GSTRIPKIQQLVKEFF 146 EKLGGKLSSEDKETME 39 KMKETAEAYLGKKVTH 93 IPKIQQLVKEFFNGKE 147 GKLSSEDKETMEKAVE 40 TAEAYLGKKVTHAVVT 94 QQLVKEFFNGKEPSRG 148 SEDKETMEKAVEEKIE 41 YLGKKVTHAVVTVPAY 95 KEFFNGKEPSRGINPD 149 ETMEKAVEEKIEWLES 42 KVTHAVVTVPAYFNDA 96 NGKEPSRGINPDEAVA 150 KAVEEKIEWLESHQDA 43 AVVTVPAYFNDAQRQA 97 PSRGINPDEAVAYGAA 151 EKIEWLESHQDADIED 44 VPAYFNDAQRQATKDA 98 INPDEAVAYGAAVQAG 152 WLESHQDADIEDFKAK 45 FNDAQRQATKDAGTIA 99 EAVAYGAAVQAGVLSG 153 HQDADIEDFKAKKKEL 46 QRQATKDAGTIAGLNV 100 YGAAVQAGVLSGDQDT 154 DIEDFKAKKKELEEIV 47 TKDAGTIAGLNVMRII 101 VQAGVLSGDQDTGDLV 155 FKAKKKELEEIVQPII 48 GTIAGLNVMRIINEPT 102 VLSGDQDTGDLVLLDV 156 KKELEEIVQPIISKLY 49 GLNVMRIINEPTAAAI 103 DQDTGDLVLLDVCPLT 157 EEIVQPIISKLYGSGG 50 MRIINEPTAAAIAYGL 104 GDLVLLDVCPLTLGIE 158 QPIISKLYGSGGPPPT 51 NEPTAAAIAYGLDKRE 105 LLDVCPLTLGIETVGG 159 SKLYGSGGPPPTGEED 52 AAAIAYGLDKREGEKN 106 CPLTLGIETVGGVMTK 160 GSGGPPPTGEEDTSEK 53 AYGLDKREGEKNILVF 107 LGIETVGGVMTKLIPR 161 PPPTGEEDTSEKDEL 54 DKREGEKNILVFDLGG 108 TVGGVMTKLIPRNTV

80
Table 5.II Peptide Pool of GRP78 Peptide Library.
I II III IV V VI VII VIII IX X XI XII XIII
XIV 1 2 3 4 5 6 7 8 9 10 11 12 13
XV 14 15 16 17 18 19 20 21 22 23 24 25 26
XVI 27 28 29 30 31 32 33 34 35 36 37 38 39
XVII 40 41 42 43 44 45 46 47 48 49 50 51 52
XVIII 53 54 55 56 57 58 59 60 61 62 63 64 65
XIX 66 67 68 69 70 71 72 73 74 75 76 77 78
XX 79 80 81 82 83 84 85 86 87 88 89 90 91
XXI 92 93 93 94 95 96 97 98 99 100 101 102 103
XXII 104 105 106 107 108 109 110 111 112 113 114 115 116
XXIII 117 118 119 120 121 122 123 124 125 126 127 128 129
XXIV 130 131 132 133 134 135 136 137 138 139 140 141 142
XV 143 144 145 146 147 148 149 150 151 152 153 154 155
XVI 156 157 158 159 160 161

81
5.2.2 Freshly ATP 8-AH purified GRP78 is antigenic to the BDC-2.5 T cell clone.
GRP78 was purified by taking advantages of its ATP binding domain. Freshly thapsigargin-
treated NIT-1 cells were lysed and subjected to an ATP column. The resultant elution was silver
stained, immunoblotted, and put into a BDC-2.5 T cell assay. Purified GRP78 from
Thapsigargin treated NIT-1 cells resulted in the stimulation of the BDC-2.5 T cell (Figure 5.1).
Due to preparation-to-preparation variability in T cell assays, the same purified sample was
utilized for a repeat assay (126). After the preparation underwent a freeze-thaw, it was no longer
antigenic for the BDC-2.5 T cell clone (data not shown). I performed another set of biochemical
assays, i.e. silver stains and immunoblots, to correlate with the results of the BDC-2.5 T cell
assay. Serendipitously, both silver stains (Figure 5.2) and immunoblots (Figure 5.3)
demonstrated a loss of the high MW band that was present in the antigenic elution that correlated
with the loss of IFN-γ production by the BDC-2.5 T cell clone.

82
Figure 5.1 BDC-2.5 T cell assay of purified GRP78 from NIT-1 thapsigargin treated lysates. NIT-1 cells were treated with thapsigargin for 1 hour at 5µM. Cells were immediately lysed and purified using ATP 8-AH sepharose purification columns. Solid bars represent purified protein that was freshly assessed for antigenic by BDC-2.5 T cell assay, silver stain, and immunoblot. ELISA for IFN-γ was preformed to detect activation of the BDC-2.5 T cell clone. Mimo, positive control; Thaps, 5uM thapsigargin treatment of NIT-1 cells.
Purified GRP78

83
Figure 5.2 Silver Stain of purified GRP78 from NIT-1 thapsigargin treated lysates. NIT-1 cells were treated with thapsigargin for 1 hour at 5µM. Cells were immediately lysed and purified using ATP 8-AH sepharose purification columns. Lane A was freshly assessed for antigenic by BDC-2.5 T cell assay, silver stain, and immunoblot. Lane B underwent a freeze-thaw before assessment of antigenic by BDC-2.5 T cell assay, silver stain, and immunoblot.

84
Figure 5.3 Immunoblot of purified GRP78 from NIT-1 thapsigargin treated lysates. NIT-1 cells were treated with thapsigargin for 1 hour at 5µM. Cells were immediately lysed and purified using ATP 8-AH sepharose purification columns. Lane A was freshly assessed for antigenicity by BDC-2.5 T cell assay, silver stain, and immunoblot. Membrane was probed with Santa Cruz (C-20) GRP78 antibody. Lane B underwent a freeze-thaw before assessment of antigenicity by BDC-2.5 T cell assay, silver stain, and immunoblot. Membrane was probed with Santa Cruz (N-20) GRP78 antibody.

85
Figure 5.4 Thapsigargin alters antibodies ability to detect GRP78 pulled down by BDC-2.5 TCR-Tg. HeLa cells were treated with thapsigargin, 1 hour at either 0, 1, or 5 µM. Cells were lysed. Lysates were immunoprepicated with BDC-2.5 TCR-Tg serum overnight. The pulled down (IP) proteins were separated along side whole cell lysate (WCL). Pulled down proteins were probed with Santa Cruz anti-GRP78 (N-20), (C-20), (H-129). Whole cell lysates were probed with Santa Cruz anti-GRP78 (N-20) and actin. Membranes were stained with ponceau S before blocking and probing.

86
5.2.3 Thapsigargin treatment alters antibody recognition to GRP78 in HeLa cells.
Due to the poor cross-reactivity of the Stressgen anti-hamster GRP78 to human GRP78, I used
anti-GRP78 antibodies from Santa Cruz to detect GRP78 in the human HeLa cell line. I
performed immunoprecipitations on thapsigargin treated HeLa with BDC-2.5 TCR-Tg serum.
The BDC-2.5 TCR-Tg serum successfully pulled down a 70 kDa protein corresponding to
GRP78 as shown with ponceau S stain (Figure 5.4). Immunoblots of whole cell lysates showed
that GRP78 was present in the lysate, however, attempts to probe the pulled down protein with
three different Santa Cruz anti-GRP78 antibodies only yielded substantial detection of GRP78 in
the untreated condition. The various antibodies recognize varying degrees of the GRP78 from
thapsigargin treated NIT-1 cells, however, none of the antibodies recognize all of the GRP78
which is detected via ponceau S stain.
5.2.4 N-linked and O-linked glycosylation does not play a role in induction of antigenicity.
The inability to elicit a strong IFN-γ response with the overlapping peptides from GRP78
combined with the antibody data, led us to speculate that a post translational modification of the
protein was occurring that was responsible for the antigenic recognition by BDC-2.5. To assess
the role of PTM via glycosylation, I treated NIT-1 cells with tunicamycin, an inhibitor of N-
linked glycosylation. The results demonstrated that N-linked glycosylation was not responsible
for induction of antigenicity, since there was no change in IFN-γ production (data not shown)
when NIT-1 cells were treated with thapsigargin and tunicamycin and then co-cultured in a
BDC-2.5 T cell assay. In Figure 5.5, NIT-1 cells untreated and treated have numerous proteins
that have sites of O-linked glycosylation; therefore I removed the O-linked glycosylation with

87
sodium hydroxide (Figure 5.5) and used the modified GRP78 protein in a T cell assay with
BDC-2.5. I was not able to correlate the removal of O-linked glycosylation with antigenicity
from the BDC-2.5 T cell clone.
Figure 5.5 Removal of O-linked glycosylation sites on GRP78. NIT-1 cells were treated with thapsigargin, 1 hour at 5µM. Cells were lysed. Lysates were incubated with sodium hydroxide to deglycosylate proteins. Acetic acid was added to terminate the reaction either immediately after the addition of sodium hydroxide or after 3 hr incubation. Lysates were separated. Membranes were probed with either Stressgen anti-GRP78 or anti-O-linked glycosylation antibody.

88
5.2.5 GRP78 is citrullinated in NIT-1 cells.
With the current literature demonstrating the role of citrullination of proteins leading to increased
self-recognition of proteins in RA, I explored this PTM as a possible mechanism of
neoantigenicity. Citrullinated GRP78 was detected in NIT-1 lysates, however, there was no
correlation between untreated and 5mM thapsigargin (data not shown). Additionally, the BDC-
2.5 TCR-Tg serum did not remove all the citrullinated GRP78 as there was still detection of
citrullinated GRP78 in the supernatant (Figure 5.6A). There was a dramatic change in the
molecular weight of purified GRP78 following treatment with PAD, the enzyme that catalyzes
the citrullination reaction (Figure 5.6B). This did not correlate with changes in the antigenic
response by the BDC-2.5 T cell clone (Figure 5.6C).

89
Figure 5.6 GRP78 is citrullinated. (A) NIT-1 cells were treated with thapsigargin, 1 hour at 5µM. Cells were lysed. Lysates were immunoprepicated with BDC-2.5 TCR-Tg serum overnight. The supernatants (sup) and pulled down (IP) proteins were separated. GRP78 was detected using anti-GRP78 from Stressgen. Citrullination was detected by use of Upstate Citrullination Detection Kit according to manufacture's instructions. (B) Citrullinated GRP78 was separated. Membranes were stained with ponceau S to determine if there was a change in the molecular weight after PAD treatment. (un) untreated. (cit) treated with PAD. (C) Citrullinated GRP78 was assayed with BDC-2.5 T cell clone. Commercial available purified GRP78 was treated with PAD to induce citrullination. Mimotope was used as a positive control.
5.2.6 Phosphorylation of serine residues.
Through immunoblots, I determined the phosphorylation profile of GRP78 in NIT-1 and HeLa
(Figure 5.7A). GRP78 in both NIT-1 and HeLa contain phospho-tyrosine, threonine, and serine.
I immunoprecipitated fresh lysates with the BDC-2.5 TCR Tg serum to determine if the serum
antibodies were specific for a phosphorylation modification. Probing back with a phospho-

90
serine specific antibody, it was determined that the BDC-2.5 TCR Tg antibody recognizes a
phospho-serine site(s) on GRP78 (Figure 5.7B).

91
Figure 5.7 Phosphoserine is specific to GRP78 pulled down by BDC-2.5 TCR-Tg. NIT-1 and HeLa cells were treated with thapsigargin, 1 hour at 5µM. Cells were lysed. Untreated (un) and treated lysates were immunoprepicated with BDC-2.5 TCR-Tg serum overnight. (A) Whole cell lysates, (B) supernatants (sup) and pulled down (IP) proteins were separated. GRP78 was detected using anti-GRP78 (Santa Cruz N-20). Phosphoserine (P-ser), phosphotyrosine (P-tyr) and phosphothreonine (P-thr) were detected with Sigma phospho-specific antibodies. Actin was probed as a loading control for whole cell lysates.

92
5.3 DISCUSSION
Although, the BDC-2.5 T cell clone helps B cells to produce antibody to GRP78, recombinant
expressed GRP78 does not elicit a response by the BDC-2.5 T cell clone (unpublished data,
Schreiner et al). Freshly purified GRP78 from thapsigargin treated NIT-1 cells does lead to IFN-
γ production by the BDC-2.5 T cell clone, however, after a freeze-thaw the purified protein
losses antigenicity. Leustek et al determined that the in vivo and in vitro phosphorylation pattern
of GRP78 is different (127). In vivo GRP78 has sites of phosphothreonine and phosphoserine,
however, upon certain purification methods or in vitro, sites of phosphoserine are lost. There is
evidence to support that the BDC-2.5 TCR-Tg antibodies clearly recognize a phosphoserine as
phosphoserine GRP78 is void in the supernatant.
It cannot be ruled out that multiple PTM are necessary for GRP78 becoming antigenic. It
has been proposed that citrullination leads to neoantigens because previously hidden epitopes
become available. Due to the enzymatic conversion of arginine to citrulline, there is a change in
charge from positive to neutral. This change leads to alterations in intramolecular protein
binding causing the protein to unfold or fold differently.
Through immunoblot analysis I confirmed previous studies, which demonstrate
biochemically purified GRP78 is modified to contain phosphoserine (127-129). It appears
phosphoserine plays a critical role in the BDC-2.5 TCR-Tg serum being able to recognize
GRP78 as the GRP78 remaining in the supernatant after clearing lysates with BDC-2.5 TCR-Tg
sera is void of detectable phosphoserine. The limitations of immunoblot does not allow us to

93
identify how many or what serines are phosphorylated. Additionally, I was not able to determine
if there are changes to phosphorylation sites with thapsigargin treatment. Identification of
specific posttransitional modifications for individual amino acids can be achieved by various
mass spectrometry techniques.
The BDC-2.5 TCR-Tg sera has poor affinity for denatured GRP78, evidence that it
recognizes a conformational epitope. Conformational epitopes are against 15-22 protein residues
that are scattered over two or more discontinuous polypeptide segments (130, 131). In infectious
diseases, i.e. equine infectious anemia virus (EIAV) and parvovirus, the initial antibody response
is to linear epitopes, however, over time there is a shift and selection for antibodies that
recognize conformational epitopes indicative of a mature immune response (132, 133). By the
time a patient has clinical symptoms of diabetes, the immune response has been on going with
the majority of beta cells already destroyed. In some cases the immune response may have been
initiated months or years prior (3). Currently it is believed that in autoimmunity the majority of
autoantibodies are to conformational epitope (131), though, it is not clear if autoimmune diseases
go through the same linear to conformational maturation of antibody production as infectious
diseases, due to the inability to properly monitor antibody production in autoimmune individuals.
Epitope mapping using a GRP78 peptide library modified to contain phosphoserine is a
way to identify whether the B cell epitope for the BDC-2.5 TCR-Tg sera is against a linear or
conformational epitope. The BDC-2.5 antibody may sufficiently bind a modified peptide to
identify a portion of the B cell epitope. Phage library screening has been successful in
identifying conformational epitopes (130).
It is unclear if the T cell receptor sees the same epitope as the B cell receptor. The
GRP78, which the B cell internalizes, processes, and presents to the BDC-2.5 T cell, contains

94
phosphoserines. The binding surface that is antigenic to the BDC-2.5 may contain different sites
of modification, such as phosphothreonine, citrulline, o-linked glycosylation, all of which I
demonstrate occur in NIT-1 treated with thapsigargin, than that which are required for B cell
recognition. Presented within the antigen-binding groove of MHC molecules, T cell epitopes are
short linear peptides (131). A GRP78 peptide library that has been modified to contain PTMs
should yield the identification of the BDC-2.5 T cell epitope along with the necessary PTM for
antigenicity.
Even though the window of disease transfer with the BDC-2.5 is early in mouse postnatal
development, it remains to be determined what role the BDC-2.5 T cell and its cognate antigen,
GRP78, plays in the initiation and progression of T1D. Furthermore, GRP78 and ER stress may
be shown to the common link between the many potential environmental triggers proposed to
initiate T1D. Additionally, these findings may lead to potential therapies to eliminate the
immune response to GRP78 during events of ER stress. Other autoimmune diseases and ER
stress disorders may benefit from application of potential therapies.

95
6.0 CONCLUSIONS
6.1 PROPOSED MODEL OF GRP78 AND BDC-2.5 INTERACTION
As the proposed model in Figure 6.1 shows, individuals with a genetic predisposition to
developing diabetes have poor central and peripheral regulation of lymphocytes allowing
autoreactive T and B cells in circulation. Islet beta cells, as stated, are incredibly sensitive to
ER perturbation and their continuous need to produce, package and secrete insulin upon glucose
stimulated signaling provides a nonstop strain of protein production that is poised to ER stress.
In combination with environmental triggers such as viral infection, chemical toxins, or food
exposure, ER stress is further exacerbated leading to increased GRP78 production. Changes in
calcium levels in the ER lead to the release of GRP78 and the initiation of the UPR and ER
dysregulation. Increased levels of GRP78 are produced in an effort to control protein packaging
and processing problems that occur during exposure to viruses, chemicals, and foods that
inducescellular stresses such as oxidative stress. The upregulation and PTM of GRP78 alters this
protein enough for the immune system of genetically predisposed individuals to see this self-
protein as foreign. Modified GRP78 is engulfed by APCs that process and present peptide
fragments to circulating T cells. The BDC-2.5 T cell becomes activated upon being presented its
antigen peptide. The activated BDC-2.5 T cell proliferates and produces IFN-γ leading to the
recruitment of accessory cells to the islets, which initiates islet-beta cell destruction. Following

96
presentation of its antigenic epitope, the activated T cell will lend help to the presenting B cell.
The B cell matures into a plasma cell and secretes IgG antibodies. The immune system will
utilize these antibodies in antibody dependent cell cytotoxicity.

97
Figure 6.1 Proposed Model of GRP78 and BDC-2.5 Interaction.

98
6.2 EVIDENCE TO SUPPORT THE MODEL OF INTERACTION
Identification of a common link between environmental triggers, i.e. viral infection, chemical
and food exposure, would provide tremendous insight to the pathogenesis of T1D. The presence
of BDC-2.5 T cell’s antigen has been previously demonstrated in a number of environmental
triggers with the activation of the BDC-2.5 T cell clone. There is also increasing evidence for
ER stress, more specially GRP78, playing a role in environmental triggers. The cell attempts to
protect itself from apoptosis initiated by environmental triggers leads to the upregulation of
neoantigens, such as GRP78.
Although GRP78 is expressed in numerous cell types, beta cells have inherently elevated
levels of GRP78 as a result of their role as secretory cells constantly undergoing ER stress.
Iwawaki et al demonstrated that the pancreas is the first organ with massive ER stress using the
“ER stress-activated indicator” (ERAI) mouse model (68). The onset of massive pancreatic ER
stress coincided with the reported window in which the BDC-2.5 T cell clone can transfer
diabetes in the NOD and NOD.scid mice. After this window, initiation of cellular damage with a
cotransfer of diabetic CD8+ T cells must accompany the BDC-2.5 T cells to lead to insulitis and
hyperglycemia (85).
Streptozotocin (STZ), a drug commonly used in TID research to abolish the beta cell
mass, allows for synchronized onset of diabetes and may mimic the environmental trigger of
chemical exposure. The BDC-2.5 T cells activate and drain to the pancreatic lymph node within
66 hours of being adoptively transferred into STZ treated NOD mice (96). Exposure of NIT-1

99
cells to STZ leads to upregulation of GRP78 as a protective mechanism against cell death (111).
Caspase-12 mediated death is necessary for the release of the BDC-2.5 T cell antigen as blocking
of caspase-mediated death by using either benzyloxylcarbonyl-V-A-D-O-methyl fluoromethyl
ketone (ZVAD) or caspase-12 knockout mice resulted in the BDC-2.5 T cell not becoming
activated (96). ER stress-apoptosis mediated through caspase-12 may be a mechanism that
allows for the release and presentation of modified GRP78.
The model lends rationale to my hypothesis that dysregulation in beta cell function as a
result of various environmental triggers leads to increased ER stress, upregulation and PTM of
GRP78, and subsequent aberrant recognition of GRP78 by the immune system that initiates T1D.
Evidence that supports this comes from studies of viral infections, specifically coxsackievirus B4
(CVB4), which have shown homology exists between viral and self-protein sequences, CVB4-
2C and GAD65 for instance (16, 17). Furthermore, Horwitz et al demonstrates that the BDC-2.5
TCR-Tg mice develop extensive insulitis and overt diabetes when infected with CVB4 (112).
Although, the role of GRP78 has not been shown with CVB4 viral strain, GRP78 has been
identified as a surface coreceptor in other coxsackeivirus (A9) infections (134).
The mechanism of food exposure as an environmental trigger of T1D has been associated
with BDC-2.5 T cell activation. In studies performed by Turley et al, mice were fed dextran
sodium sulfate (DSS) to mimic large intestine injury that occurs during inflammation caused by
food exposure (135). Following treatment with DSS, NOD mice were adoptively transferred
with purified BDC-2.5/NOD T cells. Even though the cellular damage occurred in the gut,
activated BDC-2.5 T cells were located in the pancreatic lymph node. Additionally, treatment of
BDC-2.5/NOD animals with DSS resulted in a higher frequency of insulitis compared to control
mice. DSS is commonly used in colitis studies for diseases such Crohn’s, Celiac, and

100
inflammatory bowel disease (IBD). Mice treated with DSS have increased GRP78 expression in
their colons (136). Examination of human colons from individuals with colitis and Crohn’s
disease also demonstrates evaluated levels of GRP78 (137).
The literature outlined above illustrates the strong parallels between the BDC-2.5 antigen,
GRP78, ER stress and, T1D environmental triggers. In order to confirm that ER stress, more
specially GRP78, is the common link between T1D environmental triggers, future experiments
should use the NOD mice and tissue from diabetic humans to dissect ER stress and GRP78’s role
in the development of T1D.
6.3 FUTURE DIRECTIONS OF RISAT TECHNIQUE
The technique of Restricted Immune System via Adoptive Transfer (RISAT) was utilized to
drive an antibody response specific to a single T cell clone. A single T cell clone is adoptively
transferred into an immunologically compatible immunodeficient mouse followed by an adoptive
transfer of an open repertoire of immunologically compatible B cells. The RISAT animal is then
immunized with antigenic protein preparations to elicit an immune response from both the T and
B cells. B cells that receive T cell help will isotype switch to express IgG antibodies. These IgG
antibodies recognize only antigen that both the B cell and the single T cell clone bind and can be
used to identify the T cell’s antigen.
There are still a number of diabetogenic T cell clones from the NOD mice with unknown
antigens. The BDC-6.9 T cell clone was developed with the BDC-2.5 T cell. RISAT is being
utilized to identify candidate autoantigens for the clone. Preliminary results show antibodies that
detect protein bands at 55 and 33 kDa (unpublished data).

101
The simplicity of the RISAT system allows for it to be utilized in various disease models.
RISAT would allow for the identification of a primary T cell clone’s antigen without the
expensive and time intensive techniques currently used, such as peptide or phage library
screening (130, 131). Additionally, antibodies produced in RISAT animals can be utilized in
biochemical assays such as immunoprecipitations and immunoblots. Skin lesions caused by
infiltrating leukocytes characterize lupus. The MRL.lpr mice spontaneously develop skin lesions
between 3 and 6 months of age (138). T cells isolated and expanded form these skin lesions can
be used for RISAT in an immunologically compatible immunodeficient mouse. RISAT mice
would be immunized using skin cells from the lesion site. The resulting antibodies would then
be used to identify the isolated T cell antigen and expression patterns of the antigen through
immunofluoresence, in addition to immunoblots to determine the antigen’s expression in other
tissues.
6.4 FUTURE DIRECTIONS FOR GRP78 AND TYPE 1 DIABETES
To further confirm that GRP78 is the antigen for the BDC-2.5 T cell clone, additional BDC-2.5
T cell assays with purified GRP78 from thapsigargin treated NIT-1 cells should be performed.
Results should be correlated with silver stain and immunoblot to determine the purity of the
purified GRP78. Furter, if in vitro serine phosphorylation of non-antigenic purified GRP78
causes these preparations to become antigenic that would provide strong evidence for the role of
phosphorylation in the neo-antigenic of GRP78.
Identification of GRP78 antibody epitopes will provide insight on how GRP78 becomes
an autoantigen. Immunoprecipitations with the BDC-2.5 TCR Tg serum demonstrate that sites

102
of phosphoserine are important to the recognition of GRP78 by the antibodies. Additionally,
binding sites of commercially available GRP78 antibodies are blocked by thapsigargin treatment
(Figure 5.4). Epitope mapping of the commercial antibody-binding sites will allow us to target a
smaller region of the protein. The existing peptide library shown in Table 5.I and 5.II can be
used to epitope map the binding sites of the commercial antibodies as these antibodies are to
unmodified peptide. Briefly, epitope mapping can be conducted by immobilizing peptide pools
to wells of an ELISA plate. Commercial antibodies will be added to the well and allowed to
bind to the immobilized peptides. A secondary antibody will be used to detect which peptide
pools the commercial antibodies are able to bind.
As the T cell initiates the antigen-driven immune response, identification of the epitope
responsible for the T cell response will allow for potential therapeutic targets. With the
identification of the commercial antibodies’ binding sites, there will be a limited number of
peptides to further explore as candidate BDC-2.5 T cell epitopes. These candidate peptides
should be chemically modified to contain phosphoserine as this PTM is specific to a subset of
GRP78 and then tested against the BDC-2.5 T cell clone to determine which candidate peptides
contain the T cell epitope.
The expression pattern of GRP78 should be determined, as this will provide information
on the pathogenesis of how GRP78 is seen by the immune system. It has been reported that
GRP78 acts as a surface receptor. If GRP78 is localized on the surface of the cells, this could be
the mechanism that allows the immune system to recognize the resident ER protein. The
expression patterns of GRP78 in different mouse strains, i.e. NOD, ALR, NOR, are of particular
interest. Immunofluoresence analysis can be conducted with the BDC-2.5 TCR Tg serum.
Additionally, it remains to be seen whether GRP78 is an autoantigen for human T1D. Screening

103
of T1D patients at various stages, i.e. recent-onset, 1, and 5 years post diagnosis, and at-risk first
degree relatives for autoantibodies and autoreactive T cells to unmodified and modified GRP78
is critical to show the clinical relevance of my findings.
The diabetes incidence is striking different in the BDC-2.5 TCR-Tg depending on the
background which it is bred onto. On the NOD background, only 10-15% of BDC-2.5/NOD
animals spontaneously develop diabetes. By 3-5 weeks of age 100% of BDC-2.5 mice bred to
the NOD.scid background develop diabetes (63). The BDC-2.5/B6g7 begins to develop diabetes
at 3 weeks of age, with the average onset at 6 weeks. The diabetes incidence at 10 weeks is
approximately 60% in the BDC-2.5/B6g7. BDC-2.5/B6g7 animals that were free of diabetes at 10
weeks of age remain resistant (64). It would be interesting to determine if the B cell epitope is
conserved in the different backgrounds.
The complexity of trying to decrease GRP78 levels will make therapies directed at
GRP78 expression less than ideal. In attempts to deplete GRP78 with dsRNAi, Quian et al failed
to completely deplete GRP78 protein levels (139). There is a feedback mechanism that regulates
GRP78. I encountered this when I tried to block GRP78 expression with siRNA. Immunoblots
showed that the siRNA treatments actually upregulated GRP78, which correlated with increase
IFN-γ production by the BDC-2.5 T cell clone when incubated with siRNA treated NIT-1 cells
(data not shown). Additionally, GRP78-/- (knockout) mice are embryonic lethal demonstrating
how essential GRP78 is for cell survival (140). Therapies that quell ER stress may have success,
since the activation of ER stress is what leads to increased and modified GRP78, thus promoting
antigenic recognition by the immune system.
Although, the window of disease transfer with the BDC-2.5 T cell clone is early in
postnatal development, the BDC-2.5 T cell clone has not been demonstrated to be the initiating T

104
cell for development of T1D. Strategies to remove the BDC-2.5 T cell clone from the NOD
mouse and determine if diabetes onset is altered should be explored to identify the relevance of
GRP78 as an initiating antigen in T1D. Use of the tetramer antibody that binds to the TCR of the
BDC-2.5 T cell may be one way to selectively eliminate the BDC-2.5 T cell. Complexing of
FasL to the tetramer antibody could result in the selectively killing of the BDC-2.5 T cell
allowing for the assessment of how diabetes progressions in the absence of the BDC-2.5 T cell.
If GRP78 is shown to be an initiating antigen, vaccine development against this protein
should yield protection against the development of T1D. As improvements are made in
identifying individuals that will become diabetic, a vaccine to build tolerance against early
autoantigens would be beneficial. A vaccine for GRP78 could potentially be used for other
autoimmune diseases as RA, MS, and lupus have been shown to have GRP78 specific T cells
(83, 125) (141).

105
6.5 FINDINGS OF THE THESIS
In conclusion, the work presented in this thesis has demonstrated the following:
(1) BDC-2.5 T cell drives antibody production to GRP78 both in the novel technique
RISAT and in the BDC-2.5 TCR Tg mouse model.
(2) The BDC-2.5 TCR-Tg antibody recognizes a subset of GRP78, which likely contains
the posttranslational modification, phosphorylation, specifically serine phosphorylation.
(3) Additionally, after induction of ER stress and upregulation of GRP78 by thapsigargin
treatment, the non-antigenic NIT-1 cell line is able to initiate IFN-γ production from the BDC-
2.5 T cell clone.
(4) The role of ER stress, GRP78, in the development of T1D is beginning to be
elucidated and may be shown to be the common link between the various environmental triggers
and the progression to T1D.

106
BIBLIOGRAPHY
1. Eisenbarth, G. S. 2007. Update in type 1 diabetes. The Journal of clinical endocrinology and metabolism 92:2403-2407.
2. Jahromi, M. M., and G. S. Eisenbarth. 2007. Cellular and molecular pathogenesis of type 1A diabetes. Cell Mol Life Sci 64:865-872.
3. Notkins, A. L., and A. Lernmark. 2001. Autoimmune type 1 diabetes: resolved and unresolved issues. The Journal of clinical investigation 108:1247-1252.
4. Goudy, K. S., and R. Tisch. 2005. Immunotherapy for the prevention and treatment of type 1 diabetes. International reviews of immunology 24:307-326.
5. Shapiro, A. M., J. R. Lakey, E. A. Ryan, G. S. Korbutt, E. Toth, G. L. Warnock, N. M. Kneteman, and R. V. Rajotte. 2000. Islet transplantation in seven patients with type 1 diabetes mellitus using a glucocorticoid-free immunosuppressive regimen. The New England journal of medicine 343:230-238.
6. Hirshberg, B., K. I. Rother, and D. M. Harlan. 2003. Islet transplantation: where do we stand now? Diabetes/metabolism research and reviews 19:175-178; discussion 175.
7. Rood, P. P., L. H. Buhler, R. Bottino, M. Trucco, and D. K. Cooper. 2006. Pig-to-nonhuman primate islet xenotransplantation: a review of current problems. Cell transplantation 15:89-104.
8. Gottlieb, P. A., and G. S. Eisenbarth. 1998. Diagnosis and treatment of pre-insulin dependent diabetes. Annual review of medicine 49:391-405.
9. Graham, J., I. Kockum, C. B. Sanjeevi, M. Landin-Olsson, L. Nystrom, G. Sundkvist, H. Arnqvist, G. Blohme, F. Lithner, B. Littorin, B. Schersten, L. Wibell, J. Ostman, A. Lernmark, N. Breslow, and G. Dahlquist. 1999. Negative association between type 1
107
diabetes and HLA DQB1*0602-DQA1*0102 is attenuated with age at onset. Swedish Childhood Diabetes Study Group. Eur J Immunogenet 26:117-127.
10. Bottini, N., L. Musumeci, A. Alonso, S. Rahmouni, K. Nika, M. Rostamkhani, J. MacMurray, G. F. Meloni, P. Lucarelli, M. Pellecchia, G. S. Eisenbarth, D. Comings, and T. Mustelin. 2004. A functional variant of lymphoid tyrosine phosphatase is associated with type I diabetes. Nature genetics 36:337-338.
11. Ueda, H., J. M. Howson, L. Esposito, J. Heward, H. Snook, G. Chamberlain, D. B. Rainbow, K. M. Hunter, A. N. Smith, G. Di Genova, M. H. Herr, I. Dahlman, F. Payne, D. Smyth, C. Lowe, R. C. Twells, S. Howlett, B. Healy, S. Nutland, H. E. Rance, V. Everett, L. J. Smink, A. C. Lam, H. J. Cordell, N. M. Walker, C. Bordin, J. Hulme, C. Motzo, F. Cucca, J. F. Hess, M. L. Metzker, J. Rogers, S. Gregory, A. Allahabadia, R. Nithiyananthan, E. Tuomilehto-Wolf, J. Tuomilehto, P. Bingley, K. M. Gillespie, D. E. Undlien, K. S. Ronningen, C. Guja, C. Ionescu-Tirgoviste, D. A. Savage, A. P. Maxwell, D. J. Carson, C. C. Patterson, J. A. Franklyn, D. G. Clayton, L. B. Peterson, L. S. Wicker, J. A. Todd, and S. C. Gough. 2003. Association of the T-cell regulatory gene CTLA4 with susceptibility to autoimmune disease. Nature 423:506-511.
12. Melanitou, E. 2005. The autoimmune contrivance: genetics in the mouse model. Clinical immunology (Orlando, Fla 117:195-206.
13. Knip, M. 2003. Environmental triggers and determinants of beta-cell autoimmunity and type 1 diabetes. Reviews in endocrine & metabolic disorders 4:213-223.
14. Roivainen, M. 2006. Enteroviruses: new findings on the role of enteroviruses in type 1 diabetes. The international journal of biochemistry & cell biology 38:721-725.
15. Szopa, T. M., T. Ward, D. M. Dronfield, N. D. Portwood, and K. W. Taylor. 1990. Coxsackie B4 viruses with the potential to damage beta cells of the islets are present in clinical isolates. Diabetologia 33:325-328.
16. Vreugdenhil, G. R., M. R. Batstra, H. J. Aanstoot, W. J. Melchers, and J. M. Galama. 1999. Analysis of antibody responses against coxsackie virus B4 protein 2C and the diabetes autoantigen GAD(65). Journal of medical virology 59:256-261.
17. Lonnrot, M., H. Hyoty, M. Knip, M. Roivainen, P. Kulmala, P. Leinikki, and H. K. Akerblom. 1996. Antibody cross-reactivity induced by the homologous regions in glutamic acid decarboxylase (GAD65) and 2C protein of coxsackievirus B4. Childhood Diabetes in Finland Study Group. Clinical and experimental immunology 104:398-405.

108
18. Romagnani, S. 2004. The increased prevalence of allergy and the hygiene hypothesis: missing immune deviation, reduced immune suppression, or both? Immunology 112:352-363.
19. Dejkhamron, P., R. K. Menon, and M. A. Sperling. 2007. Childhood diabetes mellitus: recent advances & future prospects. The Indian journal of medical research 125:231-250.
20. Van Regenmortel, M., K. Boven, and F. Bader. 2005. Immunogenicity of Biopharmaceuticals: An Example from Erythropoietin:
Protein structure, contaminants, formulation, container, and closure all can affect the immunogenicity of the product. BioPharm International.
21. Kyewski, B., and L. Klein. 2006. A central role for central tolerance. Annual review of immunology 24:571-606.
22. Hogquist, K. A., T. A. Baldwin, and S. C. Jameson. 2005. Central tolerance: learning self-control in the thymus. Nat Rev Immunol 5:772-782.
23. Dosch, H., R. K. Cheung, W. Karges, M. Pietropaolo, and D. J. Becker. 1999. Persistent T cell anergy in human type 1 diabetes. J Immunol 163:6933-6940.
24. Chiodetti, L., S. Choi, D. L. Barber, and R. H. Schwartz. 2006. Adaptive tolerance and clonal anergy are distinct biochemical states. J Immunol 176:2279-2291.
25. Schwartz, R. H. 2003. T cell anergy. Annual review of immunology 21:305-334.
26. Rouse, B. T. 2007. Regulatory T cells in health and disease. Journal of internal medicine 262:78-95.
27. Banham, A. H., F. M. Powrie, and E. Suri-Payer. 2006. FOXP3+ regulatory T cells: Current controversies and future perspectives. European journal of immunology 36:2832-2836.
28. Seddiki, N., B. Santner-Nanan, J. Martinson, J. Zaunders, S. Sasson, A. Landay, M. Solomon, W. Selby, S. I. Alexander, R. Nanan, A. Kelleher, and B. Fazekas de St Groth. 2006. Expression of interleukin (IL)-2 and IL-7 receptors discriminates between human regulatory and activated T cells. The Journal of experimental medicine 203:1693-1700.

109
29. Fontenot, J. D., M. A. Gavin, and A. Y. Rudensky. 2003. Foxp3 programs the development and function of CD4+CD25+ regulatory T cells. Nat Immunol 4:330-336.
30. Hori, S., T. Nomura, and S. Sakaguchi. 2003. Control of regulatory T cell development by the transcription factor Foxp3. Science 299:1057-1061.
31. Khattri, R., T. Cox, S. A. Yasayko, and F. Ramsdell. 2003. An essential role for Scurfin in CD4+CD25+ T regulatory cells. Nat Immunol 4:337-342.
32. Ziegler, S. F. 2006. FOXP3: of mice and men. Annual review of immunology 24:209-226.
33. Mizoguchi, M., M. Manabe, Y. Kawamura, Y. Kondo, K. Ishidoh, E. Kominami, K. Watanabe, H. Asaga, T. Senshu, and H. Ogawa. 1998. Deimination of 70-kD nuclear protein during epidermal apoptotic events in vitro. J Histochem Cytochem 46:1303-1309.
34. Puccetti, P., and U. Grohmann. 2007. IDO and regulatory T cells: a role for reverse signalling and non-canonical NF-kappaB activation. Nat Rev Immunol 7:817-823.
35. Torgerson, T. R. 2006. Regulatory T cells in human autoimmune diseases. Springer seminars in immunopathology 28:63-76.
36. Janeway, C. 2001. Immunobiology 5 : the immune system in health and disease. Garland Pub., New York.
37. Najafian, N., M. J. Albin, and K. A. Newell. 2006. How can we measure immunologic tolerance in humans? J Am Soc Nephrol 17:2652-2663.
38. Dadgostar, H., B. Zarnegar, A. Hoffmann, X. F. Qin, U. Truong, G. Rao, D. Baltimore, and G. Cheng. 2002. Cooperation of multiple signaling pathways in CD40-regulated gene expression in B lymphocytes. Proceedings of the National Academy of Sciences of the United States of America 99:1497-1502.
39. Snapper, C. M., and W. E. Paul. 1987. Interferon-gamma and B cell stimulatory factor-1 reciprocally regulate Ig isotype production. Science 236:944-947.
40. Stavnezer, J. 1996. Antibody class switching. Advances in immunology 61:79-146.

110
41. Ohashi, P. S. 2002. T-cell signalling and autoimmunity: molecular mechanisms of disease. Nat Rev Immunol 2:427-438.
42. Lieberman, S. M., and T. P. DiLorenzo. 2003. A comprehensive guide to antibody and T-cell responses in type 1 diabetes. Tissue antigens 62:359-377.
43. Leslie, R. D., M. A. Atkinson, and A. L. Notkins. 1999. Autoantigens IA-2 and GAD in Type I (insulin-dependent) diabetes. Diabetologia 42:3-14.
44. Verge, C. F., R. Gianani, E. Kawasaki, L. Yu, M. Pietropaolo, R. A. Jackson, H. P. Chase, and G. S. Eisenbarth. 1996. Prediction of type I diabetes in first-degree relatives using a combination of insulin, GAD, and ICA512bdc/IA-2 autoantibodies. Diabetes 45:926-933.
45. Pietropaolo, M., L. Castano, S. Babu, R. Buelow, Y. L. Kuo, S. Martin, A. Martin, A. C. Powers, M. Prochazka, J. Naggert, and et al. 1993. Islet cell autoantigen 69 kD (ICA69). Molecular cloning and characterization of a novel diabetes-associated autoantigen. The Journal of clinical investigation 92:359-371.
46. Winer, S., I. Astsaturov, R. Gaedigk, D. Hammond-McKibben, M. Pilon, A. Song, V. Kubiak, W. Karges, E. Arpaia, C. McKerlie, P. Zucker, B. Singh, and H. M. Dosch. 2002. ICA69(null) nonobese diabetic mice develop diabetes, but resist disease acceleration by cyclophosphamide. J Immunol 168:475-482.
47. Abulafia-Lapid, R., D. Gillis, O. Yosef, H. Atlan, and I. R. Cohen. 2003. T cells and autoantibodies to human HSP70 in type 1 diabetes in children. Journal of autoimmunity 20:313-321.
48. Cohen, I. R. 2007. Biomarkers, self-antigens and the immunological homunculus. Journal of autoimmunity.
49. Lieberman, S. M., A. M. Evans, B. Han, T. Takaki, Y. Vinnitskaya, J. A. Caldwell, D. V. Serreze, J. Shabanowitz, D. F. Hunt, S. G. Nathenson, P. Santamaria, and T. P. DiLorenzo. 2003. Identification of the beta cell antigen targeted by a prevalent population of pathogenic CD8+ T cells in autoimmune diabetes. Proceedings of the National Academy of Sciences of the United States of America 100:8384-8388.
50. Mukherjee, R., D. Wagar, T. A. Stephens, E. Lee-Chan, and B. Singh. 2005. Identification of CD4+ T cell-specific epitopes of islet-specific glucose-6-phosphatase

111
catalytic subunit-related protein: a novel beta cell autoantigen in type 1 diabetes. J Immunol 174:5306-5315.
51. Yang, J., N. A. Danke, D. Berger, S. Reichstetter, H. Reijonen, C. Greenbaum, C. Pihoker, E. A. James, and W. W. Kwok. 2006. Islet-specific glucose-6-phosphatase catalytic subunit-related protein-reactive CD4+ T cells in human subjects. J Immunol 176:2781-2789.
52. Unger, W. W., G. G. Pinkse, S. Mulder-van der Kracht, A. R. van der Slik, M. G. Kester, F. Ossendorp, J. W. Drijfhout, D. V. Serreze, and B. O. Roep. 2007. Human clonal CD8 autoreactivity to an IGRP islet epitope shared between mice and men. Annals of the New York Academy of Sciences 1103:192-195.
53. Shameli, A., J. Yamanouchi, S. Thiessen, and P. Santamaria. 2007. Endoplasmic reticulum stress caused by overexpression of islet-specific glucose-6-phosphatase catalytic subunit-related protein in pancreatic Beta-cells. Rev Diabet Stud 4:25-32.
54. Yang, Y., and P. Santamaria. 2006. Lessons on autoimmune diabetes from animal models. Clin Sci (Lond) 110:627-639.
55. Carrasco-Marin, E., J. Shimizu, O. Kanagawa, and E. R. Unanue. 1996. The class II MHC I-Ag7 molecules from non-obese diabetic mice are poor peptide binders. J Immunol 156:450-458.
56. Makino, S., K. Kunimoto, Y. Muraoka, Y. Mizushima, K. Katagiri, and Y. Tochino. 1980. Breeding of a non-obese, diabetic strain of mice. Jikken dobutsu 29:1-13.
57. Piganelli, J. D., T. Martin, and K. Haskins. 1998. Splenic macrophages from the NOD mouse are defective in the ability to present antigen. Diabetes 47:1212-1218.
58. Serreze, D. V., H. R. Gaskins, and E. H. Leiter. 1993. Defects in the differentiation and function of antigen presenting cells in NOD/Lt mice. J Immunol 150:2534-2543.
59. Fitzpatrick, F., F. Lepault, F. Homo-Delarche, J. F. Bach, and M. Dardenne. 1991. Influence of castration, alone or combined with thymectomy, on the development of diabetes in the nonobese diabetic mouse. Endocrinology 129:1382-1390.
60. Hawkins, T., R. R. Gala, and J. C. Dunbar. 1993. The effect of neonatal sex hormone manipulation on the incidence of diabetes in nonobese diabetic mice. Proceedings of the

112
Society for Experimental Biology and Medicine. Society for Experimental Biology and Medicine (New York, N.Y 202:201-205.
61. Haskins, K., M. Portas, B. Bergman, K. Lafferty, and B. Bradley. 1989. Pancreatic islet-specific T-cell clones from nonobese diabetic mice. Proceedings of the National Academy of Sciences of the United States of America 86:8000-8004.
62. Bergman, B., J. L. McManaman, and K. Haskins. 2000. Biochemical characterization of a beta cell membrane fraction antigenic for autoreactive T cell clones. Journal of autoimmunity 14:343-351.
63. Dobbs, C., and K. Haskins. 2001. Comparison of a T cell clone and of T cells from a TCR transgenic mouse: TCR transgenic T cells specific for self-antigen are atypical. J Immunol 166:2495-2504.
64. Gonzalez, A., J. D. Katz, M. G. Mattei, H. Kikutani, C. Benoist, and D. Mathis. 1997. Genetic control of diabetes progression. Immunity 7:873-883.
65. Kurrer, M. O., S. V. Pakala, H. L. Hanson, and J. D. Katz. 1997. Beta cell apoptosis in T cell-mediated autoimmune diabetes. Proceedings of the National Academy of Sciences of the United States of America 94:213-218.
66. Alberts, B. 2002. Molecular biology of the cell. Garland Science, New York.
67. Alberts, B. 1994. Molecular biology of the cell. Garland Pub., New York.
68. Iwawaki, T., R. Akai, K. Kohno, and M. Miura. 2004. A transgenic mouse model for monitoring endoplasmic reticulum stress. Nature medicine 10:98-102.
69. Gotoh, T., K. Terada, S. Oyadomari, and M. Mori. 2004. hsp70-DnaJ chaperone pair prevents nitric oxide- and CHOP-induced apoptosis by inhibiting translocation of Bax to mitochondria. Cell death and differentiation 11:390-402.
70. Oyadomari, S., E. Araki, and M. Mori. 2002. Endoplasmic reticulum stress-mediated apoptosis in pancreatic beta-cells. Apoptosis 7:335-345.
71. Rutkowski, D. T., and R. J. Kaufman. 2004. A trip to the ER: coping with stress. Trends Cell Biol 14:20-28.

113
72. Ron, D. 2002. Translational control in the endoplasmic reticulum stress response. The Journal of clinical investigation 110:1383-1388.
73. Araki, E., S. Oyadomari, and M. Mori. 2003. Impact of endoplasmic reticulum stress pathway on pancreatic beta-cells and diabetes mellitus. Experimental biology and medicine (Maywood, N.J 228:1213-1217.
74. Oyadomari, S., K. Takeda, M. Takiguchi, T. Gotoh, M. Matsumoto, I. Wada, S. Akira, E. Araki, and M. Mori. 2001. Nitric oxide-induced apoptosis in pancreatic beta cells is mediated by the endoplasmic reticulum stress pathway. Proceedings of the National Academy of Sciences of the United States of America 98:10845-10850.
75. Marciniak, S. J., C. Y. Yun, S. Oyadomari, I. Novoa, Y. Zhang, R. Jungreis, K. Nagata, H. P. Harding, and D. Ron. 2004. CHOP induces death by promoting protein synthesis and oxidation in the stressed endoplasmic reticulum. Genes & development 18:3066-3077.
76. Nakagawa, T., H. Zhu, N. Morishima, E. Li, J. Xu, B. A. Yankner, and J. Yuan. 2000. Caspase-12 mediates endoplasmic-reticulum-specific apoptosis and cytotoxicity by amyloid-beta. Nature 403:98-103.
77. Nakagawa, T., and J. Yuan. 2000. Cross-talk between two cysteine protease families. Activation of caspase-12 by calpain in apoptosis. The Journal of cell biology 150:887-894.
78. Yoneda, T., K. Imaizumi, K. Oono, D. Yui, F. Gomi, T. Katayama, and M. Tohyama. 2001. Activation of caspase-12, an endoplastic reticulum (ER) resident caspase, through tumor necrosis factor receptor-associated factor 2-dependent mechanism in response to the ER stress. The Journal of biological chemistry 276:13935-13940.
79. Rao, R. V., E. Hermel, S. Castro-Obregon, G. del Rio, L. M. Ellerby, H. M. Ellerby, and D. E. Bredesen. 2001. Coupling endoplasmic reticulum stress to the cell death program. Mechanism of caspase activation. The Journal of biological chemistry 276:33869-33874.
80. Araki, E., S. Oyadomari, and M. Mori. 2003. Endoplasmic reticulum stress and diabetes mellitus. Intern Med 42:7-14.
81. Oyadomari, S., A. Koizumi, K. Takeda, T. Gotoh, S. Akira, E. Araki, and M. Mori. 2002. Targeted disruption of the Chop gene delays endoplasmic reticulum stress-mediated diabetes. The Journal of clinical investigation 109:525-532.

114
82. Gotoh, T., and M. Mori. 2006. Nitric oxide and endoplasmic reticulum stress. Arteriosclerosis, thrombosis, and vascular biology 26:1439-1446.
83. Blass, S., A. Union, J. Raymackers, F. Schumann, U. Ungethum, S. Muller-Steinbach, F. De Keyser, J. M. Engel, and G. R. Burmester. 2001. The stress protein BiP is overexpressed and is a major B and T cell target in rheumatoid arthritis. Arthritis and rheumatism 44:761-771.
84. Piganelli, J. D., S. C. Flores, C. Cruz, J. Koepp, I. Batinic-Haberle, J. Crapo, B. Day, R. Kachadourian, R. Young, B. Bradley, and K. Haskins. 2002. A metalloporphyrin-based superoxide dismutase mimic inhibits adoptive transfer of autoimmune diabetes by a diabetogenic T-cell clone. Diabetes 51:347-355.
85. Haskins, K. 2005. Pathogenic T-cell clones in autoimmune diabetes: more lessons from the NOD mouse. Advances in immunology 87:123-162.
86. Hamaguchi, K., H. R. Gaskins, and E. H. Leiter. 1991. NIT-1, a pancreatic beta-cell line established from a transgenic NOD/Lt mouse. Diabetes 40:842-849.
87. Bordier, C. 1981. Phase separation of integral membrane proteins in Triton X-114 solution. The Journal of biological chemistry 256:1604-1607.
88. Mansour, M. K., L. S. Schlesinger, and S. M. Levitz. 2002. Optimal T cell responses to Cryptococcus neoformans mannoprotein are dependent on recognition of conjugated carbohydrates by mannose receptors. J Immunol 168:2872-2879.
89. Onengut-Gumuscu, S., and P. Concannon. 2006. Recent advances in the immunogenetics of human type 1 diabetes. Current opinion in immunology 18:634-638.
90. Christianson, S. W., L. D. Shultz, and E. H. Leiter. 1993. Adoptive transfer of diabetes into immunodeficient NOD-scid/scid mice. Relative contributions of CD4+ and CD8+ T-cells from diabetic versus prediabetic NOD.NON-Thy-1a donors. Diabetes 42:44-55.
91. Cloos, P. A., and S. Christgau. 2004. Post-translational modifications of proteins: implications for aging, antigen recognition, and autoimmunity. Biogerontology 5:139-158.
92. Katz, J. D., B. Wang, K. Haskins, C. Benoist, and D. Mathis. 1993. Following a diabetogenic T cell from genesis through pathogenesis. Cell 74:1089-1100.

115
93. Bergman, B., and K. Haskins. 1994. Islet-specific T-cell clones from the NOD mouse respond to beta-granule antigen. Diabetes 43:197-203.
94. Judkowski, V., C. Pinilla, K. Schroder, L. Tucker, N. Sarvetnick, and D. B. Wilson. 2001. Identification of MHC class II-restricted peptide ligands, including a glutamic acid decarboxylase 65 sequence, that stimulate diabetogenic T cells from transgenic BDC2.5 nonobese diabetic mice. J Immunol 166:908-917.
95. Yoshida, K., T. Martin, K. Yamamoto, C. Dobbs, C. Munz, N. Kamikawaji, N. Nakano, H. G. Rammensee, T. Sasazuki, K. Haskins, and H. Kikutani. 2002. Evidence for shared recognition of a peptide ligand by a diverse panel of non-obese diabetic mice-derived, islet-specific, diabetogenic T cell clones. International immunology 14:1439-1447.
96. Turley, S., L. Poirot, M. Hattori, C. Benoist, and D. Mathis. 2003. Physiological beta cell death triggers priming of self-reactive T cells by dendritic cells in a type-1 diabetes model. The Journal of experimental medicine 198:1527-1537.
97. O'Brien, B. A., W. E. Fieldus, C. J. Field, and D. T. Finegood. 2002. Clearance of apoptotic beta-cells is reduced in neonatal autoimmune diabetes-prone rats. Cell death and differentiation 9:457-464.
98. Mathis, D., L. Vence, and C. Benoist. 2001. beta-Cell death during progression to diabetes. Nature 414:792-798.
99. Liu, Y. J. 1997. Sites of B lymphocyte selection, activation, and tolerance in spleen. The Journal of experimental medicine 186:625-629.
100. Kelsoe, G., and B. Zheng. 1993. Sites of B-cell activation in vivo. Current opinion in immunology 5:418-422.
101. Stuber, E., and W. Strober. 1996. The T cell-B cell interaction via OX40-OX40L is necessary for the T cell-dependent humoral immune response. The Journal of experimental medicine 183:979-989.
102. Murphy, K. M., A. B. Heimberger, and D. Y. Loh. 1990. Induction by antigen of intrathymic apoptosis of CD4+CD8+TCRlo thymocytes in vivo. Science 250:1720-1723.
103. Harding, H. P., and D. Ron. 2002. Endoplasmic reticulum stress and the development of diabetes: a review. Diabetes 51 Suppl 3:S455-461.

116
104. Thastrup, O., P. J. Cullen, B. K. Drobak, M. R. Hanley, and A. P. Dawson. 1990. Thapsigargin, a tumor promoter, discharges intracellular Ca2+ stores by specific inhibition of the endoplasmic reticulum Ca2(+)-ATPase. Proceedings of the National Academy of Sciences of the United States of America 87:2466-2470.
105. Seve, M., A. Favier, M. Osman, D. Hernandez, G. Vaitaitis, N. C. Flores, J. M. McCord, and S. C. Flores. 1999. The human immunodeficiency virus-1 Tat protein increases cell proliferation, alters sensitivity to zinc chelator-induced apoptosis, and changes Sp1 DNA binding in HeLa cells. Archives of biochemistry and biophysics 361:165-172.
106. Hirano, H., S. Komatsu, H. Kajiwara, Y. Takagi, and S. Tsunasawa. 1993. Microsequence analysis of the N-terminally blocked proteins immobilized on polyvinylidene difluoride membrane by western blotting. Electrophoresis 14:839-846.
107. Lieberman, S. M., T. Takaki, B. Han, P. Santamaria, D. V. Serreze, and T. P. DiLorenzo. 2004. Individual nonobese diabetic mice exhibit unique patterns of CD8+ T cell reactivity to three islet antigens, including the newly identified widely expressed dystrophia myotonica kinase. J Immunol 173:6727-6734.
108. Trudeau, J. D., J. P. Dutz, E. Arany, D. J. Hill, W. E. Fieldus, and D. T. Finegood. 2000. Neonatal beta-cell apoptosis: a trigger for autoimmune diabetes? Diabetes 49:1-7.
109. Eizirik, D. L., and T. Mandrup-Poulsen. 2001. A choice of death--the signal-transduction of immune-mediated beta-cell apoptosis. Diabetologia 44:2115-2133.
110. Weber, S. M., K. T. Chambers, K. G. Bensch, A. L. Scarim, and J. A. Corbett. 2004. PPARgamma ligands induce ER stress in pancreatic beta-cells: ER stress activation results in attenuation of cytokine signaling. Am J Physiol Endocrinol Metab 287:E1171-1177.
111. Wang, M., X. R. Zhao, P. Wang, L. Li, Y. Dai, H. Huang, P. Lei, H. F. Zhu, and G. X. Shen. 2007. Glucose regulated proteins 78 protects insulinoma cells (NIT-1) from death induced by streptozotocin, cytokines or cytotoxic T lymphocytes. The international journal of biochemistry & cell biology.
112. Horwitz, M. S., A. Ilic, C. Fine, E. Rodriguez, and N. Sarvetnick. 2002. Presented antigen from damaged pancreatic beta cells activates autoreactive T cells in virus-mediated autoimmune diabetes. The Journal of clinical investigation 109:79-87.

117
113. Horwitz, M. S., A. Ilic, C. Fine, B. Balasa, and N. Sarvetnick. 2004. Coxsackieviral-mediated diabetes: induction requires antigen-presenting cells and is accompanied by phagocytosis of beta cells. Clinical immunology (Orlando, Fla 110:134-144.
114. He, B. 2006. Viruses, endoplasmic reticulum stress, and interferon responses. Cell death and differentiation 13:393-403.
115. Fairweather, D., and N. R. Rose. 2002. Type 1 diabetes: virus infection or autoimmune disease? Nat Immunol 3:338-340.
116. Monneaux, F., J. M. Lozano, M. E. Patarroyo, J. P. Briand, and S. Muller. 2003. T cell recognition and therapeutic effect of a phosphorylated synthetic peptide of the 70K snRNP protein administered in MR/lpr mice. European journal of immunology 33:287-296.
117. Chackerian, B., L. M. Rudensey, and J. Overbaugh. 1997. Specific N-linked and O-linked glycosylation modifications in the envelope V1 domain of simian immunodeficiency virus variants that evolve in the host alter recognition by neutralizing antibodies. Journal of virology 71:7719-7727.
118. Ireland, J., J. Herzog, and E. R. Unanue. 2006. Cutting edge: unique T cells that recognize citrullinated peptides are a feature of protein immunization. J Immunol 177:1421-1425.
119. Robinson, W. H., C. DiGennaro, W. Hueber, B. B. Haab, M. Kamachi, E. J. Dean, S. Fournel, D. Fong, M. C. Genovese, H. E. de Vegvar, K. Skriner, D. L. Hirschberg, R. I. Morris, S. Muller, G. J. Pruijn, W. J. van Venrooij, J. S. Smolen, P. O. Brown, L. Steinman, and P. J. Utz. 2002. Autoantigen microarrays for multiplex characterization of autoantibody responses. Nature medicine 8:295-301.
120. Asaga, H., M. Yamada, and T. Senshu. 1998. Selective deimination of vimentin in calcium ionophore-induced apoptosis of mouse peritoneal macrophages. Biochemical and biophysical research communications 243:641-646.
121. Pritzker, L. B., S. Joshi, J. J. Gowan, G. Harauz, and M. A. Moscarello. 2000. Deimination of myelin basic protein. 1. Effect of deimination of arginyl residues of myelin basic protein on its structure and susceptibility to digestion by cathepsin D. Biochemistry 39:5374-5381.

118
122. Hill, J. A., S. Southwood, A. Sette, A. M. Jevnikar, D. A. Bell, and E. Cairns. 2003. Cutting edge: the conversion of arginine to citrulline allows for a high-affinity peptide interaction with the rheumatoid arthritis-associated HLA-DRB1*0401 MHC class II molecule. J Immunol 171:538-541.
123. Utz, P. J., T. J. Gensler, and P. Anderson. 2000. Death, autoantigen modifications, and tolerance. Arthritis research 2:101-114.
124. Casciola-Rosen, L. A., G. Anhalt, and A. Rosen. 1994. Autoantigens targeted in systemic lupus erythematosus are clustered in two populations of surface structures on apoptotic keratinocytes. The Journal of experimental medicine 179:1317-1330.
125. Purcell, A. W., A. Todd, G. Kinoshita, T. A. Lynch, C. L. Keech, M. J. Gething, and T. P. Gordon. 2003. Association of stress proteins with autoantigens: a possible mechanism for triggering autoimmunity? Clinical and experimental immunology 132:193-200.
126. Peakman, M., T. I. Tree, J. Endl, P. van Endert, M. A. Atkinson, and B. O. Roep. 2001. Characterization of preparations of GAD65, proinsulin, and the islet tyrosine phosphatase IA-2 for use in detection of autoreactive T-cells in type 1 diabetes: report of phase II of the Second International Immunology of Diabetes Society Workshop for Standardization of T-cell assays in type 1 diabetes. Diabetes 50:1749-1754.
127. Leustek, T., D. Amir-Shapira, H. Toledo, N. Brot, and H. Weissbach. 1992. Autophosphorylation of 70 kDa heat shock proteins. Cellular and molecular biology 38:1-10.
128. Hendershot, L. M., J. Ting, and A. S. Lee. 1988. Identity of the immunoglobulin heavy-chain-binding protein with the 78,000-dalton glucose-regulated protein and the role of posttranslational modifications in its binding function. Molecular and cellular biology 8:4250-4256.
129. Leustek, T., H. Toledo, N. Brot, and H. Weissbach. 1991. Calcium-dependent autophosphorylation of the glucose-regulated protein, Grp78. Archives of biochemistry and biophysics 289:256-261.
130. Rowley, M. J., M. Scealy, J. C. Whisstock, J. A. Jois, L. C. Wijeyewickrema, and I. R. Mackay. 2000. Prediction of the immunodominant epitope of the pyruvate dehydrogenase complex E2 in primary biliary cirrhosis using phage display. J Immunol 164:3413-3419.

119
131. Mackay, I. R., and M. J. Rowley. 2004. Autoimmune epitopes: autoepitopes. Autoimmunity reviews 3:487-492.
132. Corcoran, A., B. P. Mahon, and S. Doyle. 2004. B cell memory is directed toward conformational epitopes of parvovirus B19 capsid proteins and the unique region of VP1. The Journal of infectious diseases 189:1873-1880.
133. Hammond, S. A., S. J. Cook, D. L. Lichtenstein, C. J. Issel, and R. C. Montelaro. 1997. Maturation of the cellular and humoral immune responses to persistent infection in horses by equine infectious anemia virus is a complex and lengthy process. Journal of virology 71:3840-3852.
134. Triantafilou, K., D. Fradelizi, K. Wilson, and M. Triantafilou. 2002. GRP78, a coreceptor for coxsackievirus A9, interacts with major histocompatibility complex class I molecules which mediate virus internalization. Journal of virology 76:633-643.
135. Turley, S. J., J. W. Lee, N. Dutton-Swain, D. Mathis, and C. Benoist. 2005. Endocrine self and gut non-self intersect in the pancreatic lymph nodes. Proceedings of the National Academy of Sciences of the United States of America 102:17729-17733.
136. Bertolotti, A., X. Wang, I. Novoa, R. Jungreis, K. Schlessinger, J. H. Cho, A. B. West, and D. Ron. 2001. Increased sensitivity to dextran sodium sulfate colitis in IRE1beta-deficient mice. The Journal of clinical investigation 107:585-593.
137. Majors, A. K., R. C. Austin, C. A. de la Motte, R. E. Pyeritz, V. C. Hascall, S. P. Kessler, G. Sen, and S. A. Strong. 2003. Endoplasmic reticulum stress induces hyaluronan deposition and leukocyte adhesion. The Journal of biological chemistry 278:47223-47231.
138. Kanauchi, H., F. Furukawa, and S. Imamura. 1991. Characterization of cutaneous infiltrates in MRL/lpr mice monitored from onset to the full development of lupus erythematosus-like skin lesions. The Journal of investigative dermatology 96:478-483.
139. Qian, Y., Y. Zheng, D. Weber, and E. Tiffany-Castiglioni. 2007. A 78-kDa glucose-regulated protein is involved in the decrease of interleukin-6 secretion by lead treatment from astrocytes. American journal of physiology 293:C897-905.
140. Luo, S., C. Mao, B. Lee, and A. S. Lee. 2006. GRP78/BiP is required for cell proliferation and protecting the inner cell mass from apoptosis during early mouse embryonic development. Molecular and cellular biology 26:5688-5697.

120
141. McCluskey, J., A. D. Farris, C. L. Keech, A. W. Purcell, M. Rischmueller, G. Kinoshita, P. Reynolds, and T. P. Gordon. 1998. Determinant spreading: lessons from animal models and human disease. Immunological reviews 164:209-229.