the response of humic substances to soil acidification and freezing
TRANSCRIPT

Pergamon
Environment International, Vol. 20, No. 3, pp. 405-410, 1994 Copyright ©1994 Elsevier Science Ltd
Printed in tho USA. All rights reserved 0160-4120/94 $6.00 +.00
THE RESPONSE OF HUMIC SUBSTANCES TO SOIL ACIDIFICATION AND FREEZING
L.T. Shirshova and T.E. Khomutova Institute of Soil Science and Photosynthesis, Russian Academy of Sciences, 142292 Pushchino, Moscow Region, Russia
El 9306-178 M (Received 23 June 1993; accepted 20 February 1994)
The effects of freezing and acidification on humic substances (HS) of tundra, soddy podzolic, and grey forest soils have been studied in a laboratory experiment. Samples were acidified to decrease the initial pH of soil suspension by a 1 pH unit and were kept at ÷9 or -12°C for two months. HS were sequentially extracted by two cation exchange resins (fractions HS-1 and HS-2) in distilled water, followed by alkali (HS-3). HS fractions, as well as humic and fulvic acids isolated from them, were examined by fluorescence spectroscopy in the emission, excitation, and synchronous-scan excitation modes. Electrophoretic mobilities and E4/Es ratios of HS-1, 2, and three fractions were analysed. On the basis of CH^/CFA and E4/Es ratios and electrophoretic and fluorescence behaviour, HS fractions from the same sample showed distinct differences while corresponding fractions of different origin displayed evident similarities. HS of soils studied differed in their response to acidification and freezing. HS of treated and untreated soils were distinguished by fraction composition, peak wavelength, and intensity of fluorescence in excita- tion and synchronous-scan excitation spectra.
INTRODUCTION
The investigation of transformations of soil humic subsrances (HS) under acid precipitations and freez- ing is of theoretical and practical interest. Such an environmental study requires sensitive methods to detect possible slow, long-term changes in HS (Mal- colm 1992).
Fluorescence spectrometry in the emission, excita- tion, and synchronous-scan excitat ionmodes is considered a useful tool for distinguishing between humic materials based on their nature, genesis, and origin. The principal advantages of this technique are its sensitivity, enabling its use at environmentally relevant concentrations and minimal requirements for the sample preparations (Miano et al. 1988; Shotyk and Sposito 1990; Senesi et al. 1991).
The systematic investigation of fluorescence be- haviour of humic and humic-like compounds were
conducted to determine the general shape and posi- tions of the maxima in spectra; the dependence of fluorescence properties on several molecular and environmental parameters was found (Ghosh and Schnitzer 1980; Miano et al. 1988; Shotyk and Sposito 1990; Senesi et al. 1991; Spark and Swift 1992). Shotyk and Sposito (1990) emphasized that the shape of excitation and synchronous-scan excitation spectra of water-soluble organic matter of leaf litter was highly dependent on the concentration of ,~he sample solu- tion. They suggested the hypotheses of the excimers and exciplexes formation (Parker 1968; Lakowicz 1983) at high concentrations of solution. The fluores- cence properties of humic and humic-like substances provide valid criteria for comparative characteristics of such a heterogenous material.
The heterogeneity of HS could be assessed on the basis of their electrophoretic behaviour. De Nobili
405

406 L.T. Shirshova and T.E. Khomutova
Table 1. Some properties of humic substances in soil.
Fraction Organic C C~^/CF^ E4/E~ (% of Total C)
Tundra Soil (A; 0-20; 1.70; 5.67)**
HS-I* 7.1 0.7 13.0 HS-2 12.4 0.9 4.6 HS-3 18.8 0.6 5.2
HS-1 HS-2 HS-3
3.9 11.2 16.4
Soddy Podzolic Soil (A; 10-20; 2.32; 5.81)
0.4 0.9 0.6
Grey Forest Soil (Ah,; 27-35; 0.92; 5.37)
9.2 5.4 7.8
HS-1 HS-2 HS-3
17.4 60.9 12.0
1.7 5.2 0.8
6.7 5.3
HS-1, HS-2, HS-3: humic substances extracted sequentially ny resin with sulfo-groups, carboxylic resin, and 0.1 n NaOH. Relative standard deviation: 3% for HS-1 and HS-2; 9% for HS-3.
** Horizon; depth, cm; total C, %; pH of soil suspension.
and coworkers (1990) demonstrated that fractions of various electrophoretic mobility differ in their de- gree of humidification. HS fractions of low mobility could comprise covalently bound polysaccharide and protein derivatives, and in general, are poorer humifi- cated than compounds of mediate and low mobility.
It was shown previously that the solubility of some fractions of HS of grey forest humic horizon decreased under soil freezing (Polubesova and Shirshova 1993). It led to the changes of fraction composition of iso- lated humic substances.
The purpose of this study was to evaluate the effects of separate and joint actions of acidification and freezing of soil samples on recovery, fraction composition, and fluorescence characteristics of HS.
MATERIALS AND METHODS
Samples were taken from the upper layers of three soils (Table 1). The laboratory treatments of the ini- tial soil samples (I) saturated with distilled water- were made over a period of two months. The treatments were as follows: sample was kept in the freezing chamber at a temperature of -12°C (F); sample was
acidifiedto reduce the initial pH of soil suspension by a 1 pH unit and kept at +9°C (A'); sample was acidified as mentioned above three times over the period of the experiment and kept at +9°C (A"); sample was acidified as A' and kept at -12°C (AF).
The HS extraction procedure included three se- quential extractions: 1) isolation by resin with sulfo- groups in Na + form in distilled water (HS-1 fraction); 2) followed by carboxylic resin under the same conditions (HS-2); and 3) 0.1 n NaOH (HS-3) as described previously (Shirshova 1991). The separa- tion procedure of humic and fulvic acids was con- ducted at pH 1.0. The FA analyzed would be classified as fulvic acid fraction (Malcolm 1990).
Electrophoresis was performed on the slabs of 10%- polyacrylamide gel With 7-mol urea in a 0.1-mol phosphate buffer (pH 8.0) as described previously (Khomutova and Shirshova 1993). The HS samples were air-dried, dissolved in 7-reel urea, and analysed.
UV-visible spectra were recorded with a Specord-M spectrophotometer (Carl Zeiss, Jena) and the E4]E 6 ratios were determined.
Acidification and freezing of humic substances 407
Fluorescence spectra were obtained on water solu- tions of the humic material after overnight equilibra- tion at room temperature (20°C); the spectra were recorded in emission (Em), excitat ion (Ex), and synchronous-scan excitation (Ssc) modes (Senesi et al. 1991) with the use of an 850 Hitachi Fluorescence Spectrophotometer. Comparative investigation of HS was conducted at a concentration of 12 mg organic carbon (C) per liter with a pH of about 7.0. The HS were examined also within the concentration range of 96-3.0 mg C/L.
RESULTS AND DISCUSSION
HS recovery and fraction composition
Some characteristics of isolated material from in- itial soil samples are summarized in Table 1 and Figs. 1 and 2. It can be seen that the HS fraction composi- tion depended on the soil type.
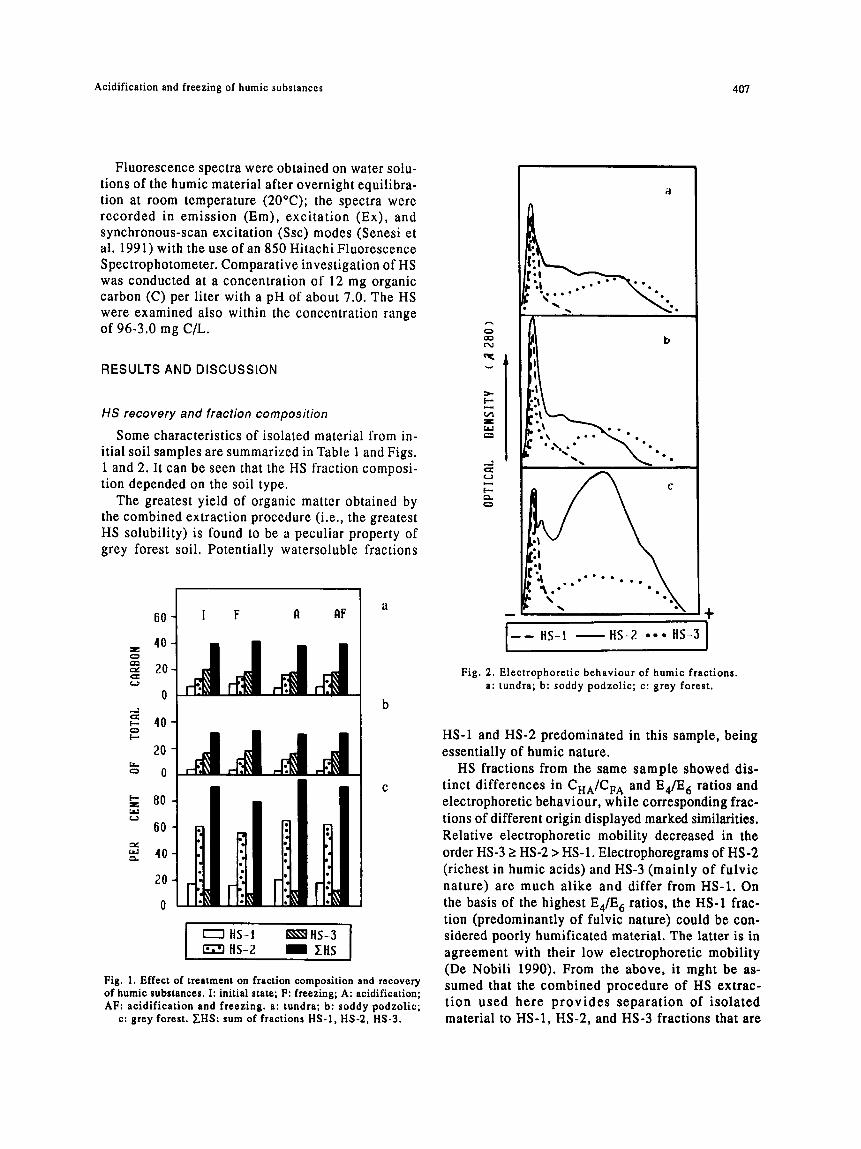
The greatest yield of organic matter obtained by the combined extraction procedure (i.e., the greatest HS solubility) is found to be a peculiar property of grey forest soil. Potentially watersoluble fractions
G0-[ I F g gF a
0 N b
N Io
2o
~ o C
N 80 N
rio
~ 40
2o
o
t - - - I If 5 - t ~\\\~ t15 - 3 I I•' 'l HS-2 1 £HS I
Fig. 1. Effect of treatment on fraction composition and recovery of humic substances. I: initial state; F: freezing; A: acidification; AF: acidification and freezing, a: tundra; b: soddy podzolic;
c : grey forest. 5"HS: sum of fractions HS-I, HS-2, HS-3.
A
b -
Z
¢.=J
t '--
~0 • | o o • ° • o t °
t
b
- - - - tlS-t
+
HS-2 o o o HS-3 ]
Fig. 2. Electrophoretic behaviour of humic fractions. a: tundra; b: soddy podzolic; c: grey forest.
HS-1 and HS-2 predominated in this sample, being essentially of humic nature.
HS fractions from the same sample showed dis- tinct differences in CHA/CFA and E4/E 6 ratios and electrophoretic behaviour, while corresponding frac- tions of different origin displayed marked similarities. Relative electrophoretic mobility decreased in the order HS-3 > HS-2 > HS-1. Electrophoregrams of HS-2 (richest in humic acids) and HS-3 (mainly of fulvic nature) are much alike and differ from HS-1. On the basis of the highest E4/E 6 ratios, the HS-1 frac- tion (predominantly of fulvic nature) could be con- sidered poorly humificated material. The latter is in agreement with their low electrophoretic mobility (De Nobili 1990). From the above, it mght be as- sumed that the combined procedure of HS extrac- tion used here p r o v i d e s separat ion of isolated material to HS-1, HS-2, and HS-3 fractions that are

408 L.T. Shirshova and T.E. Khomutova
distinguishable by certain molecular characteristics and the degree of humification.
At the beginning of HS recovery, pH values of water suspension of soil samples decreased in com- parison to the initial values (Table 1). These changes were as follows: by 1.0 pH unit (AF); by 0.77-0.54 (A"); and by 0.3 (F). The pH values of HS-1 and HS-2 fractions of the initial samples varied between 6.8 and 7.6; in some cases, they decreased only by 0.3.
Changes in the HS fraction composition as a con- sequence of the treatments are shown in Fig. 1. Dis- tinctions between A' and A" were not significant, so designation A is valid for both. Figure 1 demonstrates that changes of fraction composition and solubility of HS as a whole depend upon the soil type. Soil acidification and freezing caused opposite trends of HS solubility. Under the joint action (AF), these opposite trends compensated each other.
In the soils of Northern Russia like tundra and soddy podzolic, acidification resulted in some decrease of HS solubility while freezing was accompanied by its in- crease, the opposite is generally true for grey forest soil.
Characterization of HS by fluorescence spectroscopy methods
To compare their fluorescent spectra, all HS solu- tions were diluted to a concentration of 12 mg C/L. This value corresponded to the lowest carbon content in HS fractions isolated.
The dependence of emission (Era) and excitation (Ex) spectra on HS concentration is demonstrated on the sample of HS-2 of grey forest soil (Fig. 3). In all cases studied, HS samples displayed similar depend- ence. The initial solution of HS-2 (96 mg C/L) was diluted in the ratios of 1:2 to 1:32. At high concentra- tions, Em and Ex spectra exhibited a broad band, 480-520 nm and 460 nm, respectively. This is in agreement with the results obta ined p rev ious ly (Ghosh and Schnitzer 1980; Miano et al. 1988; Senesi et al. 1991). Blue shifts of the main maxima in Em and especia l ly Ex spectra were observed with increasing dilution. At concentrations of 12 mg C/L (Fig. 3, curve 4) and lower, all fractions studied showed Em maxima at 435-460 nm and Ex maxima at 260-280 nm. These considerable shifts between the main peaks of Em and Ex spectra of diluted solu- t ions suggest the exis tence of compounds with intramolecular energy transfer. Such phenomena were described by Lakowicz (1983) and Parker (1968).
With increasing solute concentration, fluorescence intensity of both Ex and Em maxima increased ini- tially and then decreased. Further characterization
~ 3 ~ 3
I, 2, ~ y f ~ . . . \
/ # x %,,
#@'~'~/-- ~, ,"=~_--/_,~7~..\\ \ X \
Z50 300 350 400 450 500 550 600 II~IVZLENGTII I nm )
Fig. 3. Fluorescence excitation (Ex) and emission (Em) spectra of humic substances extracted by carboxylie resin from grey forest soil. The dilution ratios 1:2 to 1:32 of the initial solution
of 96 mg C/L (1) correspond to numbers 2-7.
of humic complex requires detailed experiments on concentrat iondependence.
Treatments of soil samples studied resulted in some changes of Ex spectra, being most pronounced in grey forest soil; A' and A" displayed a slight blue shift (about 15 nm) in the spectra of all HS frac- tions; F caused a red shift (about 10 nm) in HS-1. The effects of treatments were more enhanced in the Ex spectra at emission wavelength of 413 nm Hence, fluorescence spectrocopy data also demonstrated the presence of opposite tendencies in HS response to acidification and freezing. HS-1 turned out to be the most sensitive to the treatment in comparison to the other fractions.
Synchronous-scan (Ssc) spectra of HS fractions (Fig. 4) displayed three maxima: 340-360nm; 390- 430nm; and 480-500 nm. Corresponding fractions extracted from different soils demonstrated greater similarity than various fractions from the same soil.
HS-2 fraction showed the main maxima at 480- 500 nm, being the most similar to those presented in literature (Miano et al 1992; Senesi et al. 1991). The general shape and the position of the main maxima in the spectra of the HS- 1 fraction depended on the HS origin. In general, HS-1 spectra showed similarities to those of watersoluble organic matter of leaf litter (Shotyk and Sposito 1990) and to some fulvic acids and humus-like compounds (Senesi et al. 1991). HS-3 spectra rank between those of HS-1 and HS-2.
HA with inherent peaks at 390-430 nm and 480- 500 nm, FA with characteristic peaks at 340-360 nm, 390-430nm, and480-500 nm could be dis t inguished by the shape of the spectra. FA and, to a lesser extent, HA characteristics depended on both mode of extraction and HS origin. Concentration depend- ence of Ssc obtained was as follows: increasing con-
Acidification and freezing of humic substances 409
z
z
c~
,-a la-
/ ,
211 t l
I l
I so, 1 " * ' ° " * ' ' ' * ~ " ~ "•
I i ! i i I i ~ !
b
211 11 I l l
I I ~ I
i I tt 11 I I .
. , ;,, I . _ - - - - . . . . -....-... ,-,.,~ .~. " l " * ' - ' k ' L " " ' _ ~ ~
i i i i i i i i i
~,.- , X" A
. . . . . ""'"" "" ~t., j l
I .,:".,- -" • v i , i v , , i
300 400 500 IlflUEI.ENI;TH ( nm )
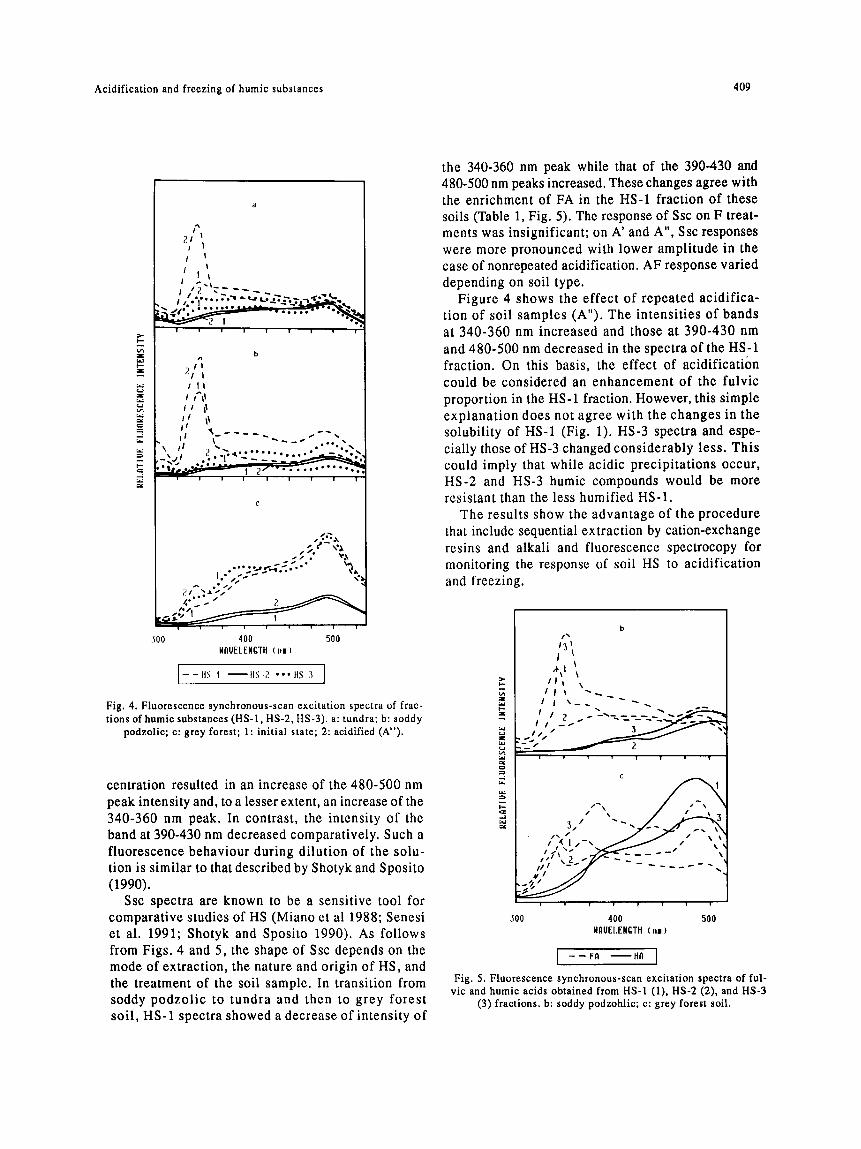
1--,~, ,.~;~...,s3 J Fig. 4. Fluorescence synchronous-scan excitation spectra of frac- tions of humic substances (HS-1, HS-2, ITS-3). a: tundra; b: soddy
podzolic; c: grey forest; 1: initial state; 2: acidified (A").
centration resulted in an increase of the 480-500 nm peak intensity and, to a lesser extent, an increase of the 340-360 nm peak. In contrast, the intensity of the band at 390-430 nm decreased comparatively. Such a fluorescence behaviour during dilution of the solu- tion is similar to that described by Shotyk and Sposito (1990).
Ssc spectra are known to be a sensitive tool for comparative studies of HS (Miano et al 1988; Senesi et al. 1991; Shotyk and Sposito 1990). As follows from Figs. 4 and 5, the shape of Ssc depends on the mode of extraction, the nature and origin of HS, and the treatment of the soil sample. In transition from soddy podzol ic to tundra and then to grey forest soil, HS-1 spectra showed a decrease of intensity of
the 340-360 nm peak while that of the 390-430 and 480-500 nm peaks increased. These changes agree with the enrichment of FA in the HS-1 fraction of these soils (Table 1, Fig. 5). The response of Ssc on F treat- ments was insignificant; on A' and A", Ssc responses were more pronounced with lower amplitude in the case of nonrepeated acidification. AF response varied depending on soil type.
Figure 4 shows the effect of repeated acidifica- tion of soil samples (A"). The intensities of bands at 340-360 nm increased and those at 390-430 nm and 480-500 nm decreased in the spectra of the HS-1 fraction. On this basis, the effect of acidification could be considered an enhancement of the fulvic proportion in the HS-1 fraction. However, this simple explanation does not agree with the changes in the solubility of HS-1 (Fig. 1). HS-3 spectra and espe- cially those of HS-3 changed considerably less. This could imply that while acidic precipitations occur, HS-2 and HS-3 humic compounds would be more resistant than the less humified HS-1.
The results show the advantage of the procedure that include sequential extraction by cation-exchange resins and alkali and fluorescence spectrocopy for monitoring the response of soil HS to acidification and freezing.
>
¢.a
. - i ul.
b
I I I ~\ I i ~ ' ~
l l ~ ' - - ~ ~ . ~
I ' ' 2 . - ' - ' -~ - - - -_ -_" ._ -~ I L ' - - "
I ' \ ' ' '
/ / •
. . . . . _ ' , ii l . ~ ~ ~ ~ ~ ~ ~ I ~
..¢/ ~ ! ! i l i v
~00 400 500 NflUELENI;TII ( n,, )
I - - Fn HA I
Fig . 5. F luo rescence synch ronous -scan e x c i t a t i o n spect ra o f f u l - vic and humic acids obtained from HS-1 (1), HS-2 (2), and HS-3
(3) fractions, b: soddy podzohlic; c: grey forest soil.

410 L.T. Shirshova and T.E. Khomutova
REFERENCES
De Nobili, M.; Bragato, G.; Alcaniz, J.M.; Comellas, L. Charac- terization of electrophoretic fractions of humic substances with different electrophoretie behaviour. Soil Sci. 5: 763-770; 1990.
Ghosh, K.; Svhnitzer, M. Fluorescence excitation spectra of humic substances. Can. J. Soil Sci. 60: 373-379; 1980.
Khomutova, T.E.; Shirshova, L.T. Electrophorctic study of soil humic substances. In: Ponizovski, A.A., ed. Prec. conf. on physical chemistry and massexchange processes in soils. Pushehino: ONTI NCBI; 1993: 51-56.
Lakowicz, J.R. Principles of fluorescence spectroscopy. New York, NY: Plenum Press; 1983.
Malcolm, R.L. Variations between humic substances isolated from soils, stream waters, and ground waters as revealed by 13C- NMR spectroscopy. In: MacCarthy, P.; Clapp, C.E.; Malcolm, R.L.; Bloom, P.R., eds. Humic substances in soil and crop sciences: selected readings. Madison, WI: Am. Society of Agronomy, Soil Science Society of America; 1990: 13-35.
Malcolm, R.L. Quantitative evaluation of XAD-8 and XAD-4 resins used in tandem for removing organic solutes from water. Environ. Int. 18: 597-607; 1992.
Miano, T.M.; Sposito, G.; Martin, J.P. Fluorescence spectroscopy of humic substances. Soil Sci. Soc. Am. J. 52: 1016-1019; 1988.
Parker, C.A. Photoluminescence of solutions. Amsterdam: Elsevier; 1968,
Polubesova, T.A. Shirshova, L.T. Effect of prolonged freezing on chemical properties of soils and clays. In: Gilichinsky, D., eds. In: Prec. 1st inter, conf. on cryopedology. Pushchino: ONTI NCBI; 1992: 140-145.
Senesi, N.T.; Miano, M.R.; Provenzano,; Brunetti, G. Charac- terization, differentiation, and classification of humic substan- ces by fluorescence spectroscopy. Soil Sci. 4: 259-271; 1991.
Shirshova, L.T. Polydispersity of soil humic substances. Moscow: Nauka Pub.; 1991. (In Russian)
Shotyk, W.; Sposito, G. Fluorescence spectroscopy of aqueous leaf litter extracts and their complexes with aluminium. Sci. Soc. Am. J. 54: 1305-1310; 1990.
Spark, K.M.; Swift, R.S. Investigation of some of the parameters affecting the fluorescence spectra of humic substances. In: Senesi, N.; Miano, T.M., eds. Abstracts of the 6th int. meeting IHSS, September 1992, Monopoli, Italy. Available from: "Selesto" Congressi & Relazioni Publiche, Bari, Italy.