the response of co2 fluxes from a peat soil to variation in simulated sheep trampling
TRANSCRIPT
Geoderma 197–198 (2013) 59–66
Contents lists available at SciVerse ScienceDirect
Geoderma
j ourna l homepage: www.e lsev ie r .com/ locate /geoderma
The response of CO2 fluxes from a peat soil to variation in simulated sheep trampling
Gareth D. Clay ⁎, Fred WorrallDepartment of Earth Sciences, Durham University, Science Laboratories, South Road, Durham, DH1 3LE, UK
⁎ Corresponding author at: Geography, School of EnUniversity of Manchester, Oxford Road, Manchester,306 6426; fax: +44 161 306 6677.
E-mail address: [email protected] (G.D.
0016-7061/$ – see front matter © 2012 Elsevier B.V. Allhttp://dx.doi.org/10.1016/j.geoderma.2012.12.008
a b s t r a c t
a r t i c l e i n f oArticle history:Received 13 September 2011Received in revised form 29 November 2012Accepted 15 December 2012Available online 9 February 2013
Keywords:Carbon dioxideDisturbanceLand managementSoil compaction
The peat soils that underlie much of the UK uplands contain a significant store of carbon and although carboncycling in UK peat has received a great deal of research attention there are relatively little data available onthe physical impact of grazing on carbon dynamics in peat soils. Therefore, this study asked whether tram-pling of peat soils had a significant effect on a major carbon flux pathway of peat ecosystems i.e. surfaceexchange of CO2 with the atmosphere. This study simulated regular trampling by sheep on peat cores for aperiod of 6 months and monitored the CO2 exchange with the atmosphere. Additionally, it also investigatedthe impact of the cessation of trampling.Results show that photosynthesis and net ecosystem exchange of CO2 were significantly decreased followingtrampling by up to 75% relative to control cores. Cessation of trampling led to a significant increase in ecosys-tem respiration after just 3 months but photosynthesis and net ecosystem exchange were not significantlydifferent to the pre-cessation period.
© 2012 Elsevier B.V. All rights reserved.
1. Introduction
Northern peatlands cover approximately 3% of global land surface yetstore up to 30% of the world's soil carbon (Limpens et al., 2008); recentestimates by Turunen et al. (2002) estimate that approximately 270–370 Gt of C, is stored in boreal and subarctic mires. The long-term rateof accumulation of carbon during the Holocene has been estimated at15–30 g C m−2 yr−1 (Roulet et al., 2007; Turunen et al., 2002; Vitt etal., 2000) making this ecosystem a large potential sink of atmosphericcarbon. Peatlands in the UK are intensively managed and have beenimpacted by a legacy of atmospheric pollution, tourism, overgrazingand wildfire, and not all of these land management systems have beenconducive to carbon storage (e.g. Worrall et al., 2011).
The uplands of the UK are host to a variety of habitats and soiltypes (Joint Nature Conservation Committee, 2009), including largeareas of peat soils with high soil carbon content (Bradley et al., 2005).One common land use in the uplands, and therefore upon upland peatsoils, is using the land for grazing of livestock and in particular sheep(Gardner et al., 2009); however, studies of the impact of sheep havebeen limited in two respects. Firstly, studies have tended to focus onthe presence/absence of sheep rather than the number of sheep pres-ent. There are many studies of the effect of the presence of sheep-grazing on vegetation, (e.g. Hope et al., 1996) and increased grazinghas been associated with soil erosion in uplands (Evans, 1996). Burtand Gardiner (1984) demonstrated that decreased soil infiltration
vironment and Development,M13 9PL, UK. Tel.: +44 161
Clay).
rights reserved.
coupled with loss of vegetation due to grazing can lead to increasedsurface runoff. More recent studies, e.g. Meyles et al. (2006), arguedthat more intense grazing causes conditions which promote increaseddelivery of soil water to rapid flowpaths. Although these studies talkof ‘increased grazing’, they do not provide a more quantitative measureof grazing intensity. Of the few studies that do provide some quantitativeevidence, Anderson and Radford (1994) in their study of reduction ingrazing pressure on moorland in the Peak District, UK, show that plantcover re-established if grazing levels were reduced from 2.5 ewes ha−1
to 0.18–0.43 ewes ha−1.The second limitation of the existing grazing studies is the lack of
attention to the effect on carbon and greenhouse gas balance of theenvironments. There is some information on increased soil erosion,and therefore, increased particulate organic carbon (POC) loss (e.g.Mackay and Tallis, 1996), but trigger levels of grazing intensity forerosion to occur in a peatland are not known. Worrall et al. (2007)showed that there was a significant rise in the water table in a peatsoil when grazing was present and that dissolved organic carbon(DOC) concentrations significantly decreased. Clay et al. (2009) showedno significant difference in the concentrations of DOC between grazedand ungrazed plots. Ward et al. (2007) have demonstrated significantincreases in net ecosystem exchange (NEE) on grazed vs. ungrazedplots which they ascribe to changes in vegetation community. Finally,Clay et al. (2010) have compared the carbon budget between grazedand ungrazed sites and suggest that although both types of site werenet sources of carbon that the net source represented by the grazedsite was on average 37 g C m−2 yr−1, or 25% lower than the net sourcerepresented by the ungrazed sites. Nevertheless, none of these studiesare scalable relative to grazing intensity e.g. if sheep numbers wentfrom 1.2 ewes ha−1 to 1.5 ewes ha−1 what difference would it make?
Table 1Examples of measured and calculated pressures exerted by livestock and machinery.
Type of disturbance Pressure (kPa) Reference
Sheep (stationary) 50–80 Bilotta et al. (2007)Sheep (moving) 200Tractors 30–150Cattle 192 Willatt and Pullar (1984)Sheep 83Horse (stationary) 119 Walker et al. (2005)Cattle 170–540 van der Tol et al. (2002)Sheep 67 Ssemakula (1983)Animals and machinery ~100 Marshall and Holmes (1992)Machinery 138–345 Barnes et al. (1971)Sheep 124
Table 2Designation of trampling regime with this study's experimental design.
Core name Trampling frequency
Sept–Nov 2010 Dec 2010–Feb 2011
Experiment 1Control None NoneHigh Daily DailyLow Weekly Weekly
Experiment 2Control None NoneTrampling & cessation Bi-weekly None
60 G.D. Clay, F. Worrall / Geoderma 197–198 (2013) 59–66
Physical changes to soils from increased trampling or compactioninclude increased soil bulk density, decreased air permeability, re-duced infiltration, and changed bearing capacity (Willatt and Pullar,1984). However, the literature on the impact of trampling on carbonpathways from soils is sparse. Pengthamkeerati et al. (2005) studied agrazed mineral soil and show CO2 efflux was significantly reducedwith increased bulk density and Hynst et al. (2007) observed lowerCO2 emissions on severely grazed (and therefore heavily trampled)plots. However, increases in CO2 have also been observed followingcompaction of soils (Conlin and van den Driessche, 2000). Beare etal. (2009) observed increased DOC concentrations in uncompactedsoils in comparison to compacted soils. Of the few studies that in-vestigate trampling and carbon on UK peats, Robroek et al. (2010)showed that the absence of vegetation from trampled research trackson a blanket bog led to an increase in runoff events and transport ofparticulate organic carbon (POC) and that rapid recovery of the vege-tation resulted in cessation of these effects. Robroek et al. (2010) in-vestigated hydrological and vegetation changes following tramplingbut did not consider gaseous emissions of carbon.
This study sets out an experimental approach by simulating sheeptrampling on a peat soil in order to understand the impact of tram-pling on CO2 emissions from these important soils. Using two exper-iments, the aim was to determine 1) whether trampling intensityaffects CO2 fluxes, and 2) if cessation of trampling allows the systemto recover to pre-disturbance levels.
2. Materials and methods
2.1. Core preparation
A series of 12 peat cores (15 cm diameter) were taken from thesame area of Atkinson Moss in the North Pennines Area of Outstand-ing Natural Beauty (AONB) (UK national grid reference NY805352)during July 2010. The site was chosen because for at least 15 yearsthere had been no sheep grazing of the site and so it was unlikelythat site would have been suffering from the effects of trampling atthe time of sampling. The original aim was to sample to at least60 cm depth of peat, however, due to an underlying clay soil onlyaround 40 cm depth of peat soil was obtained per core. Cores weretherefore approximately 50–60 cm in total depth, of which ~40 cmwas peat and the remaining ~10–15 cm was of underlying clay.Surface vegetation was kept intact and the dominant genus wasSphagnum spp. with Eriophorum spp. and Polytrichum commune alsopresent. Cores were sealed at the base so that, like a peat soil, therewas restricted vertical drainage. It should also be noted that therewas limited horizontal flow in these cores due to the confined natureof the cores. The seal at the base also included a siphon tube with thehope that this could be used to measure and if necessary control thewater table within each core. However, the siphon tubes readilyblocked, probably because they contacted the relatively impermeableclay at the base of each core, and proved an ineffective means of mea-suring or controlling water table within each core. The cores were alltransported to the Department of Earth Sciences, Durham Universityand sited outside the department for the duration of the experiment.All cores experienced the same weather conditions i.e. rainfall, withno additional water being added. Whilst all cores were extractedfrom next to each other and experienced the same conditions duringthe experiment (including transport), it does not preclude differencesin initial moisture regimes within each core.
Existing work on simulation of livestock trampling has aimed tosimulate the impact of a hoof on soil (Di et al., 2001; Walker et al.,2005). From a review of literature into pressure exerted by livestock(Table 1), a pressure was simulated that was within the range ofreported values for sheep trampling. To create a constant pressureacross the entire surface area of the cores, a 2.5 kg weight (diameter14 cm) was dropped from a constant height of ~50 cm. By factoring
in the average depth of penetration into the peat surface each time(~1 cm), this resulted in an effective pressure of ~70 kPa. To createdifferent trampling intensities, instead of varying the pressure, thefrequency of trampling was varied. This was felt to reflect sheep be-haviour better and provide more useful data than varying thepressure.
To test long-termchanges to CO2fluxes a set of cores (3 cores in eachset)was trampled: daily (“high” intensity); once aweek (“low” intensi-ty); and set of 3 cores was left as a control and was not trampled at allduring the project (Table 2). In the UK, it is typical that hill and uplandvarieties of sheep would only spend a proportion of the year on the hill(typically May through to November) and the rest at a lower altitudeand so upland peat soils would typically have up to half a year freefrom sheep trampling. Therefore, to test whether the removal of tram-pling affects CO2 a final set of 3 cores were trampled twice a weekuntil the beginning of December (96 days after start of trampling) andthen trampling ceased but monitoring was maintained for a further89 days. These cores are known as the “trampling & cessation” cores.For practical reasons of access to the field site, monitoring of the coreswas from 1st September 2010 to 28th February 2011, i.e. 26 weeks.
Therefore, within this study, two sub experiments can be defined.Firstly, the question of whether trampling intensity affects CO2 fluxeswas investigated by analysing data from the control cores; the low in-tensity cores and high intensity cores, i.e. consistent trampling ratesfor the 6 month duration — this is referred to as “Experiment 1”. Sec-ondly, it was possible to study, using the “trampling & cessation”cores and comparisons to the control cores, whether the cessationof trampling allows a ‘recovery’ phase for CO2 fluxes— this is referredto as “Experiment 2”.
2.2. CO2 monitoring
Carbon dioxide fluxes were measured bi-weekly and were mea-sured with an infra-red gas analyser (IRGA) (PP systems EGM-4,Hitchin, UK) which was fitted with a purpose built clear acrylic closedchamber from PP-systems (PP-systems CPY-2 Canopy AssimilationChamber). The chamber also included an air temperature probe anda photosynthetically active radiation (PAR) gauge. When using a
61G.D. Clay, F. Worrall / Geoderma 197–198 (2013) 59–66
clear chamber the measured flux was considered as the sum of pho-tosynthesis (Pg) and ecosystem respiration (Reco), i.e. the net ecosys-tem exchange (NEE). In order to measure only Reco, the chamber wascovered to exclude all light — Pg was therefore estimated from thedifference between NEE and Reco. Each flux measurement was forapproximately 2 min with air temperature and PAR being recordedsimultaneously. This study used the following sign convention forall CO2 flux values reported: Pg was always negative in sign i.e. carbonuptake by system; Reco was always positive i.e. carbon release by sys-tem; and NEE could be either positive or negative. Processed datawere subjected to quality control by: removing statistical outliersusing Grubbs' test at 95% confidence level; removing any Pg valuesgreater than zero; classing all negative flux values for Reco as zero;only allowing Pg values to be calculated if there were two acceptedvalues for Reco and NEE.
2.3. Surface depression and bulk density analysis
Throughout themonitoring period the depth to the peat surface, rel-ative to the top of the core, was monitored approximately every2 months in order to monitor surface depression during the study. Aswater table could not be effectively measured, an alternative measureof hydrological differences between cores was used. By normalisingthe surface depression of the trampled cores to that of the controlcores, a relativemeasure of surface depression could be used as a covar-iate in the ANOVA models — termed “relative trampling”. It is assumedthat trampling will affect the water table in the trampled cores in pro-portion to changes in surface depression, i.e. water table rises withincreasing trampling, therefore by using the relative change in surfacedepression we propose this as a possible method to gain a roughproxy for depth to water table in the absence of direct measurement.
At the end of the 26 weeks of the CO2 monitoring period, the coreswere analysed for bulk density. Three sub-cores were extracted fromeach of the 0–10 cm and 10–20 cm peat layers in each core using bulkdensity tubes (1.75 cm radius by 10 cm length). For each level oftrampling intensity i.e. 4 levels (control, low, high and “trampling& cessation”), there were 9 bulk density determinations for eachdepth profile; therefore, there were 36 bulk density measurementsfor each sampling depth. Samples were weighed wet and thenweighed dry after 48 h at 60 °C in order to calculate dry bulk density.
2.4. Statistical design
2.4.1. ANOVAThe experimental design represented a factorial design with re-
spect to the trampling effect of grazing intensity and as such analysisof variance (ANOVA) was used with the results. There are severalassumptions associated with using the ANOVA approach. Firstly, theLevene test was used to assess homogeneity of variance with respectto the factors in ANOVA; if this test failed then data were log-transformed and retested; however, it should also be noted thatANOVA is robust against this assumption and that it never provednecessary to perform any further transformation of the data. Second-ly, in order to avoid type I errors all probability values are given evenif significance is assessed at the 95% level.
The proportion of variance explained, or the magnitude of effects,of each significant factor and interaction were calculated using gener-alised ω2 (Olejnik and Algina, 2003). Where appropriate covariateswere included in the analysis and significance tested accordingly(ANCOVA). It had been hoped that depth of water table could havebeen included as a covariate in the analysis but for reasons statedabove this proved impossible. Post-hoc testing of the results betweenfactor levels, using Tukey's pairwise comparisons, was carried out inorder to assess where significant differences lay between factor levels.The ANOVA was carried out using Minitab v14 software package.
2.4.1.1. Experiment 1. For Experiment 1, the “trampling & cessation”cores (i.e. recovery cores) were excluded from the analysis; therefore,the intensity levels in ANOVA are control, high and low i.e. extremes oftrampling intensity. The following factors were considered: tramplingintensity; month and the interaction term of intensity and month. Tem-perature (K), photosynthetically active radiation (PAR), “relative tram-pling” and, where appropriate, Pg were included as covariates. As thedata failed the Levene test, all CO2 data were ln-transformed andln-transformed covariateswere used (lnPg, lnPAR and lnT)where appro-priate. By analysing the data without covariates it is possible to in-vestigate if there were any significant differences between tramplingtreatments, whilst the inclusion of covariates allows for the explanationof any observed differences by the available covariates.
2.4.1.2. Experiment 2. For Experiment 2, only the “trampling & cessa-tion” cores are included in the analysis. The control cores are usedto normalise the “trampling & cessation” i.e. accounting for the base-line set by the control cores. Both the ln-transformed and normaliseddata were analysed using ANOVAwith a “Before/After” trampling ces-sation factor that was used in conjunction with temperature, PAR,“relative trampling” and Pg as covariates. Month could not be includ-ed as this was collinear with the “Before/After” factor. By includingPAR and temperature as covariates some of inter-month variationshould be captured.
2.4.1.3. Bulk density. For bulk density, trampling intensity and soillayer division i.e. 0–10 cm or 10–20 cm, were used as factors inANOVA and post-hoc Tukey testing was carried out on the tramplingintensity factor.
2.4.2. Multiple linear regression (MLR)Empirical models of ecosystem respiration were calculated for the
treatments in Experiment 1 (i.e. control, low and high intensity) usingmultiple linear regression (MLR) analysis (Eq. (1)). These modelswere created to test for the effects of variables on Reco and in this caselnReco was modelled as:
ln Reco ¼ a ln Pg þEaUT
þ b ln PAR þ c sinmπ6
� �þ d cos
mπ6
� �þ e ð1Þ
where: Ea=activation energy (J (g CO2)−1); U=universal gas constant(J K−1 (g CO2)); m=month number (1=January to 12=December);and a, b, c, d, e=constants.
This approach may appear as a purely empirical approach but infact it combines structural elements above and beyond those tradi-tionally used and suggested in the literature (e.g. Arrhenius equationbased approaches to describing the temperature dependence of soilrespiration, Lloyd and Taylor, 1994). Structural equations such asEq. (1) can be combined into process-based models able to predictcarbon budgets for peat soils (e.g. Worrall et al., 2009a). The use ofMLR has been used in other peatland settings to model successfullyReco using the predictors used in Eq. (1) (Clay et al., 2012). A regres-sion model was calculated for each trampling intensity in order to in-vestigate if there were any significant differences in the modelconstruction between treatments. By changing the trampling intensi-ty it may be that there are particular values or thresholds for themodel coefficients such that a systematic differences between tram-pling intensities can be observed.
3. Results
3.1. Surface depression and bulk density changes
3.1.1. Surface depressionThe mean surface depression across the entire monitoring period
shows that all cores experienced a surface depression, as measured by
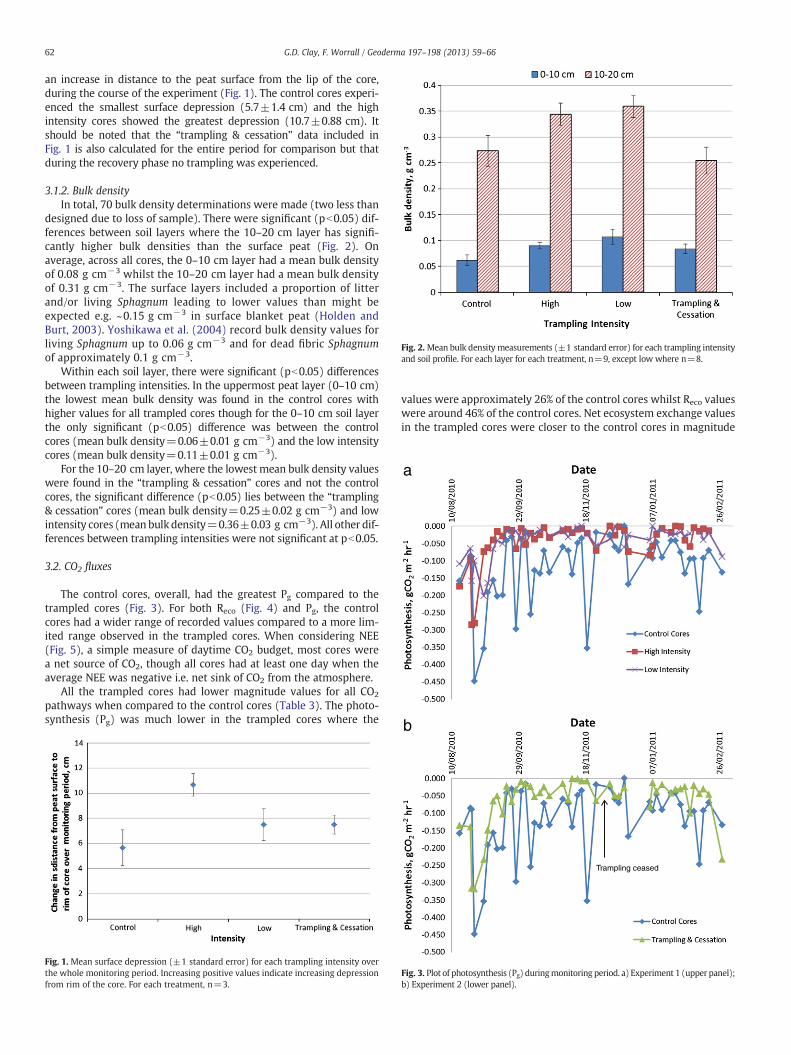
Fig. 2. Mean bulk density measurements (±1 standard error) for each trampling intensityand soil profile. For each layer for each treatment, n=9, except low where n=8.
a
62 G.D. Clay, F. Worrall / Geoderma 197–198 (2013) 59–66
an increase in distance to the peat surface from the lip of the core,during the course of the experiment (Fig. 1). The control cores experi-enced the smallest surface depression (5.7±1.4 cm) and the highintensity cores showed the greatest depression (10.7±0.88 cm). Itshould be noted that the “trampling & cessation” data included inFig. 1 is also calculated for the entire period for comparison but thatduring the recovery phase no trampling was experienced.
3.1.2. Bulk densityIn total, 70 bulk density determinations were made (two less than
designed due to loss of sample). There were significant (pb0.05) dif-ferences between soil layers where the 10–20 cm layer has signifi-cantly higher bulk densities than the surface peat (Fig. 2). Onaverage, across all cores, the 0–10 cm layer had a mean bulk densityof 0.08 g cm−3 whilst the 10–20 cm layer had a mean bulk densityof 0.31 g cm−3. The surface layers included a proportion of litterand/or living Sphagnum leading to lower values than might beexpected e.g. ~0.15 g cm−3 in surface blanket peat (Holden andBurt, 2003). Yoshikawa et al. (2004) record bulk density values forliving Sphagnum up to 0.06 g cm−3 and for dead fibric Sphagnumof approximately 0.1 g cm−3.
Within each soil layer, there were significant (pb0.05) differencesbetween trampling intensities. In the uppermost peat layer (0–10 cm)the lowest mean bulk density was found in the control cores withhigher values for all trampled cores though for the 0–10 cm soil layerthe only significant (pb0.05) difference was between the controlcores (mean bulk density=0.06±0.01 g cm−3) and the low intensitycores (mean bulk density=0.11±0.01 g cm−3).
For the 10–20 cm layer, where the lowest mean bulk density valueswere found in the “trampling & cessation” cores and not the controlcores, the significant difference (pb0.05) lies between the “trampling& cessation” cores (mean bulk density=0.25±0.02 g cm−3) and lowintensity cores (mean bulk density=0.36±0.03 g cm−3). All other dif-ferences between trampling intensities were not significant at pb0.05.
3.2. CO2 fluxes
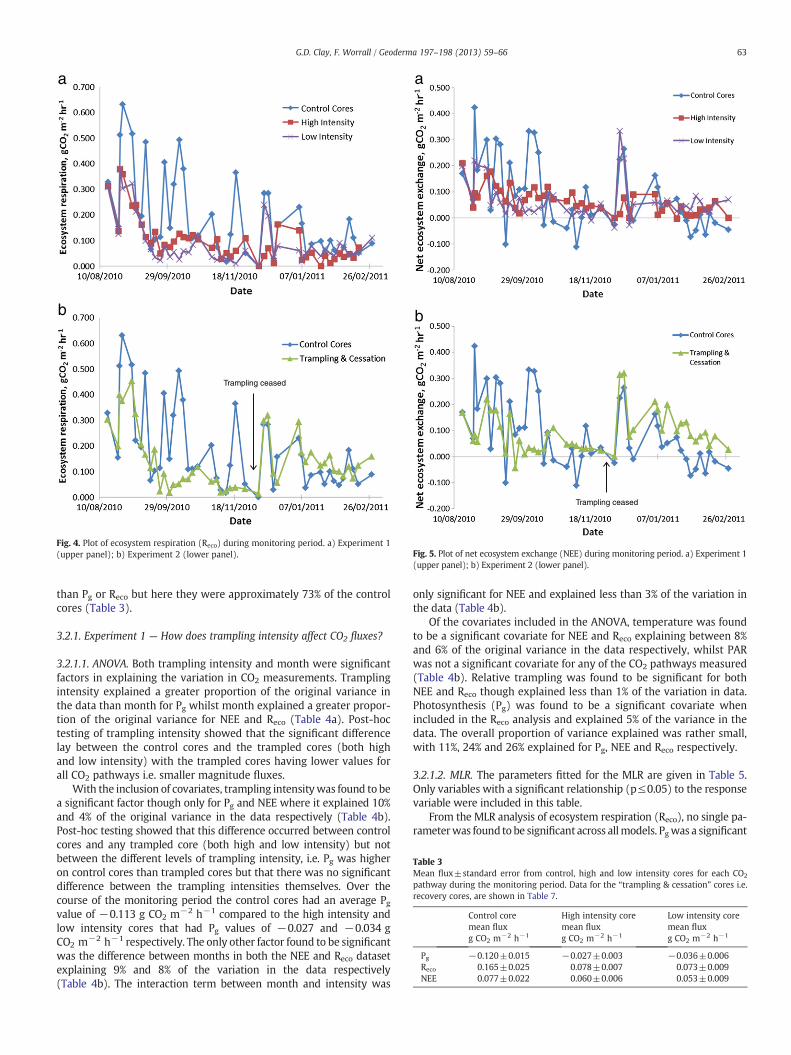
The control cores, overall, had the greatest Pg compared to thetrampled cores (Fig. 3). For both Reco (Fig. 4) and Pg, the controlcores had a wider range of recorded values compared to a more lim-ited range observed in the trampled cores. When considering NEE(Fig. 5), a simple measure of daytime CO2 budget, most cores werea net source of CO2, though all cores had at least one day when theaverage NEE was negative i.e. net sink of CO2 from the atmosphere.
All the trampled cores had lower magnitude values for all CO2
pathways when compared to the control cores (Table 3). The photo-synthesis (Pg) was much lower in the trampled cores where the
Fig. 1. Mean surface depression (±1 standard error) for each trampling intensity overthe whole monitoring period. Increasing positive values indicate increasing depressionfrom rim of the core. For each treatment, n=3.
values were approximately 26% of the control cores whilst Reco valueswere around 46% of the control cores. Net ecosystem exchange valuesin the trampled cores were closer to the control cores in magnitude
Trampling ceased
b
Fig. 3. Plot of photosynthesis (Pg) duringmonitoring period. a) Experiment 1 (upper panel);b) Experiment 2 (lower panel).
Trampling ceased
a
b
Fig. 4. Plot of ecosystem respiration (Reco) during monitoring period. a) Experiment 1(upper panel); b) Experiment 2 (lower panel).
Trampling ceased
a
b
Fig. 5. Plot of net ecosystem exchange (NEE) during monitoring period. a) Experiment 1(upper panel); b) Experiment 2 (lower panel).
Table 3Mean flux±standard error from control, high and low intensity cores for each CO2
pathway during the monitoring period. Data for the “trampling & cessation” cores i.e.recovery cores, are shown in Table 7.
Control coremean fluxg CO2 m−2 h−1
High intensity coremean fluxg CO2 m−2 h−1
Low intensity coremean fluxg CO2 m−2 h−1
Pg −0.120±0.015 −0.027±0.003 −0.036±0.006Reco 0.165±0.025 0.078±0.007 0.073±0.009NEE 0.077±0.022 0.060±0.006 0.053±0.009
63G.D. Clay, F. Worrall / Geoderma 197–198 (2013) 59–66
than Pg or Reco but here they were approximately 73% of the controlcores (Table 3).
3.2.1. Experiment 1 — How does trampling intensity affect CO2 fluxes?
3.2.1.1. ANOVA. Both trampling intensity and month were significantfactors in explaining the variation in CO2 measurements. Tramplingintensity explained a greater proportion of the original variance inthe data than month for Pg whilst month explained a greater propor-tion of the original variance for NEE and Reco (Table 4a). Post-hoctesting of trampling intensity showed that the significant differencelay between the control cores and the trampled cores (both highand low intensity) with the trampled cores having lower values forall CO2 pathways i.e. smaller magnitude fluxes.
With the inclusion of covariates, trampling intensitywas found to bea significant factor though only for Pg and NEE where it explained 10%and 4% of the original variance in the data respectively (Table 4b).Post-hoc testing showed that this difference occurred between controlcores and any trampled core (both high and low intensity) but notbetween the different levels of trampling intensity, i.e. Pg was higheron control cores than trampled cores but that there was no significantdifference between the trampling intensities themselves. Over thecourse of the monitoring period the control cores had an average Pgvalue of −0.113 g CO2 m−2 h−1 compared to the high intensity andlow intensity cores that had Pg values of −0.027 and −0.034 gCO2 m−2 h−1 respectively. The only other factor found to be significantwas the difference between months in both the NEE and Reco datasetexplaining 9% and 8% of the variation in the data respectively(Table 4b). The interaction term between month and intensity was
only significant for NEE and explained less than 3% of the variation inthe data (Table 4b).
Of the covariates included in the ANOVA, temperature was foundto be a significant covariate for NEE and Reco explaining between 8%and 6% of the original variance in the data respectively, whilst PARwas not a significant covariate for any of the CO2 pathways measured(Table 4b). Relative trampling was found to be significant for bothNEE and Reco though explained less than 1% of the variation in data.Photosynthesis (Pg) was found to be a significant covariate whenincluded in the Reco analysis and explained 5% of the variance in thedata. The overall proportion of variance explained was rather small,with 11%, 24% and 26% explained for Pg, NEE and Reco respectively.
3.2.1.2. MLR. The parameters fitted for the MLR are given in Table 5.Only variables with a significant relationship (p≤0.05) to the responsevariable were included in this table.
From the MLR analysis of ecosystem respiration (Reco), no single pa-rameterwas found to be significant across allmodels. Pgwas a significant
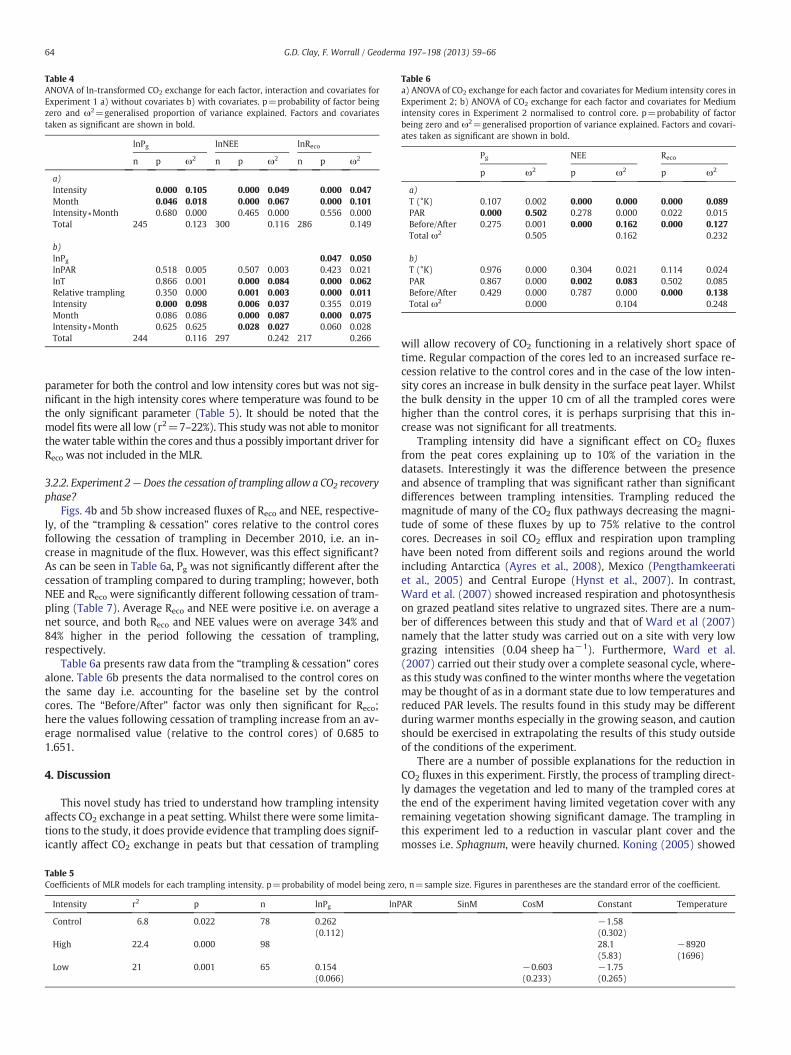
Table 4ANOVA of ln-transformed CO2 exchange for each factor, interaction and covariates forExperiment 1 a) without covariates b) with covariates. p=probability of factor beingzero and ω2=generalised proportion of variance explained. Factors and covariatestaken as significant are shown in bold.
lnPg lnNEE lnReco
n p ω2 n p ω2 n p ω2
a)Intensity 0.000 0.105 0.000 0.049 0.000 0.047Month 0.046 0.018 0.000 0.067 0.000 0.101Intensity∗Month 0.680 0.000 0.465 0.000 0.556 0.000Total 245 0.123 300 0.116 286 0.149
b)lnPg 0.047 0.050lnPAR 0.518 0.005 0.507 0.003 0.423 0.021lnT 0.866 0.001 0.000 0.084 0.000 0.062Relative trampling 0.350 0.000 0.001 0.003 0.000 0.011Intensity 0.000 0.098 0.006 0.037 0.355 0.019Month 0.086 0.086 0.000 0.087 0.000 0.075Intensity∗Month 0.625 0.625 0.028 0.027 0.060 0.028Total 244 0.116 297 0.242 217 0.266
Table 6a) ANOVA of CO2 exchange for each factor and covariates for Medium intensity cores inExperiment 2; b) ANOVA of CO2 exchange for each factor and covariates for Mediumintensity cores in Experiment 2 normalised to control core. p=probability of factorbeing zero and ω2=generalised proportion of variance explained. Factors and covari-ates taken as significant are shown in bold.
Pg NEE Reco
p ω2 p ω2 p ω2
a)T (°K) 0.107 0.002 0.000 0.000 0.000 0.089PAR 0.000 0.502 0.278 0.000 0.022 0.015Before/After 0.275 0.001 0.000 0.162 0.000 0.127Total ω2 0.505 0.162 0.232
b)T (°K) 0.976 0.000 0.304 0.021 0.114 0.024PAR 0.867 0.000 0.002 0.083 0.502 0.085Before/After 0.429 0.000 0.787 0.000 0.000 0.138Total ω2 0.000 0.104 0.248
64 G.D. Clay, F. Worrall / Geoderma 197–198 (2013) 59–66
parameter for both the control and low intensity cores but was not sig-nificant in the high intensity cores where temperature was found to bethe only significant parameter (Table 5). It should be noted that themodel fits were all low (r2=7–22%). This study was not able tomonitorthe water table within the cores and thus a possibly important driver forReco was not included in the MLR.
3.2.2. Experiment 2—Does the cessation of trampling allow a CO2 recoveryphase?
Figs. 4b and 5b show increased fluxes of Reco and NEE, respective-ly, of the “trampling & cessation” cores relative to the control coresfollowing the cessation of trampling in December 2010, i.e. an in-crease in magnitude of the flux. However, was this effect significant?As can be seen in Table 6a, Pg was not significantly different after thecessation of trampling compared to during trampling; however, bothNEE and Reco were significantly different following cessation of tram-pling (Table 7). Average Reco and NEE were positive i.e. on average anet source, and both Reco and NEE values were on average 34% and84% higher in the period following the cessation of trampling,respectively.
Table 6a presents raw data from the “trampling & cessation” coresalone. Table 6b presents the data normalised to the control cores onthe same day i.e. accounting for the baseline set by the controlcores. The “Before/After” factor was only then significant for Reco;here the values following cessation of trampling increase from an av-erage normalised value (relative to the control cores) of 0.685 to1.651.
4. Discussion
This novel study has tried to understand how trampling intensityaffects CO2 exchange in a peat setting. Whilst there were some limita-tions to the study, it does provide evidence that trampling does signif-icantly affect CO2 exchange in peats but that cessation of trampling
Table 5Coefficients of MLR models for each trampling intensity. p=probability of model being zer
Intensity r2 p n lnPg lnP
Control 6.8 0.022 78 0.262(0.112)
High 22.4 0.000 98
Low 21 0.001 65 0.154(0.066)
will allow recovery of CO2 functioning in a relatively short space oftime. Regular compaction of the cores led to an increased surface re-cession relative to the control cores and in the case of the low inten-sity cores an increase in bulk density in the surface peat layer. Whilstthe bulk density in the upper 10 cm of all the trampled cores werehigher than the control cores, it is perhaps surprising that this in-crease was not significant for all treatments.
Trampling intensity did have a significant effect on CO2 fluxesfrom the peat cores explaining up to 10% of the variation in thedatasets. Interestingly it was the difference between the presenceand absence of trampling that was significant rather than significantdifferences between trampling intensities. Trampling reduced themagnitude of many of the CO2 flux pathways decreasing the magni-tude of some of these fluxes by up to 75% relative to the controlcores. Decreases in soil CO2 efflux and respiration upon tramplinghave been noted from different soils and regions around the worldincluding Antarctica (Ayres et al., 2008), Mexico (Pengthamkeeratiet al., 2005) and Central Europe (Hynst et al., 2007). In contrast,Ward et al. (2007) showed increased respiration and photosynthesison grazed peatland sites relative to ungrazed sites. There are a num-ber of differences between this study and that of Ward et al (2007)namely that the latter study was carried out on a site with very lowgrazing intensities (0.04 sheep ha−1). Furthermore, Ward et al.(2007) carried out their study over a complete seasonal cycle, where-as this study was confined to the winter months where the vegetationmay be thought of as in a dormant state due to low temperatures andreduced PAR levels. The results found in this study may be differentduring warmer months especially in the growing season, and cautionshould be exercised in extrapolating the results of this study outsideof the conditions of the experiment.
There are a number of possible explanations for the reduction inCO2 fluxes in this experiment. Firstly, the process of trampling direct-ly damages the vegetation and led to many of the trampled cores atthe end of the experiment having limited vegetation cover with anyremaining vegetation showing significant damage. The trampling inthis experiment led to a reduction in vascular plant cover and themosses i.e. Sphagnum, were heavily churned. Koning (2005) showed
o, n=sample size. Figures in parentheses are the standard error of the coefficient.
AR SinM CosM Constant Temperature
−1.58(0.302)28.1(5.83)
−8920(1696)
−0.603(0.233)
−1.75(0.265)
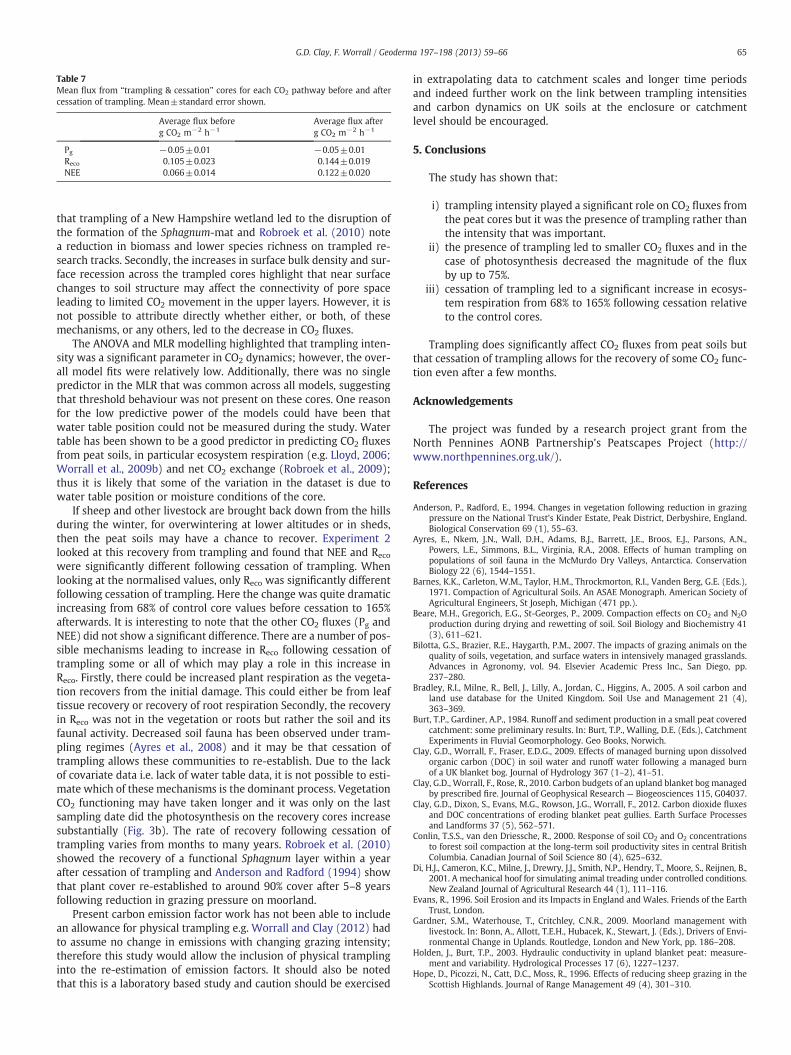
Table 7Mean flux from “trampling & cessation” cores for each CO2 pathway before and aftercessation of trampling. Mean±standard error shown.
Average flux beforeg CO2 m−2 h−1
Average flux afterg CO2 m−2 h−1
Pg −0.05±0.01 −0.05±0.01Reco 0.105±0.023 0.144±0.019NEE 0.066±0.014 0.122±0.020
65G.D. Clay, F. Worrall / Geoderma 197–198 (2013) 59–66
that trampling of a New Hampshire wetland led to the disruption ofthe formation of the Sphagnum-mat and Robroek et al. (2010) notea reduction in biomass and lower species richness on trampled re-search tracks. Secondly, the increases in surface bulk density and sur-face recession across the trampled cores highlight that near surfacechanges to soil structure may affect the connectivity of pore spaceleading to limited CO2 movement in the upper layers. However, it isnot possible to attribute directly whether either, or both, of thesemechanisms, or any others, led to the decrease in CO2 fluxes.
The ANOVA and MLR modelling highlighted that trampling inten-sity was a significant parameter in CO2 dynamics; however, the over-all model fits were relatively low. Additionally, there was no singlepredictor in the MLR that was common across all models, suggestingthat threshold behaviour was not present on these cores. One reasonfor the low predictive power of the models could have been thatwater table position could not be measured during the study. Watertable has been shown to be a good predictor in predicting CO2 fluxesfrom peat soils, in particular ecosystem respiration (e.g. Lloyd, 2006;Worrall et al., 2009b) and net CO2 exchange (Robroek et al., 2009);thus it is likely that some of the variation in the dataset is due towater table position or moisture conditions of the core.
If sheep and other livestock are brought back down from the hillsduring the winter, for overwintering at lower altitudes or in sheds,then the peat soils may have a chance to recover. Experiment 2looked at this recovery from trampling and found that NEE and Reco
were significantly different following cessation of trampling. Whenlooking at the normalised values, only Reco was significantly differentfollowing cessation of trampling. Here the change was quite dramaticincreasing from 68% of control core values before cessation to 165%afterwards. It is interesting to note that the other CO2 fluxes (Pg andNEE) did not show a significant difference. There are a number of pos-sible mechanisms leading to increase in Reco following cessation oftrampling some or all of which may play a role in this increase inReco. Firstly, there could be increased plant respiration as the vegeta-tion recovers from the initial damage. This could either be from leaftissue recovery or recovery of root respiration Secondly, the recoveryin Reco was not in the vegetation or roots but rather the soil and itsfaunal activity. Decreased soil fauna has been observed under tram-pling regimes (Ayres et al., 2008) and it may be that cessation oftrampling allows these communities to re-establish. Due to the lackof covariate data i.e. lack of water table data, it is not possible to esti-mate which of these mechanisms is the dominant process. VegetationCO2 functioning may have taken longer and it was only on the lastsampling date did the photosynthesis on the recovery cores increasesubstantially (Fig. 3b). The rate of recovery following cessation oftrampling varies from months to many years. Robroek et al. (2010)showed the recovery of a functional Sphagnum layer within a yearafter cessation of trampling and Anderson and Radford (1994) showthat plant cover re-established to around 90% cover after 5–8 yearsfollowing reduction in grazing pressure on moorland.
Present carbon emission factor work has not been able to includean allowance for physical trampling e.g. Worrall and Clay (2012) hadto assume no change in emissions with changing grazing intensity;therefore this study would allow the inclusion of physical tramplinginto the re-estimation of emission factors. It should also be notedthat this is a laboratory based study and caution should be exercised
in extrapolating data to catchment scales and longer time periodsand indeed further work on the link between trampling intensitiesand carbon dynamics on UK soils at the enclosure or catchmentlevel should be encouraged.
5. Conclusions
The study has shown that:
i) trampling intensity played a significant role on CO2 fluxes fromthe peat cores but it was the presence of trampling rather thanthe intensity that was important.
ii) the presence of trampling led to smaller CO2 fluxes and in thecase of photosynthesis decreased the magnitude of the fluxby up to 75%.
iii) cessation of trampling led to a significant increase in ecosys-tem respiration from 68% to 165% following cessation relativeto the control cores.
Trampling does significantly affect CO2 fluxes from peat soils butthat cessation of trampling allows for the recovery of some CO2 func-tion even after a few months.
Acknowledgements
The project was funded by a research project grant from theNorth Pennines AONB Partnership's Peatscapes Project (http://www.northpennines.org.uk/).
References
Anderson, P., Radford, E., 1994. Changes in vegetation following reduction in grazingpressure on the National Trust's Kinder Estate, Peak District, Derbyshire, England.Biological Conservation 69 (1), 55–63.
Ayres, E., Nkem, J.N., Wall, D.H., Adams, B.J., Barrett, J.E., Broos, E.J., Parsons, A.N.,Powers, L.E., Simmons, B.L., Virginia, R.A., 2008. Effects of human trampling onpopulations of soil fauna in the McMurdo Dry Valleys, Antarctica. ConservationBiology 22 (6), 1544–1551.
Barnes, K.K., Carleton, W.M., Taylor, H.M., Throckmorton, R.I., Vanden Berg, G.E. (Eds.),1971. Compaction of Agricultural Soils. An ASAE Monograph. American Society ofAgricultural Engineers, St Joseph, Michigan (471 pp.).
Beare, M.H., Gregorich, E.G., St-Georges, P., 2009. Compaction effects on CO2 and N2Oproduction during drying and rewetting of soil. Soil Biology and Biochemistry 41(3), 611–621.
Bilotta, G.S., Brazier, R.E., Haygarth, P.M., 2007. The impacts of grazing animals on thequality of soils, vegetation, and surface waters in intensively managed grasslands.Advances in Agronomy, vol. 94. Elsevier Academic Press Inc., San Diego, pp.237–280.
Bradley, R.I., Milne, R., Bell, J., Lilly, A., Jordan, C., Higgins, A., 2005. A soil carbon andland use database for the United Kingdom. Soil Use and Management 21 (4),363–369.
Burt, T.P., Gardiner, A.P., 1984. Runoff and sediment production in a small peat coveredcatchment: some preliminary results. In: Burt, T.P., Walling, D.E. (Eds.), CatchmentExperiments in Fluvial Geomorphology. Geo Books, Norwich.
Clay, G.D., Worrall, F., Fraser, E.D.G., 2009. Effects of managed burning upon dissolvedorganic carbon (DOC) in soil water and runoff water following a managed burnof a UK blanket bog. Journal of Hydrology 367 (1–2), 41–51.
Clay, G.D., Worrall, F., Rose, R., 2010. Carbon budgets of an upland blanket bog managedby prescribed fire. Journal of Geophysical Research — Biogeosciences 115, G04037.
Clay, G.D., Dixon, S., Evans, M.G., Rowson, J.G., Worrall, F., 2012. Carbon dioxide fluxesand DOC concentrations of eroding blanket peat gullies. Earth Surface Processesand Landforms 37 (5), 562–571.
Conlin, T.S.S., van den Driessche, R., 2000. Response of soil CO2 and O2 concentrationsto forest soil compaction at the long-term soil productivity sites in central BritishColumbia. Canadian Journal of Soil Science 80 (4), 625–632.
Di, H.J., Cameron, K.C., Milne, J., Drewry, J.J., Smith, N.P., Hendry, T., Moore, S., Reijnen, B.,2001. A mechanical hoof for simulating animal treading under controlled conditions.New Zealand Journal of Agricultural Research 44 (1), 111–116.
Evans, R., 1996. Soil Erosion and its Impacts in England and Wales. Friends of the EarthTrust, London.
Gardner, S.M., Waterhouse, T., Critchley, C.N.R., 2009. Moorland management withlivestock. In: Bonn, A., Allott, T.E.H., Hubacek, K., Stewart, J. (Eds.), Drivers of Envi-ronmental Change in Uplands. Routledge, London and New York, pp. 186–208.
Holden, J., Burt, T.P., 2003. Hydraulic conductivity in upland blanket peat: measure-ment and variability. Hydrological Processes 17 (6), 1227–1237.
Hope, D., Picozzi, N., Catt, D.C., Moss, R., 1996. Effects of reducing sheep grazing in theScottish Highlands. Journal of Range Management 49 (4), 301–310.
66 G.D. Clay, F. Worrall / Geoderma 197–198 (2013) 59–66
Hynst, J., Simek, M., Brucek, P., Petersen, S.O., 2007. High fluxes but different patterns ofnitrous oxide and carbon dioxide emissions from soil in a cattle overwinteringarea. Agriculture, Ecosystems and Environment 120 (2–4), 269–279.
Joint Nature Conservation Committee, 2009. Common Standards Monitoring Guidancefor Upland Habitats. JNCC, Peterborough.
Koning, C., 2005. Vegetation patterns resulting from spatial and temporal variability inhydrology, soils, and trampling in an isolated basin marsh, New Hampshire, USA.Wetlands 25 (2), 239–251.
Limpens, J., Berendse, F., Blodau, C., Canadell, J.G., Freeman, C., Holden, J., Roulet, N.,Rydin, H., Schaepman-Strub, G., 2008. Peatlands and the carbon cycle: from localprocesses to global implications — a synthesis. Biogeosciences 5 (5), 1475–1491.
Lloyd, C.R., 2006. Annual carbon balance of a managed wetland meadow in the SomersetLevels, UK. Agricultural and Forest Meteorology 138 (1–4), 168–179.
Lloyd, J., Taylor, J.A., 1994. On the temperature dependence of soil respiration. FunctionalEcology 8 (3), 315–323.
Mackay, A.W., Tallis, J.H., 1996. Summit-type blanket mire erosion in the forest ofBowland, Lancashire, UK: predisposing factors and implications for conservation.Biological Conservation 76 (1), 31–44.
Marshall, T.J., Holmes, J.W., 1992. Soil Physics. Cambridge University Press, Newcastleupon Tyne . (374 pp.).
Meyles, E.W., Williams, A.G., Ternan, J.L., Anderson, J.M., Dowd, J.F., 2006. The influenceof grazing on vegetation, soil properties and stream discharge in a small Dartmoorcatchment, southwest England, UK. Earth Surface Processes and Landforms 31 (5),622–631.
Olejnik, S., Algina, J., 2003. Generalized eta and omega squared statistics: measures of ef-fect size for some common research designs. Psychological Methods 8 (4), 434–447.
Pengthamkeerati, P., Motavalli, P.P., Kremer, R.J., Anderson, S.H., 2005. Soil carbon diox-ide efflux from a claypan soil affected by surface compaction and applications ofpoultry litter. Agriculture, Ecosystems and Environment 109 (1–2), 75–86.
Robroek, B.J.M., Schouten, M.G.C., Limpens, J., Berendse, F., Poorter, H., 2009. Interactiveeffects of water table and precipitation on net CO2 assimilation of three co-occurring Sphagnum mosses differing in distribution above the water table. GlobalChange Biology 15 (3), 680–691.
Robroek, B.J.M., Smart, R.P., Holden, J., 2010. Sensitivity of blanket peat vegetation andhydrochemistry to local disturbances. Science of the Total Environment 408 (21),5028–5034.
Roulet, N.T., Lafleur, P.M., Richard, P.J.H., Moore, T.R., Humphreys, E.R., Bubier, J., 2007.Contemporary carbon balance and late Holocene carbon accumulation in a northernpeatland. Global Change Biology 13 (2), 397–411.
Ssemakula, J., 1983. A comparative study of hoof pressures of wild and domestics un-gulates. African Journal of Ecology 21 (4), 325–328.
Turunen, J., Tomppo, E., Tolonen, K., Reinikainen, A., 2002. Estimating carbon accumu-lation rates of undrained mires in Finland — application to boreal and subarcticregions. The Holocene 12 (1), 69–80.
van der Tol, P.P.J., Metz, J.H.M., Noordhuizen-Stassen, E.N., Back, W., Braam, C.R., Weijs,W.A., 2002. The pressure distribution under the bovine claw during square stand-ing on a flat substrate. Journal of Dairy Science 85 (6), 1476–1481.
Vitt, D.H., Halsey, L.A., Bauer, I.E., Campbell, C., 2000. Spatial and temporal trends incarbon storage of peatlands of continental western Canada through the Holocene.Canadian Journal of Earth Sciences 37 (5), 683–693.
Walker, M.J., Kutsch, R., Miller, W.W., Cirelli, A., Donaldson, S., 2005. A consistent hoofimpact simulator. Soil Science Society of America Journal 69 (1), 257–259.
Ward, S.E., Bardgett, R.D., McNamara, N.P., Adamson, J.K., Ostle, N.J., 2007. Long-termconsequences of grazing and burning on northern peatland carbon dynamics.Ecosystems 10 (7), 1069–1083.
Willatt, S.T., Pullar, D.M., 1984. Changes in soil physical-properties under grazed pas-tures. Australian Journal of Soil Research 22 (3), 343–348.
Worrall, F., Clay, G.D., 2012. The impact of sheep grazing on the carbon balance of apeatland. Science of the Total Environment 438 (0), 426–434.
Worrall, F., Armstrong, A., Adamson, J.K., 2007. The effects of burning and sheep-grazing on water table depth and soil water quality in an upland peat. Journal ofHydrology 339 (1–2), 1–14.
Worrall, F., Evans, M.G., Bonn, A., Reed, M.S., Chapman, D., Holden, J., 2009a. Can carbonoffsetting pay for upland ecological restoration? Science of the Total Environment408 (1), 26–36.
Worrall, F., Burt, T.P., Rowson, J.G., Warburton, J., Adamson, J.K., 2009b. The multi-annual carbon budget of a peat-covered catchment. Science of the Total Environ-ment 407 (13), 4084–4094.
Worrall, F., Rowson, J.G., Evans, M.G., Pawson, R., Daniels, S., Bonn, A., 2011. Carbonfluxes from eroding peatlands— the carbon benefit of revegetation following wild-fire. Earth Surface Processes and Landforms 36 (11), 1487–1498.
Yoshikawa, K., Overduin, P.P., Harden, J.W., 2004. Moisture content measurements ofmoss (Sphagnum spp.) using commercial sensors. Permafrost and Periglacial Processes15 (4), 309–318.