the relative significance of epas in asia-pacific rieti discussion paper series 14-e-009 january...
TRANSCRIPT
DPRIETI Discussion Paper Series 14-E-009
The Relative Significance of EPAs in Asia-Pacific
KAWASAKI KenichiRIETI
The Research Institute of Economy, Trade and Industryhttp://www.rieti.go.jp/en/
1
RIETI Discussion Paper Series 14-E-009
January 2014 The Relative Significance of EPAs in Asia-Pacific*
KAWASAKI Kenichi
Consulting Fellow, Research Institute of Economy, Trade and Industry (RIETI)**
Abstract
This paper analyzes the relative significance of regional Economic Partnership Agreements (EPAs) in Asia-Pacific. The economy-wide impacts of tariff removals and reductions in non-tariff measures (NTMs) are estimated by using a Computable General Equilibrium (CGE) model of global trade. The Trans-Pacific Partnership (TPP) and the Regional Comprehensive Economic Partnership (RCEP) are shown to complement each other rather than be competitors. The income gains of Asia-Pacific Economic Cooperation (APEC) economies as a whole account for 1.2 per cent of regional GDP by the TPP, 2.1 per cent by the RCEP, and 4.3 per cent by the Free Trade Area of the Asia-Pacific (FTAAP). Meanwhile, larger economic benefits are expected from NTMs reductions in addition to tariff removals. It is thus essential to reform domestic markets in order to enjoy greater economic benefits from international EPAs. Keywords: CGE, EPA, FTA, RTA, TPP, RCEP, FTAAP JEL classification: D58, F13, F15, F17
* An earlier version of this paper was presented at the “2013 International Conference on Asia-Pacific Studies: Leadership Transition in Asia: New Orders or New Problems?” on October 26 and 27, 2013, in Taipei organized by the College of Social Sciences, National Chenghi University and at the 28th Pacific Economic Community Seminar “TPP and RCEP: Emerging Dual-Track Pathways toward FTAAP” on November 13 and 14, 2013, in Taipei organized by the Chinese Taipei Pacific Economic Cooperation Committee and Taiwan Institute of Economic Research. The views expressed in the paper are solely those of the author and do not represent those of the Research Institute of Economy, Trade and Industry (RIETI) or other institutes to which the author is affiliated. ** Also Senior Fellow, National Graduate Institute for Policy Studies and Adjunct Fellow, Japan Institute of International Affairs. *** This study is conducted as a part of the Project “Economic Impacts of Free Trade Agreements: The case of Japan” undertaken at Research Institute of Economy, Trade and Industry(RIETI).
RIETI Discussion Papers Series aims at widely disseminating research results in the form of professional papers, thereby stimulating lively discussion. The views expressed in the papers are solely those of the author(s), and neither represent those of the organization to which the author(s) belong(s) nor the Research Institute of Economy, Trade and Industry.
2
I. Introduction The progress of bilateral and multilateral regional Economic Partnership Agreements (EPAs) has accelerated since the beginning of 2013 when the three largest advanced economies—the United States (US), the European Union (EU), and Japan—launched negotiations on giant triangle EPAs. In Asia-Pacific, formal negotiations on the Regional Comprehensive Economic Partnership (RCEP) began in May 2013, while Japan joined Trans-Pacific Partnership (TPP) negotiations in July of that year. The frequently asked question about the recent framework of Asia-Pacific EPAs has been whether the TPP and the RCEP are competitors or complements? The brief answer to this question is that they are the latter. Indeed, it is generally expected that the greater the number of regional EPA members, the larger the macroeconomic benefits are. Both the TPP and the RCEP are key elements to achieving the ultimate goal of forming the Free Trade Area of the Asia-Pacific (FTAAP). Although they may compete with one another from the perspective of geopolitical interests, this will result in complementary economic benefits. Nevertheless, the current frameworks of the TPP and the RCEP are both lacking one of the two largest economies in Asia-Pacific. The roles of the US in the TPP and China in the RCEP for generating economic benefits have related to both geopolitics and economics. This paper thus examines the breakdown of economic benefits from EPAs by the contributing economies. Leaders of TPP negotiations economies have announced in Trans-Pacific Partnership Leaders Statement on November 12, 2011 that a “common vision to establish a comprehensive, next-generation regional agreement that liberalizes trade and investment and addresses new and traditional trade issues and 21st-century challenges” for “forging close linkages among their economies, enhancing their competitiveness, benefitting their consumers, and supporting the creation and retention of jobs, higher living standards, and the reduction of poverty in their countries.” Therefore, because reductions in non-tariff measures (NTMs) will be significant elements of future agreements, this paper also estimates the economic impacts of NTMs reductions in addition to those of tariff removals. This paper finally quantifies the relative significance of Asia-Pacific EPAs by using a Computable General Equilibrium (CGE) model of global trade based on the most updated version of the global trade and trade protection database. The remainder
3
of this paper is organized as follows. After the overview of the development of EPAs and trends of production and trade in Asia-Pacific in Chapter II, the impacts of Asia-Pacific EPAs are discussed in Chapter III including the data used, modeling methodology employed, and policy scenarios studied. The relative contributions of member economies are analyzed in Chapter IV from a geopolitical perspective. The paper draws conclusions in Chapter V. The framework of the CGE model employed for the simulation experiments in this paper is presented in Annex I.
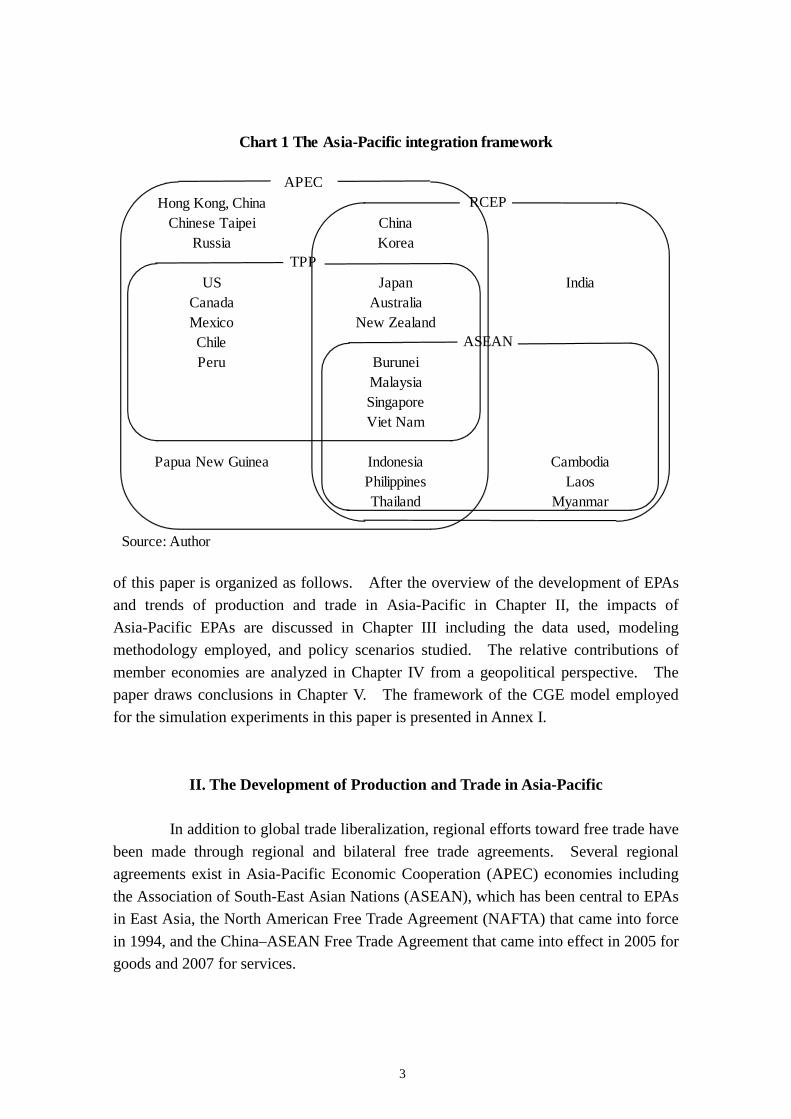
II. The Development of Production and Trade in Asia-Pacific In addition to global trade liberalization, regional efforts toward free trade have been made through regional and bilateral free trade agreements. Several regional agreements exist in Asia-Pacific Economic Cooperation (APEC) economies including the Association of South-East Asian Nations (ASEAN), which has been central to EPAs in East Asia, the North American Free Trade Agreement (NAFTA) that came into force in 1994, and the China–ASEAN Free Trade Agreement that came into effect in 2005 for goods and 2007 for services.
Hong Kong, ChinaChinese Taipei China
Russia Korea
US Japan IndiaCanada AustraliaMexico New ZealandChilePeru Burunei
MalaysiaSingaporeViet Nam
Papua New Guinea Indonesia CambodiaPhilippines LaosThailand Myanmar
Source: Author
Chart 1 The Asia-Pacific integration framework
APECRCEP
TPP
ASEAN
4
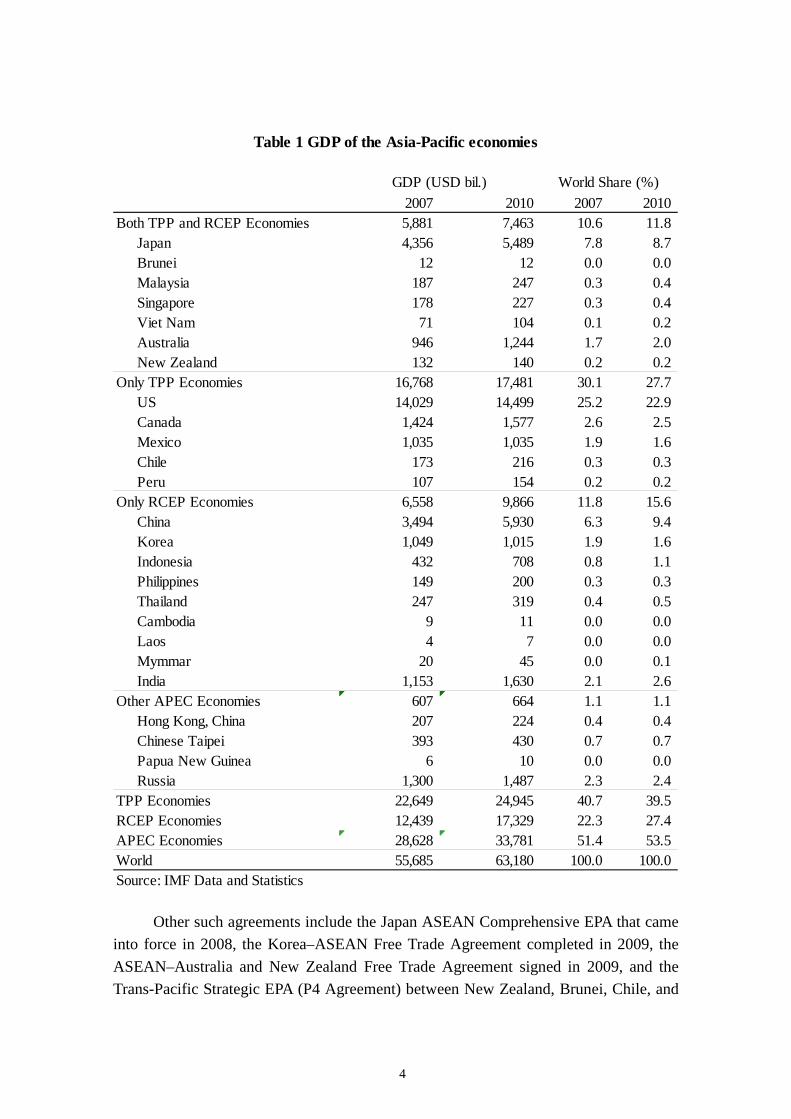
Other such agreements include the Japan ASEAN Comprehensive EPA that came into force in 2008, the Korea–ASEAN Free Trade Agreement completed in 2009, the ASEAN–Australia and New Zealand Free Trade Agreement signed in 2009, and the Trans-Pacific Strategic EPA (P4 Agreement) between New Zealand, Brunei, Chile, and
2007 2010 2007 2010Both TPP and RCEP Economies 5,881 7,463 10.6 11.8
Japan 4,356 5,489 7.8 8.7Brunei 12 12 0.0 0.0Malaysia 187 247 0.3 0.4Singapore 178 227 0.3 0.4Viet Nam 71 104 0.1 0.2Australia 946 1,244 1.7 2.0New Zealand 132 140 0.2 0.2
Only TPP Economies 16,768 17,481 30.1 27.7US 14,029 14,499 25.2 22.9Canada 1,424 1,577 2.6 2.5Mexico 1,035 1,035 1.9 1.6Chile 173 216 0.3 0.3Peru 107 154 0.2 0.2
Only RCEP Economies 6,558 9,866 11.8 15.6China 3,494 5,930 6.3 9.4Korea 1,049 1,015 1.9 1.6Indonesia 432 708 0.8 1.1Philippines 149 200 0.3 0.3Thailand 247 319 0.4 0.5Cambodia 9 11 0.0 0.0Laos 4 7 0.0 0.0Mymmar 20 45 0.0 0.1India 1,153 1,630 2.1 2.6
Other APEC Economies 607 664 1.1 1.1Hong Kong, China 207 224 0.4 0.4Chinese Taipei 393 430 0.7 0.7Papua New Guinea 6 10 0.0 0.0Russia 1,300 1,487 2.3 2.4
TPP Economies 22,649 24,945 40.7 39.5RCEP Economies 12,439 17,329 22.3 27.4APEC Economies 28,628 33,781 51.4 53.5World 55,685 63,180 100.0 100.0Source: IMF Data and Statistics
GDP (USD bil.) World Share (%)
Table 1 GDP of the Asia-Pacific economies
5
Singapore concluded in 2005. Moreover, RCEP negotiations started in May 2013 following the development of two free trade agreements in East Asia, namely the East Asia Free Trade Agreement (EAFTA) between ASEAN and China, Japan, and Korea, and the Comprehensive Economic Partnership in East Asia (CEPEA) that covers ASEAN, Australia, China, India, Japan, Korea, and New Zealand. Japan joined the TPP negotiations in July 2013
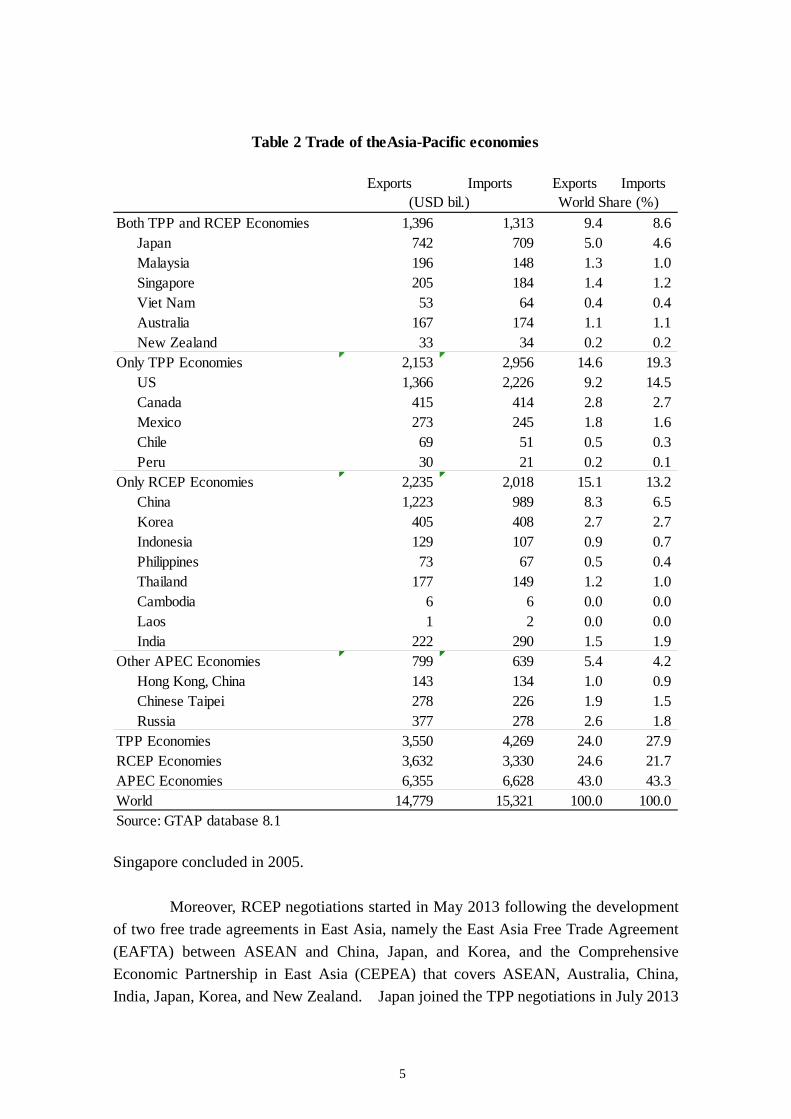
Exports Imports Exports Imports
Both TPP and RCEP Economies 1,396 1,313 9.4 8.6Japan 742 709 5.0 4.6Malaysia 196 148 1.3 1.0Singapore 205 184 1.4 1.2Viet Nam 53 64 0.4 0.4Australia 167 174 1.1 1.1New Zealand 33 34 0.2 0.2
Only TPP Economies 2,153 2,956 14.6 19.3US 1,366 2,226 9.2 14.5Canada 415 414 2.8 2.7Mexico 273 245 1.8 1.6Chile 69 51 0.5 0.3Peru 30 21 0.2 0.1
Only RCEP Economies 2,235 2,018 15.1 13.2China 1,223 989 8.3 6.5Korea 405 408 2.7 2.7Indonesia 129 107 0.9 0.7Philippines 73 67 0.5 0.4Thailand 177 149 1.2 1.0Cambodia 6 6 0.0 0.0Laos 1 2 0.0 0.0India 222 290 1.5 1.9
Other APEC Economies 799 639 5.4 4.2Hong Kong, China 143 134 1.0 0.9Chinese Taipei 278 226 1.9 1.5Russia 377 278 2.6 1.8
TPP Economies 3,550 4,269 24.0 27.9RCEP Economies 3,632 3,330 24.6 21.7APEC Economies 6,355 6,628 43.0 43.3World 14,779 15,321 100.0 100.0Source: GTAP database 8.1
Table 2 Trade of theAsia-Pacific economies
(USD bil.) World Share (%)
6
as the 12th member, which is an expansion of the P4 Agreement that already includes the US, Australia, Peru, Viet Nam, Malaysia, Canada, and Mexico. APEC economies are the fastest-growing regions in the world, with the region’s proportion of global GDP rising above 50 per cent in 2010 (Table 1). TPP economies account for approximately 40 per cent of global GDP compared to more than 20 per cent for the largest economy (the US). Meanwhile, RCEP economies account for approximately 30 per cent of global GDP, with China and Japan each having a proportion of approximately 10 per cent alongside India and three ASEAN countries that are not APEC member economies. The exports and imports of APEC economies are also rising (see Table 2). However, in comparison with GDP, these trade ratios are somewhat lower because of the lower trade ratios in larger economies such as the US, China, and Japan. Higher trade ratios are a common feature of smaller APEC economies.
III. The Impacts of EPAs in Asia-Pacific
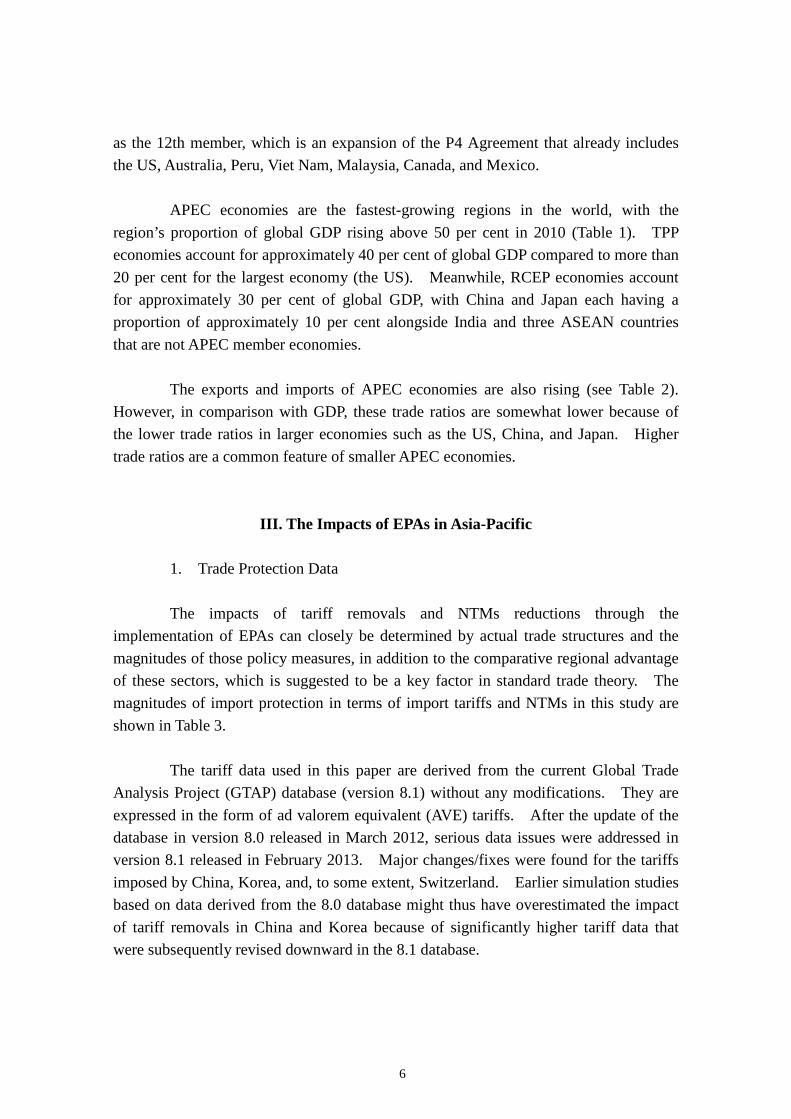
1. Trade Protection Data The impacts of tariff removals and NTMs reductions through the implementation of EPAs can closely be determined by actual trade structures and the magnitudes of those policy measures, in addition to the comparative regional advantage of these sectors, which is suggested to be a key factor in standard trade theory. The magnitudes of import protection in terms of import tariffs and NTMs in this study are shown in Table 3. The tariff data used in this paper are derived from the current Global Trade Analysis Project (GTAP) database (version 8.1) without any modifications. They are expressed in the form of ad valorem equivalent (AVE) tariffs. After the update of the database in version 8.0 released in March 2012, serious data issues were addressed in version 8.1 released in February 2013. Major changes/fixes were found for the tariffs imposed by China, Korea, and, to some extent, Switzerland. Earlier simulation studies based on data derived from the 8.0 database might thus have overestimated the impact of tariff removals in China and Korea because of significantly higher tariff data that were subsequently revised downward in the 8.1 database.
7
Trade liberalization has been widely promoted in the global economy during the past several decades. However, according to version 8.1 of the GTAP database, an import tariff of approximately 2.7 per cent remained in world trade on average in 2007 and 2.8 per cent in APEC economies.1 By economy, trade barriers are lower in North 1 It may be noted that this figure is weighted by the actual volume of imports. If the import
Agr Mfg Ave Agr Mfg Ser Ave*Both TPP and RCEP Economies 10.3 1.9 2.8 28.0 7.6 9.6 9.7
Japan 13.1 0.8 2.3 23.6 3.8 6.2 6.2Malaysia 7.8 3.1 3.5 44.8 22.1 23.9 23.8Singapore 0.2 0.0 0.0 52.3 12.7 14.0 14.5Viet Nam** 12.4 10.3 10.5 28.9 9.6 11.5 11.8Australia 2.0 3.8 3.6 28.8 4.2 6.0 6.1New Zealand 1.3 2.5 2.4 23.0 7.3 9.7 9.3
Only TPP Economies 3.2 1.3 1.5 15.5 3.9 4.7 4.9US 1.7 1.2 1.2 14.8 3.3 4.4 4.3Canada 9.3 1.0 1.8 11.4 2.4 3.3 3.3Mexico 3.7 2.4 2.5 26.1 12.3 13.6 13.6Chile 1.5 1.5 1.5 17.2 1.3 2.5 2.6Peru 6.6 5.6 5.7 22.5 2.9 6.9 5.7
Only RCEP Economies 14.4 5.1 5.7 10.5 3.9 3.7 4.2China 5.2 4.2 4.2 6.1 5.1 5.2 5.2Korea 23.5 3.4 4.7 0.6 0.1 0.1 0.1Indonesia 5.9 3.1 3.4 11.5 0.5 1.3 1.7Philippines 10.9 2.8 3.6 34.3 15.4 18.0 17.3Thailand 12.2 4.8 5.3 24.9 0.6 2.5 2.2Cambodia** 14.1 10.5 10.9 28.9 9.6 11.5 11.8Laos** 7.0 8.1 8.0 28.9 9.6 11.5 12.1India 52.9 12.0 13.8 26.2 4.8 5.5 5.7
Other APEC Economies 10.5 4.3 5.0 19.0 5.4 6.6 6.8Hong Kong, China 0.0 0.0 0.0 20.3 0.8 1.3 2.4Chinese Taipei*** 9.0 2.4 2.8 23.6 3.8 6.2 5.0Russia 14.4 8.1 9.1 16.9 9.2 10.4 10.4
TPP Economies 5.6 1.5 1.8 19.7 5.0 6.4 6.4RCEP Economies 12.4 3.9 4.6 20.9 6.5 8.3 7.7APEC Economies 7.1 2.4 2.8 17.4 4.7 5.7 5.8World 6.0 2.3 2.7 n.a n.a n.a n.aSource: GTAP database 8.1 & World Bank (2012)* Recalculated using the trade weights in the GTAP database.** NTMs are assumed to be the average of Indonesia, Malaysia, Thailand and the Philippines.*** NTMs are assumed to be equal to Japan.
Tariff (%) NTMs (%)
Table 3 Import protection by the Asia-Pacific economies
8
America and free trade is mostly realized in Hong Kong, China; and Singapore. However, higher tariffs are still generally observed in developing and emerging economies. Further, tariff levels are shown to be higher in RCEP economies on average than they are in TPP economies. By commodity, tariffs are higher in primary products and food (“Agr” in Table 3) than other manufacturing products (“Mfg”).
According to earlier studies such as Ecorys (2009) and Copenhagen Economics (2010), NTMs are defined as all non-price and non-quantity restrictions on trade in goods, services, and investment at the federal and state levels. This includes border measures (customs procedures, etc.) as well as behind-the-border measures that flow from domestic laws, regulations, and practices. These measures induce additional costs for foreign producers and therefore increase the cost of cross-border trade. Data on the AVEs of NTMs are guided by the Overall Trade Restrictiveness Index provided by the World Bank (2012),2 which summarizes the trade policy stance of a country by calculating the uniform tariff that will keep its overall imports at their current level when the country has different tariffs for different goods. Those in service sectors are assumed to be at the average of goods sectors in this paper. The levels of the AVEs of NTMs have been found to be two to three times higher than tariffs in APEC economies in general. By economy, NTMs are higher in Mexico, Russia, and several ASEAN countries including Singapore, which operates no tariff system. The averages in RCEP economies are also higher than those in TPP economies but the relative differences are smaller than those for tariffs. By commodity, NTMs are much higher in agricultural products than they are in manufacturing products.
2. Methodology for Model Simulations In addition to the quantification of trade protection measures by tariffs and NTMs, the methodology for incorporating those measures into simulation studies by adding exogenous shocks into the model structure must be carefully designed. In the case of tariff removals, the import tax in Equation (a) is eliminated without any exemptions for the import of good (i) from exporting region (r) to importing region (s):
(a) pms(i,r,s) = tms(i,r,s) + pcif(i,r,s) pms: Import prices
volume of certain products with higher import protection were smaller, the average level of import protection in this measurement would be calculated to be somewhat lower.
9
tms: Import tax pcif: CIF prices
The possible trade cost reduction by reducing NTMs is composed of two
parts.3 One is the trade cost part, which represents the costs associated with the differences in regulation between the two countries, whose key feature is much closer to a tax. Therefore, in this study, import tax is removed in order to evaluate the impacts of reducing the trade cost part of NTMs. The second is the rent cost part, which represents the price increase that results from the market segmentation induced by regulation differences, which reduce the competition of imported products in domestic markets and increase the prices of domestic products. Import-augmenting technological improvements (ams) are incorporated into equation (b) in order to reflect the reductions of the rent cost part of NTMs in line with the approaches of previous GTAP model simulations.
(b) qxs(i,r,s) = -ams(i,r,s) + qim(i,s) - ESUBM(i) * [pms(i,r,s) – ams(i,r,s) – pim(i,s)]
qxs: Export sales ams: Import-augmenting technological changes qim: Aggregate imports in the region pim: Market prices of composite imports ESUBM: The elasticity of substitution among imports from different
destinations The trade cost and rent cost parts are broadly assumed to be 50 per cent each in this paper based on the empirical findings presented in EC (2012).4 Moreover, two further key assumptions are made to estimate the likely magnitude of the impacts of NTMs reductions. First, the “actionability” of NTMs reductions is assumed to be 50 per cent guided by Ecorys (2009).5 “Actionability” is the degree to which NTMs or regulatory divergence may be reduced through various methods. Second, the
2 See Kee, Nicita, and Olarreaga (2009) for the empirical methodology. 3 See Kawasaki (2010) for another breakdown of trade costs into the administrative part and the production factor part estimated from the costs shown in the Doing Business report by the World Bank. 4 The levels of NTMs in Japan are estimated to be 4.9 per cent for the trade cost part and 4.3 per cent for the rent cost part by sector average. Those in the EU are estimated to be 4.4 per cent for the trade cost part and 3.1 per cent for the rent cost part. 5 Actionability levels range from 39 to 66 per cent in the US by sector and from 35 to 70 per cent in the EU.
10
magnitude of spillover effects is also assumed to be 50 per cent.6 Many NTMs relate to differences in regulations, which mostly cannot be altered on a purely bilateral basis. Once addressed, they will improve market access for third countries as well. Therefore, to a large extent, NTMs reductions operate on a most favored nation basis.
3. Policy Scenarios The following six scenarios of Asia-Pacific EPAs are studied in this paper and the impacts of the TPP, RCEP, and FTAAP are compared. Moreover, the impacts of NTMs reductions are studied in addition to those by tariff removals. Scenario 1: Tariff removals in the RCEP Scenario 2: Tariff removals and NTMs reductions in the RCEP Scenario 3: Tariff removals in the TPP Scenario 4: Tariff removals and NTMs reductions in the TPP Scenario 5: Tariff removals in the FTAAP7 Scenario 6: Tariff removals and NTMs reductions in the FTAAP As discussed above, tariff removals are mechanically assumed to be 100 per cent in all scenarios. On the other hand, the actionability of NTMs reductions is assumed to be 50 per cent with spillover effects to the third country at 50 per cent, which implies 25 per cent NTMs reductions to non-member economies.
4. Simulation Outcomes According to conventional simulations carried out by using a CGE model of global trade, EPA measures, including tariff removals and NTMs reductions, will stimulate trade by lowering the prices of tradable goods. This will result in increases in the national output of exporting countries while increasing access to the market for trading partners. Meanwhile, domestic production resources—land, capital, labor, and intermediate inputs—will be used more efficiently in importing countries, particularly when domestic distortions, including those due to trade barriers, are reduced. These combined effects—one from foreign markets and the other from the domestic
6 EC (2012) assumed that 65 per cent of NTMs reductions yield benefits for third countries, while 35 per cent of any reductions deliver a strictly bilateral benefit. On the other hand, Japan and Canada (2012) assumed moderate spillover effects. 7 In these FTAAP simulations, it is assumed that APEC economies remove tariffs from APEC economies but not from non-member economies. This assumption is different from the APEC spirit of “open” trade liberalization, in which tariffs are also removed from the remaining APEC
11
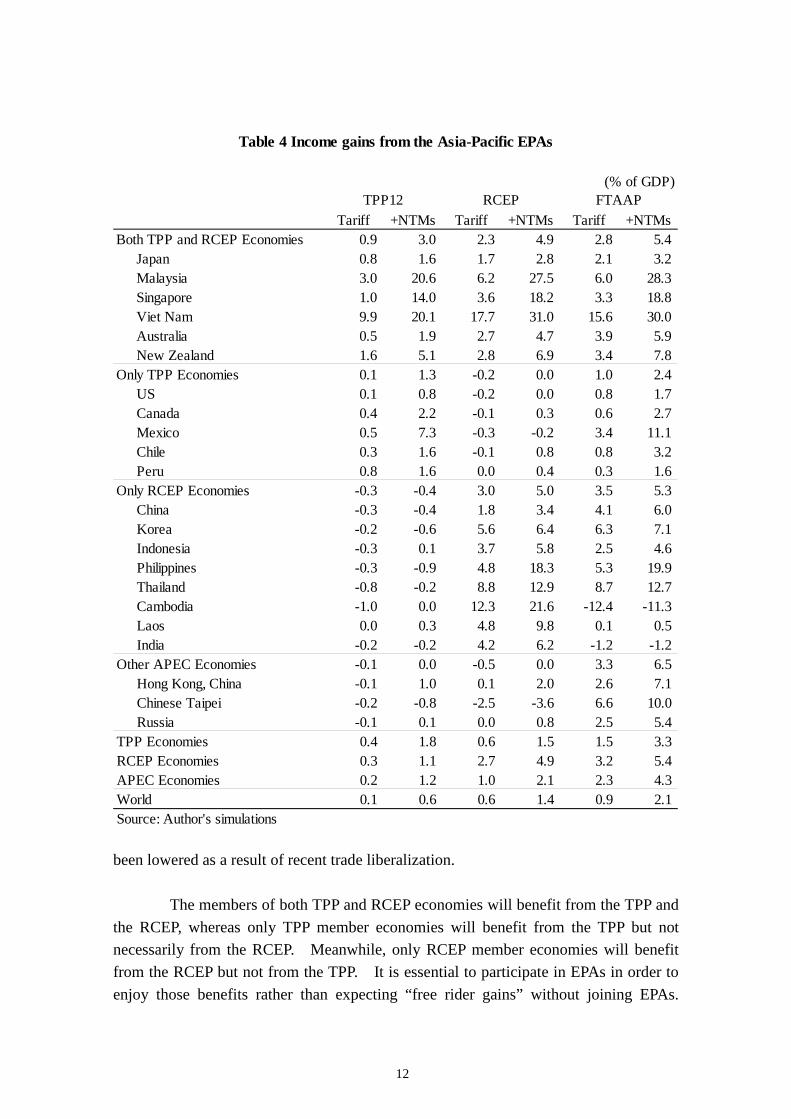
market—are expected to result in the expansion of production and an increase in income and welfare. In addition, economic benefits would expand dynamically through capital formation mechanisms and productivity improvements. Although negative impacts due to trade diversion effects and terms of trade effects are suggested by theoretical studies, empirical analyses, including model simulations, have generally indicated the macroeconomic benefits of EPAs. The income gains from Asia-Pacific EPAs measured in terms of changes in equivalent variation are shown in Table 4 as the percentage of regional GDP in 2010. APEC economies as a whole benefit both from the TPP and from the RCEP and those income gains are larger from the FTAAP, which account for 2.3 per cent of GDP from tariff removals and 4.3 per cent from tariff removals and NTMs reductions. The wider EPAs are in terms of participants and trade policy measures, the larger the economic benefits are.
The relative size of income gains from EPAs depends largely on the degree of trade liberalization,8 namely the degree of protection prior to the implementation of EPAs. As shown in Table 3, there tends to be more scope to liberalize trade in developing and emerging APEC economies, which benefit more from Asia-Pacific EPAs. In terms of percentage GDP changes in equivalent variation, several ASEAN countries such as Malaysia, Singapore, the Philippines, Thailand, and Viet Nam are suggested to enjoy relatively large gains. Meanwhile, advanced and larger APEC economies such as Japan and the US are unlikely to experience significantly larger gains. Trade liberalization is thus expected to correct income differentials among these economies.
The macroeconomic benefits of NTMs reduction are estimated to be generally larger than those related to tariff removals. Moreover, they are relatively significant in developed economies compared with a number of developing and emerging economies primarily because of the degree of price changes due to tariff removals and NTMs reductions discussed above. That said, it is indicated that there is larger room for income gains from NTMs reductions than from tariff removals, which have already economies as well. 8 It must be noted that the outcomes of model simulations may vary according to macroeconomic assumptions and closures. These variations are suggested in terms not only of magnitudes but also of directions. See, for example, Kawasaki (1999) for a diagnostic analysis of such model sensitivities in the case of simulations on the impact of trade liberalization. Relatively large macroeconomic benefits are estimated in developing economies when the dynamic aspects of capital formation and pro-competitive productivity growth effects are incorporated.
12
been lowered as a result of recent trade liberalization. The members of both TPP and RCEP economies will benefit from the TPP and the RCEP, whereas only TPP member economies will benefit from the TPP but not necessarily from the RCEP. Meanwhile, only RCEP member economies will benefit from the RCEP but not from the TPP. It is essential to participate in EPAs in order to enjoy those benefits rather than expecting “free rider gains” without joining EPAs.
(% of GDP)
Tariff +NTMs Tariff +NTMs Tariff +NTMsBoth TPP and RCEP Economies 0.9 3.0 2.3 4.9 2.8 5.4
Japan 0.8 1.6 1.7 2.8 2.1 3.2Malaysia 3.0 20.6 6.2 27.5 6.0 28.3Singapore 1.0 14.0 3.6 18.2 3.3 18.8Viet Nam 9.9 20.1 17.7 31.0 15.6 30.0Australia 0.5 1.9 2.7 4.7 3.9 5.9New Zealand 1.6 5.1 2.8 6.9 3.4 7.8
Only TPP Economies 0.1 1.3 -0.2 0.0 1.0 2.4US 0.1 0.8 -0.2 0.0 0.8 1.7Canada 0.4 2.2 -0.1 0.3 0.6 2.7Mexico 0.5 7.3 -0.3 -0.2 3.4 11.1Chile 0.3 1.6 -0.1 0.8 0.8 3.2Peru 0.8 1.6 0.0 0.4 0.3 1.6
Only RCEP Economies -0.3 -0.4 3.0 5.0 3.5 5.3China -0.3 -0.4 1.8 3.4 4.1 6.0Korea -0.2 -0.6 5.6 6.4 6.3 7.1Indonesia -0.3 0.1 3.7 5.8 2.5 4.6Philippines -0.3 -0.9 4.8 18.3 5.3 19.9Thailand -0.8 -0.2 8.8 12.9 8.7 12.7Cambodia -1.0 0.0 12.3 21.6 -12.4 -11.3Laos 0.0 0.3 4.8 9.8 0.1 0.5India -0.2 -0.2 4.2 6.2 -1.2 -1.2
Other APEC Economies -0.1 0.0 -0.5 0.0 3.3 6.5Hong Kong, China -0.1 1.0 0.1 2.0 2.6 7.1Chinese Taipei -0.2 -0.8 -2.5 -3.6 6.6 10.0Russia -0.1 0.1 0.0 0.8 2.5 5.4
TPP Economies 0.4 1.8 0.6 1.5 1.5 3.3RCEP Economies 0.3 1.1 2.7 4.9 3.2 5.4APEC Economies 0.2 1.2 1.0 2.1 2.3 4.3World 0.1 0.6 0.6 1.4 0.9 2.1Source: Author's simulations
Table 4 Income gains from the Asia-Pacific EPAs
TPP12 RCEP FTAAP
13
Trade diversion effects are clearly suggested in the case of those tariff removals applied to members of EPAs on a preferential basis. The spillover effects of NTMs reductions may also benefit third economies but to a limited degree. The impacts of the TPP and the RCEP are typically highlighted in the following four economies in light of the memberships of these two EPAs:
- In Japan (both a TPP and a RCEP economy), higher levels of achievement in the TPP including NTMs reductions will generate sizable income gains. Meanwhile, larger income gains may be expected from the RCEP by expanding growing and relatively large Asian markets. Complementary benefits from the FTAAP will include participating in both the TPP and the RCEP. - For the US (only a TPP economy), income gains from the TPP will mainly derive from NTMs reductions rather than tariff removals. On the other hand, income losses are expected from the RCEP, particularly because of tariff removals due to trade diversion effects. Much larger economic benefits are expected from the FTAAP than from the TPP. - China (only a RCEP economy) will lose from the TPP both through tariff removals and through NTMs reductions. Large income gains are expected from the RCEP, in which tariff removals are suggested to remain an important element. Further income gains will be generated from the FTAAP by expanding the members of EPAs. - Chinese Taipei (another APEC economy) will lose from both the TPP and the RCEP due to trade diversion effects. These income losses are suggested to be larger from the RCEP, thereby reflecting its closer linkages with neighboring East Asian economies. Significant economic benefits are expected from the FTAAP joining the framework of the EPAs in Asia-Pacific.
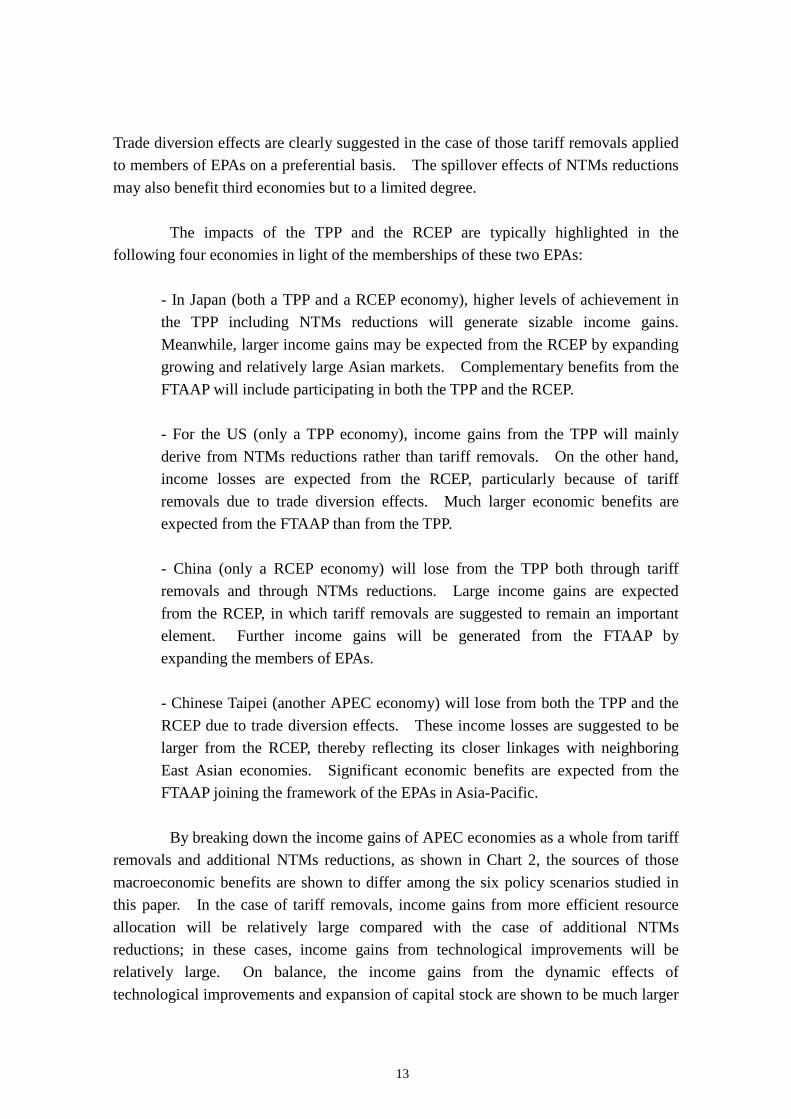
By breaking down the income gains of APEC economies as a whole from tariff removals and additional NTMs reductions, as shown in Chart 2, the sources of those macroeconomic benefits are shown to differ among the six policy scenarios studied in this paper. In the case of tariff removals, income gains from more efficient resource allocation will be relatively large compared with the case of additional NTMs reductions; in these cases, income gains from technological improvements will be relatively large. On balance, the income gains from the dynamic effects of technological improvements and expansion of capital stock are shown to be much larger
14
than the static effects of more efficient resource allocation and improvements in terms of trade.
IV. Key Contributors to Asia-Pacific EPAs Four main groups of economies exist in Asia-Pacific from the perspective of the memberships of the TPP and the RCEP. The relative significance of income gains from these two EPAs and geopolitical interests are important aspects. Indeed, the income gains of both TPP and RCEP economies from the RCEP are estimated to be larger than those from the TPP based on the presented model simulations. However, it must be noted that the current study would overestimate the impacts of tariff removals, particularly from the RCEP, by assuming 100 per cent trade liberalization. Indeed, agreements may allow some exemptions from tariff removals. According to Fukunaga and Kuno (2012), for example, the tariff removals agreed in existing ASEAN EPAs are on average 91.3 per cent in terms of the tariff lines of HS2007 on a six-digit basis. The corresponding tariff concession rates in ASEAN+ EPAs are found to be 94.1 per cent in China, 91.9 per cent in Japan, 90.5 per cent in Korea, and 78.8 per cent in India, which is compared with 100.0 per cent in Australia and New Zealand. Moreover, the remaining commodities may be more significantly protected by higher than average tariffs. Therefore, income gains from existing EPAs
Source: Author's Simulations
Chart 2 Sources of income gains from the Asia-Pacific EPAs
-20%
0%
20%
40%
60%
80%
100%
TPPTariff + NTMs
RCEPTariff + NTMs
FTAAPTariff + NTMs
Technological improvementsCapital stock
Terms of trade
Resource allocation
15
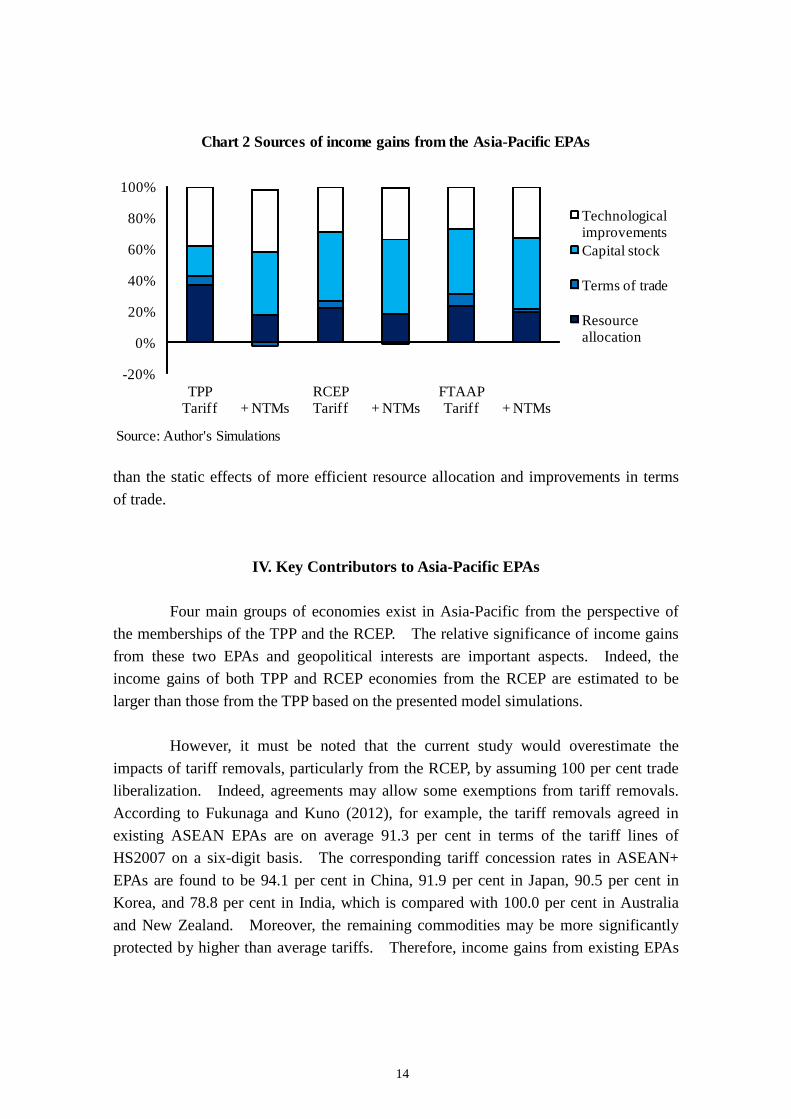
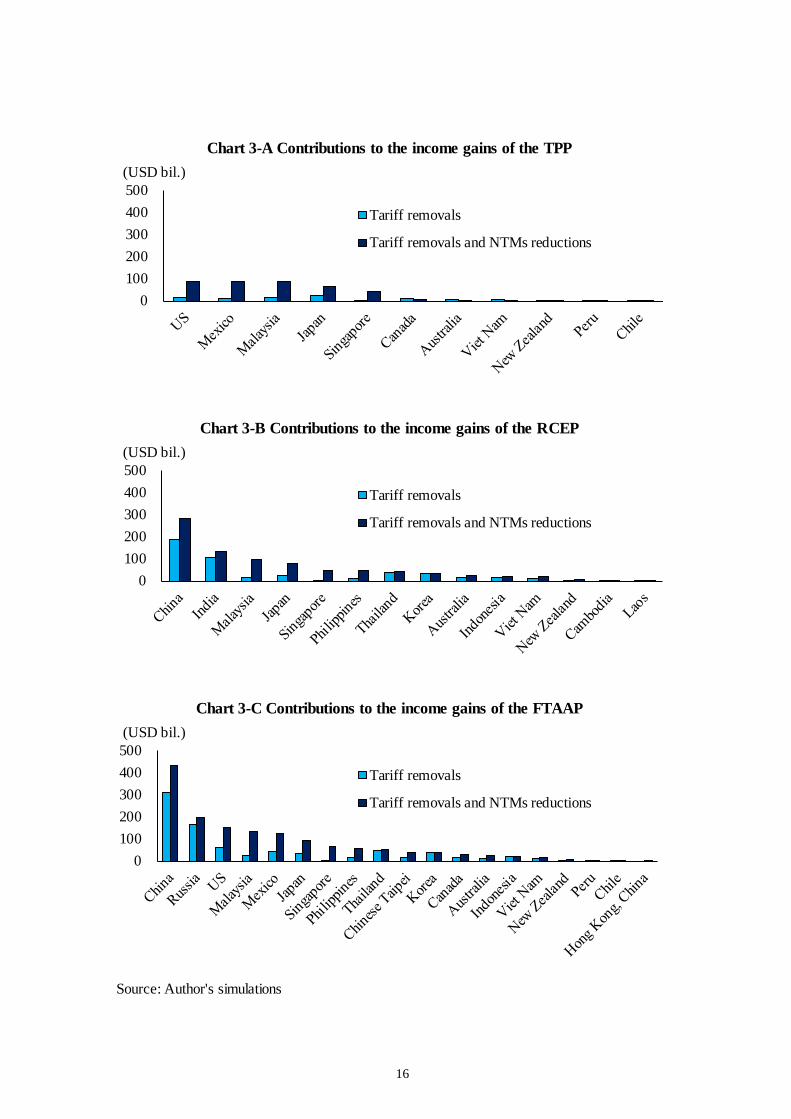
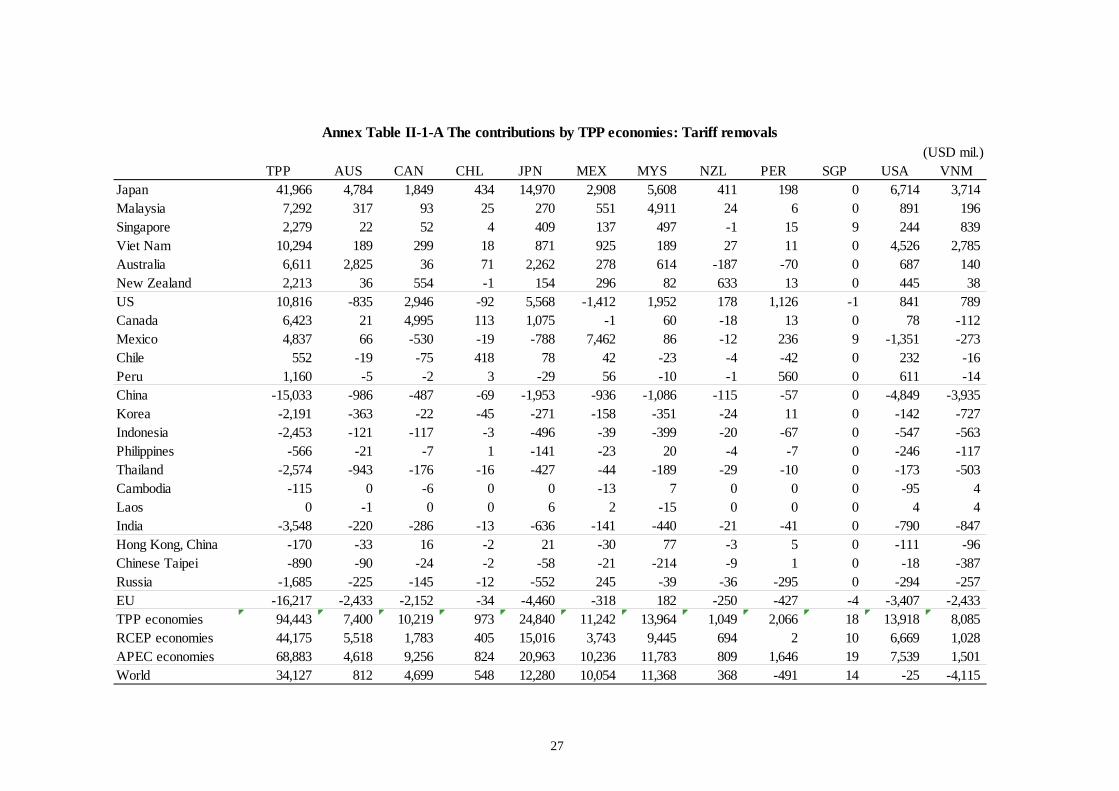
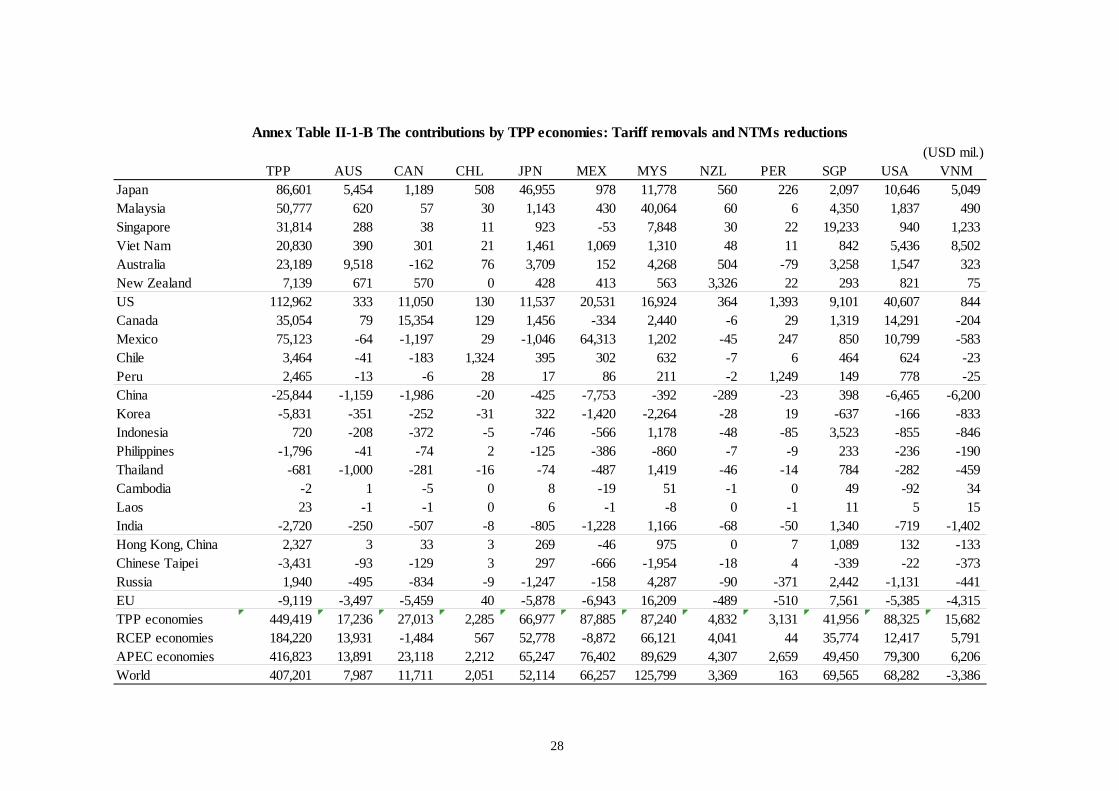
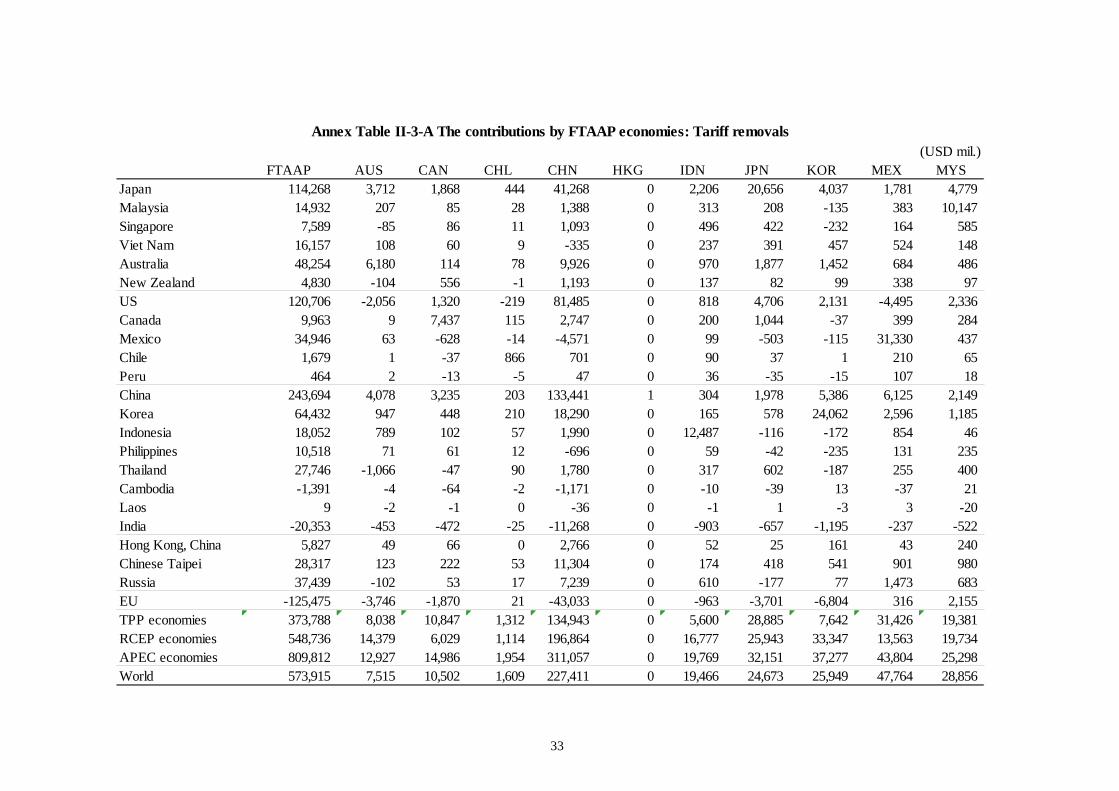
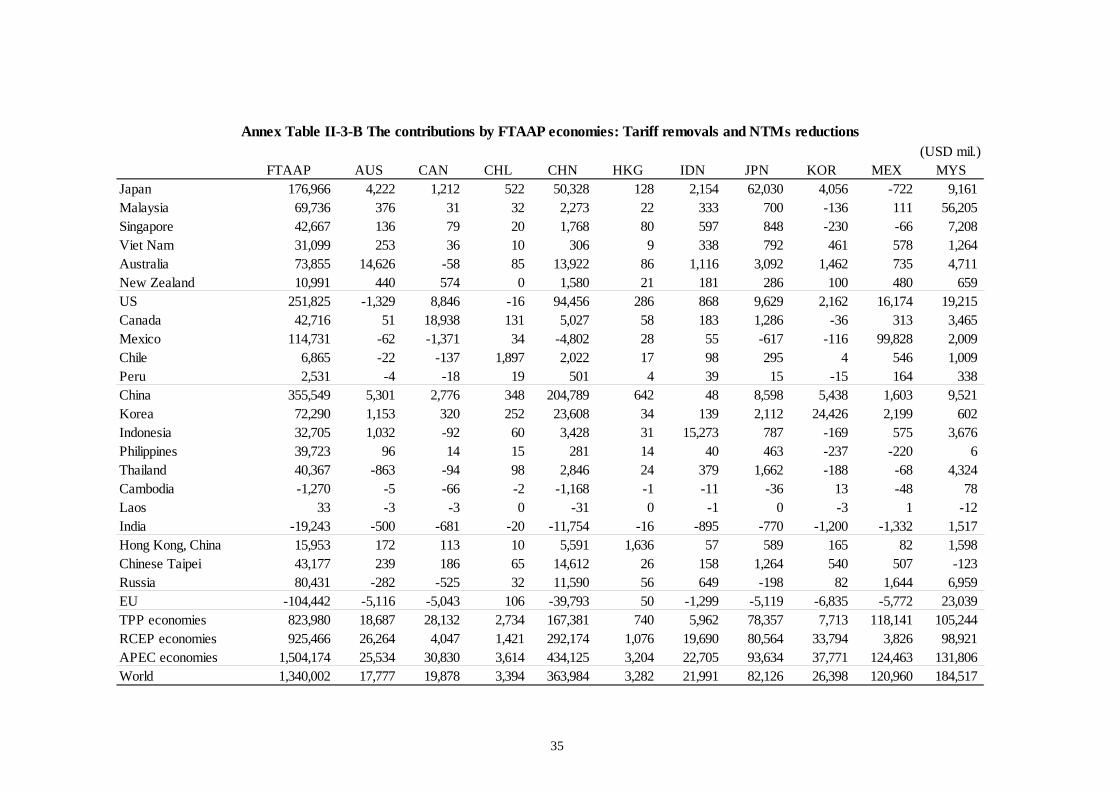
are likely to below 90 per cent of those from full tariff removals.9 On the other hand, the TPP aims to achieve more ambitious levels of tariff removals. Depending on the agreement, these impacts may be closer to current estimates, assuming full tariff removals.10 In addition, the achievement of NTMs reductions would also be expected to be greater compared with the RCEP, while the relative significance of income gains from the TPP may not be as small as those from the RCEP. Nevertheless, policymakers may still be concerned about which economies of Asia-Pacific would be key drivers of generating macroeconomic benefits in the region. The income gains of Asia-Pacific EPAs in those EPA economies as a whole are broken down by the contribution of the EPA measures of those member economies in Chart 3-A for the TPP, Chart 3-B for the RCEP, and Chart 3-C for the FTAAP.
It is shown in Chart 3-A that income gains from the TPP will be driven by the US, Mexico, and Malaysia, particularly by NTMs reductions. Singapore will still significantly contribute to NTMs reductions, although tariffs may no longer be cut. On the other hand, the contribution of Japanese tariff removals will relatively be large among TPP economies.
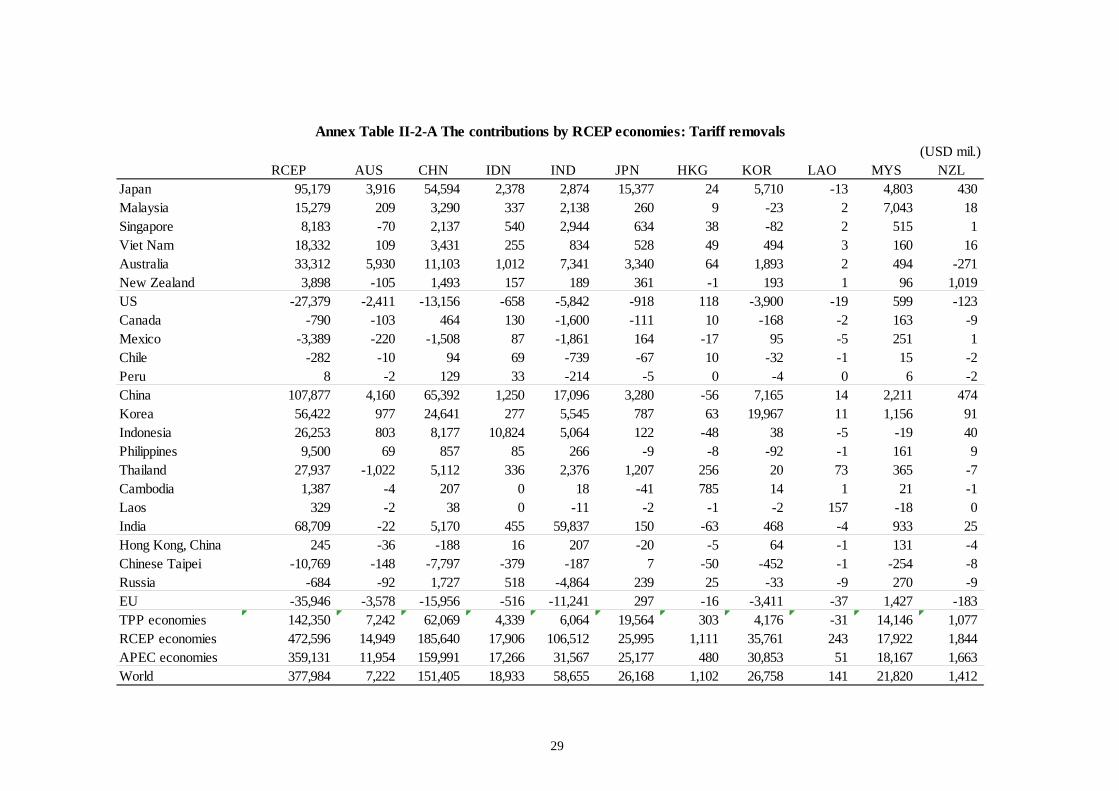
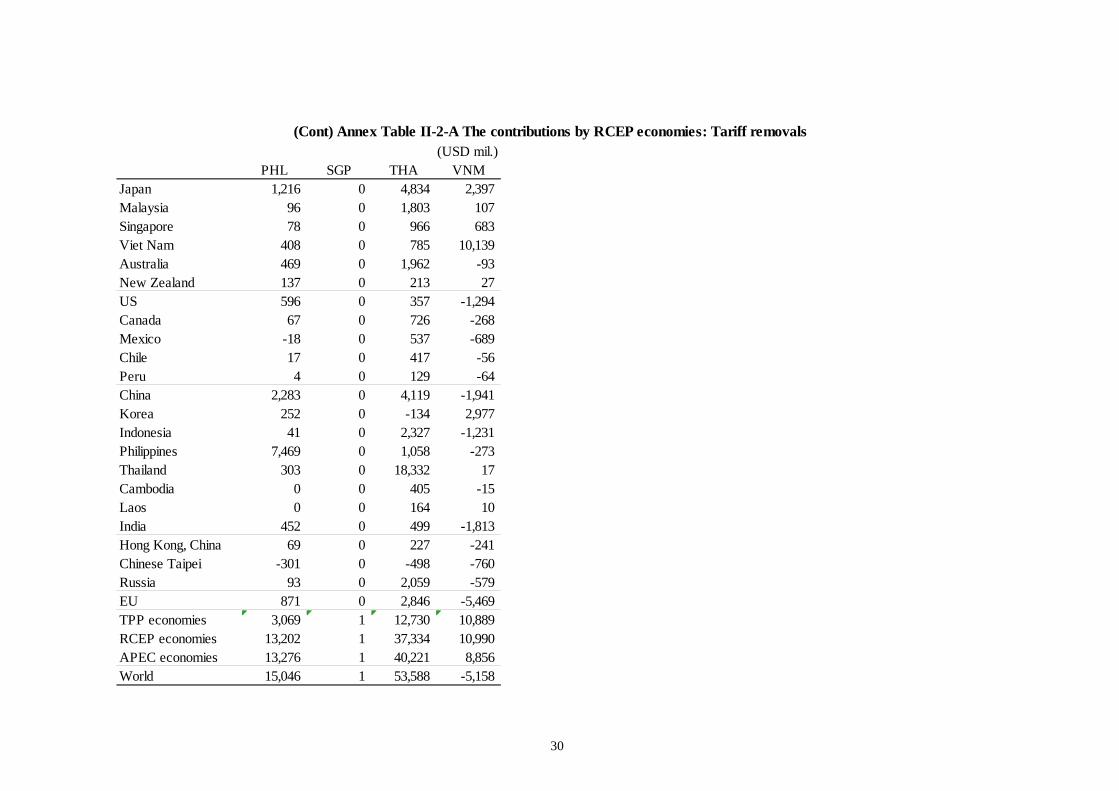
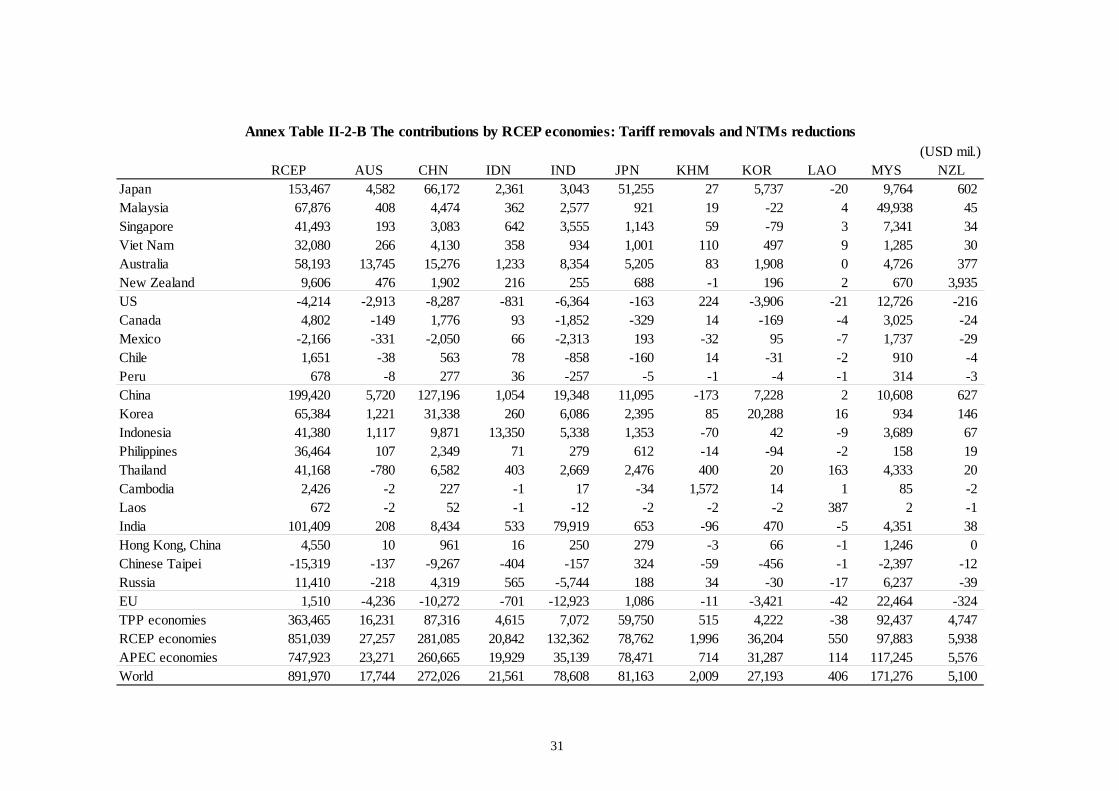
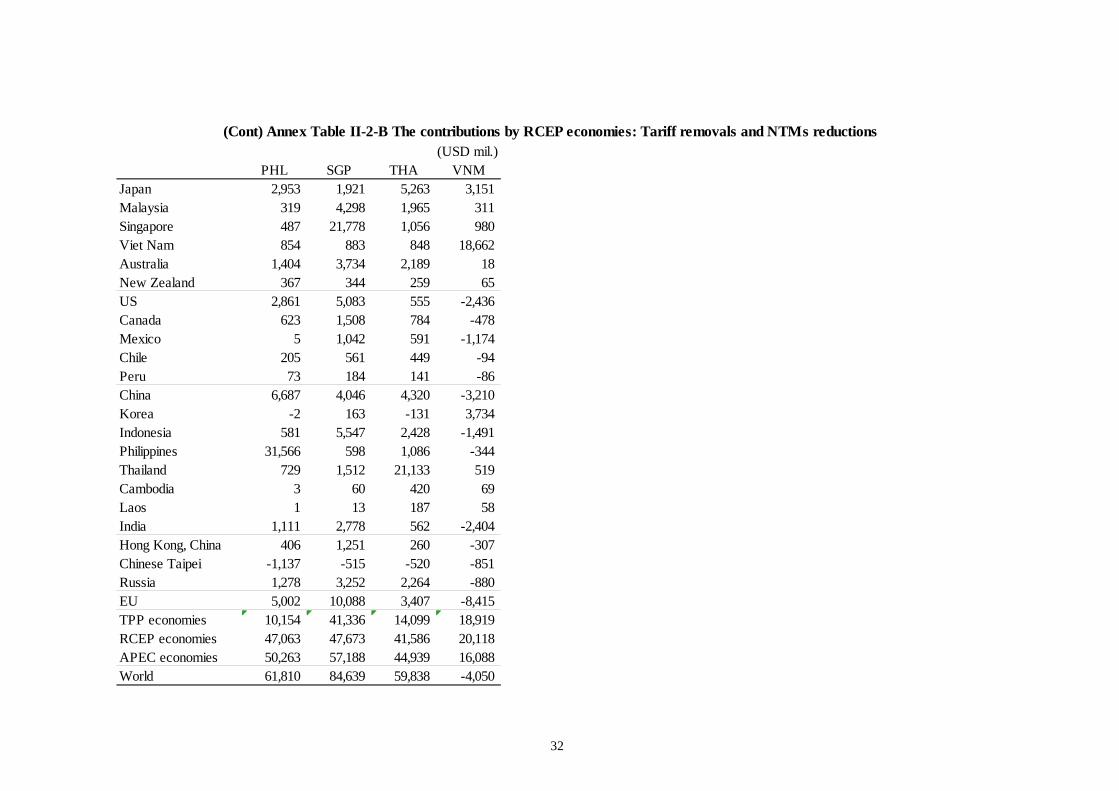
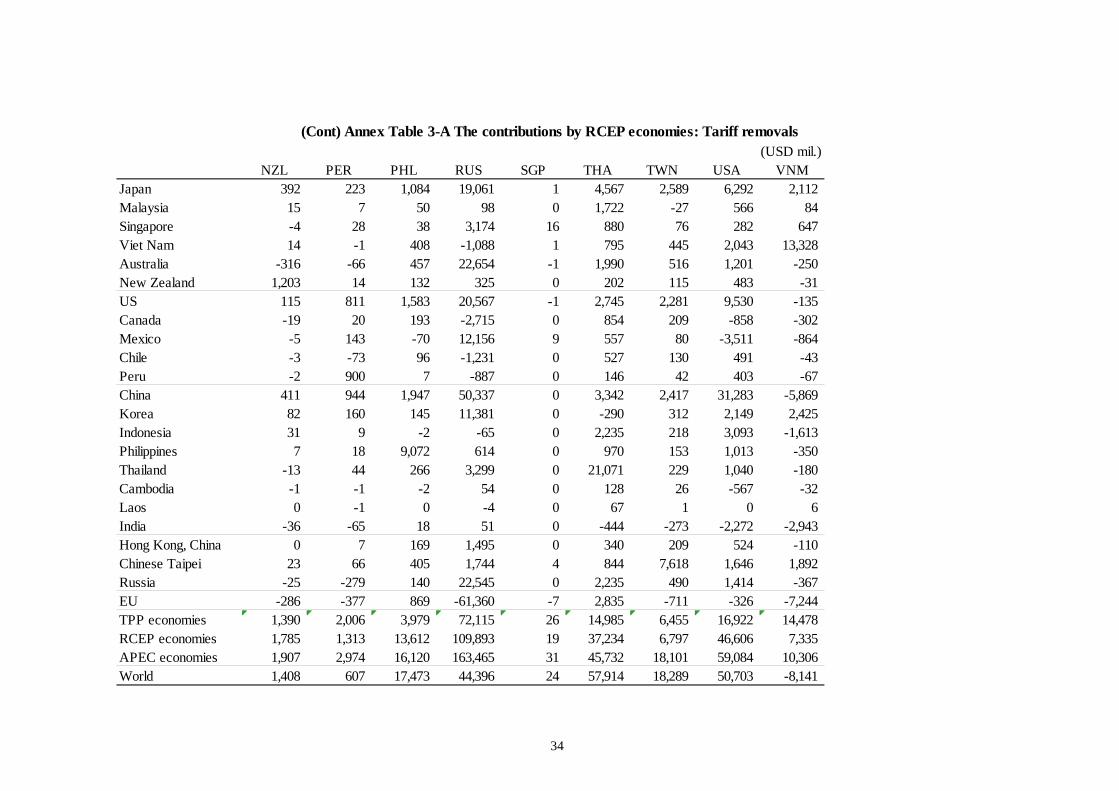
From Chart 3-B, China will be a key driver of income gains from the RCEP
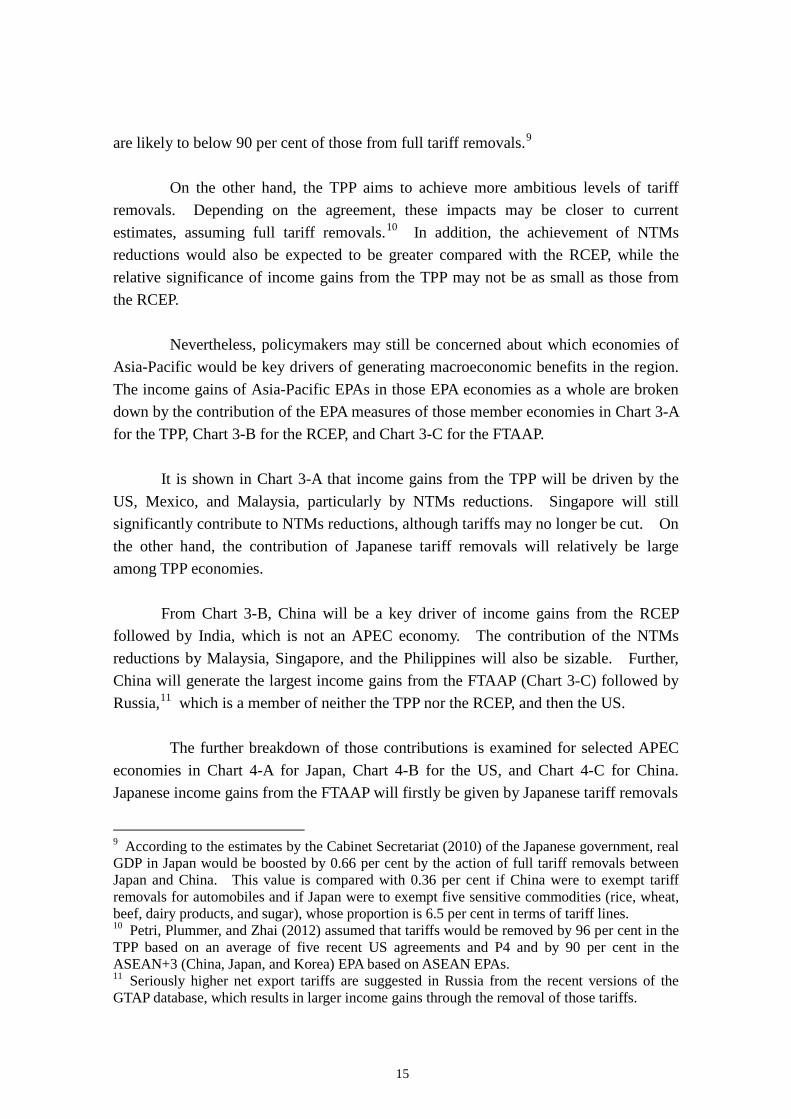
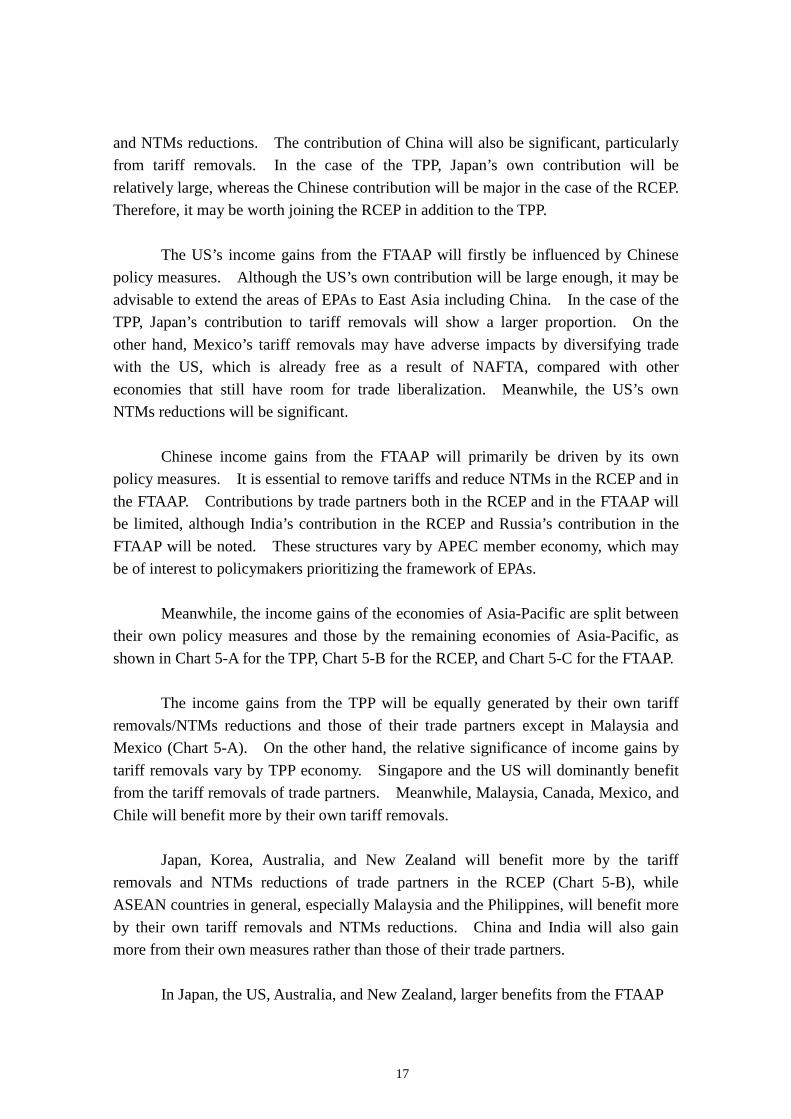
followed by India, which is not an APEC economy. The contribution of the NTMs reductions by Malaysia, Singapore, and the Philippines will also be sizable. Further, China will generate the largest income gains from the FTAAP (Chart 3-C) followed by Russia,11 which is a member of neither the TPP nor the RCEP, and then the US. The further breakdown of those contributions is examined for selected APEC economies in Chart 4-A for Japan, Chart 4-B for the US, and Chart 4-C for China. Japanese income gains from the FTAAP will firstly be given by Japanese tariff removals
9 According to the estimates by the Cabinet Secretariat (2010) of the Japanese government, real GDP in Japan would be boosted by 0.66 per cent by the action of full tariff removals between Japan and China. This value is compared with 0.36 per cent if China were to exempt tariff removals for automobiles and if Japan were to exempt five sensitive commodities (rice, wheat, beef, dairy products, and sugar), whose proportion is 6.5 per cent in terms of tariff lines. 10 Petri, Plummer, and Zhai (2012) assumed that tariffs would be removed by 96 per cent in the TPP based on an average of five recent US agreements and P4 and by 90 per cent in the ASEAN+3 (China, Japan, and Korea) EPA based on ASEAN EPAs. 11 Seriously higher net export tariffs are suggested in Russia from the recent versions of the GTAP database, which results in larger income gains through the removal of those tariffs.
16
Source: Author's simulations
Chart 3-C Contributions to the income gains of the FTAAP
Chart 3-A Contributions to the income gains of the TPP
Chart 3-B Contributions to the income gains of the RCEP
0100200300400500
Tariff removals
Tariff removals and NTMs reductions
(USD bil.)
0100200300400500
Tariff removals
Tariff removals and NTMs reductions
(USD bil.)
0100200300400500
Tariff removals
Tariff removals and NTMs reductions
(USD bil.)
17
and NTMs reductions. The contribution of China will also be significant, particularly from tariff removals. In the case of the TPP, Japan’s own contribution will be relatively large, whereas the Chinese contribution will be major in the case of the RCEP. Therefore, it may be worth joining the RCEP in addition to the TPP.
The US’s income gains from the FTAAP will firstly be influenced by Chinese policy measures. Although the US’s own contribution will be large enough, it may be advisable to extend the areas of EPAs to East Asia including China. In the case of the TPP, Japan’s contribution to tariff removals will show a larger proportion. On the other hand, Mexico’s tariff removals may have adverse impacts by diversifying trade with the US, which is already free as a result of NAFTA, compared with other economies that still have room for trade liberalization. Meanwhile, the US’s own NTMs reductions will be significant.
Chinese income gains from the FTAAP will primarily be driven by its own policy measures. It is essential to remove tariffs and reduce NTMs in the RCEP and in the FTAAP. Contributions by trade partners both in the RCEP and in the FTAAP will be limited, although India’s contribution in the RCEP and Russia’s contribution in the FTAAP will be noted. These structures vary by APEC member economy, which may be of interest to policymakers prioritizing the framework of EPAs.
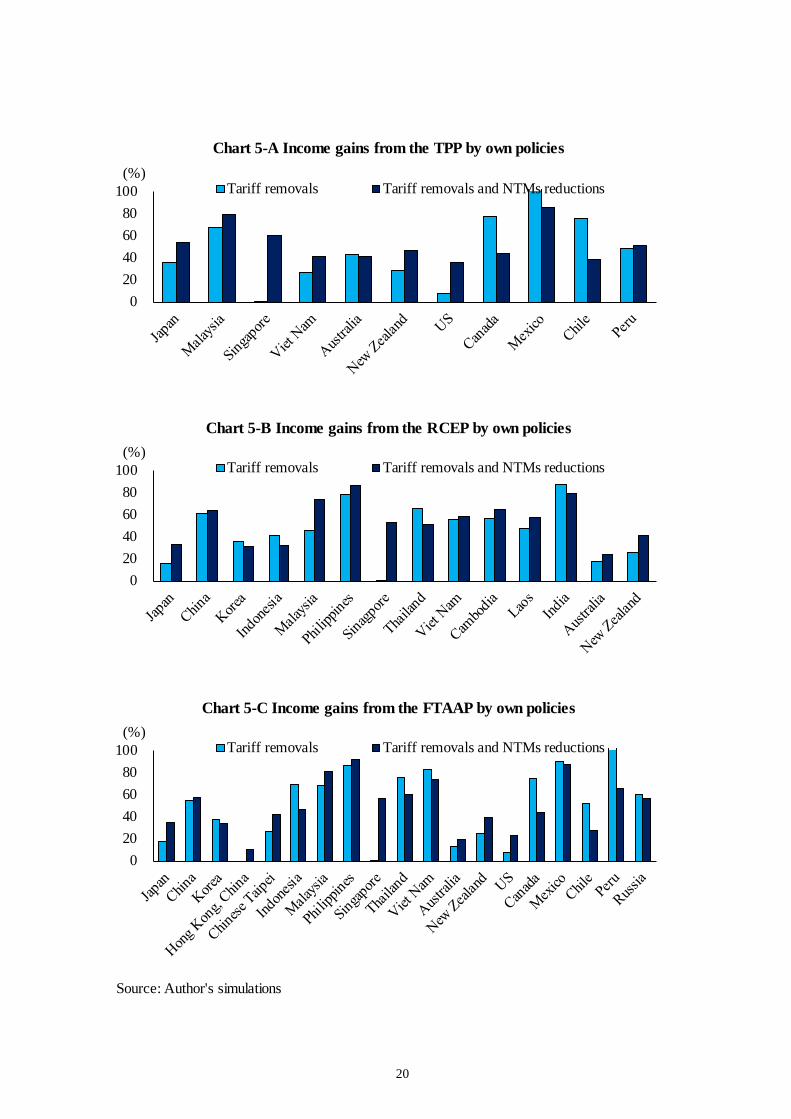
Meanwhile, the income gains of the economies of Asia-Pacific are split between their own policy measures and those by the remaining economies of Asia-Pacific, as shown in Chart 5-A for the TPP, Chart 5-B for the RCEP, and Chart 5-C for the FTAAP.
The income gains from the TPP will be equally generated by their own tariff removals/NTMs reductions and those of their trade partners except in Malaysia and Mexico (Chart 5-A). On the other hand, the relative significance of income gains by tariff removals vary by TPP economy. Singapore and the US will dominantly benefit from the tariff removals of trade partners. Meanwhile, Malaysia, Canada, Mexico, and Chile will benefit more by their own tariff removals.
Japan, Korea, Australia, and New Zealand will benefit more by the tariff removals and NTMs reductions of trade partners in the RCEP (Chart 5-B), while ASEAN countries in general, especially Malaysia and the Philippines, will benefit more by their own tariff removals and NTMs reductions. China and India will also gain more from their own measures rather than those of their trade partners.
In Japan, the US, Australia, and New Zealand, larger benefits from the FTAAP
18
Source: Author's simulations
Chart 4-A Contributions to Japan's income gains by the economies
Chart 4-B Contributions to US's income gains by the economies
Chart 4-C Contributions to China's income gains by the economies
0
20
40
60
80
100
TPPTariff +NTMs
RCEPTariff +NTMs
FTAAPTariff +NTMs
Malaysia US Russia China Japan(%)
-20
0
20
40
60
80
100
TPPTariff +NTMs
RCEPTariff +NTMs
FTAAPTariff +NTMs
Japan Mexico Russia US China(%)
0
20
40
60
80
100
TPPTariff +NTMs
RCEPTariff +NTMs
FTAAPTariff +NTMs
Japan India US Russia China(%)
19
will be given by their trade partners (Chart 5-C). In China and Russia, contributions by their own policy measures and those of their partners will be similar. However, in many ASEAN countries as well as Canada, Mexico, and Peru, contributions through their own initiatives will be much larger than those by partners. It is thus suggested that domestic reforms in several countries are essential in order to enjoy macroeconomic benefits.
V. Summary and Conclusions In this paper, the impacts of EPAs in Asia-Pacific were quantitatively analyzed by using a CGE model of global trade. In particular, the impacts of NTMs reductions were studied in addition to those of tariff removals. It was estimated that the income gains of APEC economies as a whole would account for 1.2 per cent of regional GDP from the TPP, 2.1 per cent from the RCEP, and 4.3 per cent from the FTAAP. The TPP and the RCEP would thus complement one another rather than be competitors when establishing the FTAAP. By economy, developing and emerging economies are suggested to enjoy relatively large gains from EPAs in comparison with developed economies and, therefore, the income differentials among these economies are expected to be corrected. Breaking down the sources of the macroeconomic benefits of Asia-Pacific EPAs by the policy measures of APEC member economies showed that the contribution by China would be the largest. Nonetheless, in many ASEAN countries and outside this region, contributions by a country’s own initiatives will be much larger than those by its trade partners, including China. Meanwhile, larger economic benefits are expected from NTMs reductions in addition to tariff removals. It is thus suggested that domestic reforms are essential in order to enjoy the macroeconomic benefits of international EPAs.
20
Source: Author's simulations
Chart 5-A Income gains from the TPP by own policies
Chart 5-B Income gains from the RCEP by own policies
Chart 5-C Income gains from the FTAAP by own policies
020406080
100 Tariff removals Tariff removals and NTMs reductions(%)
020406080
100 Tariff removals Tariff removals and NTMs reductions(%)
020406080
100 Tariff removals Tariff removals and NTMs reductions(%)
21
References APEC (1997), The Impact of Trade Liberalization in APEC, Economic Committee,
Asia-Pacific Economic Cooperation, Singapore. Armington, P. S. (1969), “A Theory of Demand for Products Distinguished by Place of
Production,” International Monetary Fund Staff Paper Vol. 16 No. 1. Cabinet Secretariat (2010), Several Calculations concerning EPAs, 2 October 2010,
Cabinet Secretariat, Tokyo (in Japanese). Copenhagen Economics (2010), Assessment of the barriers to trade between the EU and
Japan, http://trade.ec.europa.eu/doclib/docs/2010/february/tradoc_145772.pdf Dee P., C. Geisler and G. Watts (1996), “The Impact of APEC’s Free Trade
Commitment,” Staff Information Paper, AGPS, Canberra. EC (2012), “Impact Assessment Report on EU-Japan Trade Relations,” Commission
Staff Working Document, European Commission. Ecorys (2009), Non-Tariff Measures in EU-US Trade and Investments,
http://trade.ec.europa.eu/doclib/docs/2009/december/tradoc_145613.pdf. Francois, J. F., B. J. McDonald and N. Nordström (1996), “Liberalization and Capital
Accumulation in the GTAP Model,” GTAP Technical Paper No. 7, Centre for Global Trade Analysis, Purdue University.
Fukunaga Y. and A. Kuno (2012), “Toward a Consolidated Preferential Tariff Structure in East Asia: Going beyond ASEAN+1 FTAs, ERIA Policy Brief No. 2012-3, Economic Research Institute for ASEAN and East Asia (ERIA).
GATT (1994), The Results of the Uruguay Round of Multilateral Trade Negotiations, General Agreement on Tariffs and Trade.
Heckscher, E. (1919), “The Effects of Foreign Trade on the Distribution of Income,” Ekonomisk Tidskrift, Vol. 21.
Hertel, T. W. (1997), Global Trade Analysis: Modeling and Applications, Cambridge University Press, Cambridge.
Ianchovichina, E., J. Binkley and T. W. Hertel (2000), “Procompetitive Effects of Foreign Competition on Domestic Markups,” Review of International Economics, 8(1).
Itakura, K., T. Hertel and J. Reimer (2003), “The Contribution of Productivity Linkages to the General Equilibrium Analysis of Free Trade Agreements,” GTAP Working Paper No. 23, Centre for Global Trade Analysis, Purdue University.
Japan and Canada (2012), Report of the Joint Study on the Possibility of a Canada-Japan Economic Partnership Agreement, Japanese government and Canadian government.
Kawasaki, K. (1999), Applications of the Computable General Equilibrium Model: Simulation Analysis on Trade Liberalization and Regulatory Reform,
22
NIHONHYORONSYA, Tokyo (in Japanese). Kawasaki, K. (2010), “The Macro and Sectoral Significance of an FTAAP,” ESRI
Discussion Paper Series No. 244, Economic and Social Research Institute (ESRI), Cabinet Office, Tokyo.
Kee, H. L., A. Nicita and M. Olarreaga (2009), “Estimating Trade Restrictiveness Indices,” Economic Journal 2009 vol. 119.
Melitz, M. J. (2003), “The Impact of Trade on Intra-Industry Reallocation and Aggregate Industry Productivity,” Econometrica 71 (6)
Ohlin, B. (1933), Interregional and International Trade, Harvard University Press, Cambridge, 1933.
Petri A. P, M. G. Plummer and F. Zhai (2012), The Trans-Pacific Partnership and Asia-Pacific Integration: A Quantitative Assessment, Policy Analyses in International Economics 98, Peterson Institute for International Economics, Washington DC.
World Bank (2012), Overall Trade Restrictiveness Indices and Import Demand Elasticities (updated July 2012), http://econ.worldbank.org/.
Zhai, F. (2008), “Armington Meets Melitz: Introducing Firm Heterogeneity in a Global CGE Model of Trade,” Journal of Economic Integration, 23 (3).
23
Annex I: Framework of the CGE Model Simulations To analyze the economy-wide impact of trade liberalization, a CGE model of global trade is employed for the model simulations in this paper. A CGE model numerically simulates the general equilibrium structure of the economy. It is built on the Walrasian general equilibrium system, the central idea of which is that market demand equals supply for all commodities at a set of relative prices. Moreover, a CGE model has solid micro-foundations that are theoretically transparent. Functional forms are specified in an explicit manner, and interdependencies and feedback are incorporated. Therefore, the model provides a framework for assessing the effects of policy and structural changes on resource allocation by clarifying “who gains and who loses.” These characteristics differentiate it from 1) the partial equilibrium model, which is not economy-wide, 2) the macroeconomic model, which is not multi-sectoral, and 3) the input-output model, in which economic agents do not respond to changes in prices. Moreover, the multi-country model is required to analyze international economic affairs such as trade and investment policies, which affect not just one but a number of economies. On the other hand, it must be noted that the estimated economic impact of a CGE model is not a forecast. As described in Dee, Geisler, and Watts (1996), economic policy measures will be implemented over time and adjustments to those changes may take time. During the course of such adjustments, other economic changes will also take place. However, those changes, including economic growth and structural changes in trade and industries, are not taken into account in the current analysis. The model simulation shows the differences at a certain point in time between when trade liberalization and facilitation measures were implemented and when they were not. The basic framework of the trade model is guided by the comparative advantage theory by Hecksher (1919) and Ohlin (1933). However, the original theory of comparative advantage cannot explain such aspects as the two-way trade seen in actual trading behavior. This is because the theory makes no distinctions between the same goods from different areas of production. Therefore, the general equilibrium model introduces heterogeneity into the same goods according to their production areas, namely imperfect substitutes of goods between home and abroad—the so-called
24
Armington assumption12—and thus describes realistic trade developments. Among others, the GTAP database and standard model13 are utilized as a basis for the simulation experiments in this paper. The standard version of the GTAP model includes several key assumptions. It must be noted that the amount of total labor—one primary factor of production—among other factors is fixed. This means that the model assumes full employment. The amount of total capital is also fixed in the standard GTAP model. A common criticism has often been that a standard CGE model focuses on the evaluation of static efficiency improvements and therefore the dynamic effects among production, income, and savings and investment are not captured. In fact, concerning the dynamic impact of trade liberalization, the growth effects through productivity gains and capital accumulation have been pointed out. In this paper, certain dynamic aspects are studied in the model simulations. One deals with the dynamic aspects of capital formation by modifying the standard version of the GTAP model. Two mechanisms are considered in this paper. First, the important “dynamic” effects of capital accumulation are introduced14 into the standard static model. The initial increase in income is assumed to increase savings (a fixed proportion of additional income is saved) and investment. The induced savings and investment (larger capital stock) in turn link to production capacities and cause a further increase in income. Second, the trade balance is endogenously determined and international capital movement is allowed. It is assumed that the expected rate of return on capital is equalized among regions. 12 See Armington (1969) for a description of the Armington assumption. 13 The GTAP model was applied to analyze the economic impact of the Uruguay Round Agreement by the Secretariat of the General Agreement on Tariff and Trade (GATT) for that day, as seen in GATT (1994). Later, in 1997, it was also utilized in the assessment of the economic impact of the Manila Action Plan for APEC by the APEC Economic Committee, as seen in APEC (1997). At present, this model and database are widely used by international organizations and researchers on international affairs. See Hertel (1997) for a description of the GTAP database and model. 14 See Francois, McDonald, and Nordstrom (1996) for the methodology to implement this mechanism into the GTAP model. They explored the interaction between trade policy and capital accumulation in the GTAP model. According to growth theory, a medium-run growth or accumulation effect induces additional savings and investment, which yields more output. In general, a permanent shock to GDP is translated into a shock to the steady-state level of capital. The magnitude of this effect crucially depends on the assumed underlying savings behavior. Under the assumption of a fixed saving ratio, the change in steady-state capital stock is proportionate to the change in the steady-state level of GDP.
25
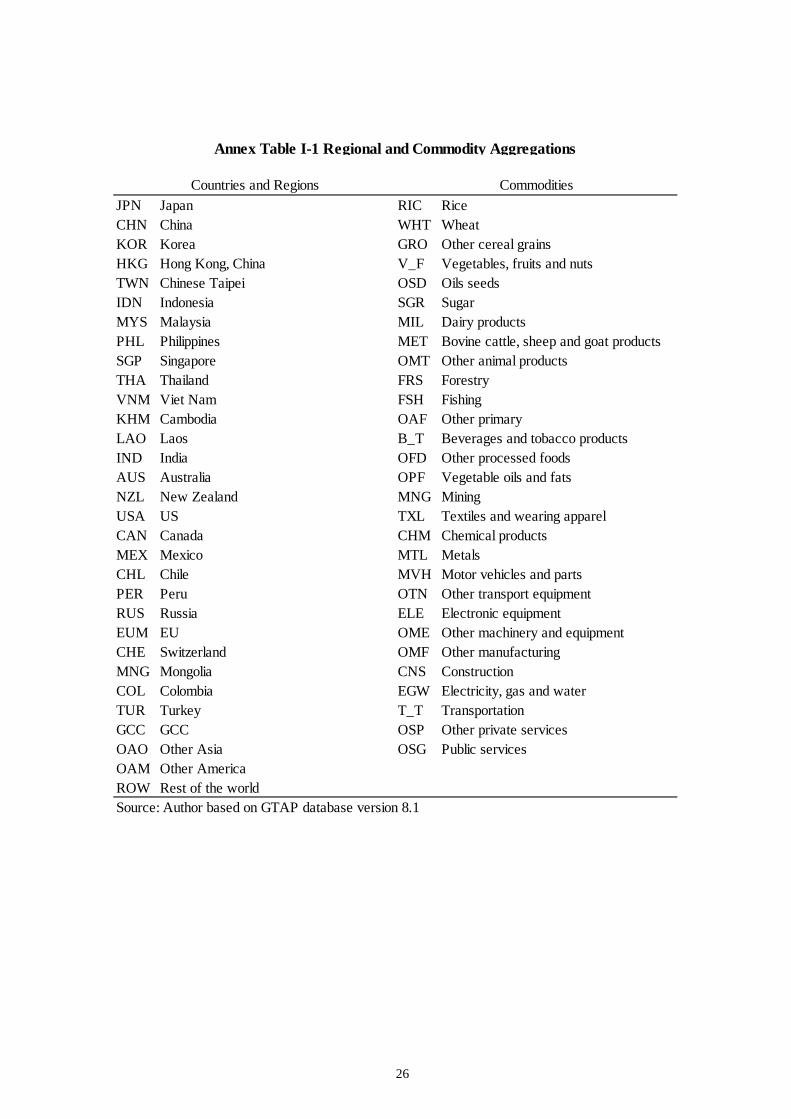
In addition to these, pro-competitive productivity growth effects15 are also investigated in the model simulations. It is assumed that the productivity of domestic industries increases in order to compensate for the lower import prices. Such a rate of productivity increase is set as equal to the rates of change in import prices weighted by the proportion of imports over total production, including domestic goods. The GTAP database provides well-arranged data on countries and regions in Asia-Pacific, such as Asian newly industrializing economies and ASEAN countries. One notable distinguishing feature of the model is its function to evaluate separately mutual dependence among APEC economies. The GTAP database consists of 57 disaggregated sectors and 134 economies, which are aggregated into the appropriate version for the simulations. In this paper, as shown in Annex Table I-1, economies are aggregated into 31 areas, and 19 areas are allocated to APEC economies. APEC economies are disaggregated individually where data are available (note that data on Brunei Darussalam and Papua New Guinea are unavailable). Commodities are aggregated into 29 sectors in accordance with the medium classifications of standard national accounts, while several sensitive commodities in the primary and food sectors are further disaggregated to some extent. The current GTAP database (version 8.1) was released in February 2013. However, its base year remains 2007. The benchmark data used in this study were updated to 2010 in order to reflect the recently growing number of states counted in the world economy. Those data were downloaded from the Data and Statistics section of the website of the International Monetary Fund.
15 For example, see Itakura, Hertel, and Reimer (2003) regarding earlier studies that incorporate productivity linkages into the GTAP model simulations and Ianchovichina, Binkley, and Hertel (2000) for incorporating pro-competitive productivity effects into a CGE model with an assumption of imperfect competition. On the other hand, Zhai (2008) introduced the Melitz (2003) theoretical framework with firm heterogeneity in contrast to traditional CGE models based on Armington’s (1969) assumption and incorporated the dynamic effects of trade liberalization on the “extensive margin” of trade, that is, exports by companies not involved in international markets before trade liberalization. However, those empirical analyses are issues for future studies, including the development of the solid statistics on the numbers of domestic and international firms.
26
JPN Japan RIC RiceCHN China WHT WheatKOR Korea GRO Other cereal grainsHKG Hong Kong, China V_F Vegetables, fruits and nutsTWN Chinese Taipei OSD Oils seedsIDN Indonesia SGR SugarMYS Malaysia MIL Dairy productsPHL Philippines MET Bovine cattle, sheep and goat productsSGP Singapore OMT Other animal productsTHA Thailand FRS ForestryVNM Viet Nam FSH FishingKHM Cambodia OAF Other primaryLAO Laos B_T Beverages and tobacco productsIND India OFD Other processed foodsAUS Australia OPF Vegetable oils and fatsNZL New Zealand MNG MiningUSA US TXL Textiles and wearing apparel CAN Canada CHM Chemical productsMEX Mexico MTL MetalsCHL Chile MVH Motor vehicles and partsPER Peru OTN Other transport equipmentRUS Russia ELE Electronic equipmentEUM EU OME Other machinery and equipmentCHE Switzerland OMF Other manufacturingMNG Mongolia CNS ConstructionCOL Colombia EGW Electricity, gas and waterTUR Turkey T_T TransportationGCC GCC OSP Other private servicesOAO Other Asia OSG Public servicesOAM Other AmericaROW Rest of the worldSource: Author based on GTAP database version 8.1
Annex Table I-1 Regional and Commodity Aggregations
CommoditiesCountries and Regions
27
(USD mil.) TPP AUS CAN CHL JPN MEX MYS NZL PER SGP USA VNMJapan 41,966 4,784 1,849 434 14,970 2,908 5,608 411 198 0 6,714 3,714Malaysia 7,292 317 93 25 270 551 4,911 24 6 0 891 196Singapore 2,279 22 52 4 409 137 497 -1 15 9 244 839Viet Nam 10,294 189 299 18 871 925 189 27 11 0 4,526 2,785Australia 6,611 2,825 36 71 2,262 278 614 -187 -70 0 687 140New Zealand 2,213 36 554 -1 154 296 82 633 13 0 445 38US 10,816 -835 2,946 -92 5,568 -1,412 1,952 178 1,126 -1 841 789Canada 6,423 21 4,995 113 1,075 -1 60 -18 13 0 78 -112Mexico 4,837 66 -530 -19 -788 7,462 86 -12 236 9 -1,351 -273Chile 552 -19 -75 418 78 42 -23 -4 -42 0 232 -16Peru 1,160 -5 -2 3 -29 56 -10 -1 560 0 611 -14China -15,033 -986 -487 -69 -1,953 -936 -1,086 -115 -57 0 -4,849 -3,935Korea -2,191 -363 -22 -45 -271 -158 -351 -24 11 0 -142 -727Indonesia -2,453 -121 -117 -3 -496 -39 -399 -20 -67 0 -547 -563Philippines -566 -21 -7 1 -141 -23 20 -4 -7 0 -246 -117Thailand -2,574 -943 -176 -16 -427 -44 -189 -29 -10 0 -173 -503Cambodia -115 0 -6 0 0 -13 7 0 0 0 -95 4Laos 0 -1 0 0 6 2 -15 0 0 0 4 4India -3,548 -220 -286 -13 -636 -141 -440 -21 -41 0 -790 -847Hong Kong, China -170 -33 16 -2 21 -30 77 -3 5 0 -111 -96Chinese Taipei -890 -90 -24 -2 -58 -21 -214 -9 1 0 -18 -387Russia -1,685 -225 -145 -12 -552 245 -39 -36 -295 0 -294 -257EU -16,217 -2,433 -2,152 -34 -4,460 -318 182 -250 -427 -4 -3,407 -2,433TPP economies 94,443 7,400 10,219 973 24,840 11,242 13,964 1,049 2,066 18 13,918 8,085RCEP economies 44,175 5,518 1,783 405 15,016 3,743 9,445 694 2 10 6,669 1,028APEC economies 68,883 4,618 9,256 824 20,963 10,236 11,783 809 1,646 19 7,539 1,501World 34,127 812 4,699 548 12,280 10,054 11,368 368 -491 14 -25 -4,115
Annex Table II-1-A The contributions by TPP economies: Tariff removals
28
(USD mil.) TPP AUS CAN CHL JPN MEX MYS NZL PER SGP USA VNMJapan 86,601 5,454 1,189 508 46,955 978 11,778 560 226 2,097 10,646 5,049Malaysia 50,777 620 57 30 1,143 430 40,064 60 6 4,350 1,837 490Singapore 31,814 288 38 11 923 -53 7,848 30 22 19,233 940 1,233Viet Nam 20,830 390 301 21 1,461 1,069 1,310 48 11 842 5,436 8,502Australia 23,189 9,518 -162 76 3,709 152 4,268 504 -79 3,258 1,547 323New Zealand 7,139 671 570 0 428 413 563 3,326 22 293 821 75US 112,962 333 11,050 130 11,537 20,531 16,924 364 1,393 9,101 40,607 844Canada 35,054 79 15,354 129 1,456 -334 2,440 -6 29 1,319 14,291 -204Mexico 75,123 -64 -1,197 29 -1,046 64,313 1,202 -45 247 850 10,799 -583Chile 3,464 -41 -183 1,324 395 302 632 -7 6 464 624 -23Peru 2,465 -13 -6 28 17 86 211 -2 1,249 149 778 -25China -25,844 -1,159 -1,986 -20 -425 -7,753 -392 -289 -23 398 -6,465 -6,200Korea -5,831 -351 -252 -31 322 -1,420 -2,264 -28 19 -637 -166 -833Indonesia 720 -208 -372 -5 -746 -566 1,178 -48 -85 3,523 -855 -846Philippines -1,796 -41 -74 2 -125 -386 -860 -7 -9 233 -236 -190Thailand -681 -1,000 -281 -16 -74 -487 1,419 -46 -14 784 -282 -459Cambodia -2 1 -5 0 8 -19 51 -1 0 49 -92 34Laos 23 -1 -1 0 6 -1 -8 0 -1 11 5 15India -2,720 -250 -507 -8 -805 -1,228 1,166 -68 -50 1,340 -719 -1,402Hong Kong, China 2,327 3 33 3 269 -46 975 0 7 1,089 132 -133Chinese Taipei -3,431 -93 -129 3 297 -666 -1,954 -18 4 -339 -22 -373Russia 1,940 -495 -834 -9 -1,247 -158 4,287 -90 -371 2,442 -1,131 -441EU -9,119 -3,497 -5,459 40 -5,878 -6,943 16,209 -489 -510 7,561 -5,385 -4,315TPP economies 449,419 17,236 27,013 2,285 66,977 87,885 87,240 4,832 3,131 41,956 88,325 15,682RCEP economies 184,220 13,931 -1,484 567 52,778 -8,872 66,121 4,041 44 35,774 12,417 5,791APEC economies 416,823 13,891 23,118 2,212 65,247 76,402 89,629 4,307 2,659 49,450 79,300 6,206World 407,201 7,987 11,711 2,051 52,114 66,257 125,799 3,369 163 69,565 68,282 -3,386
Annex Table II-1-B The contributions by TPP economies: Tariff removals and NTMs reductions
29
(USD mil.) RCEP AUS CHN IDN IND JPN HKG KOR LAO MYS NZLJapan 95,179 3,916 54,594 2,378 2,874 15,377 24 5,710 -13 4,803 430Malaysia 15,279 209 3,290 337 2,138 260 9 -23 2 7,043 18Singapore 8,183 -70 2,137 540 2,944 634 38 -82 2 515 1Viet Nam 18,332 109 3,431 255 834 528 49 494 3 160 16Australia 33,312 5,930 11,103 1,012 7,341 3,340 64 1,893 2 494 -271New Zealand 3,898 -105 1,493 157 189 361 -1 193 1 96 1,019US -27,379 -2,411 -13,156 -658 -5,842 -918 118 -3,900 -19 599 -123Canada -790 -103 464 130 -1,600 -111 10 -168 -2 163 -9Mexico -3,389 -220 -1,508 87 -1,861 164 -17 95 -5 251 1Chile -282 -10 94 69 -739 -67 10 -32 -1 15 -2Peru 8 -2 129 33 -214 -5 0 -4 0 6 -2China 107,877 4,160 65,392 1,250 17,096 3,280 -56 7,165 14 2,211 474Korea 56,422 977 24,641 277 5,545 787 63 19,967 11 1,156 91Indonesia 26,253 803 8,177 10,824 5,064 122 -48 38 -5 -19 40Philippines 9,500 69 857 85 266 -9 -8 -92 -1 161 9Thailand 27,937 -1,022 5,112 336 2,376 1,207 256 20 73 365 -7Cambodia 1,387 -4 207 0 18 -41 785 14 1 21 -1Laos 329 -2 38 0 -11 -2 -1 -2 157 -18 0India 68,709 -22 5,170 455 59,837 150 -63 468 -4 933 25Hong Kong, China 245 -36 -188 16 207 -20 -5 64 -1 131 -4Chinese Taipei -10,769 -148 -7,797 -379 -187 7 -50 -452 -1 -254 -8Russia -684 -92 1,727 518 -4,864 239 25 -33 -9 270 -9EU -35,946 -3,578 -15,956 -516 -11,241 297 -16 -3,411 -37 1,427 -183TPP economies 142,350 7,242 62,069 4,339 6,064 19,564 303 4,176 -31 14,146 1,077RCEP economies 472,596 14,949 185,640 17,906 106,512 25,995 1,111 35,761 243 17,922 1,844APEC economies 359,131 11,954 159,991 17,266 31,567 25,177 480 30,853 51 18,167 1,663World 377,984 7,222 151,405 18,933 58,655 26,168 1,102 26,758 141 21,820 1,412
Annex Table II-2-A The contributions by RCEP economies: Tariff removals
30
(USD mil.) PHL SGP THA VNMJapan 1,216 0 4,834 2,397Malaysia 96 0 1,803 107Singapore 78 0 966 683Viet Nam 408 0 785 10,139Australia 469 0 1,962 -93New Zealand 137 0 213 27US 596 0 357 -1,294Canada 67 0 726 -268Mexico -18 0 537 -689Chile 17 0 417 -56Peru 4 0 129 -64China 2,283 0 4,119 -1,941Korea 252 0 -134 2,977Indonesia 41 0 2,327 -1,231Philippines 7,469 0 1,058 -273Thailand 303 0 18,332 17Cambodia 0 0 405 -15Laos 0 0 164 10India 452 0 499 -1,813Hong Kong, China 69 0 227 -241Chinese Taipei -301 0 -498 -760Russia 93 0 2,059 -579EU 871 0 2,846 -5,469TPP economies 3,069 1 12,730 10,889RCEP economies 13,202 1 37,334 10,990APEC economies 13,276 1 40,221 8,856World 15,046 1 53,588 -5,158
(Cont) Annex Table II-2-A The contributions by RCEP economies: Tariff removals
31
(USD mil.) RCEP AUS CHN IDN IND JPN KHM KOR LAO MYS NZL
Japan 153,467 4,582 66,172 2,361 3,043 51,255 27 5,737 -20 9,764 602Malaysia 67,876 408 4,474 362 2,577 921 19 -22 4 49,938 45Singapore 41,493 193 3,083 642 3,555 1,143 59 -79 3 7,341 34Viet Nam 32,080 266 4,130 358 934 1,001 110 497 9 1,285 30Australia 58,193 13,745 15,276 1,233 8,354 5,205 83 1,908 0 4,726 377New Zealand 9,606 476 1,902 216 255 688 -1 196 2 670 3,935US -4,214 -2,913 -8,287 -831 -6,364 -163 224 -3,906 -21 12,726 -216Canada 4,802 -149 1,776 93 -1,852 -329 14 -169 -4 3,025 -24Mexico -2,166 -331 -2,050 66 -2,313 193 -32 95 -7 1,737 -29Chile 1,651 -38 563 78 -858 -160 14 -31 -2 910 -4Peru 678 -8 277 36 -257 -5 -1 -4 -1 314 -3China 199,420 5,720 127,196 1,054 19,348 11,095 -173 7,228 2 10,608 627Korea 65,384 1,221 31,338 260 6,086 2,395 85 20,288 16 934 146Indonesia 41,380 1,117 9,871 13,350 5,338 1,353 -70 42 -9 3,689 67Philippines 36,464 107 2,349 71 279 612 -14 -94 -2 158 19Thailand 41,168 -780 6,582 403 2,669 2,476 400 20 163 4,333 20Cambodia 2,426 -2 227 -1 17 -34 1,572 14 1 85 -2Laos 672 -2 52 -1 -12 -2 -2 -2 387 2 -1India 101,409 208 8,434 533 79,919 653 -96 470 -5 4,351 38Hong Kong, China 4,550 10 961 16 250 279 -3 66 -1 1,246 0Chinese Taipei -15,319 -137 -9,267 -404 -157 324 -59 -456 -1 -2,397 -12Russia 11,410 -218 4,319 565 -5,744 188 34 -30 -17 6,237 -39EU 1,510 -4,236 -10,272 -701 -12,923 1,086 -11 -3,421 -42 22,464 -324TPP economies 363,465 16,231 87,316 4,615 7,072 59,750 515 4,222 -38 92,437 4,747RCEP economies 851,039 27,257 281,085 20,842 132,362 78,762 1,996 36,204 550 97,883 5,938APEC economies 747,923 23,271 260,665 19,929 35,139 78,471 714 31,287 114 117,245 5,576World 891,970 17,744 272,026 21,561 78,608 81,163 2,009 27,193 406 171,276 5,100
Annex Table II-2-B The contributions by RCEP economies: Tariff removals and NTMs reductions
32
(USD mil.)PHL SGP THA VNM
Japan 2,953 1,921 5,263 3,151Malaysia 319 4,298 1,965 311Singapore 487 21,778 1,056 980Viet Nam 854 883 848 18,662Australia 1,404 3,734 2,189 18New Zealand 367 344 259 65US 2,861 5,083 555 -2,436Canada 623 1,508 784 -478Mexico 5 1,042 591 -1,174Chile 205 561 449 -94Peru 73 184 141 -86China 6,687 4,046 4,320 -3,210Korea -2 163 -131 3,734Indonesia 581 5,547 2,428 -1,491Philippines 31,566 598 1,086 -344Thailand 729 1,512 21,133 519Cambodia 3 60 420 69Laos 1 13 187 58India 1,111 2,778 562 -2,404Hong Kong, China 406 1,251 260 -307Chinese Taipei -1,137 -515 -520 -851Russia 1,278 3,252 2,264 -880EU 5,002 10,088 3,407 -8,415TPP economies 10,154 41,336 14,099 18,919RCEP economies 47,063 47,673 41,586 20,118APEC economies 50,263 57,188 44,939 16,088World 61,810 84,639 59,838 -4,050
(Cont) Annex Table II-2-B The contributions by RCEP economies: Tariff removals and NTMs reductions
33
(USD mil.) FTAAP AUS CAN CHL CHN HKG IDN JPN KOR MEX MYSJapan 114,268 3,712 1,868 444 41,268 0 2,206 20,656 4,037 1,781 4,779Malaysia 14,932 207 85 28 1,388 0 313 208 -135 383 10,147Singapore 7,589 -85 86 11 1,093 0 496 422 -232 164 585Viet Nam 16,157 108 60 9 -335 0 237 391 457 524 148Australia 48,254 6,180 114 78 9,926 0 970 1,877 1,452 684 486New Zealand 4,830 -104 556 -1 1,193 0 137 82 99 338 97US 120,706 -2,056 1,320 -219 81,485 0 818 4,706 2,131 -4,495 2,336Canada 9,963 9 7,437 115 2,747 0 200 1,044 -37 399 284Mexico 34,946 63 -628 -14 -4,571 0 99 -503 -115 31,330 437Chile 1,679 1 -37 866 701 0 90 37 1 210 65Peru 464 2 -13 -5 47 0 36 -35 -15 107 18China 243,694 4,078 3,235 203 133,441 1 304 1,978 5,386 6,125 2,149Korea 64,432 947 448 210 18,290 0 165 578 24,062 2,596 1,185Indonesia 18,052 789 102 57 1,990 0 12,487 -116 -172 854 46Philippines 10,518 71 61 12 -696 0 59 -42 -235 131 235Thailand 27,746 -1,066 -47 90 1,780 0 317 602 -187 255 400Cambodia -1,391 -4 -64 -2 -1,171 0 -10 -39 13 -37 21Laos 9 -2 -1 0 -36 0 -1 1 -3 3 -20India -20,353 -453 -472 -25 -11,268 0 -903 -657 -1,195 -237 -522Hong Kong, China 5,827 49 66 0 2,766 0 52 25 161 43 240Chinese Taipei 28,317 123 222 53 11,304 0 174 418 541 901 980Russia 37,439 -102 53 17 7,239 0 610 -177 77 1,473 683EU -125,475 -3,746 -1,870 21 -43,033 0 -963 -3,701 -6,804 316 2,155TPP economies 373,788 8,038 10,847 1,312 134,943 0 5,600 28,885 7,642 31,426 19,381RCEP economies 548,736 14,379 6,029 1,114 196,864 0 16,777 25,943 33,347 13,563 19,734APEC economies 809,812 12,927 14,986 1,954 311,057 0 19,769 32,151 37,277 43,804 25,298World 573,915 7,515 10,502 1,609 227,411 0 19,466 24,673 25,949 47,764 28,856
Annex Table II-3-A The contributions by FTAAP economies: Tariff removals
34
(USD mil.)NZL PER PHL RUS SGP THA TWN USA VNM
Japan 392 223 1,084 19,061 1 4,567 2,589 6,292 2,112Malaysia 15 7 50 98 0 1,722 -27 566 84Singapore -4 28 38 3,174 16 880 76 282 647Viet Nam 14 -1 408 -1,088 1 795 445 2,043 13,328Australia -316 -66 457 22,654 -1 1,990 516 1,201 -250New Zealand 1,203 14 132 325 0 202 115 483 -31US 115 811 1,583 20,567 -1 2,745 2,281 9,530 -135Canada -19 20 193 -2,715 0 854 209 -858 -302Mexico -5 143 -70 12,156 9 557 80 -3,511 -864Chile -3 -73 96 -1,231 0 527 130 491 -43Peru -2 900 7 -887 0 146 42 403 -67China 411 944 1,947 50,337 0 3,342 2,417 31,283 -5,869Korea 82 160 145 11,381 0 -290 312 2,149 2,425Indonesia 31 9 -2 -65 0 2,235 218 3,093 -1,613Philippines 7 18 9,072 614 0 970 153 1,013 -350Thailand -13 44 266 3,299 0 21,071 229 1,040 -180Cambodia -1 -1 -2 54 0 128 26 -567 -32Laos 0 -1 0 -4 0 67 1 0 6India -36 -65 18 51 0 -444 -273 -2,272 -2,943Hong Kong, China 0 7 169 1,495 0 340 209 524 -110Chinese Taipei 23 66 405 1,744 4 844 7,618 1,646 1,892Russia -25 -279 140 22,545 0 2,235 490 1,414 -367EU -286 -377 869 -61,360 -7 2,835 -711 -326 -7,244TPP economies 1,390 2,006 3,979 72,115 26 14,985 6,455 16,922 14,478RCEP economies 1,785 1,313 13,612 109,893 19 37,234 6,797 46,606 7,335APEC economies 1,907 2,974 16,120 163,465 31 45,732 18,101 59,084 10,306World 1,408 607 17,473 44,396 24 57,914 18,289 50,703 -8,141
(Cont) Annex Table 3-A The contributions by RCEP economies: Tariff removals
35
(USD mil.) FTAAP AUS CAN CHL CHN HKG IDN JPN KOR MEX MYSJapan 176,966 4,222 1,212 522 50,328 128 2,154 62,030 4,056 -722 9,161Malaysia 69,736 376 31 32 2,273 22 333 700 -136 111 56,205Singapore 42,667 136 79 20 1,768 80 597 848 -230 -66 7,208Viet Nam 31,099 253 36 10 306 9 338 792 461 578 1,264Australia 73,855 14,626 -58 85 13,922 86 1,116 3,092 1,462 735 4,711New Zealand 10,991 440 574 0 1,580 21 181 286 100 480 659US 251,825 -1,329 8,846 -16 94,456 286 868 9,629 2,162 16,174 19,215Canada 42,716 51 18,938 131 5,027 58 183 1,286 -36 313 3,465Mexico 114,731 -62 -1,371 34 -4,802 28 55 -617 -116 99,828 2,009Chile 6,865 -22 -137 1,897 2,022 17 98 295 4 546 1,009Peru 2,531 -4 -18 19 501 4 39 15 -15 164 338China 355,549 5,301 2,776 348 204,789 642 48 8,598 5,438 1,603 9,521Korea 72,290 1,153 320 252 23,608 34 139 2,112 24,426 2,199 602Indonesia 32,705 1,032 -92 60 3,428 31 15,273 787 -169 575 3,676Philippines 39,723 96 14 15 281 14 40 463 -237 -220 6Thailand 40,367 -863 -94 98 2,846 24 379 1,662 -188 -68 4,324Cambodia -1,270 -5 -66 -2 -1,168 -1 -11 -36 13 -48 78Laos 33 -3 -3 0 -31 0 -1 0 -3 1 -12India -19,243 -500 -681 -20 -11,754 -16 -895 -770 -1,200 -1,332 1,517Hong Kong, China 15,953 172 113 10 5,591 1,636 57 589 165 82 1,598Chinese Taipei 43,177 239 186 65 14,612 26 158 1,264 540 507 -123Russia 80,431 -282 -525 32 11,590 56 649 -198 82 1,644 6,959EU -104,442 -5,116 -5,043 106 -39,793 50 -1,299 -5,119 -6,835 -5,772 23,039TPP economies 823,980 18,687 28,132 2,734 167,381 740 5,962 78,357 7,713 118,141 105,244RCEP economies 925,466 26,264 4,047 1,421 292,174 1,076 19,690 80,564 33,794 3,826 98,921APEC economies 1,504,174 25,534 30,830 3,614 434,125 3,204 22,705 93,634 37,771 124,463 131,806World 1,340,002 17,777 19,878 3,394 363,984 3,282 21,991 82,126 26,398 120,960 184,517
Annex Table II-3-B The contributions by FTAAP economies: Tariff removals and NTMs reductions
36
(USD mil.) NZL PER PHL RUS SGP THA TWN USA VNMJapan 545 254 2,332 20,524 1,559 4,979 3,883 9,234 2,756Malaysia 38 7 183 252 4,400 1,884 -1 1,100 283Singapore 23 36 302 3,297 24,308 963 129 890 917Viet Nam 26 -2 869 -1,021 925 857 693 2,510 22,788Australia 273 -74 1,388 22,865 3,678 2,180 1,057 2,113 -229New Zealand 4,353 22 340 389 349 234 208 836 -21US 256 1,035 6,134 22,433 9,490 3,247 4,543 58,557 -728Canada -9 38 906 -2,522 1,707 926 492 11,747 -495Mexico -33 141 -122 12,294 1,109 601 263 6,265 -1,418Chile -5 -33 403 -1,192 610 564 261 882 -72Peru -3 1,661 82 -879 199 157 85 547 -92China 518 1,083 6,152 55,364 3,474 3,492 5,471 41,685 -8,086Korea 134 186 -448 12,386 -98 -296 352 3,396 3,055Indonesia 50 -2 452 76 5,715 2,324 424 3,624 -1,956Philippines 15 19 36,398 679 541 993 157 1,464 -435Thailand 8 48 583 3,498 1,536 24,144 319 1,560 265Cambodia -2 -2 1 52 54 141 37 -603 -15Laos -1 -1 0 -5 12 74 0 0 10India -81 -74 312 87 1,587 -456 -206 -2,561 -4,051Hong Kong, China 16 12 660 1,528 1,827 395 462 1,221 -151Chinese Taipei 43 78 140 1,998 -50 857 18,180 2,469 2,502Russia -61 -346 1,416 45,118 3,606 2,455 1,139 1,475 -653EU -537 -452 4,832 -61,422 9,844 3,290 786 -3,739 -10,863TPP economies 5,464 3,086 12,816 76,439 48,334 16,592 11,614 94,679 23,690RCEP economies 5,900 1,501 48,864 118,443 48,041 41,512 12,524 65,247 15,281APEC economies 6,188 4,165 58,168 197,086 64,884 50,955 38,119 151,573 18,229World 5,202 1,437 68,776 80,562 91,201 64,360 42,025 137,384 -8,216
(Cont) Annex Table II-3-B The contributions by RCEP economies: Tariff removals and NTMs reductions