the relationship between water cost and water prices · the relationship between water cost and...
TRANSCRIPT
The Relationship Between Water Cost and Water PricesA Review and Analysis of Errors Identified in Utah Professors’
Analysis of the Lake Powell Pipeline Project
September 2016
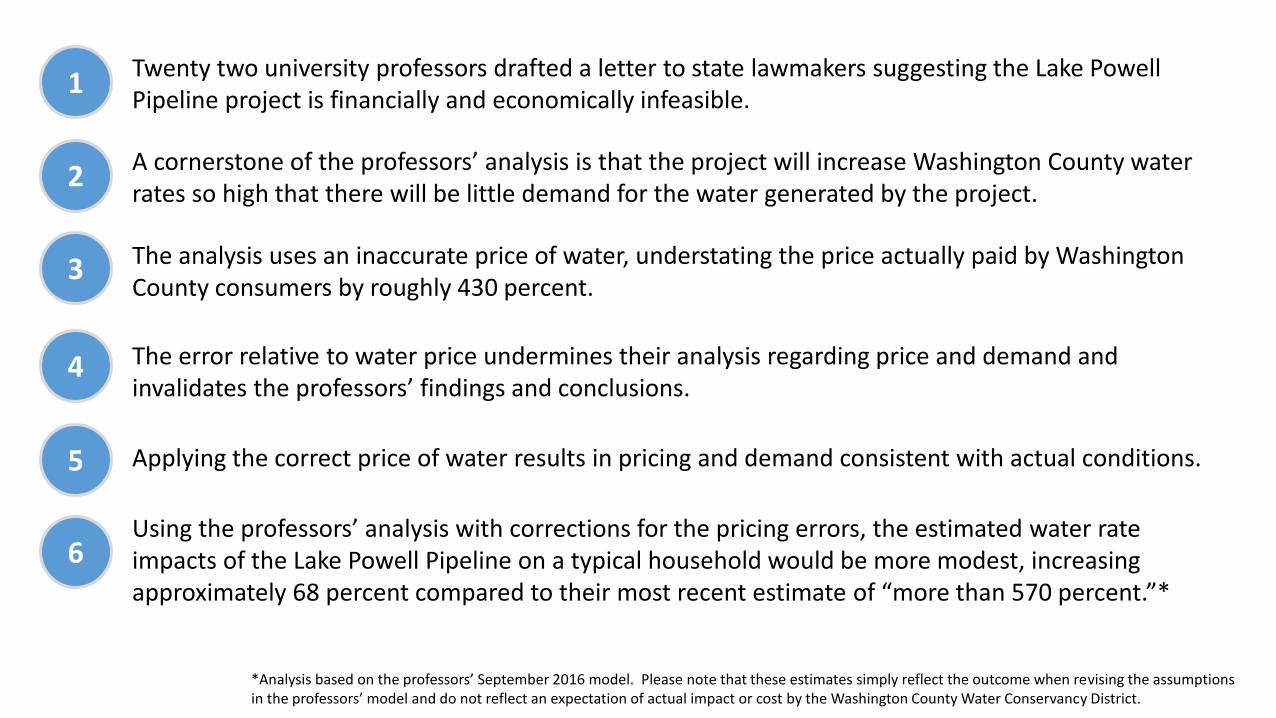
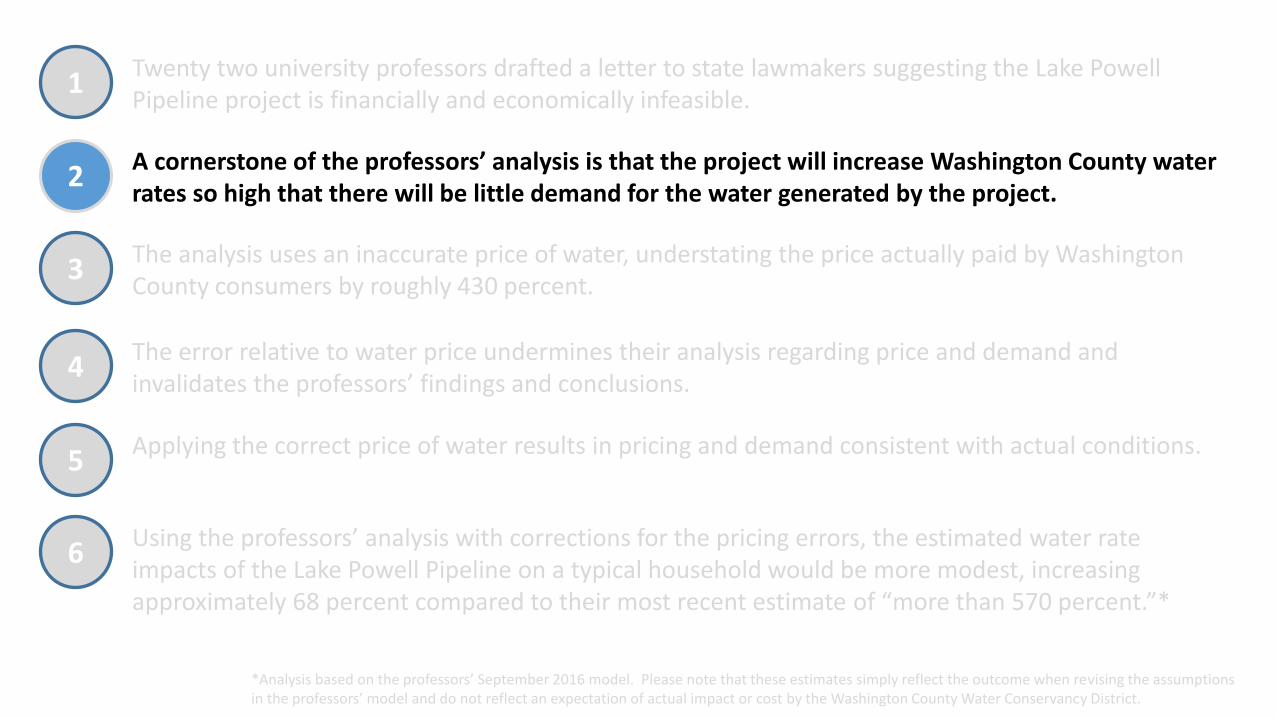
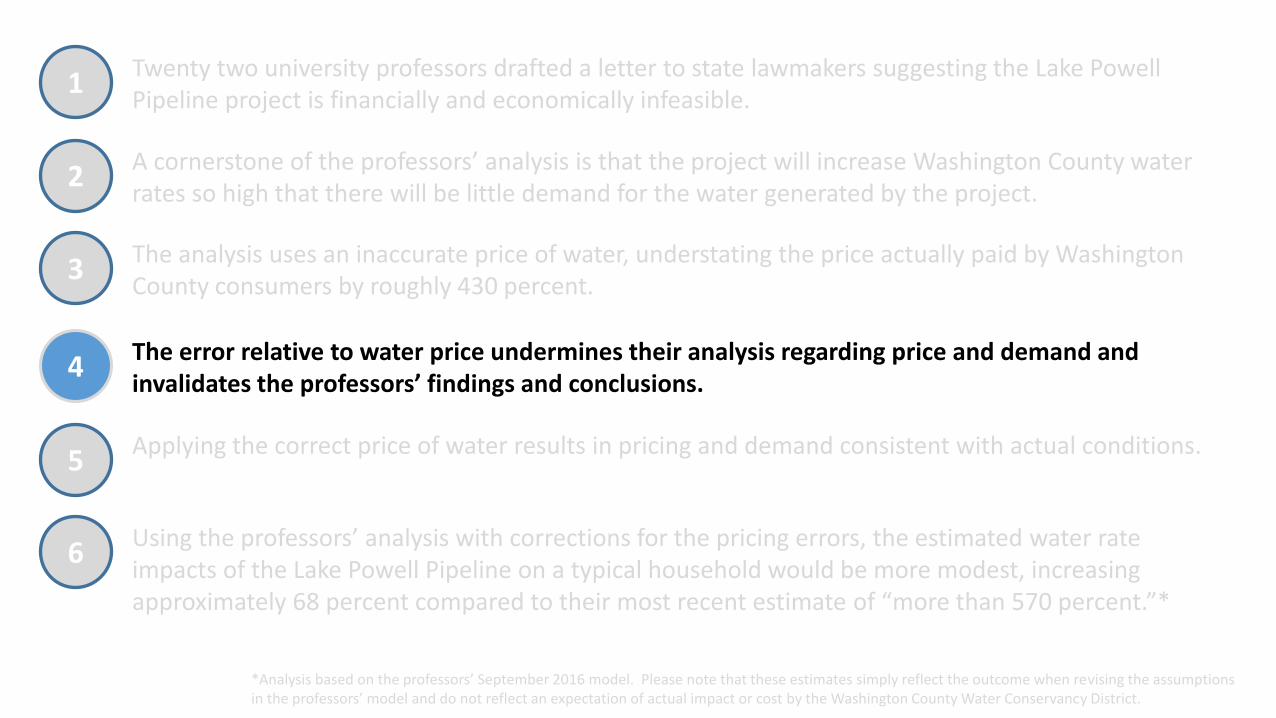
1Twenty two university professors drafted a letter to state lawmakers suggesting the Lake Powell Pipeline project is financially and economically infeasible.
2A cornerstone of the professors’ analysis is that the project will increase Washington County water rates so high that there will be little demand for the water generated by the project.
3 The analysis uses an inaccurate price of water, understating the price actually paid by Washington County consumers by roughly 430 percent.
4 The error relative to water price undermines their analysis regarding price and demand and invalidates the professors’ findings and conclusions.
5 Applying the correct price of water results in pricing and demand consistent with actual conditions.
6Using the professors’ analysis with corrections for the pricing errors, the estimated water rate impacts of the Lake Powell Pipeline on a typical household would be more modest, increasing approximately 68 percent compared to their most recent estimate of “more than 570 percent.”*
*Analysis based on the professors’ September 2016 model. Please note that these estimates simply reflect the outcome when revising the assumptions in the professors’ model and do not reflect an expectation of actual impact or cost by the Washington County Water Conservancy District.

Notes & Limitations
• This analysis is intended to explain why one element of the professors’ analysis is incorrect. This is not to suggest that this is the only error contained in the report. Other issues have been or will be addressed under separate cover.
• Recalculations of the professors' analysis are provided in this report. These recalculations are provided for illustrative purposes only. This should not be interpreted to suggest that other elements, including, without limitation, the relationship between water prices and demand, assumed by the professors are accurate.
• The Washington County Water Conservancy District continues to evaluate near-term and long-run water supply and demand issues as part of its resource planning process.
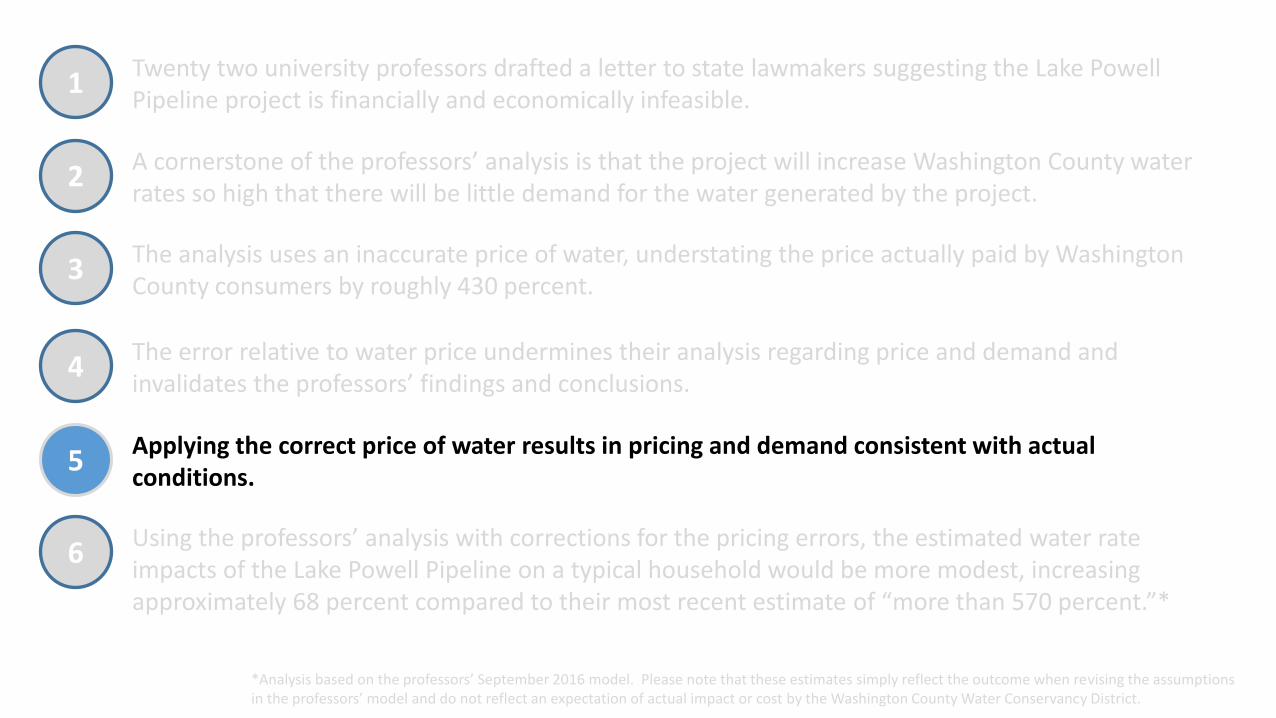
1Twenty two university professors drafted a letter to state lawmakers suggesting the Lake Powell Pipeline project is financially and economically infeasible.
2A cornerstone of the professors’ analysis is that the project will increase Washington County water rates so high that there will be little demand for the water generated by the project.
3The analysis uses an inaccurate price of water, understating the price actually paid by Washington County consumers by roughly 430 percent.
4The error relative to water price undermines their analysis regarding price and demand and invalidates the professors’ findings and conclusions.
5Applying the correct price of water results in pricing and demand consistent with actual conditions.
6Using the professors’ analysis with corrections for the pricing errors, the estimated water rate impacts of the Lake Powell Pipeline on a typical household would be more modest, increasing approximately 68 percent compared to their most recent estimate of “more than 570 percent.”*
*Analysis based on the professors’ September 2016 model. Please note that these estimates simply reflect the outcome when revising the assumptions in the professors’ model and do not reflect an expectation of actual impact or cost by the Washington County Water Conservancy District.
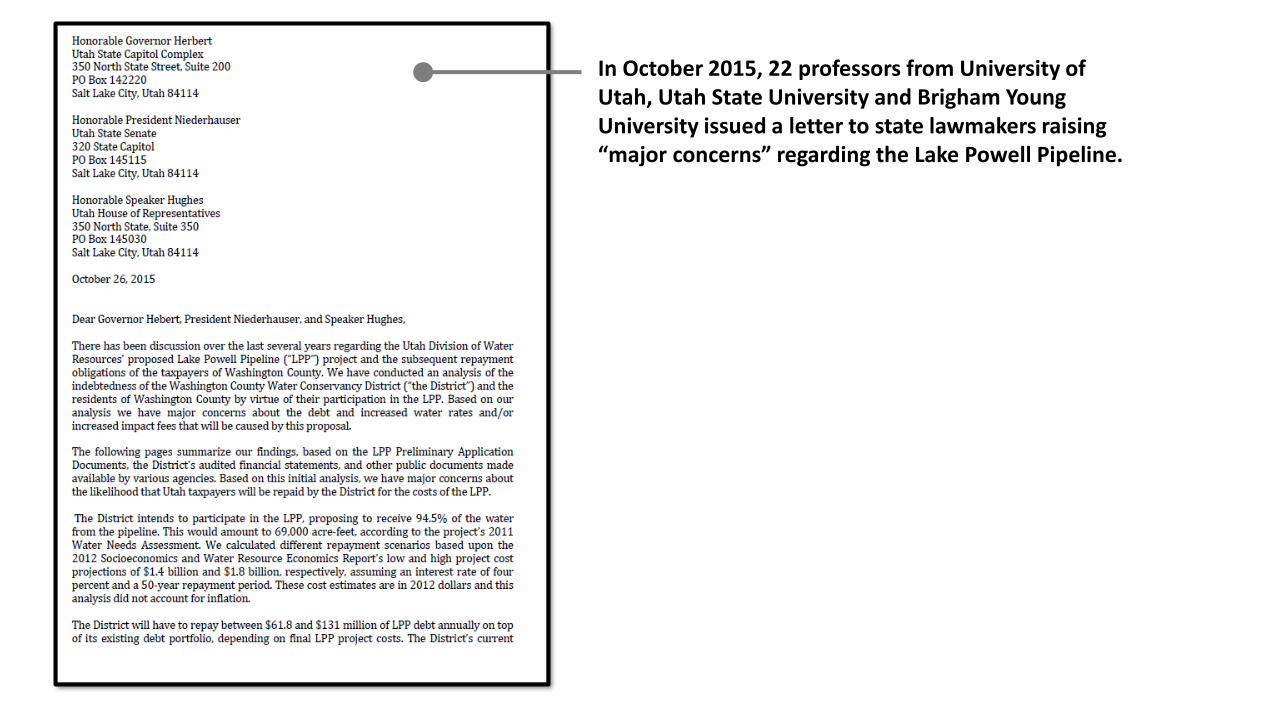
In October 2015, 22 professors from University of Utah, Utah State University and Brigham Young University issued a letter to state lawmakers raising “major concerns” regarding the Lake Powell Pipeline.
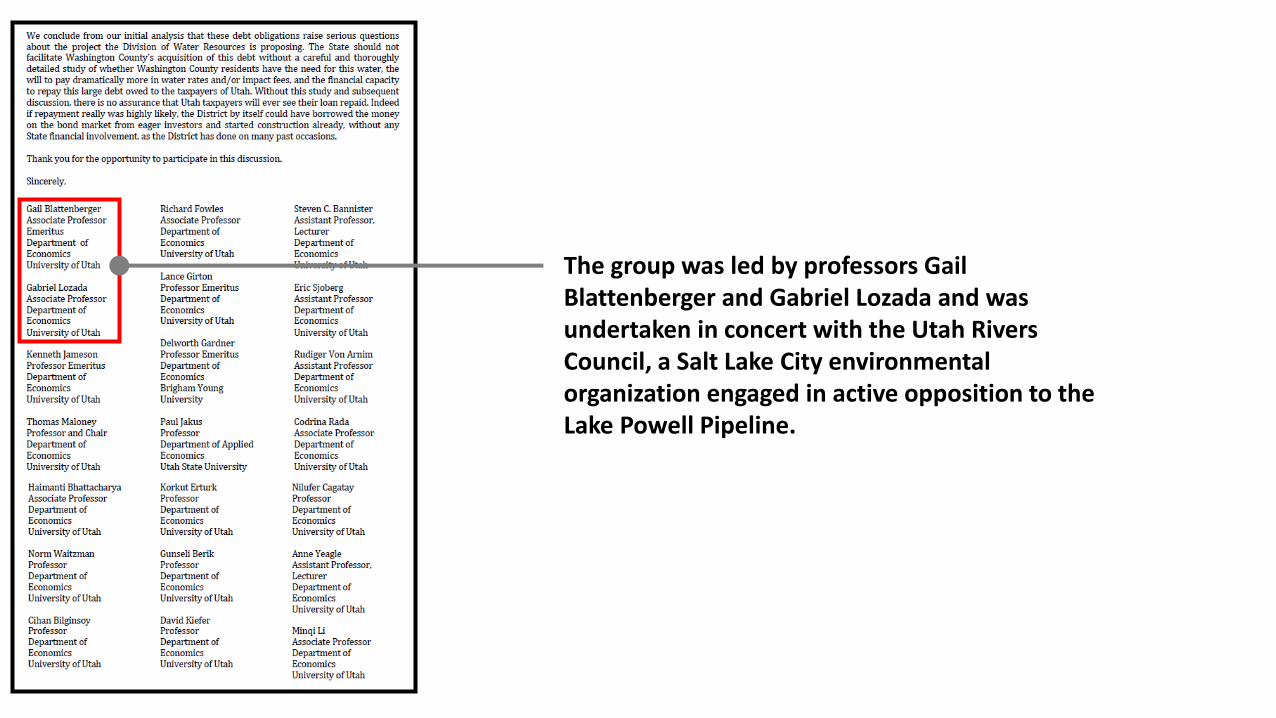
The group was led by professors Gail Blattenberger and Gabriel Lozada and was undertaken in concert with the Utah Rivers Council, a Salt Lake City environmental organization engaged in active opposition to the Lake Powell Pipeline.
1Twenty two university professors drafted a letter to state lawmakers suggesting the Lake Powell Pipeline project is financially and economically infeasible.
2A cornerstone of the professors’ analysis is that the project will increase Washington County water rates so high that there will be little demand for the water generated by the project.
3The analysis uses an inaccurate price of water, understating the price actually paid by Washington County consumers by roughly 430 percent.
4The error relative to water price undermines their analysis regarding price and demand and invalidates the professors’ findings and conclusions.
5Applying the correct price of water results in pricing and demand consistent with actual conditions.
6Using the professors’ analysis with corrections for the pricing errors, the estimated water rate impacts of the Lake Powell Pipeline on a typical household would be more modest, increasing approximately 68 percent compared to their most recent estimate of “more than 570 percent.”*
*Analysis based on the professors’ September 2016 model. Please note that these estimates simply reflect the outcome when revising the assumptions in the professors’ model and do not reflect an expectation of actual impact or cost by the Washington County Water Conservancy District.
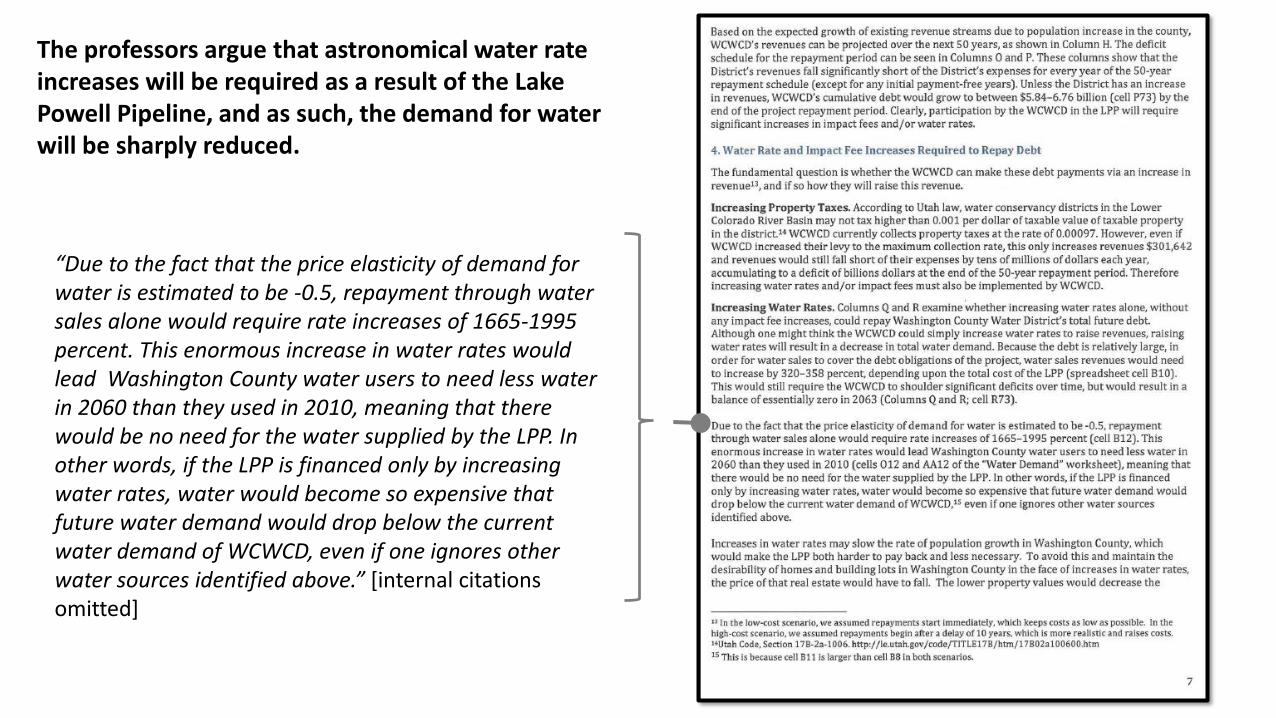
The professors argue that astronomical water rate increases will be required as a result of the Lake Powell Pipeline, and as such, the demand for water will be sharply reduced.
“Due to the fact that the price elasticity of demand for water is estimated to be -0.5, repayment through water sales alone would require rate increases of 1665-1995 percent. This enormous increase in water rates would lead Washington County water users to need less water in 2060 than they used in 2010, meaning that there would be no need for the water supplied by the LPP. In other words, if the LPP is financed only by increasing water rates, water would become so expensive that future water demand would drop below the current water demand of WCWCD, even if one ignores other water sources identified above.” [internal citations omitted]
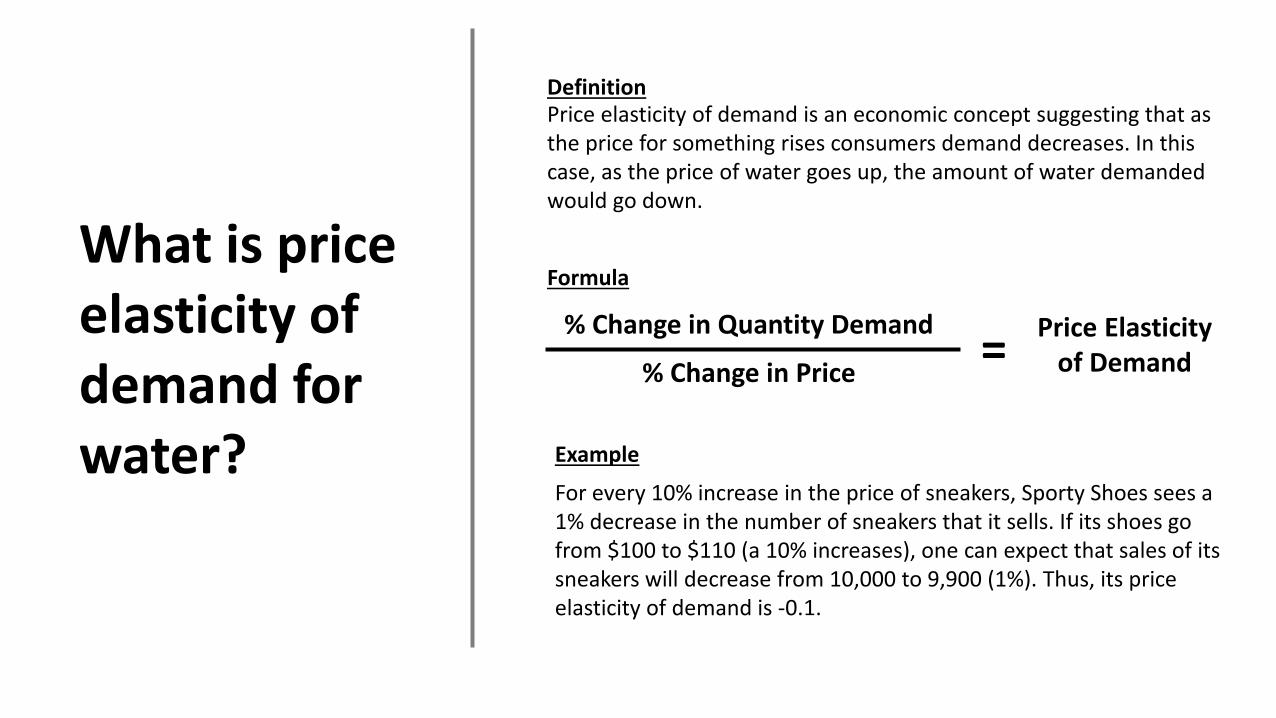
What is price elasticity of demand for water?
Price elasticity of demand is an economic concept suggesting that as the price for something rises consumers demand decreases. In this case, as the price of water goes up, the amount of water demanded would go down.
% Change in Quantity Demand
% Change in Price
Price Elasticity of Demand
Definition
Formula
=
Example
For every 10% increase in the price of sneakers, Sporty Shoes sees a 1% decrease in the number of sneakers that it sells. If its shoes go from $100 to $110 (a 10% increases), one can expect that sales of its sneakers will decrease from 10,000 to 9,900 (1%). Thus, its price elasticity of demand is -0.1.
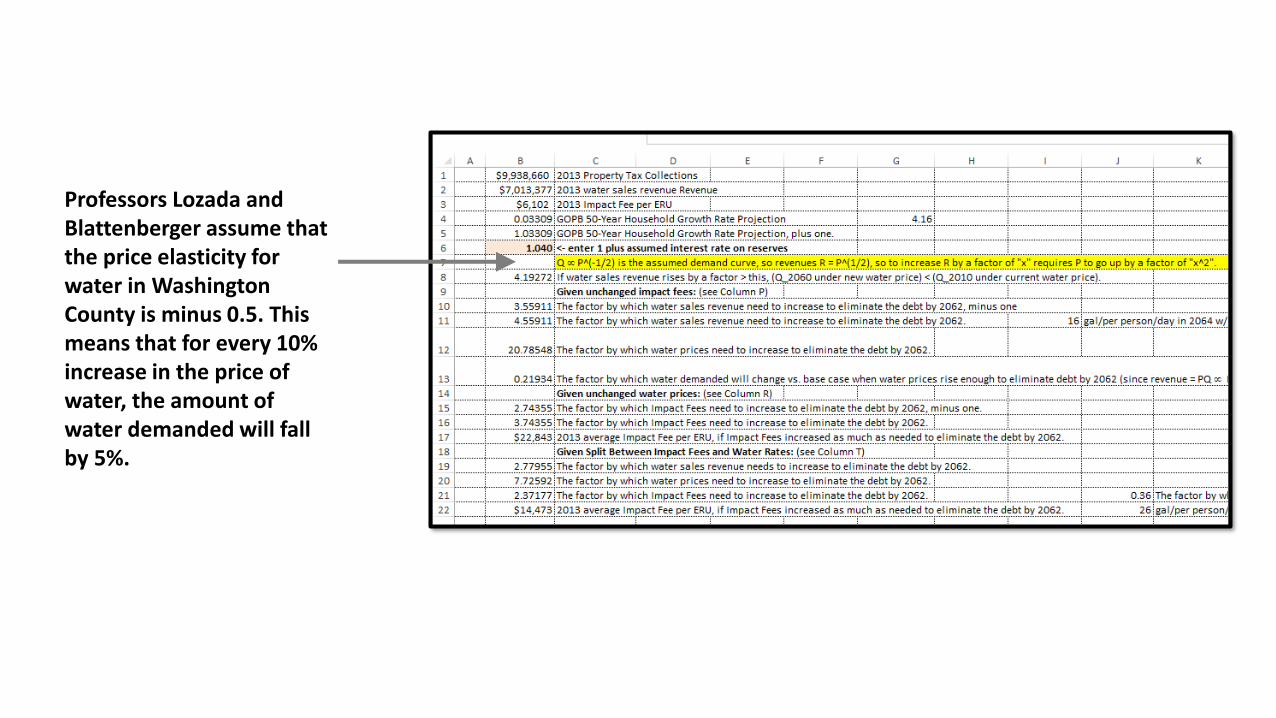
Professors Lozada and Blattenberger assume that the price elasticity for water in Washington County is minus 0.5. This means that for every 10% increase in the price of water, the amount of water demanded will fall by 5%.

Professors Lozada and Blattenberger first calculated the current price of water and the total quantity of water demanded, using “water sales revenue” of approximately $7.0 million from the annual financial statements of the Washington County Water Conservancy District.
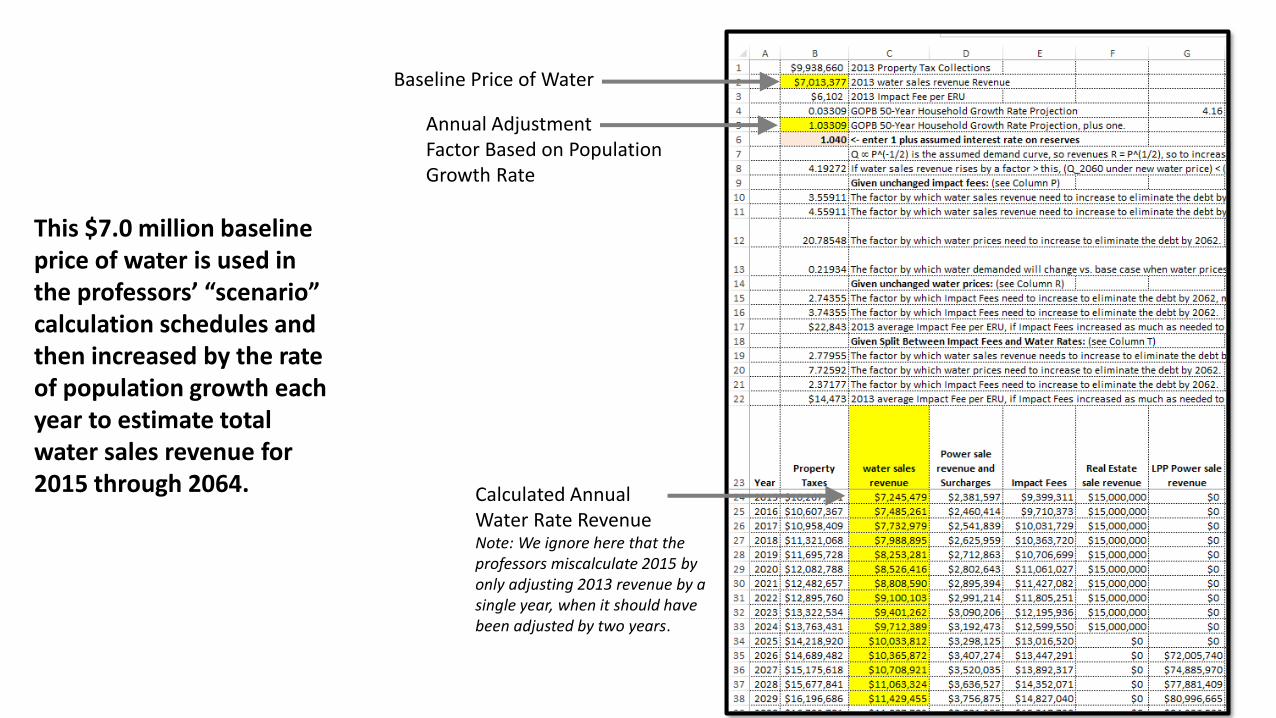
This $7.0 million baseline price of water is used in the professors’ “scenario” calculation schedules and then increased by the rate of population growth each year to estimate total water sales revenue for 2015 through 2064.
Baseline Price of Water
Annual AdjustmentFactor Based on PopulationGrowth Rate
Calculated Annual Water Rate Revenue Note: We ignore here that the professors miscalculate 2015 by only adjusting 2013 revenue by a single year, when it should havebeen adjusted by two years.
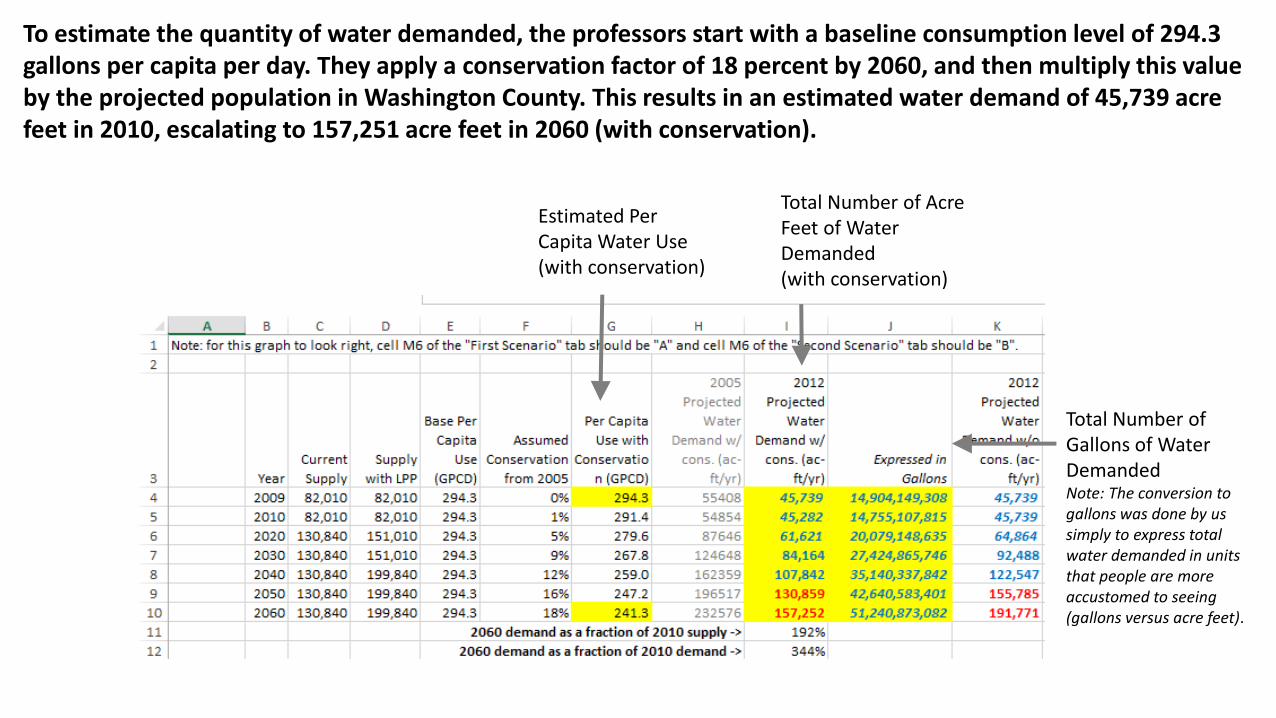
To estimate the quantity of water demanded, the professors start with a baseline consumption level of 294.3 gallons per capita per day. They apply a conservation factor of 18 percent by 2060, and then multiply this value by the projected population in Washington County. This results in an estimated water demand of 45,739 acre feet in 2010, escalating to 157,251 acre feet in 2060 (with conservation).
Estimated Per Capita Water Use(with conservation)
Total Number of Acre Feet of Water Demanded (with conservation)
Total Number of Gallons of Water Demanded Note: The conversion to gallons was done by us simply to express total water demanded in units that people are more accustomed to seeing (gallons versus acre feet).
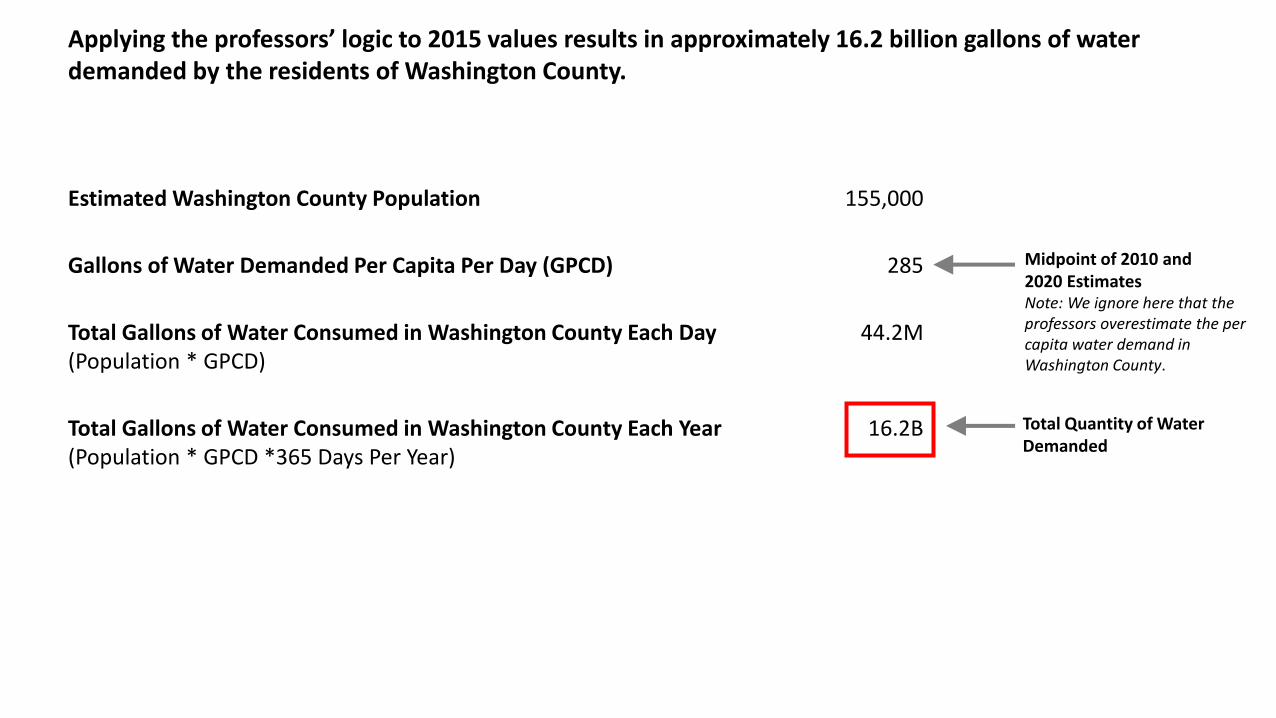
Applying the professors’ logic to 2015 values results in approximately 16.2 billion gallons of water demanded by the residents of Washington County.
Estimated Washington County Population 155,000
Gallons of Water Demanded Per Capita Per Day (GPCD) 285
Total Gallons of Water Consumed in Washington County Each Day (Population * GPCD)
44.2M
Total Gallons of Water Consumed in Washington County Each Year(Population * GPCD *365 Days Per Year)
16.2B
Midpoint of 2010 and 2020 EstimatesNote: We ignore here that the professors overestimate the per capita water demand in Washington County.
Total Quantity of Water Demanded

1Twenty two university professors drafted a letter to state lawmakers suggesting the Lake Powell Pipeline project is financially and economically infeasible.
2A cornerstone of the professors’ analysis is that the project will increase Washington County water rates so high that there will be little demand for the water generated by the project.
3The analysis uses an inaccurate price of water, understating the price actually paid by Washington County consumers by roughly 430 percent.
4The error relative to water price undermines their analysis regarding price and demand and invalidates the professors’ findings and conclusions.
5Applying the correct price of water results in pricing and demand consistent with actual conditions.
6Using the professors’ analysis with corrections for the pricing errors, the estimated water rate impacts of the Lake Powell Pipeline on a typical household would be more modest, increasing approximately 68 percent compared to their most recent estimate of “more than 570 percent.”*
*Analysis based on the professors’ September 2016 model. Please note that these estimates simply reflect the outcome when revising the assumptions in the professors’ model and do not reflect an expectation of actual impact or cost by the Washington County Water Conservancy District.
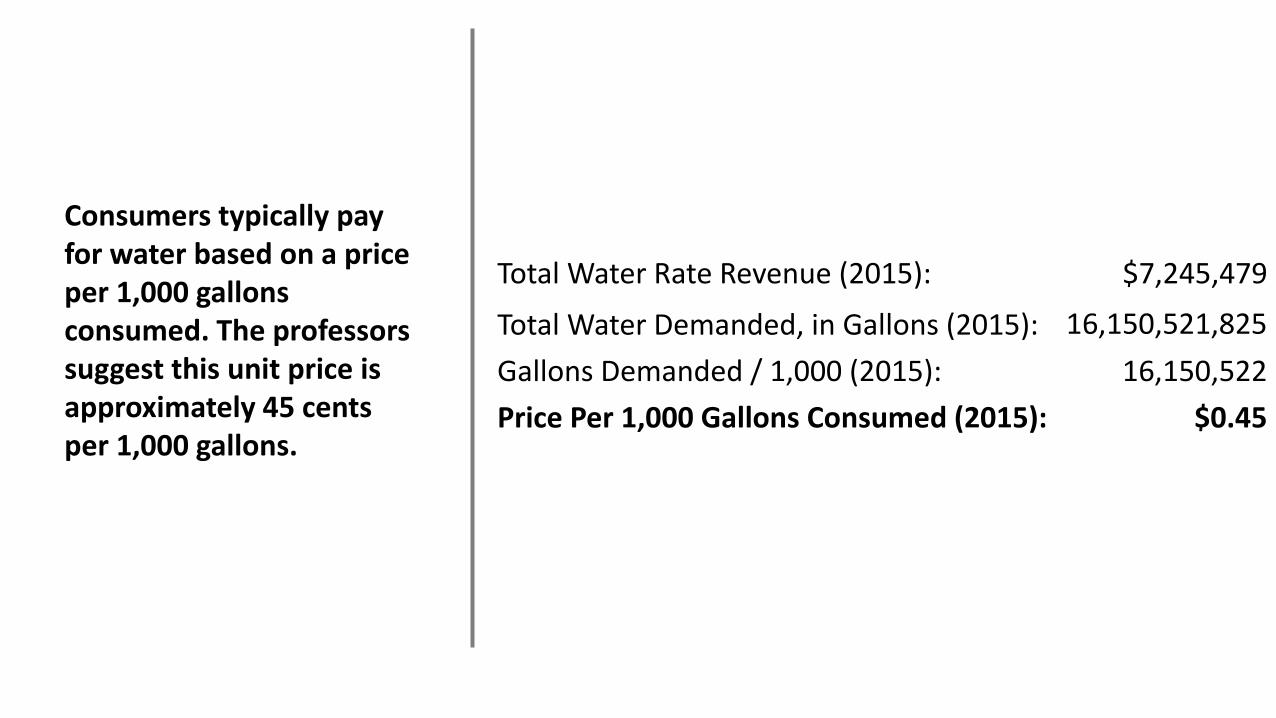
Consumers typically pay for water based on a price per 1,000 gallons consumed. The professors suggest this unit price is approximately 45 cents per 1,000 gallons.
Total Water Rate Revenue (2015): $7,245,479
Total Water Demanded, in Gallons (2015): 16,150,521,825
Gallons Demanded / 1,000 (2015): 16,150,522
Price Per 1,000 Gallons Consumed (2015): $0.45
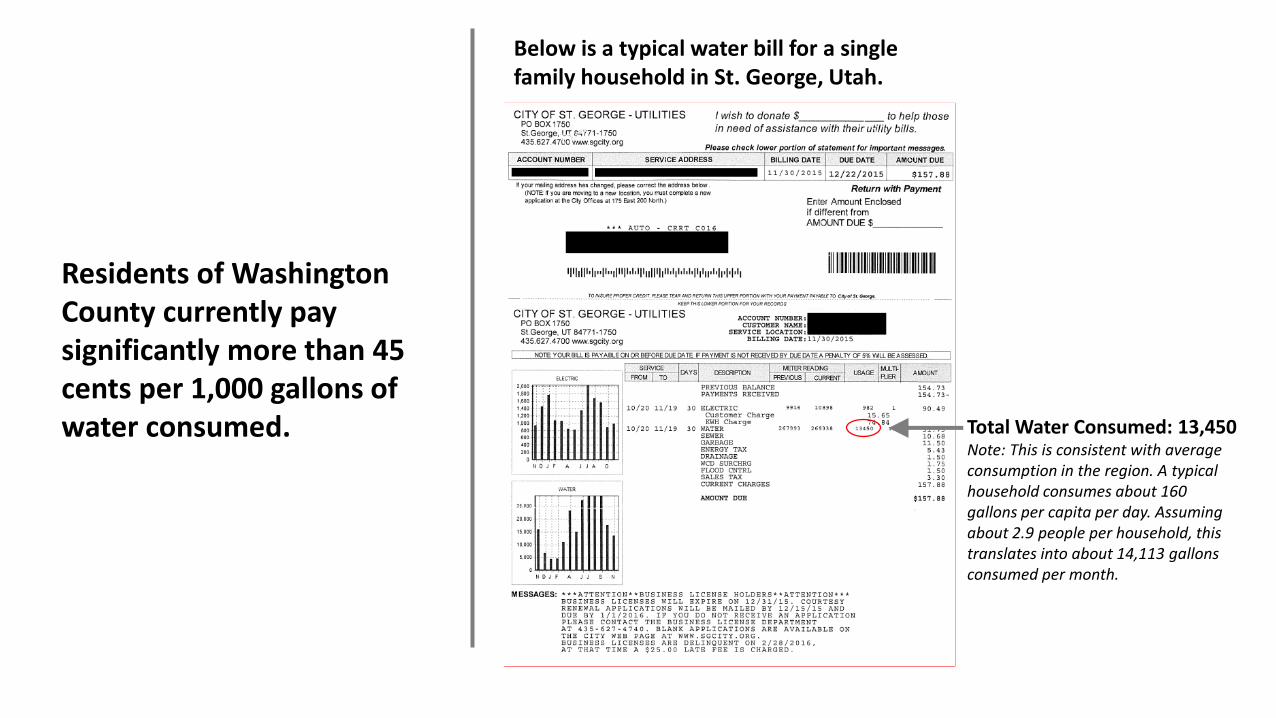
Residents of Washington County currently pay significantly more than 45 cents per 1,000 gallons of water consumed.
Below is a typical water bill for a single family household in St. George, Utah.
Total Water Consumed: 13,450Note: This is consistent with average consumption in the region. A typical household consumes about 160 gallons per capita per day. Assuming about 2.9 people per household, this translates into about 14,113 gallons consumed per month.
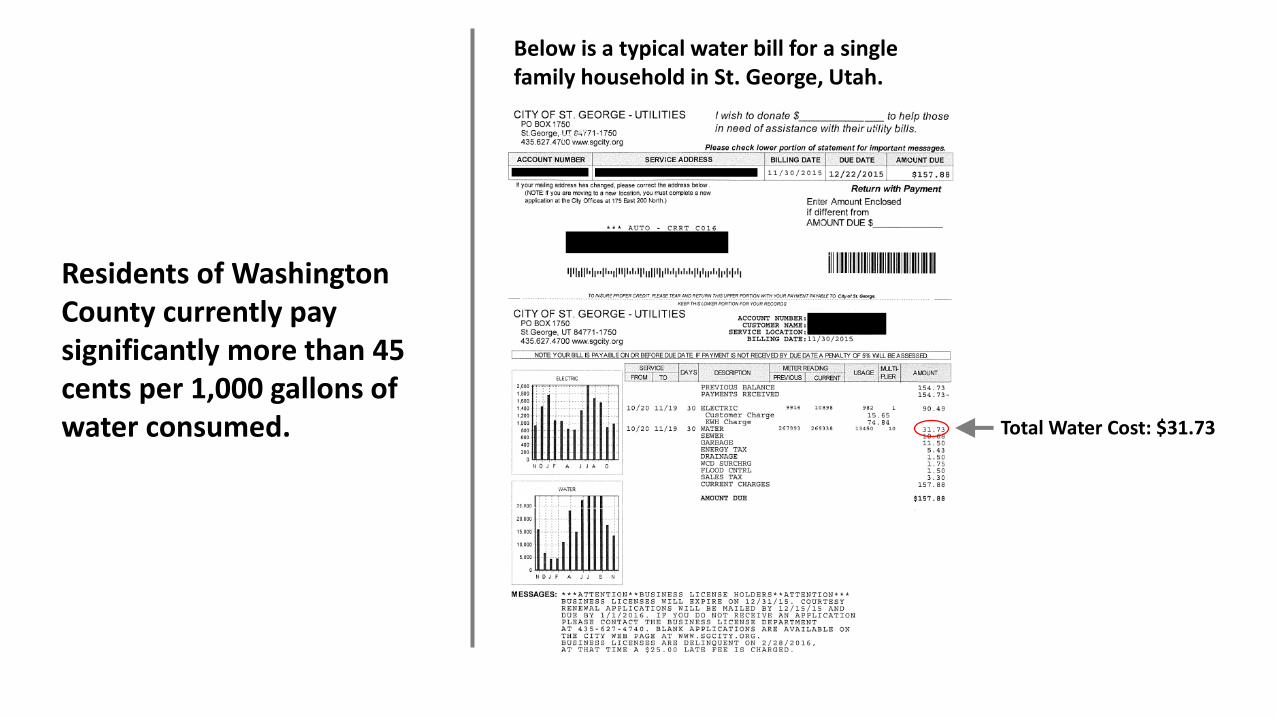
Residents of Washington County currently pay significantly more than 45 cents per 1,000 gallons of water consumed.
Below is a typical water bill for a single family household in St. George, Utah.
Total Water Cost: $31.73
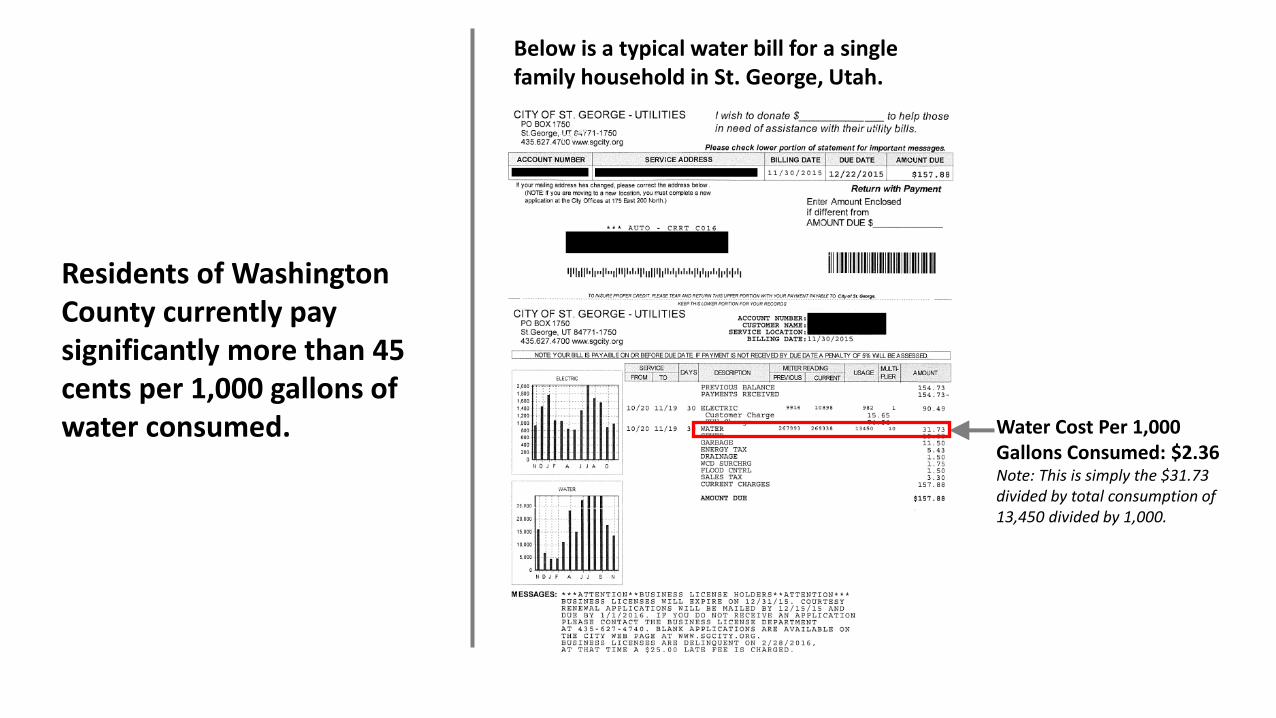
Residents of Washington County currently pay significantly more than 45 cents per 1,000 gallons of water consumed.
Below is a typical water bill for a single family household in St. George, Utah.
Water Cost Per 1,000 Gallons Consumed: $2.36Note: This is simply the $31.73 divided by total consumption of 13,450 divided by 1,000.
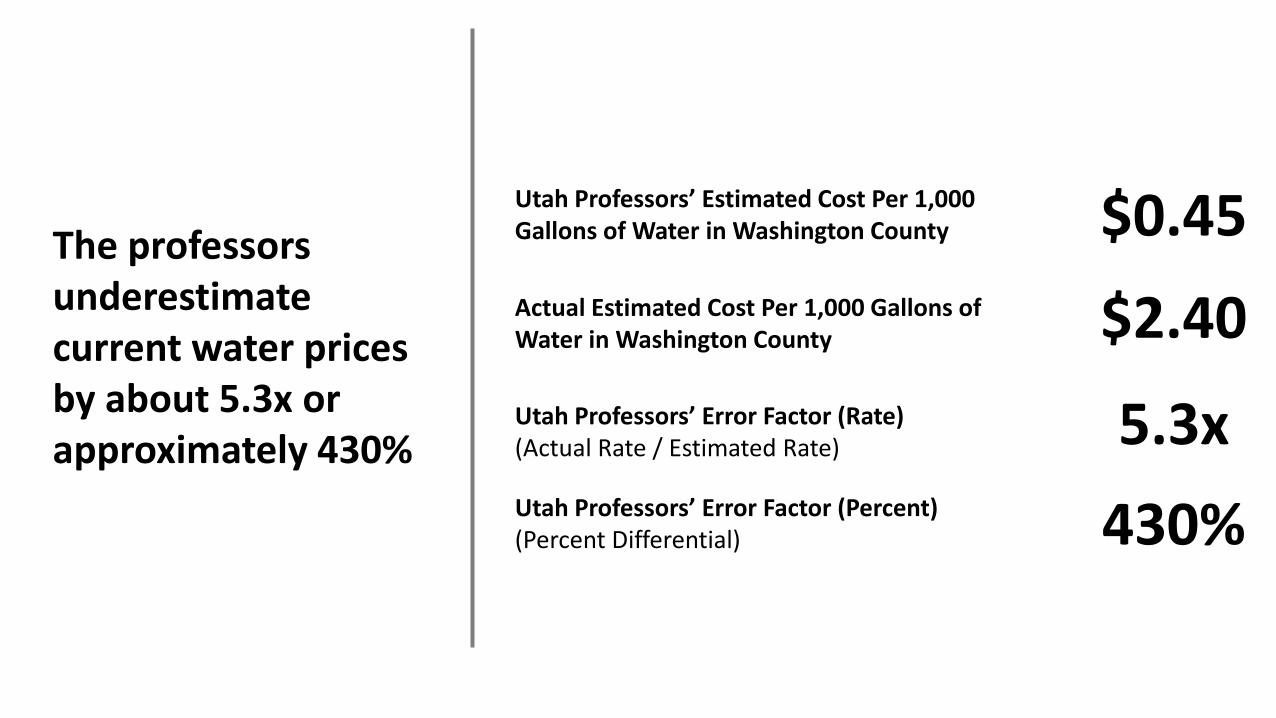
The professors underestimate current water prices by about 5.3x or approximately 430%
Utah Professors’ Estimated Cost Per 1,000 Gallons of Water in Washington County $0.45
Actual Estimated Cost Per 1,000 Gallons of Water in Washington County $2.40
Utah Professors’ Error Factor (Rate)(Actual Rate / Estimated Rate) 5.3xUtah Professors’ Error Factor (Percent)(Percent Differential) 430%

Why do the professors make this error?
The professors assume that 2013 water rate revenue reported by the Washington County Water Conservancy District is reflective of the price paid for all water consumed. It is not; they ignored revenue generated by local municipal utilities.
1Twenty two university professors drafted a letter to state lawmakers suggesting the Lake Powell Pipeline project is financially and economically infeasible.
2A cornerstone of the professors’ analysis is that the project will increase Washington County water rates so high that there will be little demand for the water generated by the project.
3The analysis uses an inaccurate price of water, understating the price actually paid by Washington County consumers by roughly 430 percent.
4The error relative to water price undermines their analysis regarding price and demand and invalidates the professors’ findings and conclusions.
5Applying the correct price of water results in pricing and demand consistent with actual conditions.
6Using the professors’ analysis with corrections for the pricing errors, the estimated water rate impacts of the Lake Powell Pipeline on a typical household would be more modest, increasing approximately 68 percent compared to their most recent estimate of “more than 570 percent.”*
*Analysis based on the professors’ September 2016 model. Please note that these estimates simply reflect the outcome when revising the assumptions in the professors’ model and do not reflect an expectation of actual impact or cost by the Washington County Water Conservancy District.
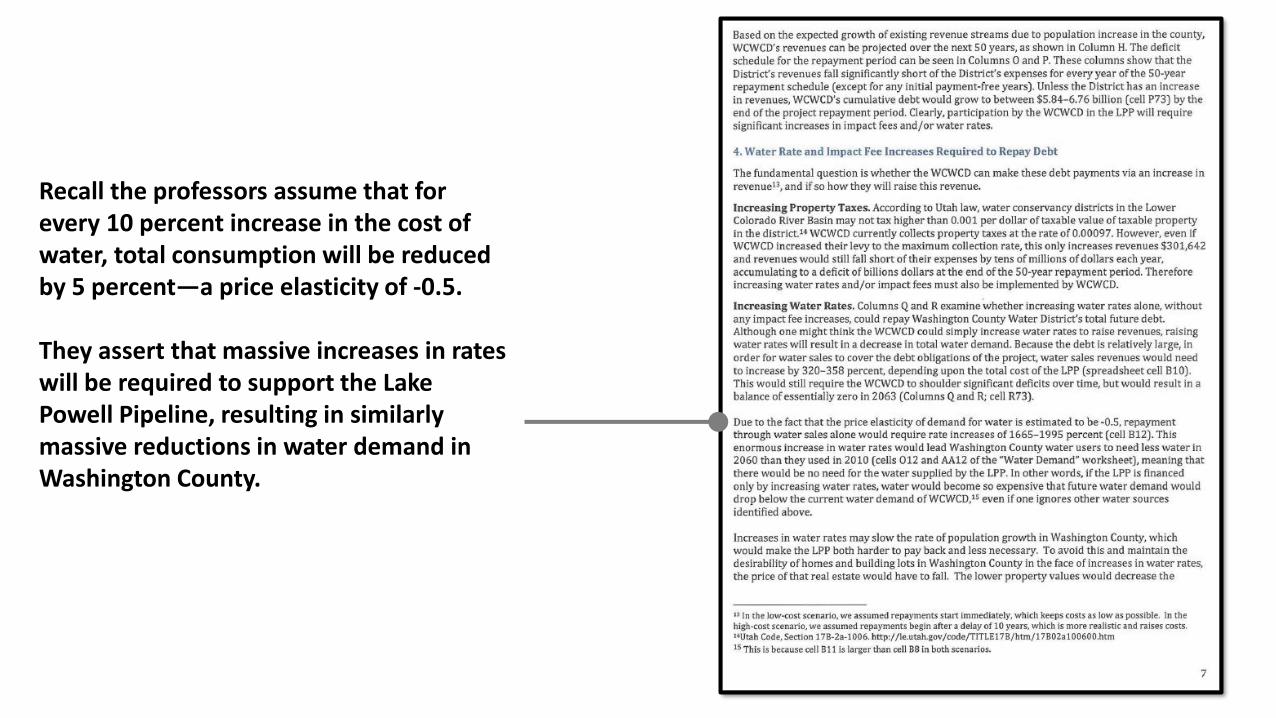
Recall the professors assume that for every 10 percent increase in the cost of water, total consumption will be reduced by 5 percent—a price elasticity of -0.5.
They assert that massive increases in rates will be required to support the Lake Powell Pipeline, resulting in similarly massive reductions in water demand in Washington County.

These claimed price increases are so large that the professors suggest that water consumption in Washington County would fall from roughly 280 gallons per capita per day in 2020 to as low as 61 gallons per capita per day with the Lake Powell Pipeline.
Professors’ Analysis of Current Conditions
Professors’ Analysis With Lake Powell Pipeline Scenarios

$0
$1
$2
$3
$4
$5
$6
$7
$8
$9
$10
- 5 10 15 20 25 30
Water Demand in Washington County, Utah
Gallons of Water Demanded in Washington County (in Billions)
Pri
ce o
f W
ate
r ($
/1,0
00
Gal
lon
s)
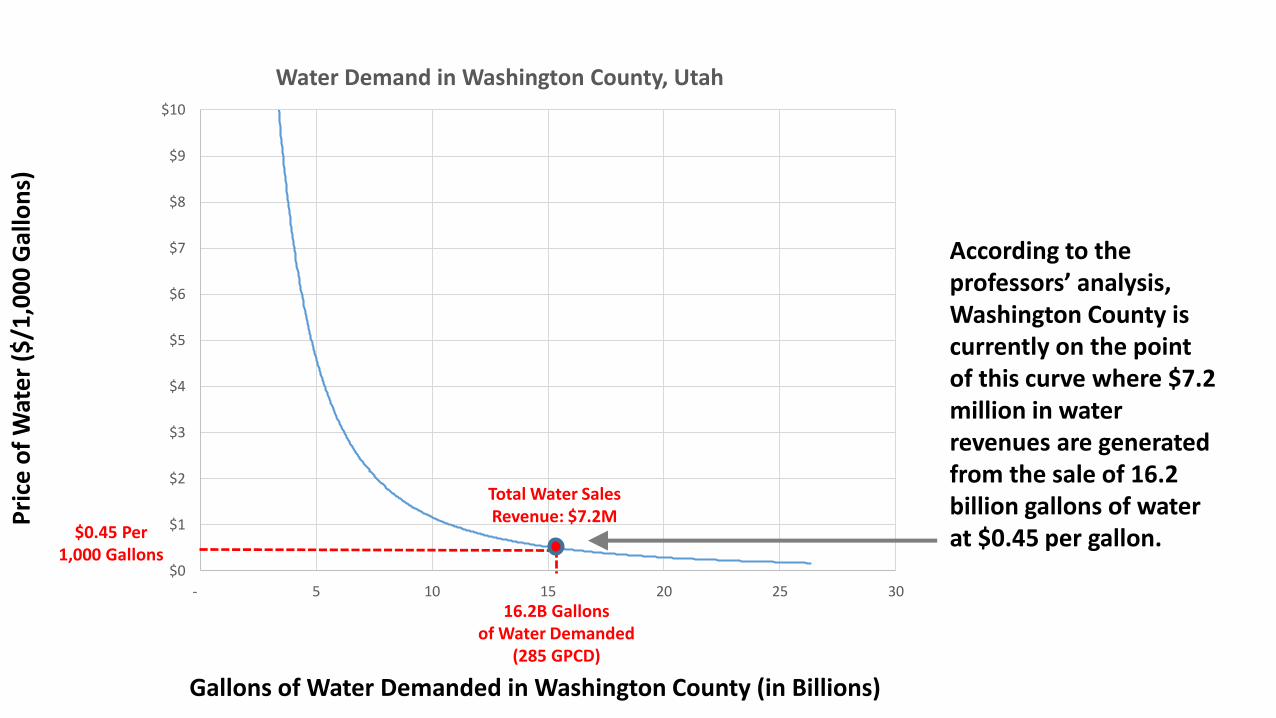
To explain this, the professors create a theoretical price elasticity curve indicating how much water would be demanded at each price point, assuming that every 10 percent increase in price would result in 5-percent decreases in the quantity of water demanded.
$0
$1
$2
$3
$4
$5
$6
$7
$8
$9
$10
- 5 10 15 20 25 30
Water Demand in Washington County, Utah
Gallons of Water Demanded in Washington County (in Billions)
Pri
ce o
f W
ate
r ($
/1,0
00
Gal
lon
s)
According to the professors’ analysis, Washington County is currently on the point of this curve where $7.2 million in water revenues are generated from the sale of 16.2 billion gallons of water at $0.45 per gallon.$0.45 Per
1,000 Gallons
16.2B Gallons of Water Demanded
(285 GPCD)
Total Water Sales Revenue: $7.2M
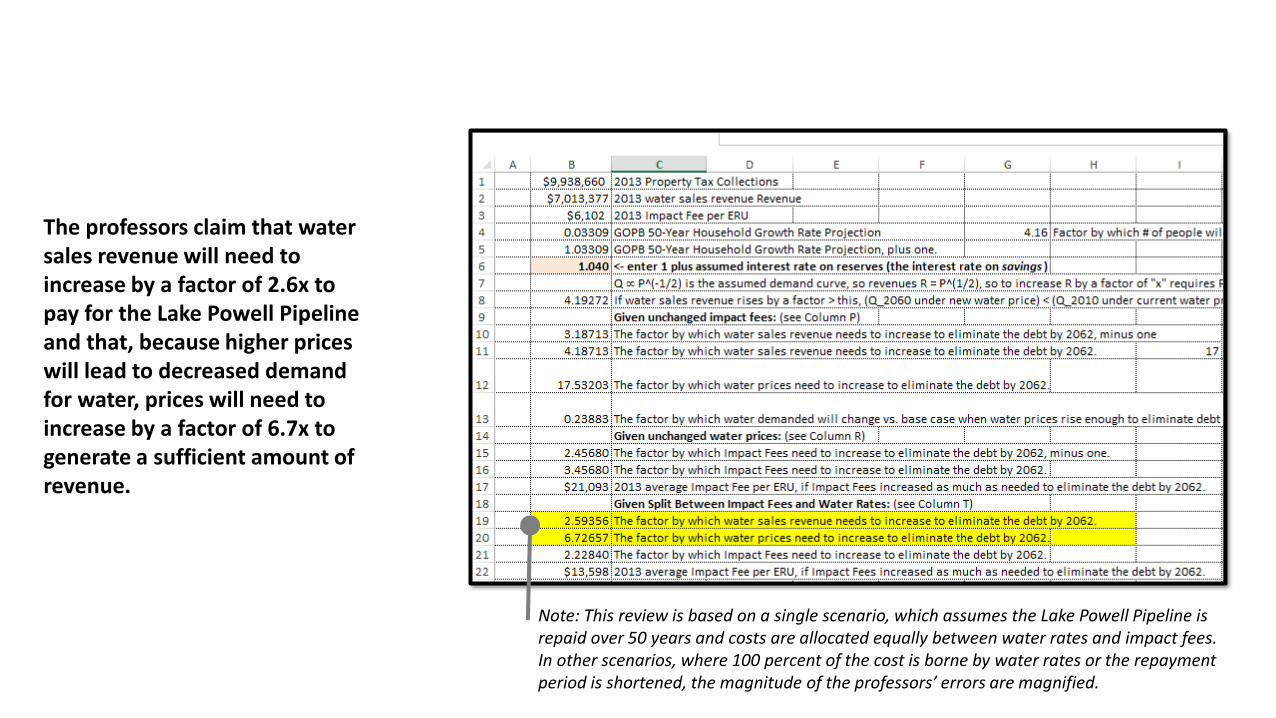
The professors claim that water sales revenue will need to increase by a factor of 2.6x to pay for the Lake Powell Pipeline and that, because higher prices will lead to decreased demand for water, prices will need to increase by a factor of 6.7x to generate a sufficient amount of revenue.
Note: This review is based on a single scenario, which assumes the Lake Powell Pipeline is repaid over 50 years and costs are allocated equally between water rates and impact fees. In other scenarios, where 100 percent of the cost is borne by water rates or the repayment period is shortened, the magnitude of the professors’ errors are magnified.

$0
$1
$2
$3
$4
$5
$6
$7
$8
$9
$10
- 5 10 15 20 25 30
Water Demand in Washington County, Utah
Under the professors’ analysis, water rates increase by a factor of 6.7x, or from the inaccurately assumed $0.45 per to $3.02 per 1,000 gallons. This, in turn, reduces total water demanded from 16.2 billion to 6.2 billion, resulting in a 61.5-percent decrease in per capita water use in Washington County. Because this reduction in water use would be impractical to achieve, the professors conclude that the Lake Powell Pipeline is infeasible.
Gallons of Water Demanded in Washington County (in Billions)
Pri
ce o
f W
ate
r ($
/1,0
00
Gal
lon
s)
$0.45 Per 1,000 Gallons
16.2B Gallons of Water Demanded
(285 GPCD)
$3.02 Per 1,000 Gallons
6.2B Gallons of Water Demanded
(110 GCPD)
6.7xIncrease Total Water Sales
Revenue: $7.2M
Total Water Sales Revenue: $18.7M
2.6xIncrease
61.5%Decrease
1Twenty two university professors drafted a letter to state lawmakers suggesting the Lake Powell Pipeline project is financially and economically infeasible.
2A cornerstone of the professors’ analysis is that the project will increase Washington County water rates so high that there will be little demand for the water generated by the project.
3The analysis uses an inaccurate price of water, understating the price actually paid by Washington County consumers by roughly 430 percent.
4The error relative to water price undermines their analysis regarding price and demand and invalidates the professors’ findings and conclusions.
5Applying the correct price of water results in pricing and demand consistent with actual conditions.
6Using the professors’ analysis with corrections for the pricing errors, the estimated water rate impacts of the Lake Powell Pipeline on a typical household would be more modest, increasing approximately 68 percent compared to their most recent estimate of “more than 570 percent.”*
*Analysis based on the professors’ September 2016 model. Please note that these estimates simply reflect the outcome when revising the assumptions in the professors’ model and do not reflect an expectation of actual impact or cost by the Washington County Water Conservancy District.
$0
$1
$2
$3
$4
$5
$6
$7
$8
$9
$10
- 5 10 15 20 25 30
Water Demand in Washington County, Utah
Gallons of Water Demanded in Washington County (in Billions)
Pri
ce o
f W
ate
r ($
/1,0
00
Gal
lon
s)
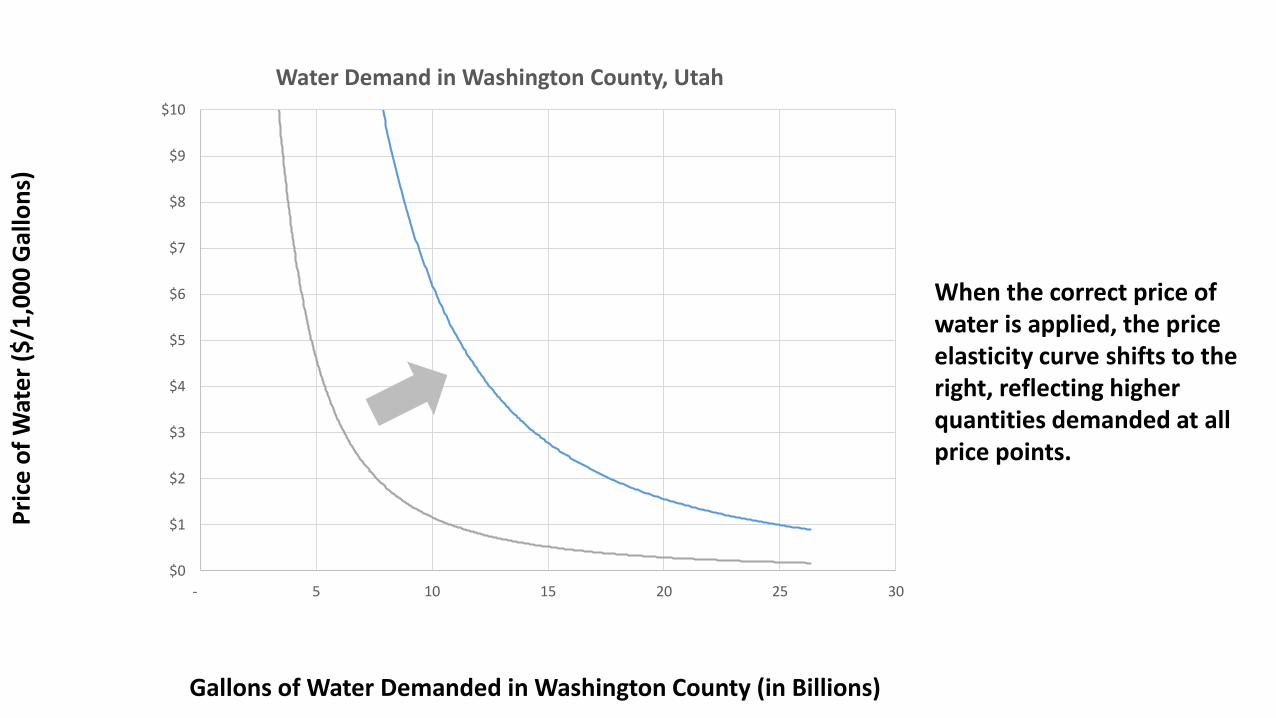
When the correct price of water is applied, the price elasticity curve shifts to the right, reflecting higher quantities demanded at all price points.

$0
$1
$2
$3
$4
$5
$6
$7
$8
$9
$10
- 5 10 15 20 25 30
Water Demand in Washington County, Utah
Gallons of Water Demanded in Washington County (in Billions)
Pri
ce o
f W
ate
r ($
/1,0
00
Gal
lon
s)
Using the correct price of water in Washington County, the total water demanded, as estimated by the professors, generates approximately $38.8 million per year as compared to $7.2 million, a revenue increase of 433 percent.
16.2B Gallons of Water Demanded
(285 GPCD)
$0.45 Per 1,000 Gallons
$2.40 Per 1,000 Gallons
Total Water Sales Revenue: $38.8M
Total Water Sales Revenue: $7.2M
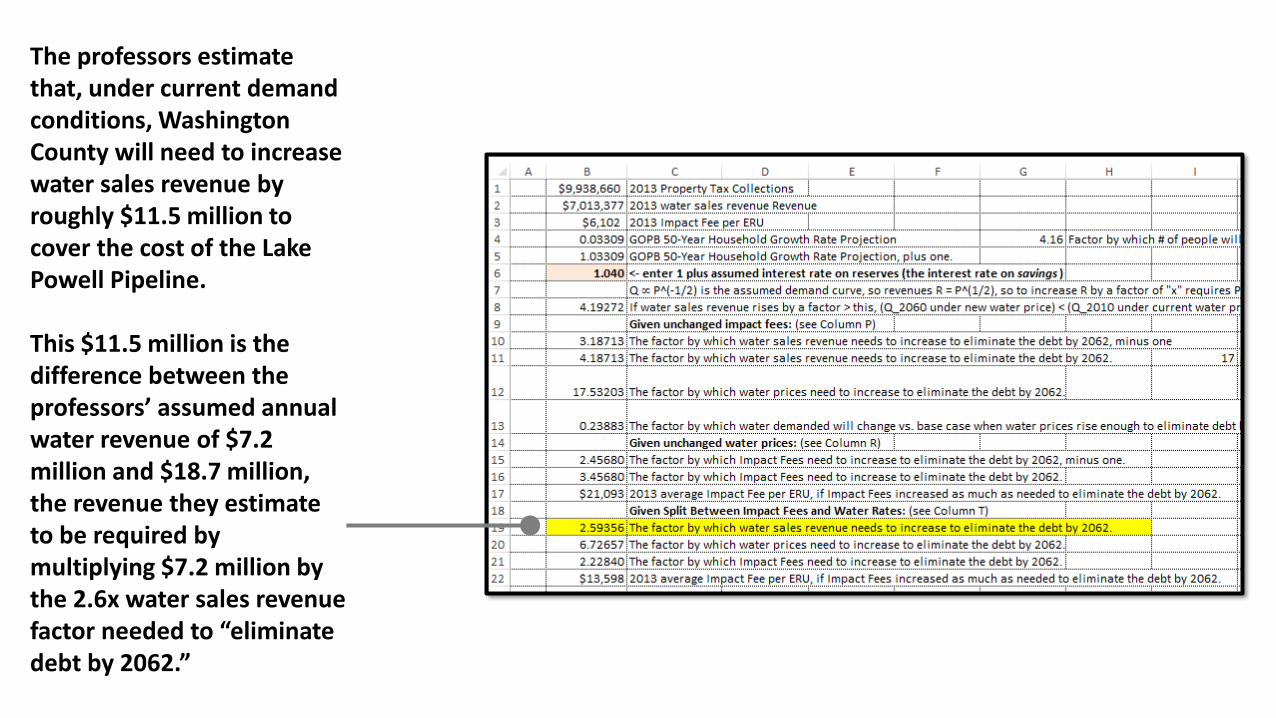
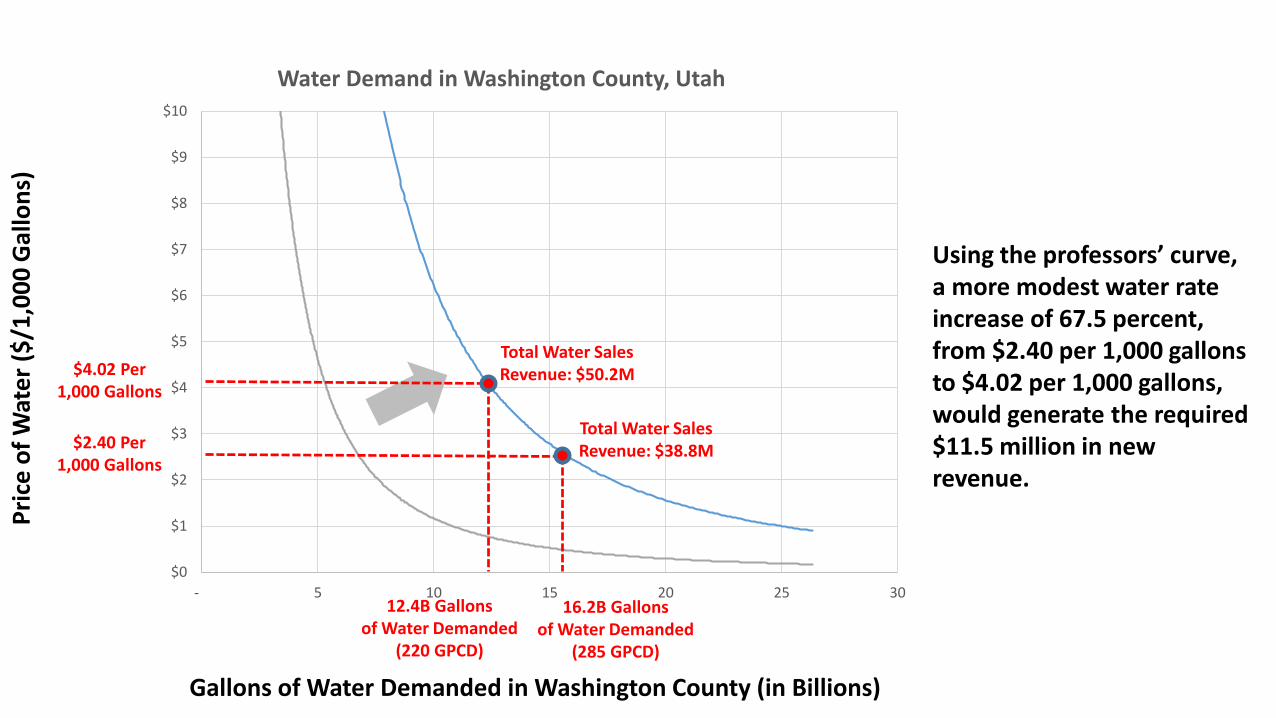
The professors estimate that, under current demand conditions, Washington County will need to increase water sales revenue by roughly $11.5 million to cover the cost of the Lake Powell Pipeline.
This $11.5 million is the difference between the professors’ assumed annual water revenue of $7.2 million and $18.7 million, the revenue they estimate to be required by multiplying $7.2 million by the 2.6x water sales revenue factor needed to “eliminate debt by 2062.”
$0
$1
$2
$3
$4
$5
$6
$7
$8
$9
$10
- 5 10 15 20 25 30
Water Demand in Washington County, Utah
Gallons of Water Demanded in Washington County (in Billions)
Pri
ce o
f W
ate
r ($
/1,0
00
Gal
lon
s)
Using the professors’ curve, a more modest water rate increase of 67.5 percent, from $2.40 per 1,000 gallons to $4.02 per 1,000 gallons, would generate the required $11.5 million in new revenue.
16.2B Gallons of Water Demanded
(285 GPCD)
$2.40 Per 1,000 Gallons
Total Water Sales Revenue: $38.8M
Total Water Sales Revenue: $50.2M$4.02 Per
1,000 Gallons
12.4B Gallons of Water Demanded
(220 GPCD)
$0
$1
$2
$3
$4
$5
$6
$7
$8
$9
$10
- 5 10 15 20 25 30
Water Demand in Washington County, Utah
Gallons of Water Demanded in Washington County (in Billions)
Pri
ce o
f W
ate
r ($
/1,0
00
Gal
lon
s)
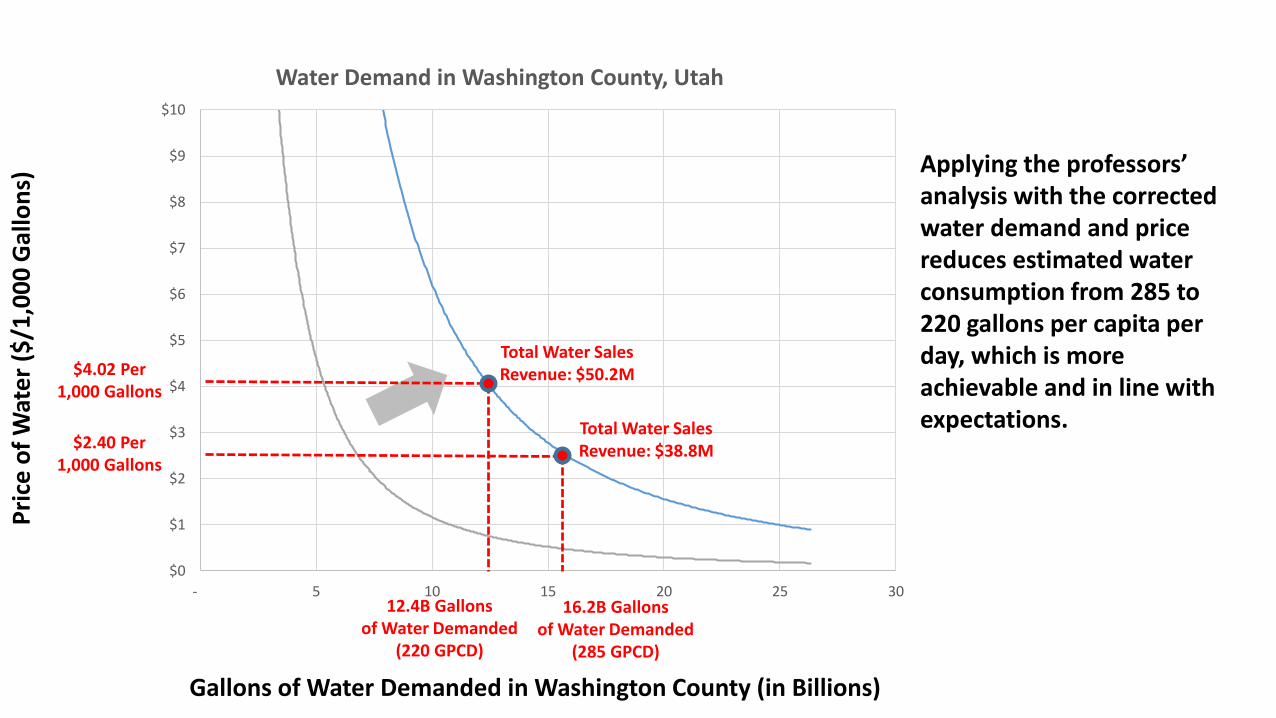
Applying the professors’ analysis with the corrected water demand and price reduces estimated water consumption from 285 to 220 gallons per capita per day, which is more achievable and in line with expectations.
$2.40 Per 1,000 Gallons
Total Water Sales Revenue: $38.8M
Total Water Sales Revenue: $50.2M$4.02 Per
1,000 Gallons
16.2B Gallons of Water Demanded
(285 GPCD)
12.4B Gallons of Water Demanded
(220 GPCD)

1Twenty two university professors drafted a letter to state lawmakers suggesting the Lake Powell Pipeline project is financially and economically infeasible.
2A cornerstone of the professors’ analysis is that the project will increase Washington County water rates so high that there will be little demand for the water generated by the project.
3The analysis uses an inaccurate price of water, understating the price actually paid by Washington County consumers by roughly 430 percent.
4The error relative to water price undermines their analysis regarding price and demand and invalidates the professors’ findings and conclusions.
5Applying the correct price of water results in pricing and demand consistent with actual conditions.
6Using the professors’ analysis with corrections for the pricing errors, the estimated water rate impacts of the Lake Powell Pipeline on a typical household would be more modest, increasing approximately 68 percent compared to their most recent estimate of “more than 570 percent.”*
*Analysis based on the professors’ September 2016 model. Please note that these estimates simply reflect the outcome when revising the assumptions in the professors’ model and do not reflect an expectation of actual impact or cost by the Washington County Water Conservancy District.
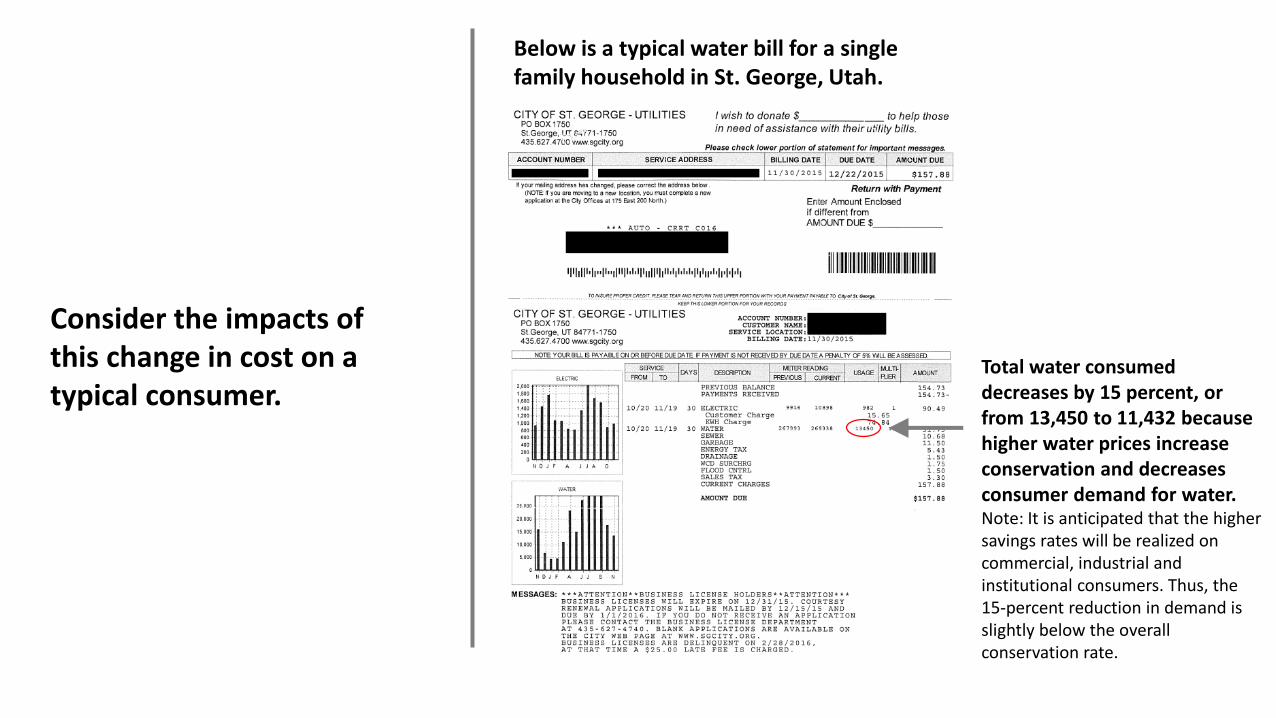
Consider the impacts of this change in cost on a typical consumer.
Below is a typical water bill for a single family household in St. George, Utah.
Total water consumed decreases by 15 percent, or from 13,450 to 11,432 because higher water prices increase conservation and decreases consumer demand for water.Note: It is anticipated that the higher savings rates will be realized on commercial, industrial and institutional consumers. Thus, the 15-percent reduction in demand is slightly below the overall conservation rate.
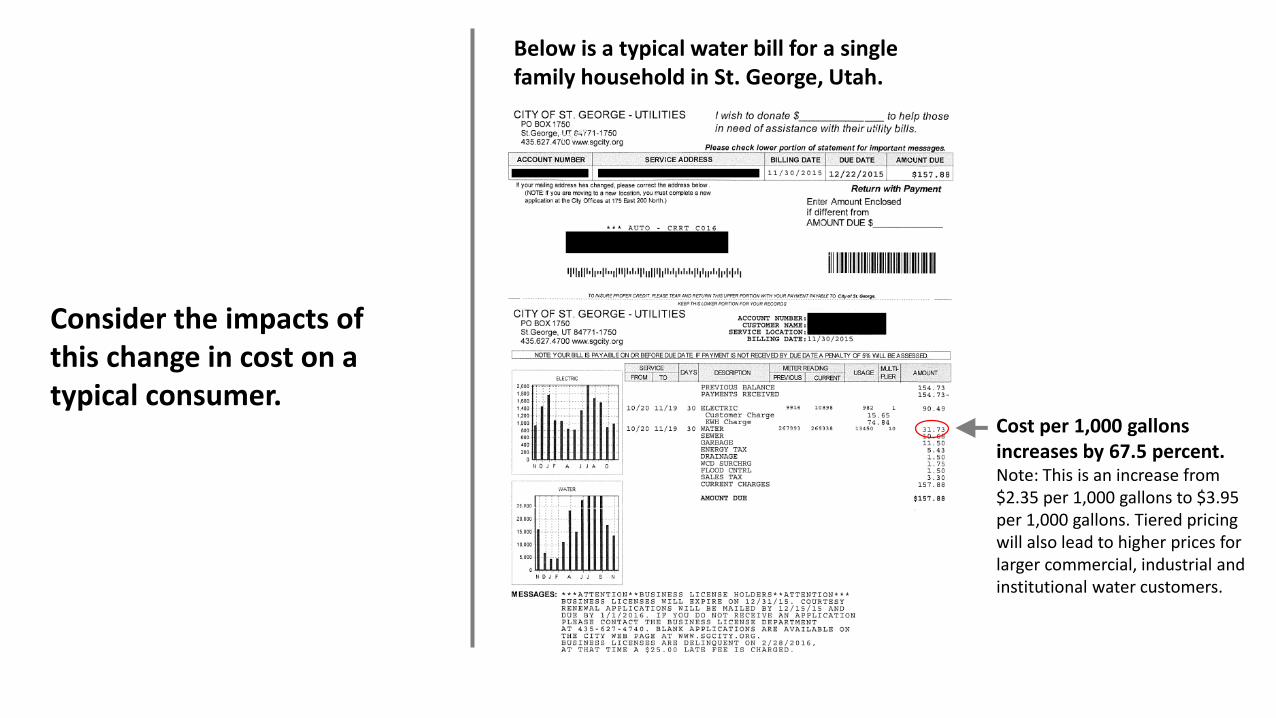
Consider the impacts of this change in cost on a typical consumer.
Below is a typical water bill for a single family household in St. George, Utah.
Cost per 1,000 gallons increases by 67.5 percent.Note: This is an increase from $2.35 per 1,000 gallons to $3.95 per 1,000 gallons. Tiered pricing will also lead to higher prices for larger commercial, industrial and institutional water customers.
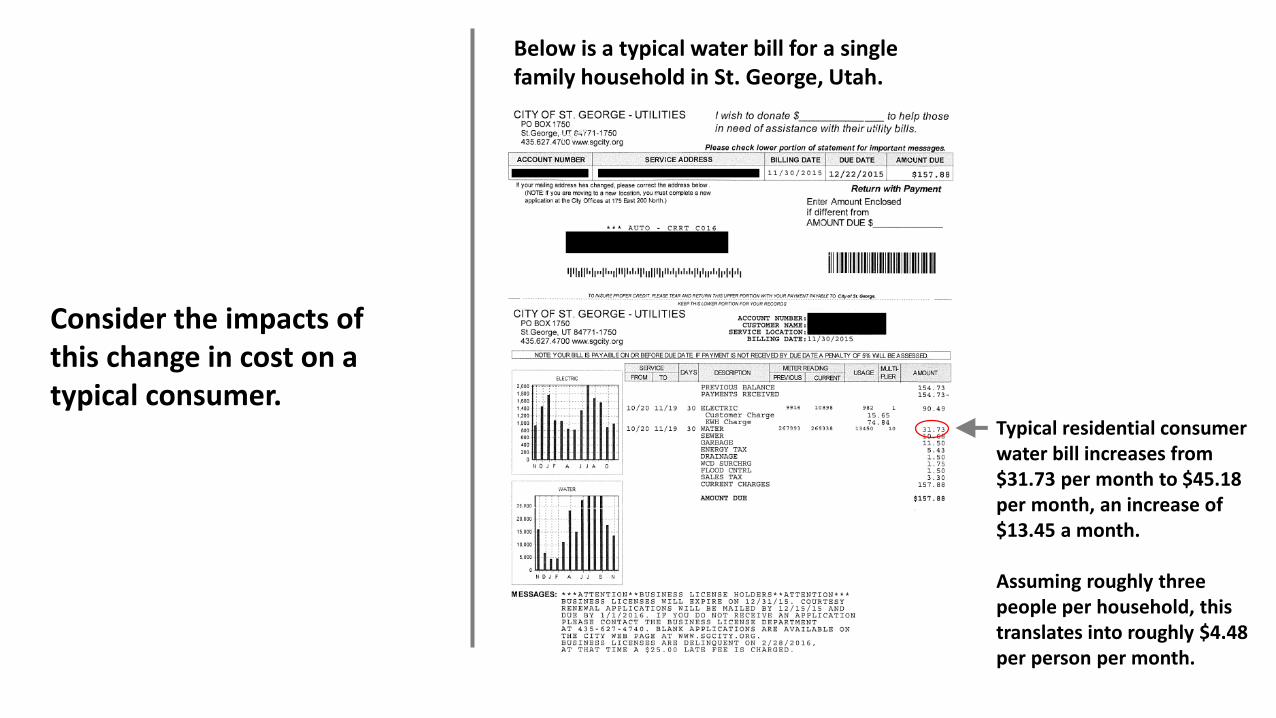
Below is a typical water bill for a single family household in St. George, Utah.
Typical residential consumer water bill increases from $31.73 per month to $45.18 per month, an increase of $13.45 a month.
Assuming roughly three people per household, this translates into roughly $4.48 per person per month.
Consider the impacts of this change in cost on a typical consumer.