the relationship between polycyclic aromatic hydrocarbon...
TRANSCRIPT

MNRAS 448, 168–187 (2015) doi:10.1093/mnras/stu2715
The relationship between polycyclic aromatic hydrocarbon emission andfar-infrared dust emission from NGC 2403 and M83
A. G. Jones,1‹ G. J. Bendo,1,2 M. Baes,3 M. Boquien,4 A. Boselli,4 I. De Looze,3
J. Fritz,3 F. Galliano,5 T. M. Hughes,3 V. Lebouteiller,5 N. Lu,6 S. C. Madden,5
A. Remy-Ruyer,7,5 M. W. L. Smith,8 L. Spinoglio9 and A. A. Zijlstra1
1Jodrell Bank Centre for Astrophysics, School of Physics and Astronomy, University of Manchester, Oxford Road, Manchester M13 9PL, UK2UK ALMA Regional Centre Node3Sterrenkundig Observatorium, Universiteit Gent, Krijgslaan 281 S9, B-9000 Gent, Belgium4Aix-Marseille Universite, CNRS, LAM (Laboratoire d’Astrophysique de Marseille) UMR 7326, F-13388 Marseille, France5Laboratoire AIM, CEA, Universite Paris Diderot, IRFU/Service d’Astrophysique, Bat. 709, F-91191 Gif-sur-Yvette, France6NHSC/IPAC, 100-22 Caltech, Pasadena, CA 91125, USA7Institut d’Astrophysique Spatiale, CNRS, UMR 8617, F-91405 Orsay, France8School of Physics and Astronomy, Cardiff University, Queens Buildings, The Parade, Cardiff CF24 3AA, UK9Istituto di Fisica dello Spazio Interplanetario, INAF, Via Fosso del Cavaliere 100, I-00133 Roma, Italy
Accepted 2014 December 17. Received 2014 November 13; in original form 2014 June 2
ABSTRACTWe examine the relation between polycyclic aromatic hydrocarbon (PAH) emission at 8 µmand far-infrared emission from hot dust grains at 24 µm and from large dust grains at 160and 250 µm in the nearby spiral galaxies NGC 2403 and M83 using data from the SpitzerSpace Telescope and Herschel Space Observatory. We find that the PAH emission in NGC2403 is better correlated with emission at 250 µm from dust heated by the diffuse interstellarradiation field (ISRF) and that the 8/250-µm surface brightness ratio is well correlated withthe stellar surface brightness as measured at 3.6 µm. This implies that the PAHs in NGC 2403are intermixed with cold large dust grains in the diffuse interstellar medium (ISM) and thatthe PAHs are excited by the diffuse ISRF. In M83, the PAH emission appears more stronglycorrelated with 160 µm emission originating from large dust grains heated by star-formingregions. However, the PAH emission in M83 is low where the 24-µm emission peaks withinstar-forming regions, and enhancements in the 8/160-µm surface brightness ratios appearoffset relative to the dust and the star-forming regions within the spiral arms. This suggeststhat the PAHs observed in the 8 µm band are not excited locally within star-forming regionsbut either by light escaping non-axisymmetrically from star-forming regions or locally byyoung, non-photoionizing stars that have migrated downstream from the spiral density waves.The results from just these two galaxies show that PAHs may be excited by different stellarpopulations in different spiral galaxies.
Key words: galaxies: individual: M83 – galaxies: individual: NGC 2403 – galaxies: ISM –galaxies: spiral – infrared: galaxies.
1 IN T RO D U C T I O N
Polycyclic aromatic hydrocarbons (PAHs) are large carbonmolecules that can be thought of as transitional between the gaseousand solid phases of the interstellar medium (ISM). They are com-monly identified as the source of emission for multiple broad emis-sion features in the mid-infrared, including those at 3.3, 6.2, 7.7,11.3, 12.7 µm (Tielens 2008). While these complex molecules can
�E-mail: [email protected]
be excited by optical and infrared photons (Li & Draine 2002),excitation by ultraviolet photons is more efficient (Tielens 2008).
Many authors have sought to calibrate PAH emission as an ex-tragalactic star formation tracer, mainly because it is relativelyunaffected by dust extinction and because PAHs emit at shorterwavelengths than hot dust and can therefore be imaged with betterangular resolutions. While early analyses with the Infrared SpaceObservatory (ISO; Kessler et al. 1996) found some evidence fora relation between PAH emission and other star formation tracers(Roussel et al. 2001; Forster Schreiber et al. 2004), later work,including work with the Spitzer Space Telescope (Werner et al.
C© 2015 The AuthorsPublished by Oxford University Press on behalf of the Royal Astronomical Society
at California Institute of T
echnology on April 2, 2015
http://mnras.oxfordjournals.org/
Dow
nloaded from

PAH and FIR emission from NGC 2403 and M83 169
2004), demonstrated that the PAH emission was actually poorlycorrelated with other star formation tracers. PAH emission appearedsuppressed relative to other star formation tracers in star-formingregions or overluminous in diffuse regions (Boselli, Lequeux &Gavazzi 2004; Helou et al. 2004; Calzetti et al. 2005; Prescott et al.2007; Bendo et al. 2008). The ratio of PAH to hot dust continuumemission was also found to decrease as metallicity decreased (En-gelbracht et al. 2005, 2008; Madden et al. 2006; Calzetti et al. 2007;Galliano et al. 2008; Gordon et al. 2008; Galametz et al. 2013). Thecommon explanations are either that low-metallicity regions con-tain fewer PAHs or that the PAHs are exposed to and destroyedby harder ultraviolet radiation in low-metallicity environments withless dust attenuation. None the less, globally-integrated PAH emis-sion has been shown to be correlated with other globally-integratedstar formation tracers, and methods have been developed for calcu-lating extinction-corrected star formation rates using a combinationof Hα and PAH emission in the 8-µm Spitzer band (Zhu et al.2008; Kennicutt et al. 2009), although Calzetti et al. (2007) warnthat even global measurements could be affected by metallicityeffects.
In contrast, a few authors have found that PAH emission was as-sociated with emission at > 100 µm that will primarily trace � 30 Klarge dust grains. One of the first groups to draw attention to thiswas Haas, Klaas & Bianchi (2002), who demonstrated that PAHemission was better correlated with 850 µm emission from colddust than 15 µm emission from hot dust, although this analysis waslimited to regions with high-infrared surface brightnesses. The ISO-based analysis by Boselli et al. (2004) also implied that PAHs wereassociated with diffuse dust rather than star-forming regions. Laterwork by Bendo et al. (2006, 2008) demonstrated that the PAH emis-sion showed a strong correlation with 160 µm emission and that the8/160-µm surface brightness ratio was dependent upon the 160 µmsurface brightness. These results combined with the breakdown inthe relation between the PAH and hot dust emission implied that thePAHs were primarily associated with dust in the diffuse ISM or incold molecular clouds near star-forming regions and that both thePAHs and the large dust grains were heated by the same radiationfield.
Data from the Herschel Space Observatory (Pilbratt et al. 2010)can be used to further study the relation between PAHs and largedust grains. The telescope is able to resolve emission at 160 and250 µm on <18 arcsec scales, which is a marked improvement incomparison to the 38 arcsec scales that could be resolved by Spitzerat 160 µm. Moreover, Bendo et al. (2010b, 2012a) and Boquienet al. (2011) have demonstrated that ≤160 and ≥250 µm emissionfrom nearby galaxies may originate from dust heated by differ-ent sources. The 70/160- and 160/250-µm surface brightness ratioswere typically correlated with star formation tracers such as ultravi-olet, Hα, and 24 µm emission and peaked in locations with strongstar formation, suggesting that the dust seen at ≤160 µm is primar-ily heated locally by star-forming regions. Meanwhile, the 250/350and 350/500 µm ratios were more strongly correlated with near-infrared emission and generally varied radially in the same wayas the emission from the total stellar population (including bothyoung, intermediate-aged, and evolved stars), demonstrating thatthe dust seen in these bands was primarily heated by the diffuse in-terstellar radiation field (ISRF) from these stars. PAH emission canbe compared to dust emission observed by Herschel to determinewhich of these two dust components are more closely associatedwith PAH emission, which would ultimately lead to a better un-derstanding of how the PAHs are excited and how they survive incertain environments in the ISM.
So far, the relation between PAH and dust emission has beeninvestigated using Herschel data for only two galaxies. Calapa et al.(2014) have shown that 8 µm emission from PAHs in M33 is wellcorrelated with 250 µm emission. They go on to further demonstratethe 8/250 µm ratio is correlated with the 3.6 µm band tracing thetotal stellar population, implying that the PAHs are excited by thediffuse ISRF. Lu et al. (2014) present an alternative analysis withM81 in which they divide the PAH emission into components heatedby two sources: a component heated by star-forming regions tracedby Hα emission and a component heated by the diffuse ISRF tracedby the cold dust emission at 500 µm emission. The results showthat most (∼85 per cent) of the 8 µm emission from diffuse regionsis associated with the cold dust emission, while in star-formingregions, most (∼60 per cent) of the 8 µm emission is excited byyoung stars.
The goal of this paper, which is a continuation of the work byJones (2013), is to further study the relationship between PAH emis-sion at 8 µm and far-infrared emission from large dust grains usingHerschel Space Observatory (Pilbratt et al. 2010) far-infrared im-ages of NGC 2403 and M83. These are two of the 14 nearby galaxieswithin the Very Nearby Galaxies Survey (VNGS; PI: C. Wilson),a Herschel-SPIRE Local Galaxies Guaranteed Time Program. TheVNGS was meant to sample galaxies with multiple morphologicaland active galactic nucleus types, and includes several well-studiedgalaxies including the Antennae Galaxies, Arp 220, Centaurus A,M51, and NGC 1068. These two specific galaxies were selectedbecause they are non-interacting nearby (<10 Mpc) spiral galaxieswith an inclination from face on ≤60◦ and major axes >10 arcmin.1
The basic properties of these galaxies are given in Table 1.NGC 2403 is an SAB(s)cd galaxy (de Vaucouleurs et al. 1991)
with no clear bulge and flocculent spiral structure (Elmegreen &Elmegreen 1987). Since the brightest star-forming regions are foundwell outside the centre of the galaxy, it is easy to differentiatebetween effects related to star-forming regions and either effectsrelated to the evolved stellar population (which peaks in the centreof the galaxy) or effects tied to galactocentric radius. This has beenexploited previously to illustrate how PAH emission is inhibitedrelative to hot dust emission in star-forming regions (Bendo et al.2008) and to differentiate between different heating sources for thedust seen at 70–500 µm (Bendo et al. 2012a). M83 (NGC 5236)is an SAB(s)c galaxy (de Vaucouleurs et al. 1991) with a brightstarburst nucleus (Bohlin et al. 1983) and two strongly definedgrand-design spiral arms (Elmegreen, Chromey & Warren 1998).Since we can resolve the spiral structure with Herschel, we cancompare the properties of arm and interarm regions quite effectively.Both galaxies are at similar distances; we can resolve structuresof <400 pc in the Herschel data. Although both of these galaxiesare late-type spiral galaxies, they have the potential to yield differentinformation on how PAHs relate to the far-infrared emission fromlarge dust grains.
We focus our analysis on the Spitzer 24 µm data, which traceemission from very small grains and hot dust heated locally bystar-forming regions, and Herschel 160 and 250 µm data, whichtrace emission from large dust grains. The prior analysis by Bendoet al. (2008) had shown an association between the 8 and 160 µmemission, but as stated above, the 160 µm band may contain signifi-cant emission from large dust grains heated by star-forming regions,while the 250 µm band, at least for NGC 2403 and M83, originates
1 M81 is also in the VNGS, but the analysis of PAH emission from thatgalaxy is covered by Lu et al. (2014).
MNRAS 448, 168–187 (2015)
at California Institute of T
echnology on April 2, 2015
http://mnras.oxfordjournals.org/
Dow
nloaded from
170 A. G. Jones et al.
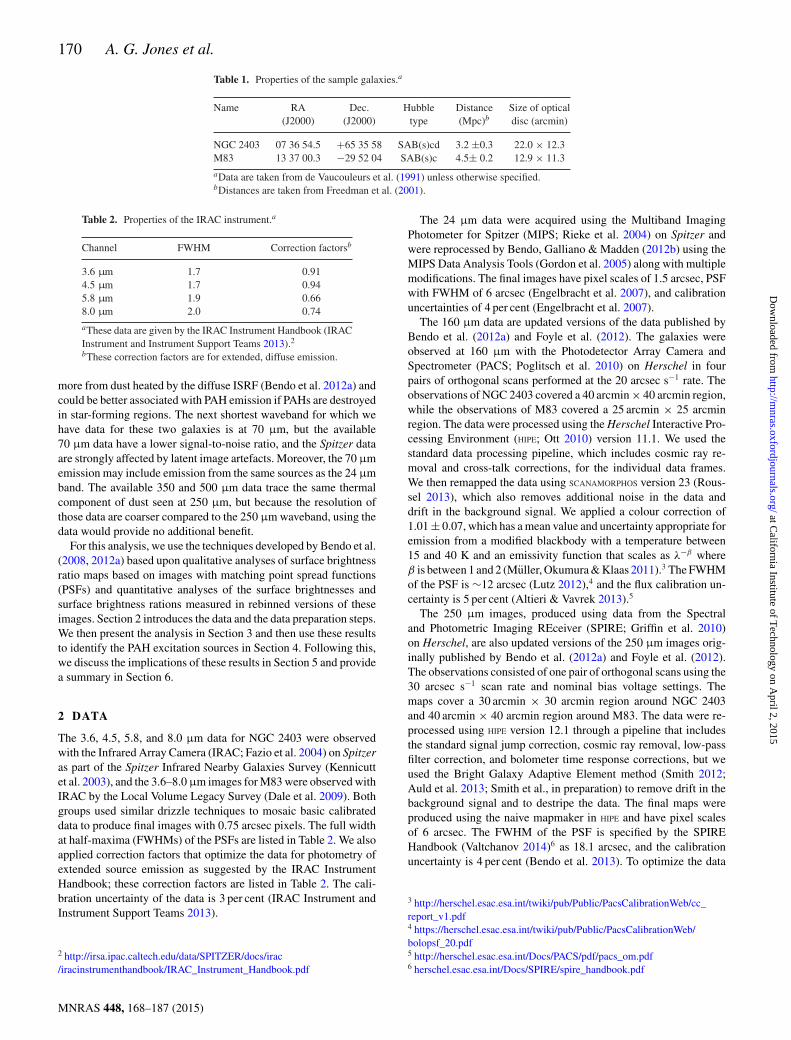
Table 1. Properties of the sample galaxies.a
Name RA Dec. Hubble Distance Size of optical(J2000) (J2000) type (Mpc)b disc (arcmin)
NGC 2403 07 36 54.5 +65 35 58 SAB(s)cd 3.2 ±0.3 22.0 × 12.3M83 13 37 00.3 −29 52 04 SAB(s)c 4.5± 0.2 12.9 × 11.3
aData are taken from de Vaucouleurs et al. (1991) unless otherwise specified.bDistances are taken from Freedman et al. (2001).
Table 2. Properties of the IRAC instrument.a
Channel FWHM Correction factorsb
3.6 µm 1.7 0.914.5 µm 1.7 0.945.8 µm 1.9 0.668.0 µm 2.0 0.74
aThese data are given by the IRAC Instrument Handbook (IRACInstrument and Instrument Support Teams 2013).2bThese correction factors are for extended, diffuse emission.
more from dust heated by the diffuse ISRF (Bendo et al. 2012a) andcould be better associated with PAH emission if PAHs are destroyedin star-forming regions. The next shortest waveband for which wehave data for these two galaxies is at 70 µm, but the available70 µm data have a lower signal-to-noise ratio, and the Spitzer dataare strongly affected by latent image artefacts. Moreover, the 70 µmemission may include emission from the same sources as the 24 µmband. The available 350 and 500 µm data trace the same thermalcomponent of dust seen at 250 µm, but because the resolution ofthose data are coarser compared to the 250 µm waveband, using thedata would provide no additional benefit.
For this analysis, we use the techniques developed by Bendo et al.(2008, 2012a) based upon qualitative analyses of surface brightnessratio maps based on images with matching point spread functions(PSFs) and quantitative analyses of the surface brightnesses andsurface brightness rations measured in rebinned versions of theseimages. Section 2 introduces the data and the data preparation steps.We then present the analysis in Section 3 and then use these resultsto identify the PAH excitation sources in Section 4. Following this,we discuss the implications of these results in Section 5 and providea summary in Section 6.
2 DATA
The 3.6, 4.5, 5.8, and 8.0 µm data for NGC 2403 were observedwith the Infrared Array Camera (IRAC; Fazio et al. 2004) on Spitzeras part of the Spitzer Infrared Nearby Galaxies Survey (Kennicuttet al. 2003), and the 3.6–8.0 µm images for M83 were observed withIRAC by the Local Volume Legacy Survey (Dale et al. 2009). Bothgroups used similar drizzle techniques to mosaic basic calibrateddata to produce final images with 0.75 arcsec pixels. The full widthat half-maxima (FWHMs) of the PSFs are listed in Table 2. We alsoapplied correction factors that optimize the data for photometry ofextended source emission as suggested by the IRAC InstrumentHandbook; these correction factors are listed in Table 2. The cali-bration uncertainty of the data is 3 per cent (IRAC Instrument andInstrument Support Teams 2013).
2 http://irsa.ipac.caltech.edu/data/SPITZER/docs/irac/iracinstrumenthandbook/IRAC_Instrument_Handbook.pdf
The 24 µm data were acquired using the Multiband ImagingPhotometer for Spitzer (MIPS; Rieke et al. 2004) on Spitzer andwere reprocessed by Bendo, Galliano & Madden (2012b) using theMIPS Data Analysis Tools (Gordon et al. 2005) along with multiplemodifications. The final images have pixel scales of 1.5 arcsec, PSFwith FWHM of 6 arcsec (Engelbracht et al. 2007), and calibrationuncertainties of 4 per cent (Engelbracht et al. 2007).
The 160 µm data are updated versions of the data published byBendo et al. (2012a) and Foyle et al. (2012). The galaxies wereobserved at 160 µm with the Photodetector Array Camera andSpectrometer (PACS; Poglitsch et al. 2010) on Herschel in fourpairs of orthogonal scans performed at the 20 arcsec s−1 rate. Theobservations of NGC 2403 covered a 40 arcmin × 40 arcmin region,while the observations of M83 covered a 25 arcmin × 25 arcminregion. The data were processed using the Herschel Interactive Pro-cessing Environment (HIPE; Ott 2010) version 11.1. We used thestandard data processing pipeline, which includes cosmic ray re-moval and cross-talk corrections, for the individual data frames.We then remapped the data using SCANAMORPHOS version 23 (Rous-sel 2013), which also removes additional noise in the data anddrift in the background signal. We applied a colour correction of1.01 ± 0.07, which has a mean value and uncertainty appropriate foremission from a modified blackbody with a temperature between15 and 40 K and an emissivity function that scales as λ−β whereβ is between 1 and 2 (Muller, Okumura & Klaas 2011).3 The FWHMof the PSF is ∼12 arcsec (Lutz 2012),4 and the flux calibration un-certainty is 5 per cent (Altieri & Vavrek 2013).5
The 250 µm images, produced using data from the Spectraland Photometric Imaging REceiver (SPIRE; Griffin et al. 2010)on Herschel, are also updated versions of the 250 µm images orig-inally published by Bendo et al. (2012a) and Foyle et al. (2012).The observations consisted of one pair of orthogonal scans using the30 arcsec s−1 scan rate and nominal bias voltage settings. Themaps cover a 30 arcmin × 30 arcmin region around NGC 2403and 40 arcmin × 40 arcmin region around M83. The data were re-processed using HIPE version 12.1 through a pipeline that includesthe standard signal jump correction, cosmic ray removal, low-passfilter correction, and bolometer time response corrections, but weused the Bright Galaxy Adaptive Element method (Smith 2012;Auld et al. 2013; Smith et al., in preparation) to remove drift in thebackground signal and to destripe the data. The final maps wereproduced using the naive mapmaker in HIPE and have pixel scalesof 6 arcsec. The FWHM of the PSF is specified by the SPIREHandbook (Valtchanov 2014)6 as 18.1 arcsec, and the calibrationuncertainty is 4 per cent (Bendo et al. 2013). To optimize the data
3 http://herschel.esac.esa.int/twiki/pub/Public/PacsCalibrationWeb/cc_report_v1.pdf4 https://herschel.esac.esa.int/twiki/pub/Public/PacsCalibrationWeb/bolopsf_20.pdf5 http://herschel.esac.esa.int/Docs/PACS/pdf/pacs_om.pdf6 herschel.esac.esa.int/Docs/SPIRE/spire_handbook.pdf
MNRAS 448, 168–187 (2015)
at California Institute of T
echnology on April 2, 2015
http://mnras.oxfordjournals.org/
Dow
nloaded from

PAH and FIR emission from NGC 2403 and M83 171
Table 3. Properties of and corrections for the Hα images.
Galaxy NGC 2403 M83
Source Boselli & Gavazzi (2002) Meurer et al. (2006)Pixel scale (arcsec pixel−1) 0.69 0.43PSF FWHM (arcsec) 3 1.6Calibration uncertainty 5 per cent 4 per centForeground extinction (AR) 0.87 0.144[N II] / Hα ratio 0.28 ± 0.05a 0.40 ± 0.13b
aBoth the 6548 and 6583 Å [N II] lines fall within the band covered by the Hα filter used in theNGC 2403 observations. This number represents the ratio of emission from both lines to Hα
emission measured in the radial strip data from Moustakas et al. (2010).bThe Hα filter used in the M83 observations includes emission from only the [N II] 6583 Åline. This ratio is based on the ratio of only that line to Hα emission and is calculated usingdata from Boissier et al. (2005).
for extended source photometry, we multiplied the data by the pointsource to extended source conversion factor of 91.289 MJy sr−1
(Jy beam−1)−1 (Valtchanov 2014) and then applied a colour correc-tion of 0.997 ± 0.029, which should be appropriate for a modifiedblackbody with a temperature between 10 and 40 K and a β between1.5 and 2 (Valtchanov 2014).
For a discussion on the spiral density waves in M83 in Section 4.2,we also included 0.23 µm data from the Galaxy Evolution Explorer(Martin et al. 2005) produced by Dale et al. (2009, see also Lee et al.2011). The images have pixel scales of 1.5 arcsec, PSF FWHMof ∼6 arcsec (Martin et al. 2005), and calibration uncertaintiesof <1 per cent (Morrissey et al. 2007). We applied a foregroundextinction correction based on A0.23 µm = 0.56 given by Lee et al.(2011) based on the Cardelli, Clayton & Mathis (1989) extinctionlaw with RV = 3.1.
For measuring quantitative star formation rates (so that we couldidentify locations that are strongly influenced by star formation us-ing quantitative criteria), we included Hα data for these two galaxiesin our analysis. The Hα image for NGC 2403 was originally pro-duced by Boselli & Gavazzi (2002) using data from the 1.20-mNewton Telescope at the Observatoire de Haute Provence. The Hα
image for M83 was produced by Meurer et al. (2006) using ob-servations from the Cerro Tololo 1.5-m Telescope taken as part ofthe Survey for Ionization in Neutral Gas Galaxies. We applied ex-tinction corrections for dust attenuation within the Milky Way usingcalculations performed by the NASA/IPAC Extragalactic Database7
based on data from Schlegel, Finkbeiner & Davis (1998), and wealso use data from the literature to correct for [N II] emission fallingwithin the wavebands covered by the Hα filters. Details on the dataare given in Table 3.
2.1 Data preparation
To study the relation of PAH emission to far-infrared emission fromlarge dust grains, we perform analyses using maps in which thePSFs have been matched to the PSF of the 250 µm data (with aFWHM of 18 arcsec), and we plot data from images with matchingPSFs that have been resampled into 18 arcsec bins that representindividual resolution elements within the maps. The data from thesebins should be statistically independent. See Bendo et al. (2008,2012a) for additional discussion on this topic.
In the first step of preparing the data, foreground stars wereidentified by eye and removed from the Hα, 3.6, 4.5, 5.8, 8, and
7 http://ned.ipac.caltech.edu/
24 µm data; these were typically sources that appeared unresolvedand that had 3.6/24-µm flux density ratios �10. Next, the datawere convolved with kernels from Aniano et al. (2011)8 to matchthe PSFs of the Hα, 3.6, 4.5, 5.8, 8, 24, and 160 µm data to the18 arcsec PSF of the 250 µm data. This was done to preservethe colour variations across the data when it was rebinned, and iteliminated the need to perform additional aperture corrections. Themedian background was then measured outside of the optical discof each galaxy in each waveband and subtracted from the data.For the qualitative map-based analyses, the 3.6–8 µm images wereshifted to match the world coordinate systems of the 24, 160, and250 µm maps so that we could create 8/24-, 8/160-, and 8/250-µmsurface brightness ratio maps; the pixel size of each ratio map is setto the pixel size of the image for the longer wavelength data usedin the ratios. For the analyses on binned data and for producingthe profiles in Section 4.2, the images were all shifted to matchthe world coordinate system of the 250 µm data and then rebinnedinto 18 arcsec pixels to match the size of the PSF of the 250 µmdata. The rebinning was done so that the centre of each galaxy waslocated at the centre of an 18 arcsec bin.
The emission observed in the 4.5–24 µm bands contains stellarcontinuum emission. We remove this stellar emission by subtractinga rescaled version of the IRAC 3.6 µm image (e.g. Helou et al. 2004;Marble et al. 2010; Ciesla et al. 2014). The IRAC 3.6 µm band issuitable for this step because it generally contains unobscured stel-lar emission (Lu et al. 2003). While hot dust emission may produce3.6 µm emission (Mentuch et al. 2009; Mentuch, Abraham & Zibetti2010) and while emission from PAHs at 3.3 µm also falls withinthe IRAC 3.6 µm band, the comparison of 3.6 µm emission toH-band emission by Bendo et al. (2014) suggests that, on the spa-tial scales of our data, local enhancements in hot dust and 3.3 µmPAH emission have a very minor effect on the total 3.6 µm emission.The continuum subtraction equations derived by Helou et al. (2004)were based on using an earlier version of STARBURST99 (Leithereret al. 1999) to simulate the infrared stellar spectral energy distri-bution (SED) of a stellar population with a Salpeter initial massfunction (IMF; Salpeter 1955) and two different metallicities. Fromthis analysis, Helou et al. derived mean 3.6/8 and 3.6/24-µm stellarsurface brightness ratios that could be used to rescale the 3.6 µmemission and subtract it from the 8, 4.5, 5.8, and 24 µm data. We
8 Available from http://www.astro.princeton.edu/~ganiano/Kernels.html.Note that the kernels are created using circularised versions of instrumentalPSFs. In the case of the IRAC data, the circularized PSFs have FWHMranging from 1.9 to 2.8 arcsec, which is larger than the original PSFs.
MNRAS 448, 168–187 (2015)
at California Institute of T
echnology on April 2, 2015
http://mnras.oxfordjournals.org/
Dow
nloaded from

172 A. G. Jones et al.
re-derived these values using a newer version of STARBURST99 (ver-sion 6.0.3) to simulate a solar metallicity stellar population with aKroupa IMF (Kroupa 2001), which is now becoming more popularto use than the Salpeter IMF. We also examined the differences re-sulting from using both the Geneva and Padova stellar evolutionarytracks and found that the selection of one set of tracks over the otherdid not significantly affect the results. From these tests, we derivethe following equations to subtract the stellar continuum from the4.5–24 µm data:
Iν(4.5 µm(SCS)) = Iν(4.5 µm) − (0.60 ± 0.02)Iν(3.6 µm) (1)
Iν(5.8 µm(SCS)) = Iν(5.8 µm) − (0.40 ± 0.03)Iν(3.6 µm) (2)
Iν(8 µm(SCS)) = Iν(8 µm) − (0.246 ± 0.015)Iν(3.6 µm) (3)
Iν(24 µm(SCS)) = Iν(24 µm) − (0.033 ± 0.003)Iν(3.6 µm). (4)
In these equations, ‘SCS’ stands for stellar continuum subtracted.The scaling terms are based on calculations performed at time in-tervals equally spaced in logarithm space between 107 and 1010 yr.The values of the scaling terms are based on the mean of the re-sults from using the Geneva and Padova tracks. The uncertaintiesare the greater of either the difference in the mean values mea-sured between the results for the two tracks or the larger of thestandard deviations measured in the scaling terms derived for theseparate tracks. Changing the metallicities to Z = 0.008 changedthe factors by � 1σ . The uncertainties in the coefficients translateto a � 1 per cent uncertainty in the corrected 8 and 24 µm maps,which is negligible compared to the calibration uncertainties. The4.5–8.0 µm coefficients derived here are typically within 1σ ofequivalent coefficients derived in other studies (e.g. Helou et al.2004; Marble et al. 2010; Ciesla et al. 2014). The coefficients forthe 24 µm data may disagree with coefficients from other papersby up to 0.012 or 4σ , although the values derived in these otherpapers differ among each other by 0.018. However, this correctionis so small for the 24 µm data (typically ∼1 per cent in NGC 2403and M83) that the relatively high disagreement among the valuesshould not have a major impact on our analysis or on other analysesrelying upon this type of stellar continuum subtraction.
The 8 µm band still contains continuum emission from veryhot grains. In most solar-metallicity galaxies, this continuum emis-sion may constitute ∼20 per cent of the total stellar-continuum-subtracted 8 µm emission (e.g. Smith et al. 2007), although inlocations with very weak PAH emission, such as star-forming re-gions or metal-poor dwarf galaxies, a much higher percentage ofthe 8 µm emission may be thermal continuum emission (e.g. Engel-bracht et al. 2005, 2008; Cannon et al. 2006; Gordon et al. 2008).To remove the excess dust continuum emission, we use the follow-ing equation derived in an empirical analysis of photometric andspectroscopic data by Marble et al. (2010):9
Iν(8 µm(PAH)) = (Iν(8 µm(SCS))
− (0.091 + .314Iν(8 µm)/Iν(24 µm))
× (Iν(4.5 µm(SCS)) + Iν(5.8 µm(SCS)))0.718
× Iν(24 µm(SCS))0.282). (5)
9 The equation given by Marble et al. (2010) also includes a term thatintegrates the emission in frequency and converts the data into units oferg s−1 cm−2. Since we are comparing the PAH emission in the 8 µm bandto continuum emission in other bands that is measured in Jy arcsec−2, it iseasier to keep the 8 µm data in units of Jy arcsec−2, so we do not includethe unit conversion term in this equation.
When this equation is applied to our data, the 8 µm surface bright-nesses typically decrease by 15–20 per cent. Based on the analysisfrom Marble et al. (2010), the percentage difference between the8 µm PAH fluxes calculated using this equation and the fluxes of thespectral features measured spectroscopically is 6 per cent. Through-out the rest of this paper, when we refer to 8 µm emission, we arereferring to the 8 µm emission calculated using equation (5).
For the binned analysis, we wanted to illustrate which bins weremore strongly influenced by emission from star-forming regionsand which regions tend to trace emission from dust predominantlyheated by evolved stars. To do this, we created specific star for-mation rate (SSFR) maps. We first applied an intrinsic extinctioncorrection to the Hα intensities (measured in erg cm−2 s−1 arcsec−2)using
I (Hα (corrected)) = I (Hα (observed))
+ 2.0 × 10⁻²⁵(12.5 THz)Iν(24 µm)
×(
erg cm−2 s−1
Jy
), (6)
which is a variant of the correction equation given by Kennicutt et al.(2009). Since 24 µm emission has been shown to be associatedwith Hα emission and other star formation tracers (e.g. Calzettiet al. 2005, 2007; Prescott et al. 2007; Bendo et al. 2014), it isthe best band to use when correcting Hα emission for intrinsic dustextinction. The 24 µm band may also contain emission from diffusedust heated by the radiation field from evolved stars (Kennicuttet al. 2009), which we would expect to affect low surface brightnessregions in these galaxies, so low star formation rates derived usingequation (6) should be treated cautiously.
After converting the corrected Hα intensities to units oferg s−1 pc−2 (written as L(Hα)/A, with A representing the areaper pixel in pc2), we used
�(SFR) = 7.9 × 10−42
(L(Hα)
A
) (erg s−1
M� yr−1
)(7)
from Kennicutt (1998) to calculate star formation rate surface den-sities �(SFR). To produce maps of the total stellar surface massdensity �(M�), we used
�(M�) = 105.65
(Iν(3.6 µm)2.85Iν(4.5 µm)−1.85
A
)
×(
D
0.05
)2 (M� arcsec2
Jy Mpc2 pc2
)(8)
based on the equation from Eskew, Zaritsky & Meidt (2012). In thisequation, is the angular area of the bin in the map, and D distanceto the source. We then divided �(SFR) by �(M�) to calculate theSSFR.
3 A NA LY S I S O F 8 / 2 4 , 8 / 1 6 0 , A N D 8 / 2 5 0 µMR AT I O S
3.1 Map-based analysis
Figs 1 and 2 show the 3.6, 8, 24, 160, and 250 µm images used in theanalysis (before the application of the convolution or rebinning stepsdescribed in Section 2.1). Figs 3 and 4 show the 8/24, 8/160, and8/250-µm surface brightness ratios of the data after the convolutionstep but before rebinning. The 8, 24, 160, and 250 µm images alllook very similar, demonstrating that the PAHs, hot dust, and colddust are found in the same large-scale structures. However, the ratio
MNRAS 448, 168–187 (2015)
at California Institute of T
echnology on April 2, 2015
http://mnras.oxfordjournals.org/
Dow
nloaded from

PAH and FIR emission from NGC 2403 and M83 173
Figure 1. The 21 arcmin × 18 arcmin images of NGC 2403 used in the analysis. North is up and east is to the left in each image. The 3.6 µm maps tracethe intermediate-age and older stars. The 8 µm image mainly shows the PAH 7.7 µm emission feature but may also contain small amounts of emission fromhot dust and stellar sources. The 24 µm band traces emission from hot (100 K) dust, and the 160 and 250 µm trace emission from colder (15–30 K) dust. TheFWHM for each image is shown as a green circle in the lower-left corner of each panel, and the light blue ellipse in the 3.6 µm image outlines the optical discof the galaxy.
maps demonstrate how the PAH emission varies with respect to thedust traced by the other infrared bands. For comparison to thesefigures, we also show maps of the SSFR in Fig. 5.
In both galaxies, we see a decrease in the 8/24 µm ratio inlocations where the 24 µm emission peaks. If the PAH emissionwas tracing star formation in the same way as the hot dust emission,we would see little variation across the 8/24 µm ratio maps. Thedisparity indicates either that the 24 µm emission is enhanced inregions with high SSFR, that the PAH emission is inhibited wherethe hot dust emission peaks in the centres of regions with highSSFR, or that both effects occur within the star-forming regions. InNGC 2403, we see the 8/24 µm ratio is higher in the diffuse regionsoutside the regions with high SSFR, particularly in the southern halfof the galaxy. In M83, we see the enhancement of PAHs relativeto the 24 µm emission in not only the interarm regions but alsobetween high-SSFR regions in the spiral arms. The 8/24 µm ratiois also very low in the starburst nucleus of M83, as is also seen byWu et al. (2014).
The 8/160 and 8/250 µm ratio maps for NGC 2403 and M83present different results for each galaxy. In NGC 2403, the 8/160and 8/250 µm ratios peak near the centre and decrease with radius,although the 8/160 µm map looks more noisy than the 8/250 µmmap. Instead of seeing the PAH emission decrease relative to thecold dust emission in individual regions with high SSFR, as was thecase in the 8/24 µm ratio maps, we see the PAH emission enhancedrelative to the 160 and 250 µm emission at the location of theinfrared-brightest star-forming region in the north-east side of thedisc. The 8/160 and 8/250 µm ratios generally do not change sig-nificantly near most other star-forming regions. With the exception
of the infrared-brightest star-forming region, the radial gradients inthe 8/160 and 8/250 µm ratios look similar to the radial gradientsin the 3.6 µm image seen in Fig. 1. In NGC 2403, Bendo et al.(2012a) found that the 160/250-µm surface brightness ratios werecorrelated with Hα emission and peaked in locations with strongstar formation, while the 250/350 µm ratios were more strongly cor-related with near-infrared emission and generally varied radially inthe same way as the older stellar populations. These results demon-strated that the 160 µm emission is dominated by dust heated locallyin star-forming regions but the dust seen at 250 µm is heated bythe diffuse ISRF. The similarity between the 8/160, 8/250, 250/350,and 3.6 µm radial gradients suggests that the PAHs are intermixedwith the cold large dust grains and that the enhancement of PAHemission relative to the large dust grains depends on the surfacebrightness of the evolved stellar population. If this is the case, the8/160 µm map may looks noisy compared to the 8/250 µm mapbecause emission in the 8 and 160 µm bands is affected by differentstellar populations while emission in the 8 and 250 µm bands isaffected by mainly the evolved stellar population.
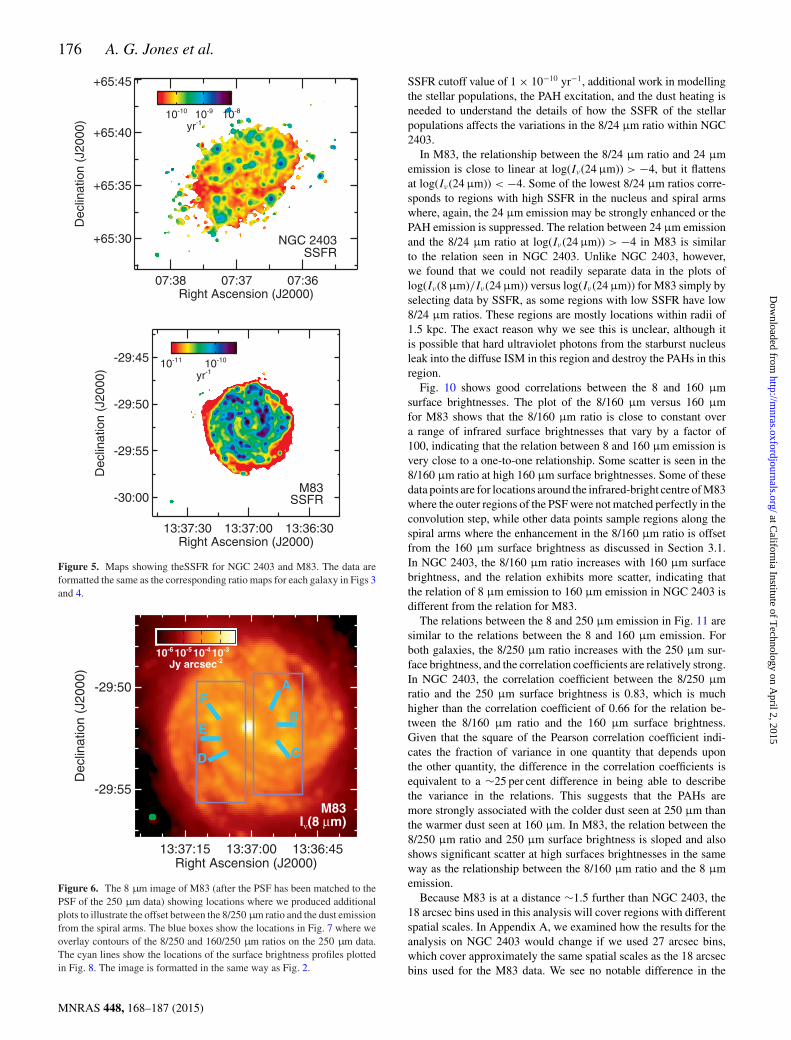
In the 8/160 and 8/250 µm ratio maps of M83 in Fig. 4, we seelarge filament-like structures outside the emission from the dustlanes traced by the 250 µm band. To illustrate this offset, we firstshow contour maps of the 8/250 µm ratio overlaid on the 250 µmmaps. We also measured profiles of the 0.23 µm (GALEX near-ultraviolet), 8 µm, 24 µm, 160 µm, and 250 µm emission (in datamatched to the PSF of the 250 µm data) as well as the 8/24, 8/250,and 160/250 µm across both spiral arms in three locations alongeach spiral arm. We show the position of the profiles and thensubregions where we map the offsets in Fig. 6, the maps showing
MNRAS 448, 168–187 (2015)
at California Institute of T
echnology on April 2, 2015
http://mnras.oxfordjournals.org/
Dow
nloaded from

174 A. G. Jones et al.
Figure 2. The 20 arcmin × 20 arcmin images of M83 used in the analysis. See Fig. 1 for additional information on the image format.
the offsets between the 8/250 µm ratio and the 250 µm surfacebrightness in Fig. 7, and the surface brightness profiles in Fig. 8.
The dust emission for the different wavebands peak in slightlydifferent places in these profiles of the M83’s spiral arms. The250 µm emission, which trace most of the dust mass in the spiralarms, peak on the downstream (or inner) side of the spiral arm. Theprofile of the 24 µm emission tends to appear narrower and peaks0–7 arcsec further towards the upstream (or outer) side of the spiralarms (although this is small relative to the 18 arcsec resolution of thedata used to create these plots). This is consistent with the classicaldescription of star formation within spiral arms (e.g. Roberts 1969;Elmegreen 1979). First the gas flows into the spiral arms, then thegas is shocked by the spiral density waves and collapses into stars,and finally young stars emerge on the upstream side of the spiralarms.
The 8 µm emission peaks slightly further downstream from the250 µm emission, and the profiles of the 8 µm emission on thedownstream side of the spiral arms is broader than the profiles onthe upstream side. This is particularly pronounced for profiles A,C, and F. While the 8/24 µm ratio drops sharply near the star-forming regions as expected, the 8/250 µm ratio peak 10–30 arcsec(or ∼200–650 pc) downstream from the dust lane, as is also seenin the contour overlays in Fig. 7. This demonstrates that the PAHsemission is enhanced relative to the cold dust on the downstreamside of the spiral arms well outside the dust lanes. The ultravioletemission also peaks downstream from the 250 µm emission in manyof these profiles and that the profiles of the ultraviolet emission in Band C look broader on the downstream side. The possible connection
of these profiles to the ultraviolet emission and to the 160/250 µmratios is discussed further in Section 4.2.
The offset enhancements in PAH emission in the arms of M83could appear because of astrometry problems, but we have checkedthe astrometry among the images using foreground and backgroundsources outside the optical disc of the galaxy and found no signifi-cant offsets greater than ∼1 arcsec in the sources between images.It is also possible that the broader PAH emission could result fromissues related to the PSF matching step, but usually these typesof artefacts will appear symmetric around bright sources, whereasthe enhanced PAH emission appears asymmetric. It is more likelythat the phenomenon is real and has been difficult to detect beforebecause of limitations in the angular resolution of far-infrared data.
3.2 Analysis of binned data
In Figs 9–11, we plot the relations between the PAH emissionat 8 µm and either the hot dust emission at 24 µm or the colddust emission at 160 and 250 µm. Pearson correlation coefficientsfor these relations are given in Table 4. To first order, the 8 µmsurface brightness is well correlated with the 24, 160, and 250 µmsurface brightnesses. However, the 8/24, 8/160, and 8/250 µm ratiosreveal the presence of both scatter in the relations between the8 µm emission and emission in other bands as well as systematicvariations in these relations.
The variations in the 8/24 µm ratio in Fig. 9 show that the 8/24 µmratio decreases in areas where the 24 µm emission is strongest inboth galaxies. However, the relations between the 8/24 µm ratio and
MNRAS 448, 168–187 (2015)
at California Institute of T
echnology on April 2, 2015
http://mnras.oxfordjournals.org/
Dow
nloaded from

PAH and FIR emission from NGC 2403 and M83 175
Figure 3. The 8/24-, 8/160- and 8/250-µm surface brightness ratio mapsfor NGC 2403. These images are based on data where the PSFs are matchedto the PSF of the 250 µm data. The FWHM for the 250 µm PSF is shown bythe green circle in the lower-left corner of each panel. The colour scales inthe images have been adjusted to show the structure in the surface brightnessratios; some of the red or purple pixels may be outside the range of valuesshown in the colour bars. Data not detected at the 5σ level in either bandis left blank. The 8/24 µm ratio is low in star-forming regions where the24 µm emission is brightest. The 8/160 and 8/250 µm images are similar inthat the ratios generally decrease with radius. However, the 8/160 µm ratioshows more structure, while the 8/250 µm map is generally smoother.
the 24 µm emission differ somewhat between the two galaxies. InNGC 2403, we found that we could see different trends in the datawhen we separated the 18-arcsec binned data into two subsets wherethe SSFR was either ≥1 × 10⁻¹⁰ yr−1 or <1 × 10⁻¹⁰ yr−1. The datawith low SSFR follow a relation in which log(Iν(8µm)/Iν(24µm))increases slightly from ∼0.0 to ∼0.2 as log (Iν(24μm)) increasesfrom −6 to −4. The emission from these regions may originatemainly from locations in the diffuse ISM with relatively soft radia-tion fields where the PAH emission is well correlated with emissionfrom hot, diffuse dust heated by the diffuse ISRF. As both the PAHsand the hot, diffuse dust are stochastically heated, the ratio of PAHto hot dust emission is expected to be roughly constant. The slightdecrease in the 8/24 µm ratio as the diffuse 24 µm surface brightnessdecreases is potentially a result of an increase in the hardness of the
Figure 4. The 8/24-, 8/160- and 8/250-µm surface brightness ratio mapsfor M83. These images are based on data where the PSFs are matched tothe PSF of the 250 µm data. The maps are formatted in the same way as themaps in Fig. 3. We see spiral arm structure in all images. The arm structurein the 8/24 µm image is traced by a series of red point-like sources wherethe ratio decreases in star-forming regions. However, the filamentary spiralstructures in the 8/160 and 8/250 µm maps are locations offset from the 160and 250 µm emission in Fig. 2 where PAH emission is enhanced relative tocold dust emission.
radiation field as the 24 µm surface brightness decreases, possiblyas a result of changes in metallicity with radius as found by multipleauthors (e.g. Zaritsky, Kennicutt & Huchra 1994; Moustakas et al.2010), which could lead to either PAH emission being suppressedor 24 µm emission being enhanced. Data points tracing locationswith high SSFR fall below the relation between the 8/24 µm ratioand 24 µm surface brightness. These locations would be expected tohave harder radiation fields that may enhance the 24 µm emissionor suppress the PAH emission. While we are able to empiricallyseparate data into regions with high and low 8/24 µm ratios using a
MNRAS 448, 168–187 (2015)
at California Institute of T
echnology on April 2, 2015
http://mnras.oxfordjournals.org/
Dow
nloaded from
176 A. G. Jones et al.
Figure 5. Maps showing theSSFR for NGC 2403 and M83. The data areformatted the same as the corresponding ratio maps for each galaxy in Figs 3and 4.
Figure 6. The 8 µm image of M83 (after the PSF has been matched to thePSF of the 250 µm data) showing locations where we produced additionalplots to illustrate the offset between the 8/250 µm ratio and the dust emissionfrom the spiral arms. The blue boxes show the locations in Fig. 7 where weoverlay contours of the 8/250 and 160/250 µm ratios on the 250 µm data.The cyan lines show the locations of the surface brightness profiles plottedin Fig. 8. The image is formatted in the same way as Fig. 2.
SSFR cutoff value of 1 × 10⁻¹⁰ yr−1, additional work in modellingthe stellar populations, the PAH excitation, and the dust heating isneeded to understand the details of how the SSFR of the stellarpopulations affects the variations in the 8/24 µm ratio within NGC2403.
In M83, the relationship between the 8/24 µm ratio and 24 µmemission is close to linear at log(Iν(24 µm)) > −4, but it flattensat log(Iν(24 µm)) < −4. Some of the lowest 8/24 µm ratios corre-sponds to regions with high SSFR in the nucleus and spiral armswhere, again, the 24 µm emission may be strongly enhanced or thePAH emission is suppressed. The relation between 24 µm emissionand the 8/24 µm ratio at log(Iν(24 µm)) > −4 in M83 is similarto the relation seen in NGC 2403. Unlike NGC 2403, however,we found that we could not readily separate data in the plots oflog(Iν(8 µm)/Iν(24 µm)) versus log(Iν(24 µm)) for M83 simply byselecting data by SSFR, as some regions with low SSFR have low8/24 µm ratios. These regions are mostly locations within radii of1.5 kpc. The exact reason why we see this is unclear, although itis possible that hard ultraviolet photons from the starburst nucleusleak into the diffuse ISM in this region and destroy the PAHs in thisregion.
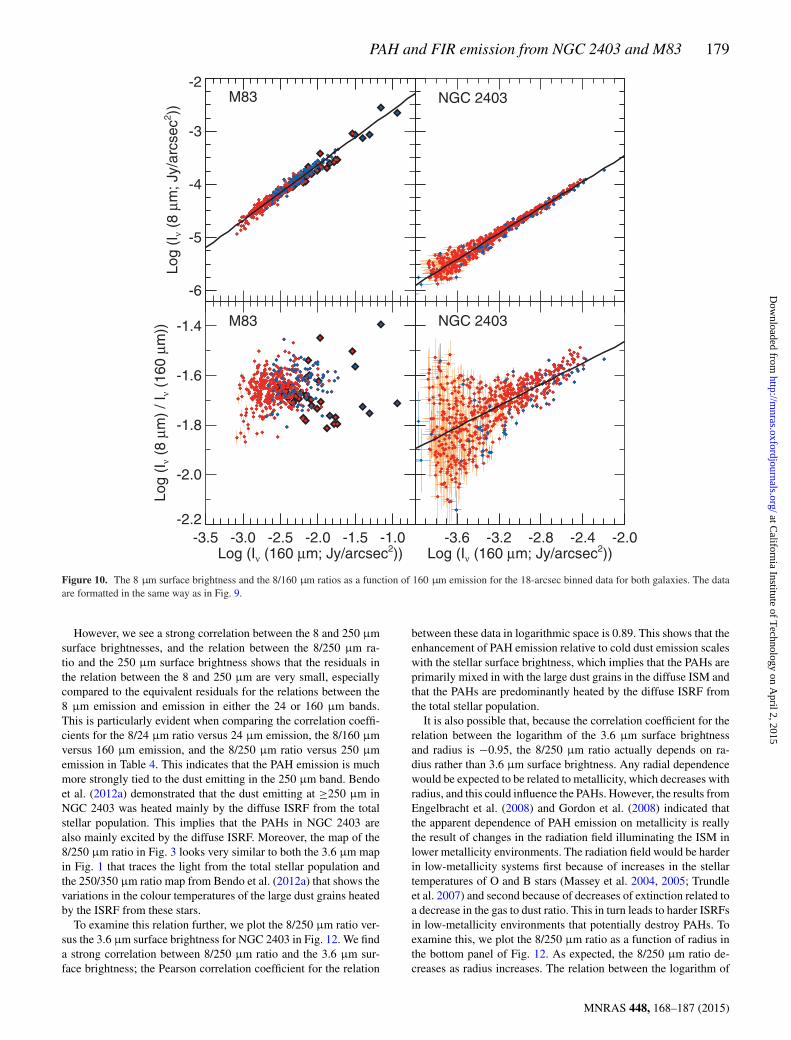
Fig. 10 shows good correlations between the 8 and 160 µmsurface brightnesses. The plot of the 8/160 µm versus 160 µmfor M83 shows that the 8/160 µm ratio is close to constant overa range of infrared surface brightnesses that vary by a factor of100, indicating that the relation between 8 and 160 µm emission isvery close to a one-to-one relationship. Some scatter is seen in the8/160 µm ratio at high 160 µm surface brightnesses. Some of thesedata points are for locations around the infrared-bright centre of M83where the outer regions of the PSF were not matched perfectly in theconvolution step, while other data points sample regions along thespiral arms where the enhancement in the 8/160 µm ratio is offsetfrom the 160 µm surface brightness as discussed in Section 3.1.In NGC 2403, the 8/160 µm ratio increases with 160 µm surfacebrightness, and the relation exhibits more scatter, indicating thatthe relation of 8 µm emission to 160 µm emission in NGC 2403 isdifferent from the relation for M83.
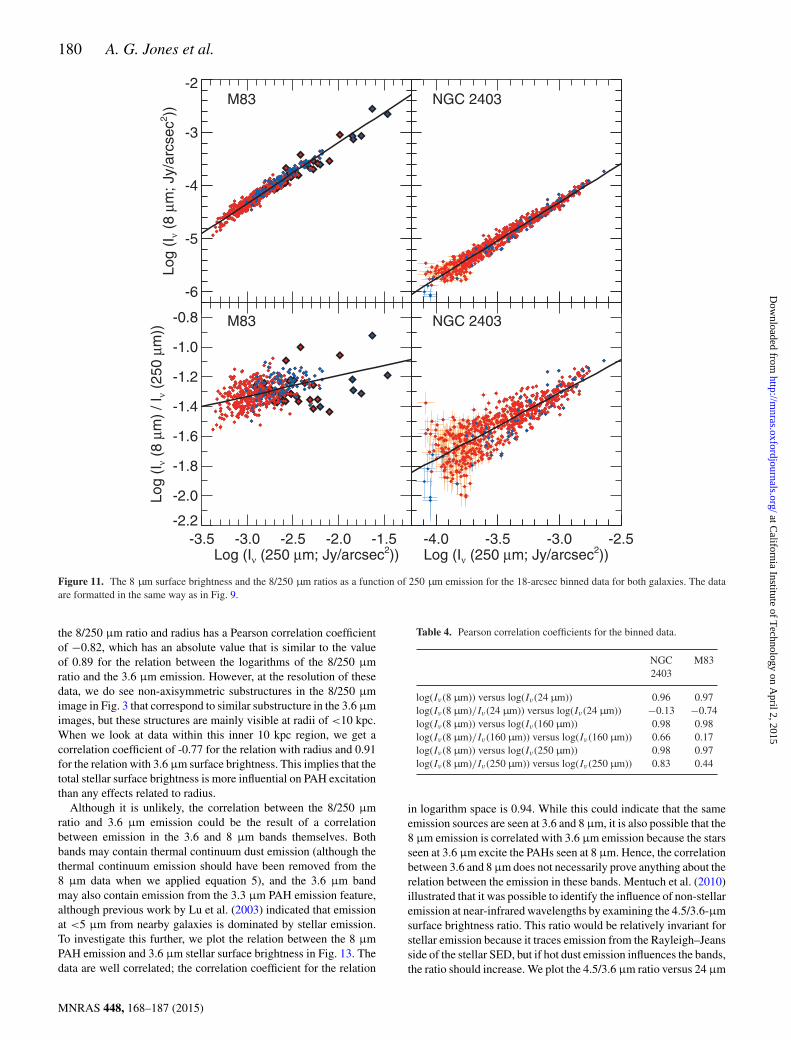
The relations between the 8 and 250 µm emission in Fig. 11 aresimilar to the relations between the 8 and 160 µm emission. Forboth galaxies, the 8/250 µm ratio increases with the 250 µm sur-face brightness, and the correlation coefficients are relatively strong.In NGC 2403, the correlation coefficient between the 8/250 µmratio and the 250 µm surface brightness is 0.83, which is muchhigher than the correlation coefficient of 0.66 for the relation be-tween the 8/160 µm ratio and the 160 µm surface brightness.Given that the square of the Pearson correlation coefficient indi-cates the fraction of variance in one quantity that depends uponthe other quantity, the difference in the correlation coefficients isequivalent to a ∼25 per cent difference in being able to describethe variance in the relations. This suggests that the PAHs aremore strongly associated with the colder dust seen at 250 µm thanthe warmer dust seen at 160 µm. In M83, the relation between the8/250 µm ratio and 250 µm surface brightness is sloped and alsoshows significant scatter at high surfaces brightnesses in the sameway as the relationship between the 8/160 µm ratio and the 8 µmemission.
Because M83 is at a distance ∼1.5 further than NGC 2403, the18 arcsec bins used in this analysis will cover regions with differentspatial scales. In Appendix A, we examined how the results for theanalysis on NGC 2403 would change if we used 27 arcsec bins,which cover approximately the same spatial scales as the 18 arcsecbins used for the M83 data. We see no notable difference in the
MNRAS 448, 168–187 (2015)
at California Institute of T
echnology on April 2, 2015
http://mnras.oxfordjournals.org/
Dow
nloaded from

PAH and FIR emission from NGC 2403 and M83 177
Figure 7. The 250 µm images of the two spiral arms in M83 with the 8/250 µm ratio and 160/250 µm ratio overlaid as contours. The contours for the8/250 µm ratio start at 0.07 and increase upwards in increments of 0.01. The contours for the 160/250 µm ratio start at 2.4 and increase upwards in incrementsof 0.2. The images are formatted in the same way as Fig. 2. The 8/250 µm ratios themselves are discussed in Section 3.1, while both the 8/250 and 160/250 µmratios are discussed in Section 4.2.
Figure 8. Profiles of the Hα, 0.23, 8, 24, 160, and 250 µm surface brightnesses and 8/24-, 8/250-, and 160/250-µm surface brightness ratios measured in18 arcsec wide regions along the locations shown in Fig. 6. The x-axis shows the distance from the peak of the 250 µm emission; negative numbers are for theupstream side of the arms, while positive materials are for the downstream side. The profiles were measured in 18 arcsec wide regions in images where thePSF had been matched to the PSF of the 250 µm data, which has an FWHM of 18 arcsec (or ∼400 pc), but the data are supersampled at 1 arcsec resolutions toproduce smooth curves. All surface brightnesses are normalized so that the peak values are 1, and all ratios are normalized so that they range between 0 and 1.The uncertainties in the normalized surface brightnesses are � 1 per cent, and the uncertainties in the normalized ratios are � 5 per cent. The Hα data shownhere are corrected for foreground dust attenuation but not corrected for dust extinction within M83.
MNRAS 448, 168–187 (2015)
at California Institute of T
echnology on April 2, 2015
http://mnras.oxfordjournals.org/
Dow
nloaded from

178 A. G. Jones et al.
Figure 9. The 8 µm surface brightness and the 8/24 µm ratios as a function of 24 µm emission for the 18-arcsec binned data for both galaxies. Only datadetected at the 5σ level are displayed. The best-fitting linear functions between the surface brightnesses (weighted by the errors in both quantities) are shownas black lines in the top panels. The blue points are locations with high SSFR, and the red points and error bars are locations which are predominantly heatedby the diffuse ISRF; see Section 2.1 for more details. In M83, we highlight locations within a 1.5 kpc radius of the centre in black.
results using the 27 arcsec bins compared to the 18 arcsec bins; mostcorrelation coefficients change by ≤0.05. Hence, adjusting the binsizes for the two galaxies to similar spatial scales is unimportant.We will therefore use data measured in the smaller bins as it takesfull advantage of the capabilities of the Herschel data that we areusing and as it allows us to illustrate how the relations are still foundin smaller structure in NGC 2403.
4 ID E N T I F I C AT I O N O F PA H E X C I TAT I O NS O U R C E S
4.1 PAH excitation in NGC 2403
We can conclude from our analysis that the 8 µm emission thatwe observe from NGC 2403 does not originate from PAHs excitedlocally within the centres of star-forming regions, as the relation-ship between 8 and 24 µm emission shows that PAH 8 µm emis-sion decreases relative to 24 µm emission within regions with highSSFR. This is partly because the 24 µm emission is very sensi-tive to dust heating and increases significantly within star-formingregions (e.g. Dale et al. 2001; Dale & Helou 2002). However, the
strong ultraviolet radiation from these massive young stars probablyphotodissociates the PAHs in the centres of these regions includ-ing species that produce features other than the 7.7 µm feature, ashas been seen spectroscopically in other Galactic and extragalacticstar-forming regions (Berne et al. 2007; Lebouteiller et al. 2007;Povich et al. 2007; Gordon et al. 2008). PAH emission has beenobserved in the outer regions of photodissociation regions (Berneet al. 2007; Lebouteiller et al. 2007; Povich et al. 2007); the photonsthat excite the PAHs in these locations can also heat the very smallgrains that produce the 24 µm emission. In our data, the emissionfrom the inner and outer regions of these regions will be blended.Integrating over the centres of these regions, the 8/24 µm ratio willstill appear low compared to diffuse regions outside these regionsbecause the PAH emission is suppressed in parts of the regionswhile the 24 µm emission is not, a result also obtained by Calzettiet al. (2005). The dust emitting at 160 µm is also heated by lightfrom star-forming regions (Bendo et al. 2012a). While the 8 µmemission is better correlated with the 160 µm band than with the24 µm band, the 8/160 µm ratio still shows significant scatter as afunction of 160 µm surface brightness, possibly because the PAHemission is still inhibited in the regions from which the 160 µmemission is originating.
MNRAS 448, 168–187 (2015)
at California Institute of T
echnology on April 2, 2015
http://mnras.oxfordjournals.org/
Dow
nloaded from
PAH and FIR emission from NGC 2403 and M83 179
Figure 10. The 8 µm surface brightness and the 8/160 µm ratios as a function of 160 µm emission for the 18-arcsec binned data for both galaxies. The dataare formatted in the same way as in Fig. 9.
However, we see a strong correlation between the 8 and 250 µmsurface brightnesses, and the relation between the 8/250 µm ra-tio and the 250 µm surface brightness shows that the residuals inthe relation between the 8 and 250 µm are very small, especiallycompared to the equivalent residuals for the relations between the8 µm emission and emission in either the 24 or 160 µm bands.This is particularly evident when comparing the correlation coeffi-cients for the 8/24 µm ratio versus 24 µm emission, the 8/160 µmversus 160 µm emission, and the 8/250 µm ratio versus 250 µmemission in Table 4. This indicates that the PAH emission is muchmore strongly tied to the dust emitting in the 250 µm band. Bendoet al. (2012a) demonstrated that the dust emitting at ≥250 µm inNGC 2403 was heated mainly by the diffuse ISRF from the totalstellar population. This implies that the PAHs in NGC 2403 arealso mainly excited by the diffuse ISRF. Moreover, the map of the8/250 µm ratio in Fig. 3 looks very similar to both the 3.6 µm mapin Fig. 1 that traces the light from the total stellar population andthe 250/350 µm ratio map from Bendo et al. (2012a) that shows thevariations in the colour temperatures of the large dust grains heatedby the ISRF from these stars.
To examine this relation further, we plot the 8/250 µm ratio ver-sus the 3.6 µm surface brightness for NGC 2403 in Fig. 12. We finda strong correlation between 8/250 µm ratio and the 3.6 µm sur-face brightness; the Pearson correlation coefficient for the relation
between these data in logarithmic space is 0.89. This shows that theenhancement of PAH emission relative to cold dust emission scaleswith the stellar surface brightness, which implies that the PAHs areprimarily mixed in with the large dust grains in the diffuse ISM andthat the PAHs are predominantly heated by the diffuse ISRF fromthe total stellar population.
It is also possible that, because the correlation coefficient for therelation between the logarithm of the 3.6 µm surface brightnessand radius is −0.95, the 8/250 µm ratio actually depends on ra-dius rather than 3.6 µm surface brightness. Any radial dependencewould be expected to be related to metallicity, which decreases withradius, and this could influence the PAHs. However, the results fromEngelbracht et al. (2008) and Gordon et al. (2008) indicated thatthe apparent dependence of PAH emission on metallicity is reallythe result of changes in the radiation field illuminating the ISM inlower metallicity environments. The radiation field would be harderin low-metallicity systems first because of increases in the stellartemperatures of O and B stars (Massey et al. 2004, 2005; Trundleet al. 2007) and second because of decreases of extinction related toa decrease in the gas to dust ratio. This in turn leads to harder ISRFsin low-metallicity environments that potentially destroy PAHs. Toexamine this, we plot the 8/250 µm ratio as a function of radius inthe bottom panel of Fig. 12. As expected, the 8/250 µm ratio de-creases as radius increases. The relation between the logarithm of
MNRAS 448, 168–187 (2015)
at California Institute of T
echnology on April 2, 2015
http://mnras.oxfordjournals.org/
Dow
nloaded from
180 A. G. Jones et al.
Figure 11. The 8 µm surface brightness and the 8/250 µm ratios as a function of 250 µm emission for the 18-arcsec binned data for both galaxies. The dataare formatted in the same way as in Fig. 9.
the 8/250 µm ratio and radius has a Pearson correlation coefficientof −0.82, which has an absolute value that is similar to the valueof 0.89 for the relation between the logarithms of the 8/250 µmratio and the 3.6 µm emission. However, at the resolution of thesedata, we do see non-axisymmetric substructures in the 8/250 µmimage in Fig. 3 that correspond to similar substructure in the 3.6 µmimages, but these structures are mainly visible at radii of <10 kpc.When we look at data within this inner 10 kpc region, we get acorrelation coefficient of -0.77 for the relation with radius and 0.91for the relation with 3.6 µm surface brightness. This implies that thetotal stellar surface brightness is more influential on PAH excitationthan any effects related to radius.
Although it is unlikely, the correlation between the 8/250 µmratio and 3.6 µm emission could be the result of a correlationbetween emission in the 3.6 and 8 µm bands themselves. Bothbands may contain thermal continuum dust emission (although thethermal continuum emission should have been removed from the8 µm data when we applied equation 5), and the 3.6 µm bandmay also contain emission from the 3.3 µm PAH emission feature,although previous work by Lu et al. (2003) indicated that emissionat <5 µm from nearby galaxies is dominated by stellar emission.To investigate this further, we plot the relation between the 8 µmPAH emission and 3.6 µm stellar surface brightness in Fig. 13. Thedata are well correlated; the correlation coefficient for the relation
Table 4. Pearson correlation coefficients for the binned data.
NGC M832403
log(Iν (8 µm)) versus log(Iν (24 µm)) 0.96 0.97log(Iν (8 µm)/Iν (24 µm)) versus log(Iν (24 µm)) −0.13 −0.74log(Iν (8 µm)) versus log(Iν (160 µm)) 0.98 0.98log(Iν (8 µm)/Iν (160 µm)) versus log(Iν (160 µm)) 0.66 0.17log(Iν (8 µm)) versus log(Iν (250 µm)) 0.98 0.97log(Iν (8 µm)/Iν (250 µm)) versus log(Iν (250 µm)) 0.83 0.44
in logarithm space is 0.94. While this could indicate that the sameemission sources are seen at 3.6 and 8 µm, it is also possible that the8 µm emission is correlated with 3.6 µm emission because the starsseen at 3.6 µm excite the PAHs seen at 8 µm. Hence, the correlationbetween 3.6 and 8 µm does not necessarily prove anything about therelation between the emission in these bands. Mentuch et al. (2010)illustrated that it was possible to identify the influence of non-stellaremission at near-infrared wavelengths by examining the 4.5/3.6-µmsurface brightness ratio. This ratio would be relatively invariant forstellar emission because it traces emission from the Rayleigh–Jeansside of the stellar SED, but if hot dust emission influences the bands,the ratio should increase. We plot the 4.5/3.6 µm ratio versus 24 µm
MNRAS 448, 168–187 (2015)
at California Institute of T
echnology on April 2, 2015
http://mnras.oxfordjournals.org/
Dow
nloaded from

PAH and FIR emission from NGC 2403 and M83 181
Figure 12. The 8/250-µm surface brightness ratio plotted as a function ofthe 3.6 µm surface brightness and galactocentric radius for the 18-arcsecbinned data for NGC 2403. The data are formatted in the same way as inFig. 9. The radii are based on using an inclination of 62.9 deg from de Bloket al. (2008).
emission in the lower panel of Fig. 13. This relationship is almostflat. Most of the data points have log(Iν(4.5 µm)/Iν(3.6 µm)) valuesthat lie within a range of −0.14 to −0.23, which would be consistentwith what was observed for evolved stellar populations by Mentuchet al. (2010). The absence of significant variations in the 4.5/3.6 µmratio with 24 µm implies that the 3.6 and 4.5 µm bands are largelyuninfluenced by hot dust emission. We do see a few data points withvalues of log(Iν(4.5 µm)/Iν(3.6 µm))>−0.14 where the 3.6 and4.5 µm may be more strongly influenced by non-stellar emission,but these data only weakly influence our results. If we exclude thesedata, the correlation coefficient for the relation between the 3.6 µmdata and the 8/250 µm data changes by <0.01. This shows that the3.6 µm emission in NGC 2403 is largely dominated by the stellarpopulation and is relatively unaffected by hot dust or PAH emission.Therefore, the most likely explanation for the correlation betweenthe 3.6 and 8 µm emission as well as the correlation between the3.6 µm emission and the 8/250 µm ratio is that the PAHs are excitedby the stellar population seen at 3.6 µm.
4.2 PAH excitation in M83
The results from the 8 to 24 µm relationship in M83 are similarto NGC 2403. We see the 8 µm PAH emission is low in regionswhere the 24 µm emission peaks. Again, PAHs are probably being
Figure 13. To examine whether the relation between the 3.6 µm emissionand the 8/250 µm ratio is related to hot dust or PAH emission in the 3.6 µmband, we first show the relation between 3.6 and 8 µm emission. The relationin the top panel could be the result of either the 3.6 and 8 µm bands tracingemission from similar sources or the 3.6 µm band tracing starlight excitingthe PAHs seen in the 8 µm band. Next, we plot the 4.5/3.6 µm ratio as afunction of the 24 µm emission in the bottom panel to examine whetherthe slope of the SED at 3.6–4.5 µm is influenced by hot dust emission. Theabsence of such a relation as well as the relative invariance of the 4.5/3.6 µmratio implies that the 3.6 and 4.5 µm bands are relatively unaffected by non-stellar emission. The data are formatted in the same way as in Fig. 9.
destroyed locally in regions with high SSFR. However, we find that8 µm emission is more strongly related to the 160 and 250 µmemission. We also see offsets between the 8/250 µm ratios and thedust mass (as traced by the 250 µm band). Bendo et al. (2012a, 2014)also found that the 160/250 µm colours appeared offset relative tothe star-forming regions in the spiral arms, and Foyle et al. (2012)found a related offset in the dust colour temperatures. This impliesthat the enhancement in PAH emission relative to cold dust emissionis related to the enhancement of the temperature of the dust seen at160 µm. To examine this relationship further, we map the 250 µmemission from the spiral arms overlaid with contours showing the160/250 µm ratio in Fig. 7, and we show profiles of the 160/250 µmratio across the spiral arms in Fig. 8. These plots show that the 8/250and 160/250 µm ratios trace similar structures offset from the dustmass as well as the Hα and 24 µm emission associated with starformation. To check how well the 8/250 and 160/250 µm ratiosare correlated, we plot the two ratios in Fig. 14. The relation has aPearson correlation coefficient of 0.65, implying that the excitation
MNRAS 448, 168–187 (2015)
at California Institute of T
echnology on April 2, 2015
http://mnras.oxfordjournals.org/
Dow
nloaded from

182 A. G. Jones et al.
Figure 14. The 8/250-µm surface brightness ratio plotted as a function ofthe 160/250-µm surface brightness ratio for the 18-arcsec binned data. Thedata are formatted in the same way as in Fig. 9.
of PAH emission and the heating of the dust seen at 160 µm are, tosome degree, linked.
In spiral density waves, as mentioned before, large quantitiesof gas and dust are expected where the ISM is shocked on theupstream sides of the spiral arms, star-forming regions would befound immediately downstream of the shocks, and older stars wouldbe expected further downstream (e.g. Roberts 1969; Elmegreen1979; Tamburro et al. 2008; Martınez-Garcıa, Gonzalez-Lopezlira& Bruzual-A 2009; Sanchez-Gil et al. 2011). This could cause offsetenhancement of PAH emission relative to spiral arm dust lanes, asseen in Fig. 8 and as also implied by the relation in Fig. 14, in twopossible ways.
One possible explanation is that the dense dust lanes on theupstream edge of the spiral arms severely attenuate the starlightescaping from the photoionizing stars within star-forming regions,but light easily escapes across the downstream side of the spiralarms where the dust density is lower. Such a geometrical arrange-ment of the star-forming regions relative to the dust would producethe slight offsets between the 24 µm emission (tracing obscuredstar formation) and Hα emission (tracing unobscured star forma-tion) seen in most of the profiles in Fig. 8 and may also explainthe downstream areas with enhanced Hα emission in profiles Cand F. If photoionizing light is primarily travelling asymmetricallyfrom the star-forming regions and if the 160 µm band traces dustheated by the light escaping from the star-forming regions into thediffuse ISM, the 160 µm emission would appear enhanced relativeto 250 µm emission along the downstream side of the spiral arms.Similarly, PAHs mixed in with the dust emitting at 160 µm wouldbe excited by the ultraviolet light escaping from star-forming re-gions and appear enhanced relative to the dust emission in the samelocations, although the total PAH emission itself will peak alongthe spiral arms where the total mass of the PAHs is greater (whichis also true for dust emission observed in any single band).
The other possible explanation is that the PAHs and the dust seenat 160 µm are locally heated by a young, non-ionizing populationof stars (stars with ages older than 4 Myr) that have left the dustystar-forming regions in the spiral arms. As shown by Leithereret al. (1999), such a population would still produce a substantialamount of ultraviolet and blue light that could strongly enhance thePAH emission and the temperature of the large dust grains on thedownstream side of the arms, but the radiation from these stars maynot include higher energy photons that destroy PAHs. In the profiles
in Fig. 8, the ultraviolet emission either peaks downstream of thedust mass or has a profile on the downstream side that is broaderthan the dust emission profile. Additionally, the ultraviolet emissionappears to stronger relative to the Hα emission in most downstreamlocations. This provides additional support for the possibility thatthe 8 µm emission observed in M83 originates from PAHs excitedlocally by young, non-ionizing stars, although additional analysiswould be needed to confirm this.
It is also worth briefly noting that we do not see variations inthe 8/160 or 8/250 µm ratios in M83 that imply a dependenceupon radius and hence a dependence upon the metallicity, whichdecreases with radius (Zaritsky et al. 1994). The variations in thePAH emission with respect to the cold dust emission are drivenmainly by local excitation of the PAHs.
5 D I SCUSSI ON
The results show that the 8/24 µm ratio decreases in many regionswith high SSFR, in agreement with previous findings from Helouet al. (2004), Calzetti et al. (2005), Bendo et al. (2006, 2008), Mad-den et al. (2006), Berne et al. (2007), Lebouteiller et al. (2007),Povich et al. (2007), Gordon et al. (2008), and Calapa et al. (2014).Even though our analysis is mainly focused on the 7.7 µm PAH fea-ture that falls within IRAC channel 4, the results from Lebouteilleret al. (2007), Povich et al. (2007), and Gordon et al. (2008) suggestthat other PAH emission features may also decrease relative to hotdust emission within star-forming regions.
Our results showing the correlation of the 8 µm emission fromPAHs with the far-infrared emission from large dust grains is largelyin agreement with the results from Haas et al. (2002), Bendo et al.(2008), and Calapa et al. (2014). However, the general conclusionfrom these papers had been that the PAHs are mixed with largegrains heated by the diffuse ISRF. While NGC 2403 certainly fitsthat scenario, M83 does not. Instead, PAH emission in M83 ismore strongly associated with large dust grains heated either bylight escaping from star-forming regions and travelling hundredsof pc away from the spiral arms or locally by young stars thatproduce substantial non-ionizing ultraviolet radiation, which wasunexpected. Further study would be needed to determine whethersuch variations in PAH excitation are seen among other nearbygalaxies as well.
PAH may be excited by different radiation fields in NGC 2403and M83 because of the differences in the spiral structure in thetwo galaxies. Because NGC 2403 is a flocculent spiral galaxy, starformation is expected to be triggered by clouds collapsing in localgravitational instabilities (e.g. Tosaki et al. 2003; Dobbs & Pringle2010). In such a scenario, inflowing dust on scales of tens or hun-dreds of parsecs may be roughly symmetrically distributed aroundstar-forming regions, although more modelling work on cloud col-lapse in flocculent galaxies is needed to confirm this. If the dustis distributed this way, dust near the centres of these shells wouldabsorb the ultraviolet and blue light from the star-forming regionsinside, and any PAHs within these central regions would be de-stroyed. Meanwhile, dust and PAHs in the outer shells would beshielded from the light from the star-forming regions and would in-stead be heated by the diffuse ISRF. Also note that the stars in spiralarm filaments in flocculent spiral galaxies are not expected to varyin age with distance from the spiral arms in the same way as seenin grand-design spiral galaxies (Dobbs & Pringle 2010). If young,non-photoionizing stars contribute significantly to PAH excitation,then the relatively homogeneous distribution of these stars may re-sult in the PAHs appearing enhanced over broad areas rather than
MNRAS 448, 168–187 (2015)
at California Institute of T
echnology on April 2, 2015
http://mnras.oxfordjournals.org/
Dow
nloaded from

PAH and FIR emission from NGC 2403 and M83 183
appearing enhanced near the spiral filaments. In contrast to NGC2403, M83 is a grand-design spiral galaxy in which cold, dusty gasflows into star-forming sites mainly from one side of the spiral armsand star-forming regions emerge from the other side (e.g. Elmegreen1979; Garcia-Burillo, Guelin & Cernicharo 1993; Tamburro et al.2008; Egusa et al. 2009; Vlahakis et al. 2013). Hence, dust willpreferentially be located upstream of individual star-forming re-gions within M83. As described in Section 4.2, PAHs are destroyedwithin the centres of these star-forming regions, but PAHs in thediffuse ISM could be excited by starlight diffusing out of the op-tically thin side of the star-forming regions. Additionally, multiplestudies (e.g. Martınez-Garcıa et al. 2009; Sanchez-Gil et al. 2011)have found gradients in the ages of the stellar populations down-stream of spiral arms in grand-design spiral galaxies. PAH emissioncould appear enhanced downstream of star-forming regions if thePAHs are destroyed in photoionizing regions but strongly excitedlocally in regions with soft ultraviolet emission from young, non-photoionizing stars. If these geometrical descriptions for the relationbetween PAHs and excitation sources is accurate, then we shouldfind that PAHs are excited by the diffuse ISRF in other flocculentlate-type spiral galaxies while PAHs are excited in regions offsetfrom star-forming regions in other grand-design spiral galaxies.
Some dust emission models (e.g. Draine et al. 2007) and radiativetransfer models (e.g. Popescu et al. 2011) show PAHs as excitedby the radiation fields from all stellar populations regardless of thehardness or intensity of the fields.10 Our results show that this ap-proach is an oversimplification of PAH excitation. New refinementsin dust emission and radiative transfer models are needed to repli-cate how PAHs are excited by radiation fields from different stellarpopulations within different galaxies and how the PAH/dust massratio may change with variations in the hardness of the illuminat-ing radiation field. For example, Crocker et al. (2013) used stellarpopulation synthesis and simplified models of dust and PAH ab-sorption to predict the contributions of different stellar populationsto PAH excitation in NGC 628 and found that ∼40 per cent of thePAHs are excited by stars <10 Myr in age, ∼20 per cent are excitedby stars with ages of 10–100 Myr, and the remainder are excitedby stars >100 Myr in age. It is also apparent that PAH excitationchanges across spiral density waves (either because of details inthe geometry of the star-forming regions or because of variations inthe stellar populations on either side of the waves), and it would beappropriate to make improvements to radiative transfer models sothat they can replicate these effects.
Our results have multiple implications for using PAH emissionas a proxy for other quantities. While PAH emission cannot be usedon sub-kpc scales to measure accurate star formation rates, groupssuch as Zhu et al. (2008) and Kennicutt et al. (2009) have suggestedusing globally-integrated PAH emission to estimate extinction cor-rections for optical star formation tracers such as Hα emission, thusproducing extinction-corrected global star formation metrics. WhenPAHs are excited by star-forming regions, globally-integrated PAHemission should more accurately represent the light attenuated bydust in star-forming regions and should provide fairly accurate star
10 The version of the Draine et al. (2007) model typically applied to infraredSEDs is usually based on dust heated by a radiation field with the samespectral shape as the local ISRF as specified by Mathis, Mezger & Panagia(1983). When applying the dust model to data, only the amplitude of theradiation field is treated as a free parameter. However, Draine et al. (2014)include an example of SED fitting with the Draine et al. (2007) model inwhich the spectral shape of the illuminating radiation field is also allowedto vary.
formation rates. When PAHs are excited by the diffuse ISRF, how-ever, the connection between star formation and PAH emission isless clear, and star formation rates calculated using PAH emissioncould be less reliable.
Previous results showing a relation between PAH emission andfar-infrared emission from large dust grains had implied that PAHscould be used as a proxy of dust mass (e.g. Bendo et al. 2008). Incases where the PAHs are associated with dust heated by the diffuseISRF, this should still be appropriate, although metallicity-relatedeffects would still need to be taken into account. In cases wherethe PAHs are heated by diffuse light from star-forming regions orfrom young, non-photoionizing stars that have emerged from star-forming regions, the PAH emission will still scale approximatelywith dust mass but will also vary depending upon the radiation fieldfrom the young stars. In this situation, using PAH emission to tracedust mass may be less reliable.
Multiple authors have identified an empirical relation between ei-ther radially-averaged or globally-integrated PAH and CO emission(Regan et al. 2006; Bendo et al. 2010a; Tan et al. 2013; Vlahakiset al. 2013), implying that the PAHs are, to some degree, correlatedwith molecular gas. This would be expected if the PAHs also tracethe cold dust that is found associated with the molecular gas. How-ever, the relation between PAH and CO emission breaks down onsmall spatial scales, including in NGC 2403 (Bendo et al. 2010a,but also see Tan et al. 2013). In M51, Vlahakis et al. (2013) foundan offset between PAH and CO emission in the spiral arms, withthe molecular gas associated with the cold dust in the locationswhere material is entering the spiral arms and the PAH emissionappearing enhanced further downstream where it is excited by lightfrom young stars. Our results imply that, in future work, we maybe able to measure a similar offset between PAH and CO emissionin M83 as well as other grand-design spiral galaxies. While PAHemission was already shown to be a poor tracer of molecular gason sub-kpc scales, the phenomenology of PAHs excitation in spiraldensity waves causes even more problems with using it as a proxyfor molecular gas.
6 C O N C L U S I O N S
We identified different relations between PAH emission and far-infrared emission from large dust grains in the two galaxies weexamined. For NGC 2403, we find the 8 µm emission is moststrongly associated with emission from cold dust at 250 µm. Inparticular, we find that the 8/250 µm ratio shows a very strongdependence upon the 3.6 µm emission from the total stellar popu-lation, indicating that the PAHs are mixed in with the diffuse dustand heated by the diffuse ISRF from the total stellar population.Star-forming regions play a much less significant role in the ex-citation of the PAHs observed in the 8 µm band. In contrast, wesee in M83 that the PAH emission is more strongly associated withthe 160 µm emission from large grains heated by star-forming re-gions as implied by the strong correlation between the 160/250 and8/250 µm ratios. This illustrates that PAHs in M83 are excited ei-ther by starlight escaping asymmetrically from star-forming regionso that locations towards the downstream edges of the spiral armsshow enhancement in 8 µm emission compared to the dust mass orthat the PAHs are excited locally by young, non-photoionizing starsthat have migrated downstream from the spiral arms.
Many dust emission and radiative transfer models currently treatPAHs as though they are excited by all radiation fields of all in-tensities from all stellar populations within the galaxies to whichthey are applied, much in the same way that emission from silicate
MNRAS 448, 168–187 (2015)
at California Institute of T
echnology on April 2, 2015
http://mnras.oxfordjournals.org/
Dow
nloaded from

184 A. G. Jones et al.
and large carbonaceous dust grains is modelled. The results fromjust these two galaxies show that this assumption is not universallyapplicable. These dust models need to be adjusted to account forthe observational results showing that PAHs are sometimes excitedby the diffuse ISRF from the total stellar population and sometimesexcited either by young, non-photoionizing stars that have emergedfrom star-forming regions or light escaping from these regions andtravelling hundreds of pc away (although the PAH emission maybe inhibited within the star-forming regions themselves). Addition-ally, some models rely upon using a single SED shape (such as theSED of the local ISRF) for the radiation field illuminating PAHsand dust. Such models cannot account for the possibility that PAHemission could be inhibited if the radiation fields are excessivelyhard. To properly characterize the PAH excitation, it is necessaryto model the PAHs as being illuminated by radiation fields withdifferent spectral shapes.
Our data here show differences between the PAH excitationwithin two galaxies with similar Hubble types. We should expandthe analysis to include galaxies with a wider range of Hubble types,including E, S0, and Sa galaxies where the evolved stellar popu-lations may play a larger role in dust heating and therefore maybe more responsible for PAH excitation. We should also exam-ine other grand-design spiral galaxies to determine whether PAHemission from the spiral arms in these galaxies is offset from thestar-forming regions in the same way that it is in M83. This researchwill lead to a better understanding of PAH excitation mechanisms aswell as the relation of PAHs to star formation and large dust grains.
AC K N OW L E D G E M E N T S
This work has been produced as part of an MSc thesis for the Uni-versity of Manchester. SPIRE has been developed by a consortiumof institutes led by Cardiff University (UK) and including: Univer-sity Lethbridge (Canada); NAOC (China); CEA, LAM (France);IFSI, Univ. Padua (Italy); IAC (Spain); Stockholm Observatory(Sweden); Imperial College London, RAL, UCL-MSSL, UKATC,University Sussex (UK); and Caltech, JPL, NHSC, Univ. Colorado(USA). This development has been supported by national fund-ing agencies: CSA (Canada); NAOC (China); CEA, CNES, CNRS(France); ASI (Italy); MCINN (Spain); SNSB (Sweden); STFC,UKSA (UK); and NASA (USA). IDL is a postdoctoral researcherof the FWO-Vlaanderen (Belgium).
R E F E R E N C E S
Altieri B., Vavrek R., eds, 2013, PACS Observer’s Manual, Version 2.5.1.Herschel Science Centre, Madrid
Aniano G., Draine B. T., Gordon K. D., Sandstrom K., 2011, PASP, 123,1218
Auld R. et al., 2013, MNRAS, 428, 1880Bendo G. J. et al., 2006, ApJ, 652, 283Bendo G. J. et al., 2008, MNRAS, 389, 629Bendo G. J. et al., 2010a, MNRAS, 402, 1409Bendo G. J. et al., 2010b, A&A, 518, L65Bendo G. J. et al., 2012a, MNRAS, 419, 1833Bendo G. J., Galliano F., Madden S. C., 2012b, MNRAS, 423, 197Bendo G. J. et al., 2013, MNRAS, 433, 3062Bendo G. J. et al., 2014, preprint (arXiv:1409.1815)Berne O. et al., 2007, A&A, 469, 575Bohlin R. C., Cornett R. H., Hill J. K., Smith A. M., Stecher T. P., 1983,
ApJ, 274, L53Boissier S. et al., 2005, ApJ, 619, L83Boquien M. et al., 2011, AJ, 142, 111Boselli A., Gavazzi G., 2002, A&A, 386, 124
Boselli A., Lequeux J., Gavazzi G., 2004, A&A, 428, 409Calapa M. D. et al., 2014, ApJ, 784, 130Calzetti D. et al., 2005, ApJ, 633, 871Calzetti D. et al., 2007, ApJ, 666, 870Cannon J. M. et al., 2006, ApJ, 647, 293Cardelli J. A., Clayton G. C., Mathis J. S., 1989, ApJ, 345, 245Ciesla L. et al., 2014, A&A, 565, A128Crocker A. F. et al., 2013, ApJ, 762, 79Dale D. A., Helou G., 2002, ApJ, 576, 159Dale D. A., Helou G., Contursi A., Silbermann N. A., Kolhatkar S., 2001,
ApJ, 549, 215Dale D. A. et al., 2009, ApJ, 703, 517de Blok W. J. G., Walter F., Brinks E., Trachternach C., Oh S.-H., Kennicutt
R. C., Jr, 2008, AJ, 136, 2648de Vaucouleurs G., de Vaucouleurs A., Corwin H. G., Jr, Buta R. J., Paturel
G., Fouque P., 1991, Third Reference Catalogue of Bright Galaxies.Springer, New York
Dobbs C. L., Pringle J. E., 2010, MNRAS, 409, 396Draine B. T. et al., 2007, ApJ, 663, 866Draine B. T. et al., 2014, ApJ, 780, 172Egusa F., Kohno K., Sofue Y., Nakanishi H., Komugi S., 2009, ApJ, 697,
1870Elmegreen B. G., 1979, ApJ, 231, 372Elmegreen D. M., Elmegreen B. G., 1987, ApJ, 314, 3Elmegreen D. M., Chromey F. R., Warren A. R., 1998, AJ, 116, 2834Engelbracht C. W., Gordon K. D., Rieke G. H., Werner M. W., Dale D. A.,
Latter W. B., 2005, ApJ, 628, L29Engelbracht C. W. et al., 2007, PASP, 119, 994Engelbracht C. W., Rieke G. H., Gordon K. D., Smith J.-D. T., Werner M.
W., Moustakas J., Willmer C. N. A., Vanzi L., 2008, ApJ, 678, 804Eskew M., Zaritsky D., Meidt S., 2012, AJ, 143, 139Fazio G. G. et al., 2004, ApJS, 154, 10Forster Schreiber N. M., Roussel H., Sauvage M., Charmandaris V., 2004,
A&A, 419, 501Foyle K. et al., 2012, MNRAS, 421, 2917Freedman W. L. et al., 2001, ApJ, 553, 47Galametz M. et al., 2013, MNRAS, 431, 1956Galliano F., Madden S. C., Tielens A. G. G. M., Peeters E., Jones A. P.,
2008, ApJ, 679, 310Garcia-Burillo S., Guelin M., Cernicharo J., 1993, A&A, 274, 123Gordon K. D. et al., 2005, PASP, 117, 503Gordon K. D., Engelbracht C. W., Rieke G. H., Misselt K. A., Smith J.-D.
T., Kennicutt R. C., Jr, 2008, ApJ, 682, 336Griffin M. J. et al., 2010, A&A, 518, L3Haas M., Klaas U., Bianchi S., 2002, A&A, 385, L23Helou G. et al., 2004, ApJS, 154, 253IRAC Instrument and Instrument Support Teams 2013, IRAC Instrument
Handbook, Version 2.0.3. Spitzer Science Center, Pasadena, CAJones A. G., 2013, PhD thesis, Manchester UniversityKennicutt R. C., Jr, 1998, ARA&A, 36, 189Kennicutt R. C., Jr, et al., 2003, PASP, 115, 928Kennicutt R. C., Jr, et al., 2009, ApJ, 703, 1672Kessler M. F. et al., 1996, A&A, 315, L27Kroupa P., 2001, MNRAS, 322, 231Lebouteiller V., Brandl B., Bernard-Salas J., Devost D., Houck J. R., 2007,
ApJ, 665, 390Lee J. C. et al., 2011, ApJS, 192, 6Leitherer C. et al., 1999, ApJS, 123, 3Li A., Draine B. T., 2002, ApJ, 572, 232Lu N. et al., 2003, ApJ, 588, 199Lu N. et al., 2014, ApJ, 797, 129Lutz D., 2012, PACS Photometer Point Spread Function, Version 2.0. Her-
schel Science Centre, MadridMadden S. C., Galliano F., Jones A. P., Sauvage M., 2006, A&A, 446, 877Marble A. R. et al., 2010, ApJ, 715, 506Martin D. C. et al., 2005, ApJ, 619, L1Martınez-Garcıa E. E., Gonzalez-Lopezlira R. A., Bruzual-A G., 2009, ApJ,
694, 512
MNRAS 448, 168–187 (2015)
at California Institute of T
echnology on April 2, 2015
http://mnras.oxfordjournals.org/
Dow
nloaded from
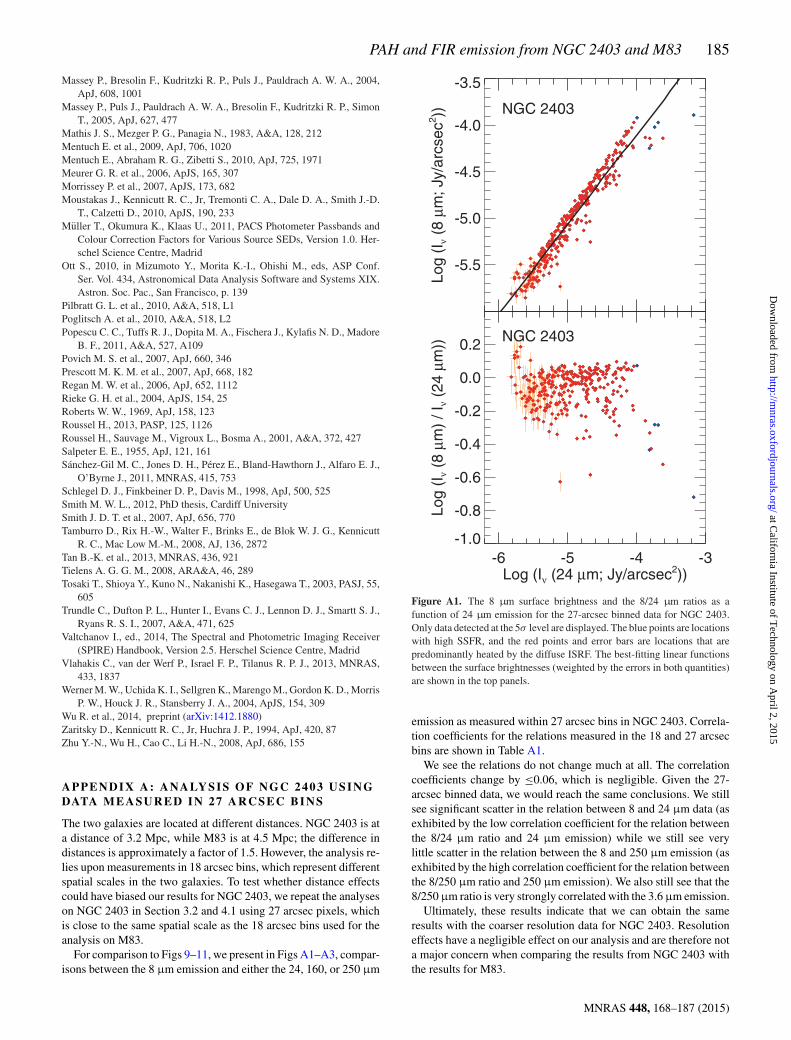
PAH and FIR emission from NGC 2403 and M83 185
Massey P., Bresolin F., Kudritzki R. P., Puls J., Pauldrach A. W. A., 2004,ApJ, 608, 1001
Massey P., Puls J., Pauldrach A. W. A., Bresolin F., Kudritzki R. P., SimonT., 2005, ApJ, 627, 477
Mathis J. S., Mezger P. G., Panagia N., 1983, A&A, 128, 212Mentuch E. et al., 2009, ApJ, 706, 1020Mentuch E., Abraham R. G., Zibetti S., 2010, ApJ, 725, 1971Meurer G. R. et al., 2006, ApJS, 165, 307Morrissey P. et al., 2007, ApJS, 173, 682Moustakas J., Kennicutt R. C., Jr, Tremonti C. A., Dale D. A., Smith J.-D.
T., Calzetti D., 2010, ApJS, 190, 233Muller T., Okumura K., Klaas U., 2011, PACS Photometer Passbands and
Colour Correction Factors for Various Source SEDs, Version 1.0. Her-schel Science Centre, Madrid
Ott S., 2010, in Mizumoto Y., Morita K.-I., Ohishi M., eds, ASP Conf.Ser. Vol. 434, Astronomical Data Analysis Software and Systems XIX.Astron. Soc. Pac., San Francisco, p. 139
Pilbratt G. L. et al., 2010, A&A, 518, L1Poglitsch A. et al., 2010, A&A, 518, L2Popescu C. C., Tuffs R. J., Dopita M. A., Fischera J., Kylafis N. D., Madore
B. F., 2011, A&A, 527, A109Povich M. S. et al., 2007, ApJ, 660, 346Prescott M. K. M. et al., 2007, ApJ, 668, 182Regan M. W. et al., 2006, ApJ, 652, 1112Rieke G. H. et al., 2004, ApJS, 154, 25Roberts W. W., 1969, ApJ, 158, 123Roussel H., 2013, PASP, 125, 1126Roussel H., Sauvage M., Vigroux L., Bosma A., 2001, A&A, 372, 427Salpeter E. E., 1955, ApJ, 121, 161Sanchez-Gil M. C., Jones D. H., Perez E., Bland-Hawthorn J., Alfaro E. J.,
O’Byrne J., 2011, MNRAS, 415, 753Schlegel D. J., Finkbeiner D. P., Davis M., 1998, ApJ, 500, 525Smith M. W. L., 2012, PhD thesis, Cardiff UniversitySmith J. D. T. et al., 2007, ApJ, 656, 770Tamburro D., Rix H.-W., Walter F., Brinks E., de Blok W. J. G., Kennicutt
R. C., Mac Low M.-M., 2008, AJ, 136, 2872Tan B.-K. et al., 2013, MNRAS, 436, 921Tielens A. G. G. M., 2008, ARA&A, 46, 289Tosaki T., Shioya Y., Kuno N., Nakanishi K., Hasegawa T., 2003, PASJ, 55,
605Trundle C., Dufton P. L., Hunter I., Evans C. J., Lennon D. J., Smartt S. J.,
Ryans R. S. I., 2007, A&A, 471, 625Valtchanov I., ed., 2014, The Spectral and Photometric Imaging Receiver
(SPIRE) Handbook, Version 2.5. Herschel Science Centre, MadridVlahakis C., van der Werf P., Israel F. P., Tilanus R. P. J., 2013, MNRAS,
433, 1837Werner M. W., Uchida K. I., Sellgren K., Marengo M., Gordon K. D., Morris
P. W., Houck J. R., Stansberry J. A., 2004, ApJS, 154, 309Wu R. et al., 2014, preprint (arXiv:1412.1880)Zaritsky D., Kennicutt R. C., Jr, Huchra J. P., 1994, ApJ, 420, 87Zhu Y.-N., Wu H., Cao C., Li H.-N., 2008, ApJ, 686, 155
A P P E N D I X A : A NA LY S I S O F N G C 2 4 0 3 U S I N GDATA MEASURED IN 2 7 ARCSEC BINS
The two galaxies are located at different distances. NGC 2403 is ata distance of 3.2 Mpc, while M83 is at 4.5 Mpc; the difference indistances is approximately a factor of 1.5. However, the analysis re-lies upon measurements in 18 arcsec bins, which represent differentspatial scales in the two galaxies. To test whether distance effectscould have biased our results for NGC 2403, we repeat the analyseson NGC 2403 in Section 3.2 and 4.1 using 27 arcsec pixels, whichis close to the same spatial scale as the 18 arcsec bins used for theanalysis on M83.
For comparison to Figs 9–11, we present in Figs A1–A3, compar-isons between the 8 µm emission and either the 24, 160, or 250 µm
Figure A1. The 8 µm surface brightness and the 8/24 µm ratios as afunction of 24 µm emission for the 27-arcsec binned data for NGC 2403.Only data detected at the 5σ level are displayed. The blue points are locationswith high SSFR, and the red points and error bars are locations that arepredominantly heated by the diffuse ISRF. The best-fitting linear functionsbetween the surface brightnesses (weighted by the errors in both quantities)are shown in the top panels.
emission as measured within 27 arcsec bins in NGC 2403. Correla-tion coefficients for the relations measured in the 18 and 27 arcsecbins are shown in Table A1.
We see the relations do not change much at all. The correlationcoefficients change by ≤0.06, which is negligible. Given the 27-arcsec binned data, we would reach the same conclusions. We stillsee significant scatter in the relation between 8 and 24 µm data (asexhibited by the low correlation coefficient for the relation betweenthe 8/24 µm ratio and 24 µm emission) while we still see verylittle scatter in the relation between the 8 and 250 µm emission (asexhibited by the high correlation coefficient for the relation betweenthe 8/250 µm ratio and 250 µm emission). We also still see that the8/250 µm ratio is very strongly correlated with the 3.6 µm emission.
Ultimately, these results indicate that we can obtain the sameresults with the coarser resolution data for NGC 2403. Resolutioneffects have a negligible effect on our analysis and are therefore nota major concern when comparing the results from NGC 2403 withthe results for M83.
MNRAS 448, 168–187 (2015)
at California Institute of T
echnology on April 2, 2015
http://mnras.oxfordjournals.org/
Dow
nloaded from

186 A. G. Jones et al.
Figure A2. The 8 µm surface brightness and the 8/160 µm ratios as afunction of 160 µm emission for the 27-arcsec binned data for NGC 2403.The data are formatted in the same way as in Fig. A1.
Figure A3. The 8 µm surface brightness and the 8/250 µm ratios as afunction of 250 µm emission for the 27-arcsec binned data for NGC 2403.The data are formatted in the same way as in Fig. A1.
MNRAS 448, 168–187 (2015)
at California Institute of T
echnology on April 2, 2015
http://mnras.oxfordjournals.org/
Dow
nloaded from

PAH and FIR emission from NGC 2403 and M83 187
Figure A4. The top two panels are the 8/250-µm surface brightness ratioplotted as a function of the 3.6 µm surface brightness and galactocentricradius for the 27-arcsec binned data for NGC 2403. The data are formattedin the same way as in Fig. A1. The radii are based on using an inclinationof 62.9 deg from de Blok et al. (2008).
Figure A5. The top panel is the 8 to 3.6 µm relationship. The lower panelplots the 4.5/3.6 µm ratio versus 24 µm relationship. The data are formattedin the same way as in Fig. 9.
Table A1. Pearson correlation coefficients for the binned data.
NGC 2403Bin size (arcsec) 18 27
log(Iν (8 µm)) versus log(Iν (24 µm)) 0.96 0.96log(Iν (8 µm)/Iν (24 µm)) versus log(Iν (24 µm)) −0.13 −0.13log(Iν (8 µm)) versus log(Iν (160 µm)) 0.98 0.98log(Iν (8 µm)/Iν (160 µm)) versus log(Iν (160 µm)) 0.65 0.69log(Iν (8 µm)) versus log(Iν (250 µm)) 0.98 0.98log(Iν (8 µm)/Iν (250 µm)) versus log(Iν (250 µm)) 0.83 0.84log(Iν (8 µm)) versus log(Iν (3.6 µm)) 0.94 0.95log(Iν (8 µm)/Iν (250 µm)) versus log(Iν (3.6 µm)) 0.89 0.88log(Iν (8 µm)) versus Radius (Kpc) −0.82 −0.88
This paper has been typeset from a TEX/LATEX file prepared by the author.
MNRAS 448, 168–187 (2015)
at California Institute of T
echnology on April 2, 2015
http://mnras.oxfordjournals.org/
Dow
nloaded from