the rda for protein may not be adequate for older people
DESCRIPTION
The Recommended Dietary Allowance for Protein may not be adequate for Older People to maintain Skeletal Muscle - Wayne W. Campbell et al. - Journal of Gerontology (2001) Tags: aging, longevityTRANSCRIPT
Journal of Gerontology:
MEDICAL SCIENCES Copyright 2001 by The Gerontological Society of America
2001, Vol. 56A, No. 6, M373–M380
M373
The Recommended Dietary Allowance for Protein May Not Be Adequate for Older People to Maintain
Skeletal Muscle
Wayne W. Campbell,
1,2
Todd A. Trappe,
1,2
Robert R. Wolfe,
3
and William J. Evans
1,2
1
The
Donald W. Reynolds Department of Geriatrics, University of Arkansas for Medical Sciences, Little Rock.
2
The Geriatric Research, Education, and Clinical Center, Central Arkansas Veterans Healthcare System, Little Rock.
3
Metabolism Unit, Shriners Burns Institute and the University of Texas Medical Branch, Galveston.
Background
.
Inadequate dietary protein intake results in loss of skeletal muscle mass. Some shorter-term nitrogenbalance studies suggest that the Recommended Dietary Allowance (RDA) of protein may not be adequate for older peo-ple. The aim of this study was to assess the adequacy of the RDA of protein for older people by examining longer-termresponses in urinary nitrogen excretion, whole-body protein metabolism, whole-body composition, and mid-thigh mus-cle area.
Methods.
This was a 14-week precisely controlled diet study. Ten healthy, ambulatory men and women, aged 55 to
77 years, were provided eucaloric diets that contained 0.8 g protein·kg
�
1
·day
�
1
. The study was conducted at a GeneralClinical Research Center using an outpatient setting for 11 weeks and an inpatient setting for 3 weeks. The main out-come measures included urinary nitrogen excretion, postabsorptive and postprandial whole-body leucine kinetics via in-fusion of L-[1-
13
C]-leucine, whole-body density via hydrostatic weighing, total body water via deuterium oxide dilution,and mid-thigh muscle area via computed tomography scans.
Results
.
Mean urinary nitrogen excretion decreased over time from Weeks 2 to 8 to 14
(
p
�
.025). At Week 14,compared with Week 2, there were no changes in postabsorptive or postprandial leucine kinetics (turnover, oxidation,incorporation into protein via synthesis, release via breakdown, or balance). Whole-body composition (% body fat, fat-free mass, and protein
�
mineral mass) did not change over time in these weight-stable subjects. Mid-thigh muscle areawas decreased by
�
1.7
�
0.6 cm
2
(
p
�
.019) at Week 14 compared with Week 2. The loss of mid-thigh muscle areawas associated with the decrease in urinary nitrogen excretion (Spearman
r
�
.83,
p
�
.010).
Conclusions
.
The maintenance of whole-body leucine metabolism and whole-body composition is generally consis-tent with a successful adaptation to the RDA for protein. However, the decrease in mid-thigh muscle area and the asso-ciation with decreased urinary nitrogen excretion are consistent with a metabolic accommodation. These results suggestthat the RDA for protein may not be adequate to completely meet the metabolic and physiological needs of virtually allolder people.
HE current Recommended Dietary Allowance (RDA)for protein, 0.8 g protein·kg
�
1
·day
�
1
, is set as the safeand adequate intake for virtually all healthy men andwomen aged 19 years and older (1). Specific to the proteinRDA for older adults (age
�
50 years), several importantconsiderations were recognized. First, very little data wereavailable to help set an RDA for protein in older adults, andthe data that were available (2–5) were contradictory. Thus,the protein RDA for older men and women was basically anextrapolation from nitrogen balance studies in young men.Second, whereas significant changes in body composition,food intake, physical activity, and the frequency of diseaseoccur with aging, how such changes affect protein metabo-lism and dietary protein needs was largely unknown. Theconsensus was that, because of age-associated changes inbody composition, primarily the loss of muscle mass (sar-copenia), an RDA of 0.8 g protein·kg
�
1
·day
�
1
would behigher per unit of fat-free mass in older people than inyounger people and should allow for any decrease in the ef-ficiency of protein utilization (1).
The current consensus (1,6) is that adult protein allow-ances should be established from shorter-term (2–3-week)nitrogen balance studies. However, longer-term (severalweeks to several months) nitrogen balance studies should behighly valuable in assessing dietary protein adequacy by ad-ditional criteria, such as changes in protein metabolism,body composition, physical status, and functional status.Results of the limited number of shorter-term nitrogen bal-ance studies in older adults are conflicting, with some sup-porting (4,5) and others questioning (2,3,7) the adequacy of0.8 g protein·kg
�
1
·day
�
1
. Retrospective re-analyses (8) ofthese shorter-term nitrogen balance data, on the basis of cal-culations recommended by the 1985 Joint FAO/WHO/UNUExpert Consultation (6), support the conclusion that the pro-tein RDA may not be adequate for many older and elderlyadults. These conclusions (8) have been questioned (9,10).
To date, the longest-term nitrogen balance study in oldermen and women fed the RDA of 0.8 g protein·kg
�
1
·day
�
1
was 4 weeks (2). Three out of seven men and four out ofeight women were in negative nitrogen balance during Days
T
by guest on March 11, 2016
http://biomedgerontology.oxfordjournals.org/
Dow
nloaded from
M374
CAMPBELL ET AL.
26 to 30 of the study, and the authors concluded that 0.8 gprotein·kg
�
1
·day
�
1
was not adequate for a majority of menand women aged 70 years and older (2). More recently,Castaneda and colleagues (11,12) assessed the longer-termmetabolic and physiological changes of 66- to 79-year-old women who consumed either 0.45 or 0.92 g pro-tein·kg
�
1
·day
�
1
(56% or 115% of the RDA) for 9 weeks.The marked negative nitrogen balance, loss of body cellmass and muscle mass, reduced muscle strength, and im-paired immune responses all indicated that 0.45 g pro-tein·kg
�
1
·day
�
1
was inadequate and compromised the phys-ical and functional capacities of these elderly women. Incontrast, the apparent adequacy of 115% of the proteinRDA for elderly women was supported by the maintenanceof body composition, functional capacity, and immune re-sponses.
The present study assesses the adequacy of the RDA forprotein in older people in a longer-term nitrogen balancestudy. Older men and women were fed diets providing 0.8 gprotein·kg
�
1
·day
�
1
and sufficient energy to maintain bodyweight continuously for 14 weeks. The criteria of adequacyincluded measurements of urinary nitrogen excretion, whole-body protein metabolism, body composition, energy metab-olism, and muscle strength and function. It is hypothesizedthat the protein RDA is not adequate to maintain these indi-cators of metabolic, physical, and functional status.
M
ETHODS
Subjects
Four men and six women, aged 55 to 77 years, partici-pated in this metabolic study. The study was completed atthe General Clinical Research Center (GCRC) located at theUniversity Park campus of The Pennsylvania State Univer-sity. Prestudy medical evaluations, which included a medi-cal history questionnaire, a physician-administered physicalexamination, routine blood and urine chemistries, and aresting and resistance exercise electrocardiogram, were usedto exclude people with clinically abnormal thyroid, liver,kidney, or heart function. All six of the women studied werepostmenopausal and were not taking any estrogen replace-ment medications. Each subject signed an informed consentagreement. The study protocol and informed consent agree-ment were reviewed and approved by the Institutional Re-view Board, The Pennsylvania State University, UniversityPark, PA and by the Clinical Investigation Committee, TheMilton S. Hershey Medical Center, Hershey, PA.
Experimental Design
The study design was a 14-week precisely controlled di-etary intake trial. Testing and evaluations were completed atstudy Weeks 2, 8, and 14, as indicated. During these weeks,each subject was in residency at the GCRC. The remainderof the study was conducted on an outpatient basis.
Diet
Each subject’s diet was designed to provide 0.8 g pro-tein·kg
�
1
·day
�
1
and sufficient dietary energy to maintainbody weight. The diet was provided as a rotating cycle ofthree daily menus of lacto-ovo-vegetarian foods, as de-
scribed by Campbell and colleagues (13). Whereas animalstriated tissues (i.e., beef, pork, poultry, fish) were not used,animal-based proteins were provided in the forms of milk-based proteins (28.5%
�
1.2% of total protein) and egg-based proteins (10.2%
�
0.8% of total protein). The non-protein portion of each of the three menus contained 60% ofenergy from carbohydrate and 40% of energy from fat. Wa-ter, decaffeinated coffee, and decaffeinated tea were al-lowed ad libitum.
The total energy intake of each subject was initially seton the basis of the sex-specific Harris-Benedict equation(14) of resting energy expenditure plus an allowance of 0.7times this predicted resting energy expenditure to accountfor the energy expenditure of physical activity. Total energyintake was adjusted during the nonresidency periods as nec-essary to maintain body weight within
�
0.5 kg of each sub-ject’s mean body weight during Days 4 to 15. The adjust-ments to total energy intake were done either by adding orsubtracting protein-free or very-low–protein foods and bev-erages from each subject’s daily menus while maintainingthe nonprotein energy ratio at 60% carbohydrate to 40% fat.The energy and macronutrient contents of the daily menuswere calculated using Nutritionist IV software (version 4.0;N-squared Computing, First Data Band, San Bruno, CA) as-suming that the metabolizable energy content of protein,carbohydrate, and fat were 16.7, 16.7, and 37.7 kJ/g, respec-tively.
Resting Energy Expenditure
Postabsorptive resting energy expenditure was measuredat Weeks 2 and 14 by indirect calorimetry, as described byCampbell and colleagues (13).
Body Composition
Postabsorptive, nude body weight was measured (model2181; Toledo Scale, Toledo, OH) to the nearest 0.1 kg eachweekday during the study, as described previously (13).Body height was measured to the nearest 0.1 cm with awall-mounted stadiometer one morning during Week 1.
Whole-body density was measured by hydrostatic weigh-ing (15), with lung residual volume measured by nitrogendilution (16) during the underwater procedure. Total bodywater was measured by the deuterium oxide dilution tech-nique (17) using a 20.0 g dose of deuterium oxide and afixed-filter single-beam infrared spectrophotometer (Miran1FF; Foxboro Analytical, South Norwalk, CT) for analysesof prepared urine samples, as described by Campbell andcolleagues (18). Percent body fat was calculated from bodydensity and total body water using the 3-compartment equa-tion of Siri (19), as described previously (18). Fat-free mass(FFM) was calculated as body mass minus fat mass, andprotein plus mineral mass was calculated as FFM minusbody water mass.
Mid-thigh muscle and fat areas were measured by imageanalyses (IMAGE, version 1.60; National Institutes of Health,Bethesda, MD) of computed tomography (CT) scans (Picker2000 operating at 130 kVp; Picker International Inc., Cleve-land, OH). The CT scans were taken of the dominant leg atWeeks 2 and 14; a 10-mm CT slice was taken midway be-tween the inguinal crease and the lower pole of the patella.
by guest on March 11, 2016
http://biomedgerontology.oxfordjournals.org/
Dow
nloaded from
THE RDA FOR PROTEIN AND OLDER ADULTS
M375
At Week 2, the exact location of the mid-thigh CT sliceswere determined from bony landmarks on the femur andwere used to identify the identical slice location for theWeek-14 scans. Digital Imaging and Communication inMedicine (DIACOM) software (version 3.0) was used tomaintain spatial and density calibration during the transferof the images from the CT scanner to a SUN (SPARK) sta-tion for imaging analysis. Digitized images, analyzed in ablinded fashion, were used to calculate the total muscle andsubcutaneous fat areas. The Hounsfield units used to detectmuscle and fat were
�
30 to
�
150 and
�
250 to
�
40, re-spectively. Computed tomography data from two subjectswere inadvertently lost during processing. Therefore, resultsare presented for eight subjects (3 men and 5 women).
Muscle Strength and Power
Dynamic concentric muscle strength was measured as themaximum force that each subject could move through a fullrange of motion one time only for the seated chest press,seated arm pull, seated unilateral knee extension, and seatedbilateral leg curl exercises (Keiser Sports Health Equip-ment, Fresno, CA). Upper-body strength was calculated asthe sum of the linear forces (newtons) of the chest press andarm pull exercises. Lower-body strength was calculated asthe sum of the angular forces (newton
�
meter) of the kneeextension and leg curl exercises. Peak leg power was mea-sured using a NUMAZ (University of Nottingham, UK)power rig (20). Subjects were asked to exert a maximal pushof both legs to a large foot pedal while in a seated positionwith folded arms. The highest value (watts) from 10 trialswas recorded, with each trail separated by a minimum of 60seconds of rest.
Nitrogen Intake and Excretion
At Weeks 2, 8, and 14, samples from duplicate menucomposites, four consecutive 24-hour urine collections, andfour-day fecal collections (made between two dye markers)were collected, processed, and aliquots stored frozen at
�
20
�
C. All food, urine, and feces samples were analyzedfor total nitrogen using an Elementar Macro N (ElementarAnalysensytene GmBh, Hanau, Germany) nitrogen ana-lyzer. The National Institute of Standards and TechnologiesTotal Diet standard reference material and in-house pooledfood and urine standards were used as quality controls. Di-etary protein intake was calculated from the food nitrogendata assuming a factor of 6.25 g protein·g nitrogen
�
1
.
Infusion Procedure
At the end of Weeks 2 and 14, a primed constant infusionof L-[1-
13
C]leucine was performed, as described previously(21), to determine postabsorptive and postprandial leucinekinetics. After baseline blood and expired breath sampleswere collected, the infusion of the isotope was begun withthe intravenous administration of priming doses of NaH
13
CO
3
(2.35
mol·kg
�
1
) and L-[1-
13
C]leucine (7.6
mol·kg
�
1
).This was followed immediately by a continuous infusionof L-[1-
13
C]leucine (7.6
mol·kg
�
1
·hour
�
1
) using a cali-brated syringe pump (model 55-2222; Harvard Apparatus,Natick, MA).
The constant infusion was continued for 8 hours, with allsubjects in the postabsorptive state during the first 4 hoursand in the postprandial state during the last 4 hours. Duringthe postprandial period, each subject consumed a formulabeverage hourly (minutes 240, 300, 360, and 420 of theinfusion procedure) providing one-twelfth of their dailyprotein and energy intakes at baseline. The dietary leucineconcentration of each formula beverage was estimated as-suming factors of 6.38 g protein/g nitrogen and 95 mg leu-cine/g protein (6). All blood and breath samples were ob-tained and processed using standard methods (21,22). The
13
C enrichment of plasma
-ketoisocaproic acid (KIC) wasdetermined by gas chromatography mass spectrometry(model HP 5989; Hewlett-Packard, Palo Alto, CA) usingthe silylquinoxalinol derivative (22). The expired air sam-ples were analyzed for
13
CO
2
enrichment by isotope ratiomass spectrometry (model cira 2; VG Isogas, VG Instru-ments, Middlewich, UK). Prior to and during the fourth andeighth hours of the infusion, the rate of CO
2
production wasmeasured by indirect calorimetry using a ventilated hoodsystem.
Calculations
All kinetics parameters are expressed as
mol leu-cine·kg
�
1
·hour
�
1
. The parameters included leucine turn-over, leucine oxidation, leucine incorporation into protein(synthesis), leucine release from protein (breakdown), andleucine intake from the diet. Leucine turnover was calcu-lated as described by Matthews and colleagues (23), withthe intracellular leucine pool estimated by the plasma [
13
C]KlC enrichment at plateau (24). The rate of leucine oxida-tion was calculated as described previously (23), assumingfractional bicarbonate retention factors in the postabsorptiveand postprandial states of 0.70 and 0.82, respectively (25).Synthesis was calculated as turnover minus oxidation.Breakdown was calculated as turnover minus intake. In thepostabsorptive state intake from diet was zero, and break-down equaled turnover. In the postprandial state intake wascorrected for the amount of leucine estimated to be removedduring the first pass through the splanchnic tissues (50%)(26). Predicted 24-hour leucine balance (input
�
output,
mol·kg
�
1
) was calculated from leucine intake (dietary)and leucine oxidation, as described by El-Khoury and col-leagues (27).
Serum Albumin
A postabsorptive-state serum sample collected at baselineof the infusion procedure was analyzed for albumin concen-tration using an automated analyzer technique at a clinicalmedical laboratory (American Medical Laboratory, Chan-tilly, VA).
Statistical Methods
Values are reported as means
�
SEM
. The effect of timewas assessed either by paired
t
test (Week 2 vs Week 14)or one-factor repeated measures analysis of variance(ANOVA) (Weeks 2, 8, and 14). For these paired
t
tests,statistical significance was assigned if
p
�
.05 (two-sided).For the one-factor repeated measures ANOVA, when a sta-tistically significant time effect was established, separate
by guest on March 11, 2016
http://biomedgerontology.oxfordjournals.org/
Dow
nloaded from
M376
CAMPBELL ET AL.
comparisons (paired
t
tests) were done among time points(i.e., Weeks 2 vs 8, Weeks 2 vs 14, and Weeks 8 vs 14). Forthese comparisons, the Bonferroni correction was applied,and statistical significance was assigned if
p
�
.017 (two-sided). For the leucine kinetics data, a two-factor repeatedmeasures ANOVA was used to assess the main effects ofmetabolic state (postabsorptive vs postprandial) and time(Weeks 2 vs 14) and the metabolic state-by-time interaction.For these tests, statistical significance was assigned if
p
�
.05. The degree of linear association between variables wasestablished by using the Spearman Rho nonparametricranked correlation (Prob
�
|Rho|,
p
�
.05). All data wereprocessed using Microsoft Excel 5.0 (Microsoft, Redmond,WA). Statistical evaluations were done using JMP software(version 3.2.2; SAS Institute, Inc., Cary, NC).
R
ESULTS
Table 1 presents the group mean values for the descrip-tive characteristics, body composition, mid-thigh muscleand fat areas, resting metabolic rate, and serum albuminconcentration, at Week 2 and Week 14. Body weight, BMI,body density, total body water, % body fat, FFM, protein-mineral mass, mid-thigh circumference and fat area, restingmetabolic rate, and serum albumin were not different atWeek 14 compared with Week 2. Mid-thigh muscle areawas decreased by
�
1.7
�
0.6 cm
2 (p � .019; n � 8) atWeek 14 compared with Week 2.
Upper body strength (672 � 98 N vs 657 � 89 N; n � 8),lower body strength (297 � 42 Nm vs 288 � 33 Nm; n �8), and leg peak power (222 � 47 W vs 216 � 44 W; n � 7)were not different at Week 14 compared with Week 2.
From computer-based diet analyses, the group mean di-etary intakes at Week 2 were 9.99 � 0.75 MJ energy/d, 52.9 �3.0 g protein/d, 347 � 43.3 g carbohydrate/d, and 95.5 �7.4 g fat/d and were not significantly different at Week 8and Week 14 (Table 2). On the basis of nitrogen analysis,the group mean protein intakes at Weeks 2, 8, and 14 were0.821 � 0.008, 0.819 � 0.009, and 0.813 � 0.009 g pro-
tein·kg�1·day�1. These levels of protein intake representabout 102% of the current RDA of protein (1).
Dietary nitrogen intake was 131.3 � 1.3 g N·kg�1·day�1
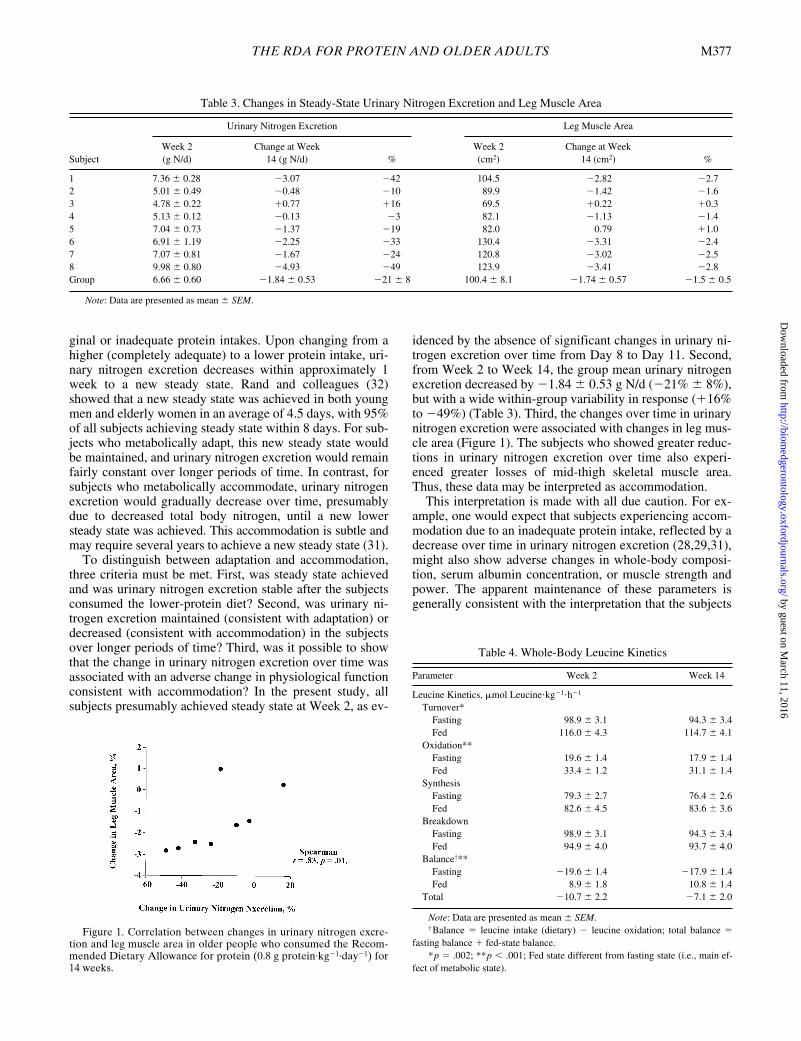
at Week 2 and was not different over time (i.e., at Week 8and Week 14; Table 2). At Week 2, urinary nitrogen excre-tion of each subject did not change over the four days ofcollection (i.e., no significant slope was observed when re-gression analysis was performed), consistent with each sub-ject being in steady state. Over time, urinary nitrogen excre-tion decreased (p � .025), and fecal nitrogen excretion wasnot different. Subsequent paired t test analyses (with Bon-ferroni correction) showed that urinary nitrogen excretionwas different between Week 2 and Week 14 (p � .005).From Week 2 to Week 14, the change in urinary nitrogenexcretion was associated with the change in mid-thigh mus-cle area (r � .83, p � .010; Table 3 and Figure 1).
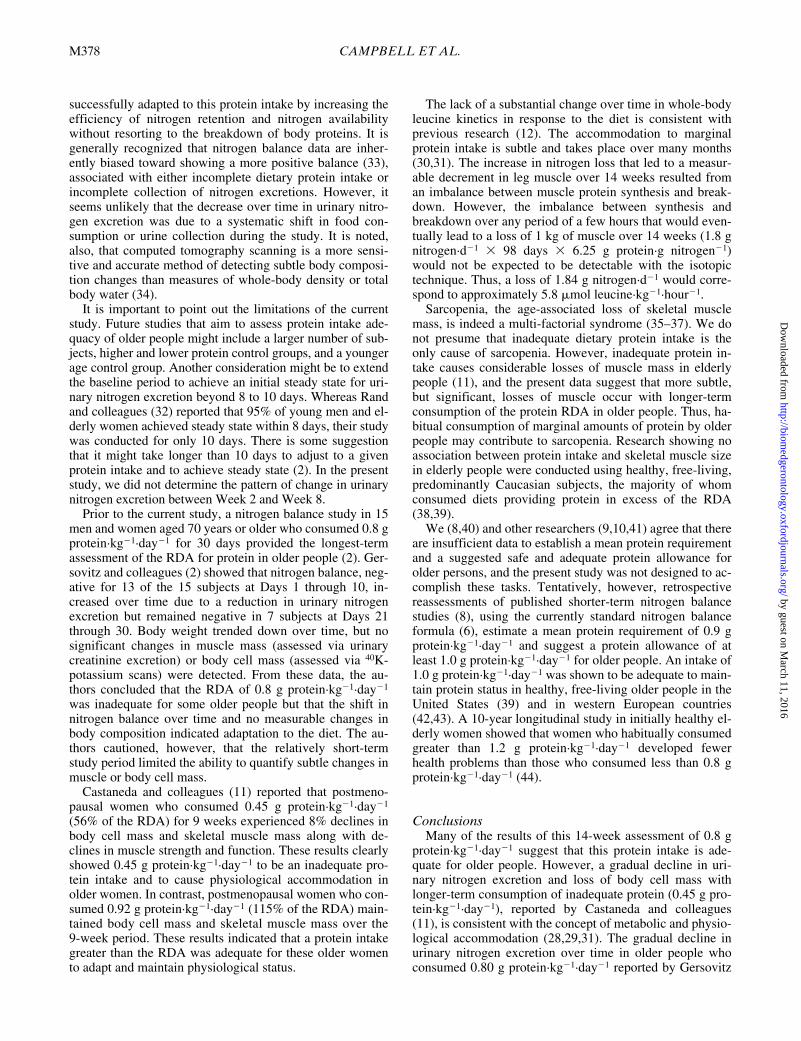
Table 4 presents the whole-body leucine kinetics data.Leucine turnover and oxidation were higher, and synthesisand breakdown were not different in the postprandial stateversus the postabsorptive state. Postabsorptive leucine bal-ance was negative, and postprandial leucine balance waspositive. Net leucine balance was negative. There were nosignificant changes over time or metabolic state- (postab-sorptive vs postprandial) by-time interactions for any of theleucine kinetics parameters.
DISCUSSION
When longer-term metabolic balance studies are used toassess the adequacy of protein intake, it is important to dis-tinguish between adaptation and accommodation (28–31).Adaptation, an appropriate and desired response, refers tometabolic changes that occur in response to changes in pro-tein intake and result in the establishment of a new steadystate without a compromise or loss in physiological func-tion. Accommodation, a survival response, refers to furthermetabolic changes in response to the decreased protein in-take that the body undergoes to establish steady state, butonly with a compromise or loss in physiological function.
Waterlow (30,31) and Young and colleagues (28,29) haveproposed that it might be possible to distinguish betweenadaptation and accommodation by measuring longer-termchanges in urinary nitrogen excretion in response to mar-
Table 1. Subject Characteristics
Parameter Week 2 Week 14
Age, y† 66 � 3 (range 55–77)Height, cm 167 � 3Weight, kg 67.7 � 4.1 67.7 � 4.0Body mass index, kg/m2 24.2 � 1.0 24.2 � 0.9Body density, kg/l 1.020 � 0.006 1.019 � 0.006Total body water, l 28.9 � 2.3 27.8 � 3.0Body fat, % 38.7 � 2.8 40.1 � 3.0Fat-free mass, kg 42.1 � 3.1 41.0 � 3.0Protein-mineral mass, kg 12.5 � 0.9 12.6 � 0.9Thigh circumference, cm 50.9 � 1.6 50.9 � 1.6Thigh muscle area, cm2 100.4 � 8.0 98.7 � 7.5*Thigh fat area, cm2 76.8 � 8.0 78.3 � 14.1Resting metabolic rate, MJ/d 5.67 � 0.33 5.65 � 0.38Albumin (serum), g/l 39 � 3 40 � 3
Note: Data are presented as mean � SEM, n � 10 subjects, except for thighcircumference, muscle area, and fat area (n � 8 subjects).
*Significantly different from Week 2; p � .019.†The ages of the subjects were 55, 56, 58, 62, 63, 68, 71, 72, 76, and 77.
Table 2. Dietary Energy, Macronutrient Intakes, andNitrogen Excretions
Parameter Week 2 Week 8 Week 14
Dietary IntakesEnergy
MJ/d 9.99 � 0.75 10.99 � 1.08 10.95 � 0.99kcal/d 2388 � 180 2626 � 259 2617 � 236
Protein, g/d 52.9 � 3.0 52.9 � 2.9 53.0 � 2.9Carbohydrate, g/d 347.2 � 43.3 364.6 � 39.7 362.2 � 35.4Fat, g/d 95.5 � 7.4 105.3 � 10.2 106.3 � 9.5
Nitrogen Intakes and Excretions (mg N�kg�1�d�1)Nitrogen intake 131.3 � 1.3 131.0 � 1.5 130.1 � 1.5Urinary nitrogen excretion* 102.9 � 4.4 87.7 � 4.1 80.2 � 4.3**Fecal nitrogen excretion 23.7 � 2.0 25.2 � 2.3 22.1 � 2.4
Note: Data are presented as mean � SEM.*Time effect; p � .025.**Different from Week 2; p � .005.
by guest on March 11, 2016
http://biomedgerontology.oxfordjournals.org/
Dow
nloaded from
THE RDA FOR PROTEIN AND OLDER ADULTS M377
ginal or inadequate protein intakes. Upon changing from ahigher (completely adequate) to a lower protein intake, uri-nary nitrogen excretion decreases within approximately 1week to a new steady state. Rand and colleagues (32)showed that a new steady state was achieved in both youngmen and elderly women in an average of 4.5 days, with 95%of all subjects achieving steady state within 8 days. For sub-jects who metabolically adapt, this new steady state wouldbe maintained, and urinary nitrogen excretion would remainfairly constant over longer periods of time. In contrast, forsubjects who metabolically accommodate, urinary nitrogenexcretion would gradually decrease over time, presumablydue to decreased total body nitrogen, until a new lowersteady state was achieved. This accommodation is subtle andmay require several years to achieve a new steady state (31).
To distinguish between adaptation and accommodation,three criteria must be met. First, was steady state achievedand was urinary nitrogen excretion stable after the subjectsconsumed the lower-protein diet? Second, was urinary ni-trogen excretion maintained (consistent with adaptation) ordecreased (consistent with accommodation) in the subjectsover longer periods of time? Third, was it possible to showthat the change in urinary nitrogen excretion over time wasassociated with an adverse change in physiological functionconsistent with accommodation? In the present study, allsubjects presumably achieved steady state at Week 2, as ev-
idenced by the absence of significant changes in urinary ni-trogen excretion over time from Day 8 to Day 11. Second,from Week 2 to Week 14, the group mean urinary nitrogenexcretion decreased by �1.84 � 0.53 g N/d (�21% � 8%),but with a wide within-group variability in response (�16%to �49%) (Table 3). Third, the changes over time in urinarynitrogen excretion were associated with changes in leg mus-cle area (Figure 1). The subjects who showed greater reduc-tions in urinary nitrogen excretion over time also experi-enced greater losses of mid-thigh skeletal muscle area.Thus, these data may be interpreted as accommodation.
This interpretation is made with all due caution. For ex-ample, one would expect that subjects experiencing accom-modation due to an inadequate protein intake, reflected by adecrease over time in urinary nitrogen excretion (28,29,31),might also show adverse changes in whole-body composi-tion, serum albumin concentration, or muscle strength andpower. The apparent maintenance of these parameters isgenerally consistent with the interpretation that the subjects
Table 3. Changes in Steady-State Urinary Nitrogen Excretion and Leg Muscle Area
Subject
Urinary Nitrogen Excretion Leg Muscle Area
Week 2(g N/d)
Change at Week14 (g N/d) %
Week 2(cm2)
Change at Week14 (cm2) %
1 7.36 � 0.28 �3.07 �42 104.5 �2.82 �2.72 5.01 � 0.49 �0.48 �10 89.9 �1.42 �1.63 4.78 � 0.22 �0.77 �16 69.5 �0.22 �0.34 5.13 � 0.12 �0.13 �3 82.1 �1.13 �1.45 7.04 � 0.73 �1.37 �19 82.0 0.79 �1.06 6.91 � 1.19 �2.25 �33 130.4 �3.31 �2.47 7.07 � 0.81 �1.67 �24 120.8 �3.02 �2.58 9.98 � 0.80 �4.93 �49 123.9 �3.41 �2.8Group 6.66 � 0.60 �1.84 � 0.53 �21 � 8 100.4 � 8.1 �1.74 � 0.57 �1.5 � 0.5
Note: Data are presented as mean � SEM.
Figure 1. Correlation between changes in urinary nitrogen excre-tion and leg muscle area in older people who consumed the Recom-mended Dietary Allowance for protein (0.8 g protein·kg�1·day�1) for14 weeks.
Table 4. Whole-Body Leucine Kinetics
Parameter Week 2 Week 14
Leucine Kinetics, mol Leucine�kg�1�h�1
Turnover*Fasting 98.9 � 3.1 94.3 � 3.4Fed 116.0 � 4.3 114.7 � 4.1
Oxidation**Fasting 19.6 � 1.4 17.9 � 1.4Fed 33.4 � 1.2 31.1 � 1.4
SynthesisFasting 79.3 � 2.7 76.4 � 2.6Fed 82.6 � 4.5 83.6 � 3.6
BreakdownFasting 98.9 � 3.1 94.3 � 3.4Fed 94.9 � 4.0 93.7 � 4.0
Balance†**Fasting �19.6 � 1.4 �17.9 � 1.4Fed 8.9 � 1.8 10.8 � 1.4
Total �10.7 � 2.2 �7.1 � 2.0
Note: Data are presented as mean � SEM. †Balance � leucine intake (dietary) � leucine oxidation; total balance �
fasting balance � fed-state balance.*p � .002; **p � .001; Fed state different from fasting state (i.e., main ef-
fect of metabolic state).
by guest on March 11, 2016
http://biomedgerontology.oxfordjournals.org/
Dow
nloaded from
M378 CAMPBELL ET AL.
successfully adapted to this protein intake by increasing theefficiency of nitrogen retention and nitrogen availabilitywithout resorting to the breakdown of body proteins. It isgenerally recognized that nitrogen balance data are inher-ently biased toward showing a more positive balance (33),associated with either incomplete dietary protein intake orincomplete collection of nitrogen excretions. However, itseems unlikely that the decrease over time in urinary nitro-gen excretion was due to a systematic shift in food con-sumption or urine collection during the study. It is noted,also, that computed tomography scanning is a more sensi-tive and accurate method of detecting subtle body composi-tion changes than measures of whole-body density or totalbody water (34).
It is important to point out the limitations of the currentstudy. Future studies that aim to assess protein intake ade-quacy of older people might include a larger number of sub-jects, higher and lower protein control groups, and a youngerage control group. Another consideration might be to extendthe baseline period to achieve an initial steady state for uri-nary nitrogen excretion beyond 8 to 10 days. Whereas Randand colleagues (32) reported that 95% of young men and el-derly women achieved steady state within 8 days, their studywas conducted for only 10 days. There is some suggestionthat it might take longer than 10 days to adjust to a givenprotein intake and to achieve steady state (2). In the presentstudy, we did not determine the pattern of change in urinarynitrogen excretion between Week 2 and Week 8.
Prior to the current study, a nitrogen balance study in 15men and women aged 70 years or older who consumed 0.8 gprotein·kg�1·day�1 for 30 days provided the longest-termassessment of the RDA for protein in older people (2). Ger-sovitz and colleagues (2) showed that nitrogen balance, neg-ative for 13 of the 15 subjects at Days 1 through 10, in-creased over time due to a reduction in urinary nitrogenexcretion but remained negative in 7 subjects at Days 21through 30. Body weight trended down over time, but nosignificant changes in muscle mass (assessed via urinarycreatinine excretion) or body cell mass (assessed via 40K-potassium scans) were detected. From these data, the au-thors concluded that the RDA of 0.8 g protein·kg�1·day�1
was inadequate for some older people but that the shift innitrogen balance over time and no measurable changes inbody composition indicated adaptation to the diet. The au-thors cautioned, however, that the relatively short-termstudy period limited the ability to quantify subtle changes inmuscle or body cell mass.
Castaneda and colleagues (11) reported that postmeno-pausal women who consumed 0.45 g protein·kg�1·day�1
(56% of the RDA) for 9 weeks experienced 8% declines inbody cell mass and skeletal muscle mass along with de-clines in muscle strength and function. These results clearlyshowed 0.45 g protein·kg�1·day�1 to be an inadequate pro-tein intake and to cause physiological accommodation inolder women. In contrast, postmenopausal women who con-sumed 0.92 g protein·kg�1·day�1 (115% of the RDA) main-tained body cell mass and skeletal muscle mass over the9-week period. These results indicated that a protein intakegreater than the RDA was adequate for these older womento adapt and maintain physiological status.
The lack of a substantial change over time in whole-bodyleucine kinetics in response to the diet is consistent withprevious research (12). The accommodation to marginalprotein intake is subtle and takes place over many months(30,31). The increase in nitrogen loss that led to a measur-able decrement in leg muscle over 14 weeks resulted froman imbalance between muscle protein synthesis and break-down. However, the imbalance between synthesis andbreakdown over any period of a few hours that would even-tually lead to a loss of 1 kg of muscle over 14 weeks (1.8 gnitrogen·d�1 � 98 days � 6.25 g protein·g nitrogen�1)would not be expected to be detectable with the isotopictechnique. Thus, a loss of 1.84 g nitrogen·d�1 would corre-spond to approximately 5.8 mol leucine·kg�1·hour�1.
Sarcopenia, the age-associated loss of skeletal musclemass, is indeed a multi-factorial syndrome (35–37). We donot presume that inadequate dietary protein intake is theonly cause of sarcopenia. However, inadequate protein in-take causes considerable losses of muscle mass in elderlypeople (11), and the present data suggest that more subtle,but significant, losses of muscle occur with longer-termconsumption of the protein RDA in older people. Thus, ha-bitual consumption of marginal amounts of protein by olderpeople may contribute to sarcopenia. Research showing noassociation between protein intake and skeletal muscle sizein elderly people were conducted using healthy, free-living,predominantly Caucasian subjects, the majority of whomconsumed diets providing protein in excess of the RDA(38,39).
We (8,40) and other researchers (9,10,41) agree that thereare insufficient data to establish a mean protein requirementand a suggested safe and adequate protein allowance forolder persons, and the present study was not designed to ac-complish these tasks. Tentatively, however, retrospectivereassessments of published shorter-term nitrogen balancestudies (8), using the currently standard nitrogen balanceformula (6), estimate a mean protein requirement of 0.9 gprotein·kg�1·day�1 and suggest a protein allowance of atleast 1.0 g protein·kg�1·day�1 for older people. An intake of1.0 g protein·kg�1·day�1 was shown to be adequate to main-tain protein status in healthy, free-living older people in theUnited States (39) and in western European countries(42,43). A 10-year longitudinal study in initially healthy el-derly women showed that women who habitually consumedgreater than 1.2 g protein·kg�1·day�1 developed fewerhealth problems than those who consumed less than 0.8 gprotein·kg�1·day�1 (44).
ConclusionsMany of the results of this 14-week assessment of 0.8 g
protein·kg�1·day�1 suggest that this protein intake is ade-quate for older people. However, a gradual decline in uri-nary nitrogen excretion and loss of body cell mass withlonger-term consumption of inadequate protein (0.45 g pro-tein·kg�1·day�1), reported by Castaneda and colleagues(11), is consistent with the concept of metabolic and physio-logical accommodation (28,29,31). The gradual decline inurinary nitrogen excretion over time in older people whoconsumed 0.80 g protein·kg�1·day�1 reported by Gersovitz
by guest on March 11, 2016
http://biomedgerontology.oxfordjournals.org/
Dow
nloaded from
THE RDA FOR PROTEIN AND OLDER ADULTS M379
and colleagues (2) suggests that the RDA might be margin-ally inadequate and result in longer-term accommodation inskeletal muscle. The loss of skeletal muscle reported in thepresent study supports this suggestion. The RDAs are de-fined as “the levels of intake of essential nutrients that, onthe basis of scientific knowledge, are judged . . . to be ade-quate to meet the known nutrient needs of practically allhealthy persons” (1). Research should continue to questionwhether the RDA for protein is indeed adequate to meet thedietary needs of older people.
Acknowledgments
This study was supported by National Institutes of Health Grants RO1AG11811 and 1 R29 AG13409 and General Clinical Research Center GrantMO1 RR10732.
We are grateful for the cooperation of the volunteers in this study. Spe-cial thanks go to the staff members of the GCRC nursing and metabolickitchen for providing expert support for this study. We especially thankDeanna Cyr-Campbell, MS, RD, for developing the diets and coordinatingthe production and distribution of the menus.
Address correspondence to W.J. Evans, Nutrition, Metabolism and Exer-cise Division, Renolds Department of Geriatrics and GRECC, 4301 WestMarkham Street, Slot 806, Little Rock, AR 72205. E-mail: [email protected]
References
1. National Research Council. Recommended Dietary Allowances. 10thed. Washington, DC: National Academy Press; 1989.
2. Gersovitz M, Munro H, Scrimshaw N, Young V. Human protein re-quirements: assessment of the adequacy of the current recommendeddietary allowance for dietary protein in elderly men and women. Am JClin Nutr. 1982;35:6–14.
3. Uauy R, Scrimshaw N, Young V. Human protein requirements: nitro-gen balance response to graded levels of egg protein in elderly menand women. Am J Clin Nutr. 1978;31:779–785.
4. Zanni E, Calloway D, Zezulka A. Protein requirements of elderly men.J Nutr. 1979;109:513–524.
5. Cheng A, Gomez A, Bergan J, Tung-Ching L, Monckeberg F, Chi-chester C. Comparative nitrogen balance study between young andaged adults using three levels of protein intake from a combinationwheat-soy-milk mixture. Am J Clin Nutr. 1978;31:12–22.
6. FAO/WHO/UNU. Energy and Protein Requirements. Geneva, Swit-zerland: World Health Organization; 1985. (Technical Report Series724).
7. Bunker VW, Lawson MS, Stanfield MF, Clayton BE. Nitrogen bal-ance studies in apparently healthy elderly people and those who arehousebound. Br J Nutr. 1987;57:211–221.
8. Campbell WW, Crim MC, Dallal GE, Young VR, Evans WJ. In-creased protein requirements in elderly people: new data andretrospective reassessments. Am J Clin Nutr. 1994;60:501–509.
9. Millward DJ, Roberts SB. Protein requirements of older individuals.Nutr Res Rev. 1996;9:67–87.
10. Millward DJ, Fereday A, Gibson N, Pacy PJ. Aging, protein require-ments, and protein turnover. Am J Clin Nutr. 1997;66:774–786.
11. Castaneda C, Charnley JM, Evans WJ, Crim MC. Elderly women ac-commodate to a low-protein diet with losses of body cell mass, musclefunction, and immune response. Am J Clin Nutr. 1995;62:30–39.
12. Castaneda C, Dolnikowski GG, Dallal GE, Evans WJ, Crim M. Pro-tein turnover and energy metabolism of elderly women fed a low-protein diet. Am J Clin Nutr. 1995;62:40–48.
13. Campbell WW, Cyr-Campbell D, Weaver JA, Evans WJ. Energy re-quirement for long-term body weight maintenance in older women.Metabolism. 1997;46:884–889.
14. Harris JA, Benedict FG. A Biometric Study of Basal Metabolism inMan. Washington, DC: Carnegie Institute of Washington; 1919.
15. Akers R, Buskirk ER. An underwater weighing system utilizing “forcecube” transducers. J Appl Physiol. 1969;26:649–652.
16. Wilmore JH. A simplified method for determination of residual lungvolumes. J Appl Physiol. 1969;27:96–100.
17. Schloerb PR, Friis-Hansen BJ, Edelman IS, Solomon AK, Moore FD.The measurement of total body water in the human subject by deute-rium oxide dilution. J Clin Invest. 1950;29:1296–1310.
18. Campbell WW, Crim MC, Young VR, Evans WJ. Increased energy re-quirements and body composition changes with resistance training inolder adults. Am J Clin Nutr. 1994;60:167–175.
19. Siri WE. Body composition from fluid spaces and density: analysis ofmethods. In: Brozek J, Henschel A, eds. Techniques for MeasuringBody Composition. Washington, DC: National Academy of Sciences;1961:223–244.
20. Bassey EJ, Short AH. A new method for measuring power output in asingle leg extension: feasibility, reliability, and validity. E J ApplPhysiol Occup Physiol. 1990;60:385–390.
21. Campbell WW, Crim MC, Young VR, Joseph LJ, Evans WJ. Effectsof resistance training and dietary protein intake on protein metabolismin older adults. Am J Physiol. 1995;268:E1143–E1153.
22. Wolfe RR. Radioactive and Stable Isotope Tracers in Biomedicine:Principles and Practice of Kinetic Analysis. New York: Wiley-Liss;1992.
23. Matthews DE, Motil KJ, Rohrbaugh DK, Burke JF, Young VR, BierDM. Measurement of leucine metabolism in man from a primed, con-tinuous infusion of L-[1-13C] leucine. Am J Physiol. 1980;238:E473–E479.
24. Matthews D, Schwarz H, Yang R, Motil K, Young V, Bier D. Rela-tionship of plasma leucine and a-ketoisocaproate during a L-[1-13C]leucine infusion in man: a method for measuring human intracellularleucine tracer enrichment. Metabolism. 1982;31:1105–1112.
25. Hoerr RA, Yu YM, Wagner DA, Burke JF, Young VR. Recovery of13C in breath from NaH13CO3 infused by gut and vein: effect of feed-ing. Am J Physiol. 1989;257(Endocrinol. Metab. 20):E426–E438.
26. Boirie Y, Gachon P, Beaufrere B. Splanchnic and whole-body leucinekinetics in young and elderly men. Am J Clin Nutr. 1997;65:489–495.
27. El-Khoury AE, Fukagawa NK, Sanchez M, et al. Validation of thetracer-balance concept with reference to leucine: 24-h intravenoustracer studies with L-[1–13C]leucine and [15N–15N]urea. Am J ClinNutr. 1994;59:1000–1011.
28. Young VR. Kinetics of human amino acid metabolism: nutritional im-plications and some lessons. Am J Clin Nutr. 1987;46:709–725.
29. Young VR, Marchini JS. Mechanisms and nutritional significance ofmetabolic responses to altered intakes of protein and amino acids, withreference to nutritional adaptation in humans. Am J Clin Nutr. 1990;51:270–289.
30. Waterlow JC. Protein turnover with special reference to man. Q J ExpPhysiol. 1984;69:405–438.
31. Waterlow JC. Nutritional adaptation in man: general introduction andconcepts. Am J Clin Nutr. 1990;51:259–263.
32. Rand WM, Young VR, Scrimshaw NS. Change of urinary nitrogen ex-cretion in response to low-protein diets in adults. Am J Clin Nutr.1976;29:639–644.
33. Kopple JD. Uses and limitations of the balance technique. JPEN.1987;11(suppl 5):S79–S85.
34. Nelson ME, Fiatarone MA, Layne JE, et al. Analysis of body-compo-sition techniques and models for detecting change in soft tissue withstrength training. Am J Clin Nutr. 1996;63:678–686.
35. Evans WJ, Campbell WW. Sarcopenia and age-related changes inbody composition and functional capacity. J Nutr. 1993;123:465–468.
36. Evans WJ. What is sarcopenia? J Gerontol Biol Sci Med Sci. 1995;50A(special issue):5–8.
37. Dutta C, Hadley EC. The significance of sarcopenia in old age. J Ger-ontol Biol Sci Med Sci. 1995;50A(special issue):1–4.
38. Baumgartner RN, Koehler KM, Romero L, Garry PJ. Serum albuminis associated with skeletal muscle in elderly men and women. Am JClin Nutr. 1996;64:552–558.
39. Munro HN, McGandy RB, Hartz SC, Russell RM, Jacob RA, Otra-dovec CL. Protein nutriture of a group of free-living elderly. Am J ClinNutr. 1987;46:586–592.
40. Campbell WW, Evans WJ. Protein requirements of elderly people.Eur J Clin Nutr. 1996;50(suppl 1):S180–S185.
41. Fereday A, Gibson NR, Cox M, Pacy PJ, Millward DJ. Protein re-quirements and ageing: metabolic demand and efficiency ofutilization. Br J Nutr. 1997;77:685–702.
by guest on March 11, 2016
http://biomedgerontology.oxfordjournals.org/
Dow
nloaded from
M380 CAMPBELL ET AL.
42. Moreiras O, van Staveren WA, Amorim-Cruz JA, et al. Longitudinalchanges in the intake of energy and macronutrients of elderly Europe-ans. SENECA investigators. Eur J Clin Nutr. 1996;50(suppl 2):S67–S76.
43. Lesourd B, Decarli B, Dirren H. Longitudinal changes in iron and pro-tein status of elderly Europeans. SENECA investigators. Eur J ClinNutr. 1996;50(suppl 2):S16–S24.
44. Vellas BJ, Hunt WC, Romero LJ, Koehler KM, Baumgartner RN,Garry PJ. Changes in nutritional status and patterns of morbidity
among [free-living elderly persons:] a 10-year longitudinal study. Nu-trition. 1997;13:515–519.
Received April 27, 2000Accepted May 2, 2000Decision Editor: John E. Morley, MB, BCh
by guest on March 11, 2016
http://biomedgerontology.oxfordjournals.org/
Dow
nloaded from