the pulsations of pg 1351489 - lra.le.ac.uk · the pulsations of pg 1351+489 1221 31wise...
TRANSCRIPT
Mon. Not. R. Astron. Soc. 415, 1220–1227 (2011) doi:10.1111/j.1365-2966.2011.18743.x
The pulsations of PG 1351+489
M. Redaelli,1� S. O. Kepler,1 J. E. S. Costa,1 D. E. Winget,2 G. Handler,3
B. G. Castanheira,1,2,3 A. Kanaan,4 L. Fraga,5 P. Henrique,4 O. Giovannini,6
J. L. Provencal,7,8 H. L. Shipman,7 J. Dalessio,7 S. E. Thompson,8,9 F. Mullally,9
M. M. Brewer,10 D. Childers,11 M. E. Oksala,12 R. Rosen,13 M. A. Wood,14
M. D. Reed,15 B. Walter,16 W. Strickland,16 D. Chandler,16 T. K. Watson,17
R. E. Nather,2 M. H. Montgomery,2 A. Bischoff-Kim,18 C. J. Hansen,19 A. Nitta,20
S. J. Kleinman,20 C. F. Claver,21 T. M. Brown,22 D. J. Sullivan,23 S.-L. Kim,24
W.-P. Chen,25 M. Yang,25 C.-Y. Shih,25 X. Zhang,26 X. Jiang,26 J. N. Fu,27 S. Seetha,28
B. N. Ashoka,28 T. M. K. Marar,28 K. S. Baliyan,29 H. O. Vats,29 A. V. Chernyshev,30
P. Ibbetson,31 E. Leibowitz,32 S. Hemar,32 A. V. Sergeev,33 M. V. Andreev,33
R. Janulis,34 E. G. Meistas,34 P. Moskalik,35 G. Pajdosz,35 A. Baran,36 M. Winiarski,36
S. Zola,36,37 W. Ogloza,36 M. Siwak,37 Zs. Bognar,38 J.-E. Solheim,39 R. Sefako,40
D. Buckley,40 D. O’Donoghue,40 T. Nagel,41 R. Silvotti,42 I. Bruni,42 J. R. Fremy,43
G. Vauclair,44 M. Chevreton,43 N. Dolez,44 B. Pfeiffer,44 M. A. Barstow,45
O. L. Creevey,46 S. D. Kawaler47 and J. C. Clemens48
1Instituto de Fısica da Universidade Federal do Rio Grande do Sul, 91501-970 Porto Alegre, RS, Brazil2Department of Astronomy and McDonald Observatory, University of Texas, Austin, TX 78712, USA3Institut fur Astronomie, Universitat Wien, Turkenschanzstraβe 17, 1180 Wien, Austria4Departamento de Fısica, Universidade Federal de Santa Catarina, 88040-900 Florianopolis, SC, Brazil5Southern Observatory for Astrophysical Research, Casilla 603, La Serena, Chile6Departamento de Fısica e Quımica, Universidade de Caxias do Sul, 95070-560 Caxias do Sul, RS, Brazil7University of Delaware, Department of Physics and Astronomy Newark, DE 19716, USA8Delaware Asteroseismic Research Center, Mt Cuba Observatory, Greenville, DE 19807, USA9SETI Institute/NASA Ames Research Center, Moffett Field, CA 94035, USA10William Jewell College, 500 College Hill Liberty, MO 64048, USA11Department of Math and Science, Delaware County Community College, 901 S. Media Road, Media, USA12Bartol Research Institute, University of Delaware, Newark, Delaware, USA13National Radio Astronomy Observatory, PO Box 2, Green Bank, WV 24944, USA14Florida Institute of Technology, Department of Physics and Space Sciences, Melbourne, FL 32901, USA15Missouri State University and Baker Observatory, 901 S. National, Springfield, MO 65897, USA16Meyer Observatory and Central Texas Astronomical Society, Waco, TX, USA17Southwestern University, Georgetown, TX, USA18Department of Chemistry, Physics and Astronomy, Georgia College & State University, Milledgeville, GA, USA19JILA, University of Colorado, Boulder, CO, USA20Gemini Observatory, 670 N A’ohoku PI., Hilo, HI 96720, USA21Kitt Peak National Observatory, National Optical Astronomy Observatory, Tucson, AZ, USA22Las Cumbres Observatory Global Telescope Network, Inc., 6740 Cortona Drive Suite 102, Santa Barbara, CA 93117, USA23Victoria University of Wellington, Wellington, New Zealand24Korea Astronomy and Space Science Institute, Daejeon 305-348, Korea25Lulin Observatory, National Central University, Taiwan26National Astronomical Observatories, Beijing 100012, China27Department of Astronomy, Beijing Normal University, Beijing, China28Indian Space Research Organization, Airport Road, Vimanapura PO, Bangalore 560017, India29Physical Research Laboratory, Ahmedabad 380009, India30Astronomical Institute, Astronomicheskaya 33, Tashkent, Uzbekistan
�E-mail: [email protected]
C© 2011 The AuthorsMonthly Notices of the Royal Astronomical Society C© 2011 RAS
at Leicester U
niversity Library on A
pril 25, 2014http://m
nras.oxfordjournals.org/D
ownloaded from
The pulsations of PG 1351+489 1221
31Wise Observatory, Tel Aviv University, Tel Aviv, Israel32School of Physics and Astronomy and the Wise Observatory, Tel Aviv University, Tel Aviv, Israel33Ukranian National Academy of Sciences, Main Astronomical Observatory, Golosiiv, Kiev 022 252650, Ukraine34Institute of Theoretical Physics and Astronomy, Vilnius University, Vilnius, Lithuania35Copernicus Astronomical Center, Warsaw, Poland36Mt Suhora Observatory, Cracow Pedagogical University, Cracow, Poland37Astronomical Observatory, Jagiellonian University, ul. Orla 171, 30-244 Cracow, Poland38Konkoly Observatory, PO Box 67, H-1525 Budapest XII, Hungary39Institute of Theoretical Astrophysics, University of Oslo, NO 0315 Oslo, Norway40South African Astronomical Observatory, Observatory 7935, Cape Town, South Africa41Institut fur Astronomie und Astrophysik, Universitet Tubingen, Sand 1, 72076 Tubingen, Germany42INAF Osservatorio Astronomico di Torino, strada dell Osservatorio 20, 10025 Pino Torinese, Italy43LESIA, Observatoire de Paris-Meudon, Meudon, France44Laboratoire d’Astrophysique de Toulouse-Tarbes CNRS-UMR5572, Universite de Toulouse, France45Astronomy Department, Leicester University, University Road, Leicester LE1 7RH46Instituto de Astrofisica de Canarias, Tenerife, Spain47Department of Physics and Astronomy, Iowa State University, Ames, IA 50211, USA48Department of Physics and Astronomy, University of North Carolina, Philips Hall, CB 3255, Chapel Hill, NC 27599, USA
Accepted 2011 March 18. Received 2011 March 15; in original form 2010 September 3
ABSTRACTPG 1351+489 is one of the 20 DBVs – pulsating helium-atmosphere white dwarf stars – knownand has the simplest power spectrum for this class of star, making it a good candidate to studycooling rates. We report accurate period determinations for the main peak at 489.334 48 s andtwo other normal modes using data from the Whole Earth Telescope (WET) observations of1995 and 2009. In 2009, we detected a new pulsation mode and the main pulsation modeexhibited substantial change in its amplitude compared to all previous observations. We wereable to estimate the star’s rotation period, of 8.9 h, and discuss a possible determination of therate of period change of (2.0 ± 0.9) × 10−13 s s −1, the first such estimate for a DBV.
Key words: stars: evolution – stars: individual: PG 1351+489 – stars: oscillations – whitedwarfs.
1 IN T RO D U C T I O N
White dwarf stars with spectra dominated by He I lines pulsate whentheir effective temperatures are between about 30 000 and 22 000 K(see e.g. Beauchamp et al. 1999). These stars, collectively known asDBV, were the first variables to be correctly predicted before theirdiscovery (Winget et al. 1982). There are only 20 DBVs known(Kilkenny et al. 2009; Nitta et al. 2009) and PG 1351+489 is one ofthem. This star has two determinations for the effective temperature,Teff = 22 600 K, log g = 7.9 using pure He atmosphere and Teff =26 100 K, log g = 7.89 allowing for unseen H contamination(Beauchamp et al. 1999). Castanheira et al. (2006) estimated fromIUE spectra the values Teff = 22 500 ± 190 K, log g = 7.60 ±0.15 for pure He and Teff = 22 000 ± 150 K, log g = 7.00 ± 0.07allowing for H contamination. The analysis of the time series pho-tometric data shows one main mode and at least two other normalmodes (Winget, Nather & Hill 1987). This is one of the simplestDBV periodogram known.
The study of white dwarfs can contribute to our knowledge aboutthe Galaxy disc and halo (e.g. Winget & Kepler 2008). White dwarfpulsations provide important information about high-energy andhigh-pressure systems, because the pulsations observed in whitedwarfs are their normal modes and depend on their global structure.Also, cooling rates may be measured by the rate of change ofperiod (Winget et al. 1985), because the evolution of a white dwarfis dominated by cooling. As the temperature of a pulsating white
dwarf decreases, the depth of the ionization zone increases andlonger periods can be excited. Up to now, such a rate of change hasbeen measured for the lukewarm DAVs (Kepler et al. 2005) and forthe hot DOVs (Costa & Kepler 2008), but not for DBVs.
PG 1351+489 is a candidate for the first measurement of a DBVcooling rate because its power spectrum is dominated by one mode.The largest amplitude mode, at 489 s, has a peak-to-peak amplitudeof 0.16 mag and several harmonics have also been detected (Wingetet al. 1987). In addition, two smaller amplitude normal modes havebeen observed, along with several linear combination frequencies(Alves et al. 2003). In this work we confirm these previous resultsand provide more precise values for the periods; we also find a newsmall amplitude mode in the 2009 data and estimate the rotationperiod for this star. We report the observations of PG 1351+489during two Whole Earth Telescope (WET) campaigns (Nather et al.1990) from 1995 and 2009, and discuss a possible rate of change ofthe main period for this star. A rate of pulsation period change is anevolutionary time-scale, and offers a unique way to look inside a starto measure its internal composition. These rate of period changesconstrain models used in cosmochronology, and can even be usedto probe for exotic particles like neutrinos and axions.
2 O BSERVATI ONS
We obtained ∼170 h of high-speed photometric data from sevendifferent observatories in the WET campaign of 1995 (xcov12),
C© 2011 The Authors, MNRAS 415, 1220–1227Monthly Notices of the Royal Astronomical Society C© 2011 RAS
at Leicester U
niversity Library on A
pril 25, 2014http://m
nras.oxfordjournals.org/D
ownloaded from
1222 M. Redaelli et al.
spanning 38 d. There was a 20 d gap between April 5 and April25, and the coverage was about 40 per cent in the two weeks ofintense observation. From the WET campaign of 2009 (xcov27)we obtained only ∼20 h of observations from four observatories,since PG 1351+489 was a tertiary target. We also used four data setsfrom McDonald Observatory, obtained during the years 1984, 1985,1986 and 2004. The time base used in this work is the BarycentricDynamical Time (TDB), or Barycentric Julian Dynamical Date(BJDD), obtained after a conversion from UTC to the barycenter ofthe Solar system. Table 1 shows the Journal of Observations.
3 A NA LY SIS
We began the analysis of PG 1351+489 data looking for pulsationmodes in the individual light curves. The peaks in the Fourier trans-form whose amplitude were above the detection limit of 1/1000false alarm probability were considered real. For the individual lightcurves, which consist of equally spaced data, the detection limit wasthree times the average amplitude, computed by 〈A〉 =
√�A2
i /N .The main peak of 489 s was present in all the runs. The small am-plitude modes were detected only in the longer runs.
Table 1. Journal of observations.
Run Telescope �t Date Begin Length(s) (UT) (UT) (h)
r2957 McDonald 2.1 m 10 1984 May 06 04:04:30 04:25:20r2961 McDonald 2.1 m 10 1984 May 07 03:20:00 02:36:40r2962 McDonald 2.1 m 10 1984 May 07 06:28:20 03:54:30r3006 McDonald 2.1 m 10 1985 February 16 07:20:55 04:15:00r3007 McDonald 2.1 m 10 1985 February 17 08:28:00 03:44:40r3015 McDonald 2.1 m 10 1985 March 22 08:15:39 01:28:50r3019 McDonald 2.1 m 10 1985 March 23 05:29:11 06:06:00r3025 McDonald 2.1 m 10 1985 March 24 06:24:10 04:47:10r3072 McDonald 2.1 m 10 1985 June 15 03:44:50 02:19:50r3077 McDonald 2.1 m 10 1985 June 22 03:40:10 02:26:20r3080 McDonald 2.1 m 10 1985 June 24 07:37:00 01:47:30
r3142 McDonald 2.1 m 10 1986 April 03 04:04:30 05:07:20r3144 McDonald 2.1 m 10 1986 April 04 03:54:20 07:25:40r3149 McDonald 2.1 m 10 1986 April 10 05:37:56 04:21:50r3150 McDonald 2.1 m 03 1986 April 13 05:23:40 02:50:57r3151 McDonald 2.1 m 10 1986 April 13 09:21:40 01:46:20r3168 McDonald 2.1 m 10 1986 June 10 03:36:00 05:10:30r3170 McDonald 2.1 m 10 1986 June 11 03:38:30 05:12:30r3172 McDonald 2.1 m 10 1986 June 12 03:36:40 05:31:40r3173 McDonald 2.1 m 10 1986 June 13 03:36:30 05:07:40
gv0502 Pic du Midi 2.0 m 10 1995 April 02 22:53:07 03:10:10gv0504 Pic du Midi 2.0 m 10 1995 April 03 22:24:37 01:51:40gv0506 Pic du Midi 2.0 m 10 1995 April 04 22:09:10 02:44:10gv0508 Pic du Midi 2.0 m 10 1995 April 05 23:38:50 05:10:40eml-0002 Wise 1.0 m 10 1995 April 25 18:43:10 05:07:20eml-0003 Wise 1.0 m 10 1995 April 26 17:55:40 07:24:10eml-0005 Wise 1.0 m 10 1995 April 27 21:56:40 03:43:10eml-0006 Wise 1.0 m 10 1995 April 28 18:43:00 01:07:00eml-0008 Wise 1.0 m 10 1995 April 28 21:06:00 03:55:20eml-0009 Wise 1.0 m 10 1995 April 29 18:03:00 07:01:00jebp01 Isaac Newton 2.5 m 10 1995 April 26 00:17:40 05:10:40jebp02 Isaac Newton 2.5 m 10 1995 April 26 22:58:30 02:07:10jebp03 Isaac Newton 2.5 m 10 1995 April 27 21:45:00 07:03:50jebp04 Isaac Newton 2.5 m 10 1995 April 28 23:31:20 05:47:20jebp05 Isaac Newton 2.5 m 10 1995 April 29 20:54:40 08:26:10ra360 McDonald 2.1 m 10 1995 April 26 02:40:50 07:59:50ra361 McDonald 2.1 m 10 1995 April 27 02:29:40 07:25:40ra362 McDonald 2.1 m 10 1995 April 28 02:39:20 08:03:00ra363 McDonald 2.1 m 10 1995 April 29 02:35:10 08:35:50ra364 McDonald 2.1 m 10 1995 April 30 02:31:40 07:58:10ra367 McDonald 2.1 m 10 1995 May 03 07:29:40 03:37:00emac-002 Maidanak 1.0 m 10 1995 May 01 20:31:30 01:49:00emac-003 Maidanak 1.0 m 10 1995 May 01 18:30:00 01:44:10emac-004 Maidanak 1.0 m 10 1995 May 02 15:54:00 02:49:50emac-006 Maidanak 1.0 m 10 1995 May 05 16:32:30 05:40:30emac-008 Maidanak 1.0 m 10 1995 May 06 19:16:00 03:41:50cfc-202 Mauna Kea 0.6 m 10 1995 May 01 07:47:00 04:24:50cfc-208 Mauna Kea 0.6 m 10 1995 May 07 08:48:50 04:18:40rk368 McDonald 2.1 m 10 1995 May 04 02:48:00 06:46:40
C© 2011 The Authors, MNRAS 415, 1220–1227Monthly Notices of the Royal Astronomical Society C© 2011 RAS
at Leicester U
niversity Library on A
pril 25, 2014http://m
nras.oxfordjournals.org/D
ownloaded from
The pulsations of PG 1351+489 1223
Table 1 – continued
Run Telescope �t Date Begin Length(s) (UT) (UT) (h)
rk369 McDonald 2.1 m 10 1995 May 06 08:52:40 01:55:30sjk-0384 BAO 2.16 m 10 1995 May 02 14:22:30 05:10:10sjk-0385 BAO 2.16 m 10 1995 May 03 14:06:50 05:19:00sjk-0386 BAO 2.16 m 10 1995 May 04 12:45:00 07:17:00sjk-0387 BAO 2.16 m 10 1995 May 05 13:24:40 06:00:40sjk-0388 BAO 2.16 m 10 1995 May 06 16:32:40 03:54:10an-0015 McDonald 2.1 m 10 1995 May 11 08:03:20 03:03:20
A0876 McDonald 2.1 m 05 2004 May 12 05:54:35 02:34:55A0900 McDonald 2.1 m 05 2004 June 14 03:06:06 04:01:50
mole090525 Moletai 1.6 m 17 2009 May 25 20:17:08 02:54:32mole090530 Moletai 1.6 m 17 2009 May 30 20:27:08 02:14:52naoc090529 China 2.16 m 20 2009 May 29 12:48:11 03:49:00naoc090530 China 2.16 m 20 2009 May 30 12:38:48 02:04:30naoc090531 China 2.16 m 20 2009 May 31 12:41:48 01:40:20pjmo090531 Meyer 0.6 m 30 2009 May 31 04:49:35 03:32:30teub090524 Tuebingen 0.8 m 30 2009 May 24 21:26:01 04:12:30
The longest data set, acquired in 1995, has the best resolutionand signal-to-noise ratio. The detection limit used for the whole1995 data set was n 〈A〉, where n = Amax
rand/〈Arand〉, and Amaxrand are
the maximum and 〈Arand〉 are the average amplitudes of the Fouriertransform of the randomized light curve, which has no signal, onlynoise, but the same spacings as the real data. We found n = 4.3 usinga Monte Carlo simulation method, and n = 4.12 using the analyticalmethod described by Scargle (1982). Because the noise increaseswith decreasing frequency for f ≤ 6000 µHz, the detection limit isa function of frequency.
Run ‘emac-002’, listed in Table 1 shows a very large phase de-viation from the surrounding runs, inconsistent with the rest of thelight curve. We assumed a timing mistake occurred and excludedthat file from further analysis.
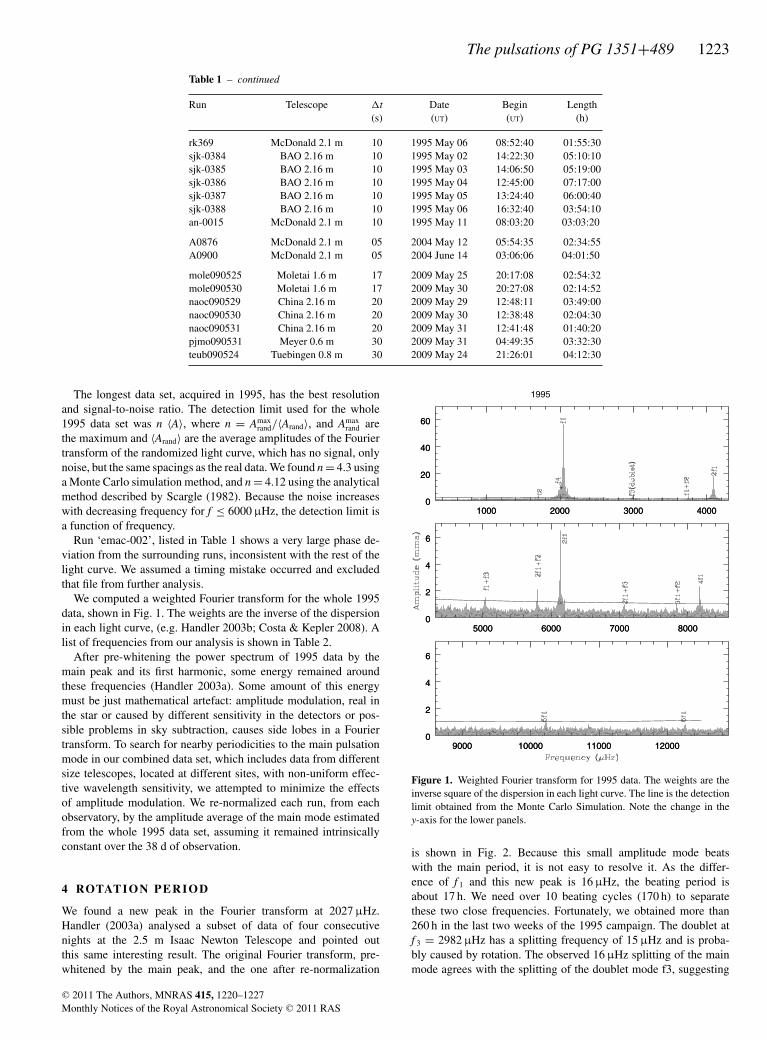
We computed a weighted Fourier transform for the whole 1995data, shown in Fig. 1. The weights are the inverse of the dispersionin each light curve, (e.g. Handler 2003b; Costa & Kepler 2008). Alist of frequencies from our analysis is shown in Table 2.
After pre-whitening the power spectrum of 1995 data by themain peak and its first harmonic, some energy remained aroundthese frequencies (Handler 2003a). Some amount of this energymust be just mathematical artefact: amplitude modulation, real inthe star or caused by different sensitivity in the detectors or pos-sible problems in sky subtraction, causes side lobes in a Fouriertransform. To search for nearby periodicities to the main pulsationmode in our combined data set, which includes data from differentsize telescopes, located at different sites, with non-uniform effec-tive wavelength sensitivity, we attempted to minimize the effectsof amplitude modulation. We re-normalized each run, from eachobservatory, by the amplitude average of the main mode estimatedfrom the whole 1995 data set, assuming it remained intrinsicallyconstant over the 38 d of observation.
4 ROTAT I O N PE R I O D
We found a new peak in the Fourier transform at 2027 µHz.Handler (2003a) analysed a subset of data of four consecutivenights at the 2.5 m Isaac Newton Telescope and pointed outthis same interesting result. The original Fourier transform, pre-whitened by the main peak, and the one after re-normalization
Figure 1. Weighted Fourier transform for 1995 data. The weights are theinverse square of the dispersion in each light curve. The line is the detectionlimit obtained from the Monte Carlo Simulation. Note the change in they-axis for the lower panels.
is shown in Fig. 2. Because this small amplitude mode beatswith the main period, it is not easy to resolve it. As the differ-ence of f 1 and this new peak is 16 µHz, the beating period isabout 17 h. We need over 10 beating cycles (170 h) to separatethese two close frequencies. Fortunately, we obtained more than260 h in the last two weeks of the 1995 campaign. The doublet atf 3 = 2982 µHz has a splitting frequency of 15 µHz and is proba-bly caused by rotation. The observed 16 µHz splitting of the mainmode agrees with the splitting of the doublet mode f3, suggesting
C© 2011 The Authors, MNRAS 415, 1220–1227Monthly Notices of the Royal Astronomical Society C© 2011 RAS
at Leicester U
niversity Library on A
pril 25, 2014http://m
nras.oxfordjournals.org/D
ownloaded from
1224 M. Redaelli et al.
Table 2. Frequencies detected in PG 1351+489 during 1995 data.
Frequency (µHz) Period (s) Amplitude (mma) Identification
2043.5919 ± 0.0020 489.334 48 ± 0.000 48 56.36 ± 0.20 f 1
4087.1727 ± 0.0066 244.667 90 ± 0.000 39 17.19 ± 0.20 2f 1
6130.744 ± 0.017 163.112 32 ± 0.000 47 6.31 ± 0.20 3f 1
8174.315 ± 0.048 122.334 40 ± 0.000 72 2.34 ± 0.20 4f 1
10215.05 ± 0.13 97.8947 ± 0.000 13 0.40 ± 0.24 5f 1
12298.59 ± 0.46 81.3101 ± 0.0030 0.27 ± 0.27 6f 1
1710.337 ± 0.030 584.679 ± 0.010 3.68 ± 0.20 f 2
2982.771 ± 0.041 335.2586 ± 0.0046 2.81 ± 0.20 f 31
3752.14 ± 0.35 266.514 ± 0.025 0.32 ± 0.21 f 1 + f 2
5040.885 ± 0.079 198.3778 ± 0.0031 1.44 ± 0.20 f 1 + f 3
5797.493 ± 0.050 172.4883 ± 0.0015 2.23 ± 0.20 2f 1 + f 2
2027.082 ± 0.023 493.3199 ± 0.0057 4.84 ± 0.20 f a1
1563.390 ± 0.25 639.63 ± 0.10 11.5 ± 1.1 f 42
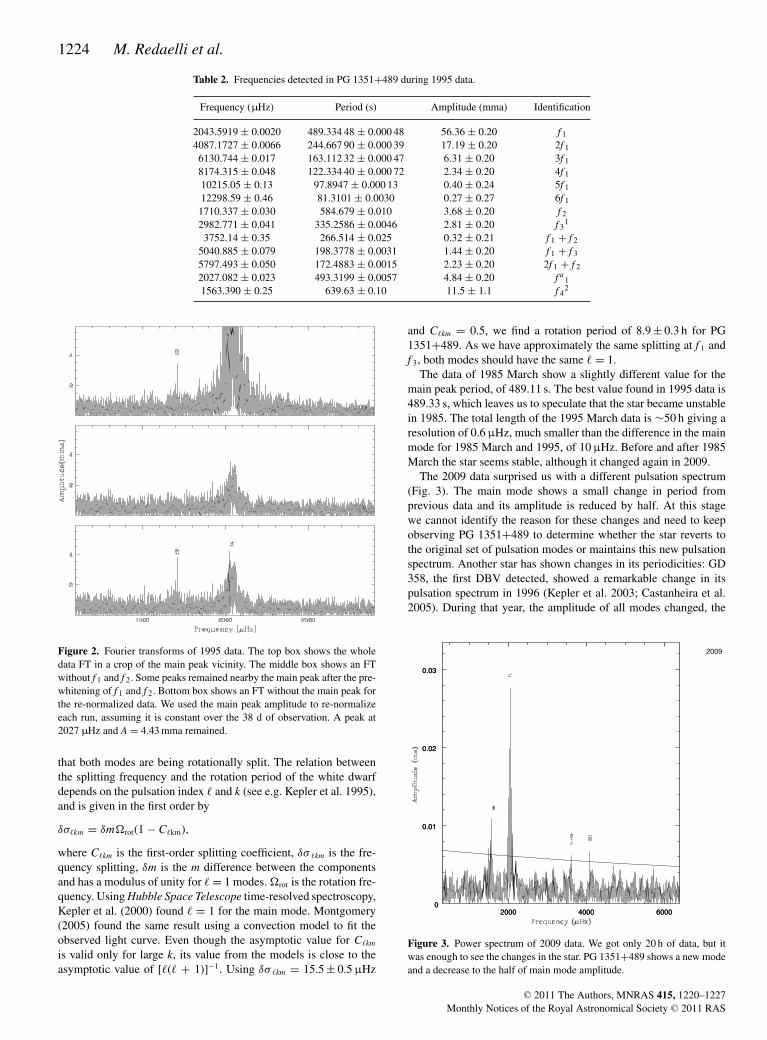
Figure 2. Fourier transforms of 1995 data. The top box shows the wholedata FT in a crop of the main peak vicinity. The middle box shows an FTwithout f 1 and f 2. Some peaks remained nearby the main peak after the pre-whitening of f 1 and f 2. Bottom box shows an FT without the main peak forthe re-normalized data. We used the main peak amplitude to re-normalizeeach run, assuming it is constant over the 38 d of observation. A peak at2027 µHz and A = 4.43 mma remained.
that both modes are being rotationally split. The relation betweenthe splitting frequency and the rotation period of the white dwarfdepends on the pulsation index � and k (see e.g. Kepler et al. 1995),and is given in the first order by
δσ�km = δmrot(1 − C�km),
where C�km is the first-order splitting coefficient, δσ �km is the fre-quency splitting, δm is the m difference between the componentsand has a modulus of unity for � = 1 modes. rot is the rotation fre-quency. Using Hubble Space Telescope time-resolved spectroscopy,Kepler et al. (2000) found � = 1 for the main mode. Montgomery(2005) found the same result using a convection model to fit theobserved light curve. Even though the asymptotic value for C�km
is valid only for large k, its value from the models is close to theasymptotic value of [�(� + 1)]−1. Using δσ �km = 15.5 ± 0.5 µHz
and C�km = 0.5, we find a rotation period of 8.9 ± 0.3 h for PG1351+489. As we have approximately the same splitting at f 1 andf 3, both modes should have the same � = 1.
The data of 1985 March show a slightly different value for themain peak period, of 489.11 s. The best value found in 1995 data is489.33 s, which leaves us to speculate that the star became unstablein 1985. The total length of the 1995 March data is ∼50 h giving aresolution of 0.6 µHz, much smaller than the difference in the mainmode for 1985 March and 1995, of 10 µHz. Before and after 1985March the star seems stable, although it changed again in 2009.
The 2009 data surprised us with a different pulsation spectrum(Fig. 3). The main mode shows a small change in period fromprevious data and its amplitude is reduced by half. At this stagewe cannot identify the reason for these changes and need to keepobserving PG 1351+489 to determine whether the star reverts tothe original set of pulsation modes or maintains this new pulsationspectrum. Another star has shown changes in its periodicities: GD358, the first DBV detected, showed a remarkable change in itspulsation spectrum in 1996 (Kepler et al. 2003; Castanheira et al.2005). During that year, the amplitude of all modes changed, the
Figure 3. Power spectrum of 2009 data. We got only 20 h of data, but itwas enough to see the changes in the star. PG 1351+489 shows a new modeand a decrease to the half of main mode amplitude.
C© 2011 The Authors, MNRAS 415, 1220–1227Monthly Notices of the Royal Astronomical Society C© 2011 RAS
at Leicester U
niversity Library on A
pril 25, 2014http://m
nras.oxfordjournals.org/D
ownloaded from
The pulsations of PG 1351+489 1225
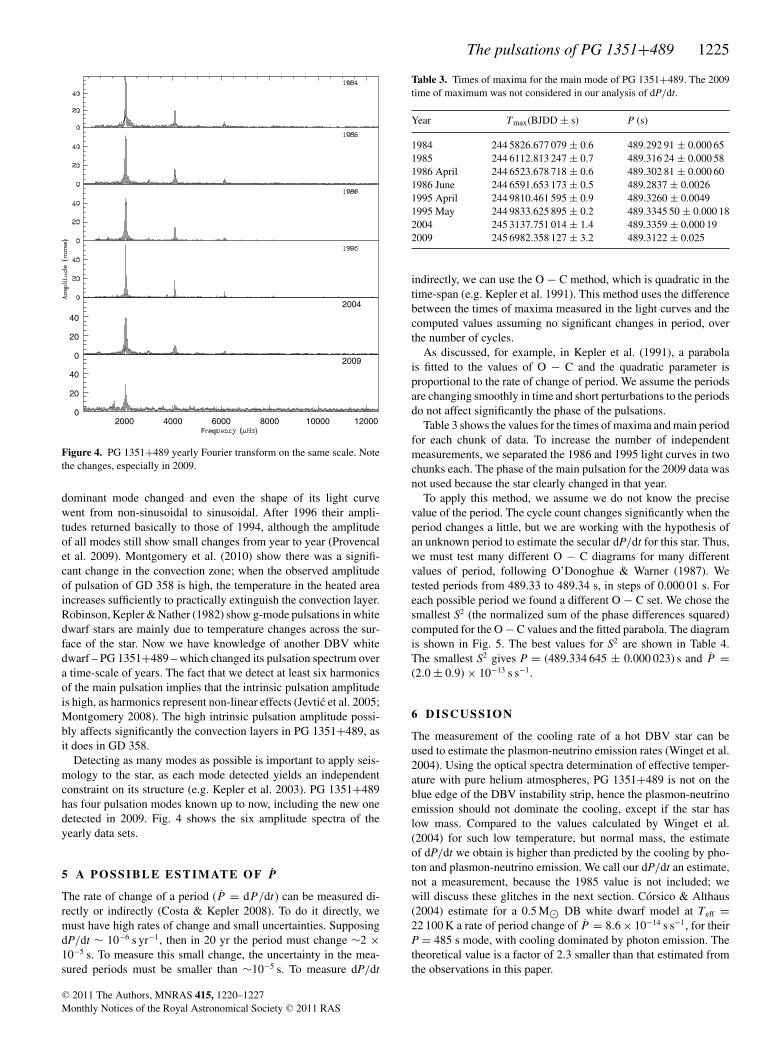
Figure 4. PG 1351+489 yearly Fourier transform on the same scale. Notethe changes, especially in 2009.
dominant mode changed and even the shape of its light curvewent from non-sinusoidal to sinusoidal. After 1996 their ampli-tudes returned basically to those of 1994, although the amplitudeof all modes still show small changes from year to year (Provencalet al. 2009). Montgomery et al. (2010) show there was a signifi-cant change in the convection zone; when the observed amplitudeof pulsation of GD 358 is high, the temperature in the heated areaincreases sufficiently to practically extinguish the convection layer.Robinson, Kepler & Nather (1982) show g-mode pulsations in whitedwarf stars are mainly due to temperature changes across the sur-face of the star. Now we have knowledge of another DBV whitedwarf – PG 1351+489 – which changed its pulsation spectrum overa time-scale of years. The fact that we detect at least six harmonicsof the main pulsation implies that the intrinsic pulsation amplitudeis high, as harmonics represent non-linear effects (Jevtic et al. 2005;Montgomery 2008). The high intrinsic pulsation amplitude possi-bly affects significantly the convection layers in PG 1351+489, asit does in GD 358.
Detecting as many modes as possible is important to apply seis-mology to the star, as each mode detected yields an independentconstraint on its structure (e.g. Kepler et al. 2003). PG 1351+489has four pulsation modes known up to now, including the new onedetected in 2009. Fig. 4 shows the six amplitude spectra of theyearly data sets.
5 A POSSIBLE ESTIMATE O F P
The rate of change of a period (P = dP/dt) can be measured di-rectly or indirectly (Costa & Kepler 2008). To do it directly, wemust have high rates of change and small uncertainties. SupposingdP/dt ∼ 10−6 s yr−1, then in 20 yr the period must change ∼2 ×10⁻⁵ s. To measure this small change, the uncertainty in the mea-sured periods must be smaller than ∼10−5 s. To measure dP/dt
Table 3. Times of maxima for the main mode of PG 1351+489. The 2009time of maximum was not considered in our analysis of dP/dt.
Year Tmax(BJDD ± s) P (s)
1984 244 5826.677 079 ± 0.6 489.292 91 ± 0.000 651985 244 6112.813 247 ± 0.7 489.316 24 ± 0.000 581986 April 244 6523.678 718 ± 0.6 489.302 81 ± 0.000 601986 June 244 6591.653 173 ± 0.5 489.2837 ± 0.00261995 April 244 9810.461 595 ± 0.9 489.3260 ± 0.00491995 May 244 9833.625 895 ± 0.2 489.3345 50 ± 0.000 182004 245 3137.751 014 ± 1.4 489.3359 ± 0.000 192009 245 6982.358 127 ± 3.2 489.3122 ± 0.025
indirectly, we can use the O − C method, which is quadratic in thetime-span (e.g. Kepler et al. 1991). This method uses the differencebetween the times of maxima measured in the light curves and thecomputed values assuming no significant changes in period, overthe number of cycles.
As discussed, for example, in Kepler et al. (1991), a parabolais fitted to the values of O − C and the quadratic parameter isproportional to the rate of change of period. We assume the periodsare changing smoothly in time and short perturbations to the periodsdo not affect significantly the phase of the pulsations.
Table 3 shows the values for the times of maxima and main periodfor each chunk of data. To increase the number of independentmeasurements, we separated the 1986 and 1995 light curves in twochunks each. The phase of the main pulsation for the 2009 data wasnot used because the star clearly changed in that year.
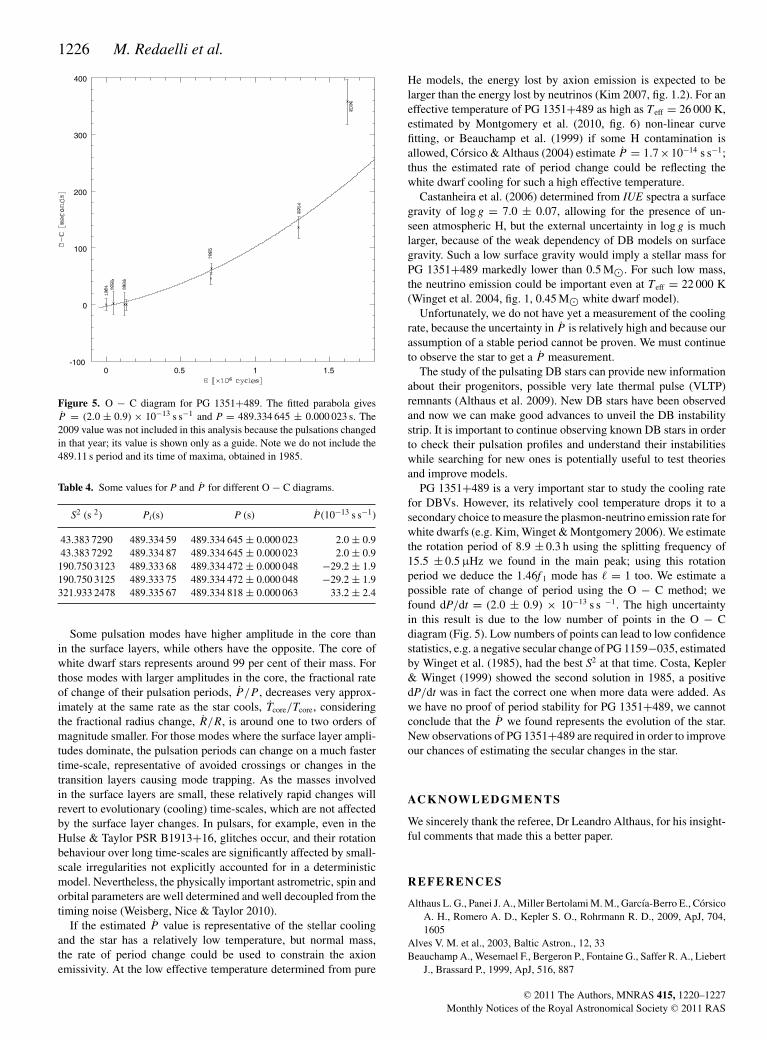
To apply this method, we assume we do not know the precisevalue of the period. The cycle count changes significantly when theperiod changes a little, but we are working with the hypothesis ofan unknown period to estimate the secular dP/dt for this star. Thus,we must test many different O − C diagrams for many differentvalues of period, following O’Donoghue & Warner (1987). Wetested periods from 489.33 to 489.34 s, in steps of 0.000 01 s. Foreach possible period we found a different O − C set. We chose thesmallest S2 (the normalized sum of the phase differences squared)computed for the O − C values and the fitted parabola. The diagramis shown in Fig. 5. The best values for S2 are shown in Table 4.The smallest S2 gives P = (489.334 645 ± 0.000 023) s and P =(2.0 ± 0.9) × 10−13 s s−1.
6 D ISCUSSION
The measurement of the cooling rate of a hot DBV star can beused to estimate the plasmon-neutrino emission rates (Winget et al.2004). Using the optical spectra determination of effective temper-ature with pure helium atmospheres, PG 1351+489 is not on theblue edge of the DBV instability strip, hence the plasmon-neutrinoemission should not dominate the cooling, except if the star haslow mass. Compared to the values calculated by Winget et al.(2004) for such low temperature, but normal mass, the estimateof dP/dt we obtain is higher than predicted by the cooling by pho-ton and plasmon-neutrino emission. We call our dP/dt an estimate,not a measurement, because the 1985 value is not included; wewill discuss these glitches in the next section. Corsico & Althaus(2004) estimate for a 0.5 M� DB white dwarf model at Teff =22 100 K a rate of period change of P = 8.6 × 10⁻¹⁴ s s−1, for theirP = 485 s mode, with cooling dominated by photon emission. Thetheoretical value is a factor of 2.3 smaller than that estimated fromthe observations in this paper.
C© 2011 The Authors, MNRAS 415, 1220–1227Monthly Notices of the Royal Astronomical Society C© 2011 RAS
at Leicester U
niversity Library on A
pril 25, 2014http://m
nras.oxfordjournals.org/D
ownloaded from
1226 M. Redaelli et al.
Figure 5. O − C diagram for PG 1351+489. The fitted parabola givesP = (2.0 ± 0.9) × 10−13 s s−1 and P = 489.334 645 ± 0.000 023 s. The2009 value was not included in this analysis because the pulsations changedin that year; its value is shown only as a guide. Note we do not include the489.11 s period and its time of maxima, obtained in 1985.
Table 4. Some values for P and P for different O − C diagrams.
S2 (s 2) Pi(s) P (s) P (10−13 s s−1)
43.383 7290 489.334 59 489.334 645 ± 0.000 023 2.0 ± 0.943.383 7292 489.334 87 489.334 645 ± 0.000 023 2.0 ± 0.9190.750 3123 489.333 68 489.334 472 ± 0.000 048 −29.2 ± 1.9190.750 3125 489.333 75 489.334 472 ± 0.000 048 −29.2 ± 1.9321.933 2478 489.335 67 489.334 818 ± 0.000 063 33.2 ± 2.4
Some pulsation modes have higher amplitude in the core thanin the surface layers, while others have the opposite. The core ofwhite dwarf stars represents around 99 per cent of their mass. Forthose modes with larger amplitudes in the core, the fractional rateof change of their pulsation periods, P /P , decreases very approx-imately at the same rate as the star cools, Tcore/Tcore, consideringthe fractional radius change, R/R, is around one to two orders ofmagnitude smaller. For those modes where the surface layer ampli-tudes dominate, the pulsation periods can change on a much fastertime-scale, representative of avoided crossings or changes in thetransition layers causing mode trapping. As the masses involvedin the surface layers are small, these relatively rapid changes willrevert to evolutionary (cooling) time-scales, which are not affectedby the surface layer changes. In pulsars, for example, even in theHulse & Taylor PSR B1913+16, glitches occur, and their rotationbehaviour over long time-scales are significantly affected by small-scale irregularities not explicitly accounted for in a deterministicmodel. Nevertheless, the physically important astrometric, spin andorbital parameters are well determined and well decoupled from thetiming noise (Weisberg, Nice & Taylor 2010).
If the estimated P value is representative of the stellar coolingand the star has a relatively low temperature, but normal mass,the rate of period change could be used to constrain the axionemissivity. At the low effective temperature determined from pure
He models, the energy lost by axion emission is expected to belarger than the energy lost by neutrinos (Kim 2007, fig. 1.2). For aneffective temperature of PG 1351+489 as high as Teff = 26 000 K,estimated by Montgomery et al. (2010, fig. 6) non-linear curvefitting, or Beauchamp et al. (1999) if some H contamination isallowed, Corsico & Althaus (2004) estimate P = 1.7×10⁻¹⁴ s s−1;thus the estimated rate of period change could be reflecting thewhite dwarf cooling for such a high effective temperature.
Castanheira et al. (2006) determined from IUE spectra a surfacegravity of log g = 7.0 ± 0.07, allowing for the presence of un-seen atmospheric H, but the external uncertainty in log g is muchlarger, because of the weak dependency of DB models on surfacegravity. Such a low surface gravity would imply a stellar mass forPG 1351+489 markedly lower than 0.5 M�. For such low mass,the neutrino emission could be important even at Teff = 22 000 K(Winget et al. 2004, fig. 1, 0.45 M� white dwarf model).
Unfortunately, we do not have yet a measurement of the coolingrate, because the uncertainty in P is relatively high and because ourassumption of a stable period cannot be proven. We must continueto observe the star to get a P measurement.
The study of the pulsating DB stars can provide new informationabout their progenitors, possible very late thermal pulse (VLTP)remnants (Althaus et al. 2009). New DB stars have been observedand now we can make good advances to unveil the DB instabilitystrip. It is important to continue observing known DB stars in orderto check their pulsation profiles and understand their instabilitieswhile searching for new ones is potentially useful to test theoriesand improve models.
PG 1351+489 is a very important star to study the cooling ratefor DBVs. However, its relatively cool temperature drops it to asecondary choice to measure the plasmon-neutrino emission rate forwhite dwarfs (e.g. Kim, Winget & Montgomery 2006). We estimatethe rotation period of 8.9 ± 0.3 h using the splitting frequency of15.5 ± 0.5 µHz we found in the main peak; using this rotationperiod we deduce the 1.46f 1 mode has � = 1 too. We estimate apossible rate of change of period using the O − C method; wefound dP/dt = (2.0 ± 0.9) × 10−13 s s −1. The high uncertaintyin this result is due to the low number of points in the O − Cdiagram (Fig. 5). Low numbers of points can lead to low confidencestatistics, e.g. a negative secular change of PG 1159−035, estimatedby Winget et al. (1985), had the best S2 at that time. Costa, Kepler& Winget (1999) showed the second solution in 1985, a positivedP/dt was in fact the correct one when more data were added. Aswe have no proof of period stability for PG 1351+489, we cannotconclude that the P we found represents the evolution of the star.New observations of PG 1351+489 are required in order to improveour chances of estimating the secular changes in the star.
AC K N OW L E D G M E N T S
We sincerely thank the referee, Dr Leandro Althaus, for his insight-ful comments that made this a better paper.
REFERENCES
Althaus L. G., Panei J. A., Miller Bertolami M. M., Garcıa-Berro E., CorsicoA. H., Romero A. D., Kepler S. O., Rohrmann R. D., 2009, ApJ, 704,1605
Alves V. M. et al., 2003, Baltic Astron., 12, 33Beauchamp A., Wesemael F., Bergeron P., Fontaine G., Saffer R. A., Liebert
J., Brassard P., 1999, ApJ, 516, 887
C© 2011 The Authors, MNRAS 415, 1220–1227Monthly Notices of the Royal Astronomical Society C© 2011 RAS
at Leicester U
niversity Library on A
pril 25, 2014http://m
nras.oxfordjournals.org/D
ownloaded from
The pulsations of PG 1351+489 1227
Castanheira B. G., Nitta A., Kepler S. O., Winget D. E., Koester D., 2005,A&A, 432, 175
Castanheira B. G., Kepler S. O., Handler G., Koester D., 2006, A&A, 450,331
Corsico A. H., Althaus L. G., 2004, A&A, 428, 159Costa J. E. S., Kepler S. O., 2008, A&A, 489, 1Costa J. E. E., Kepler S. O., Winget D. E., 1999, ApJ, 522, 973Handler G., 2003a, Baltic Astron., 12, 11Handler G., 2003b, Baltic Astron., 12, 253Jevtic N., Zelechoski S., Feldman H., Peterson C., Schweitzer J. S., 2005,
ApJ, 635, 527Kepler S. O. et al., 1991, ApJ, 378, L45Kepler S. O. et al., 1995, ApJ, 447, 874Kepler S. O., Robinson E. L., Koester D., Clemens J. C., Nather R. E., Jiang
X. J., 2000, ApJ, 539, 379Kepler S. O. et al., 2003, A&A, 401, 639Kepler S. O. et al., 2005, ApJ, 634, 1311Kilkenny D., O’Donoghue D., Crause L. A., Hambly N., MacGillivray H.,
2009, MNRAS, 397, 453Kim A., 2007, PhD thesis, University of Texas at Austin,
http://whitedwarf.org/theses/kim.pdfKim A., Winget D. E., Montgomery M. H., 2006, Mem. Soc. Astron. Ital.,
77, 460
Montgomery M. H., 2005, ApJ, 633, 1142Montgomery M. H., 2008, Comm. Asteroseismol., 154, 38Montgomery M. H. et al., 2010, ApJ, 716, 84Nather R. E., Winget D. E., Clemens J. C., Hansen C. J., Hine B. P., 1990,
ApJ, 361, 309Nitta A. et al., 2009, ApJ, 690, 560O’Donoghue D., Warner B., 1987, MNRAS, 228, 949Provencal J. L. et al., 2009, ApJ, 693, 564Robinson E. L., Kepler S. O., Nather R. E., 1982, ApJ, 259, 219Scargle J. D., 1982, ApJ, 263, 835Weisberg J. M., Nice D. J., Taylor J. H., 2010, ApJ, 722, 1030Winget D. E., Kepler S. O., 2008, ARA&A, 46, 157Winget D. E., Robinson E. L., Nather R. D., Fontaine G., 1982, ApJ, 262,
L11Winget D. E., Robinson E. L., Nather R. E., Kepler S. O., O’Donoghue D.,
1985, ApJ, 292, 606Winget D. E., Nather R. E., Hill J. A., 1987, ApJ, 316, 305Winget D. E., Sullivan D. J., Metcalfe T. S., Kawaler S. D., Montgomery
M. H., 2004, ApJ, 602, L109
This paper has been typeset from a TEX/LATEX file prepared by the author.
C© 2011 The Authors, MNRAS 415, 1220–1227Monthly Notices of the Royal Astronomical Society C© 2011 RAS
at Leicester U
niversity Library on A
pril 25, 2014http://m
nras.oxfordjournals.org/D
ownloaded from