the production possibilities curve ppc what does a ppc graph show? the production possibilities...
TRANSCRIPT
The Production Possibilities Curve
PPC
What does a PPC graph show?
• The Production Possibilities Curve (PPC) shows all possible combinations of two goods to be produced.
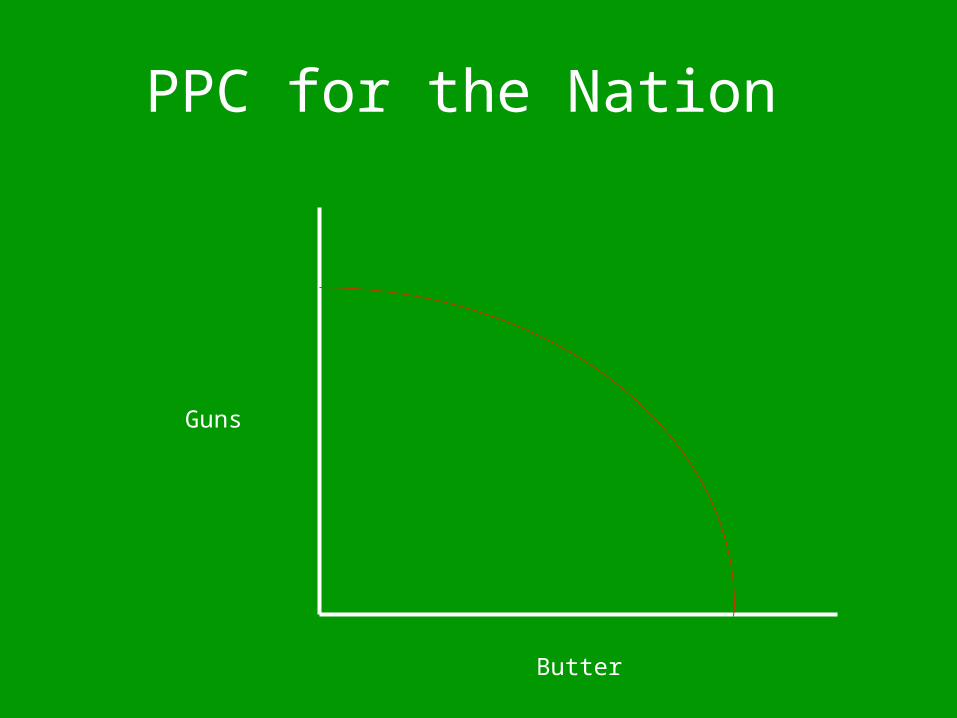
PPC for the Nation
Guns
Butter
Guns
Butter
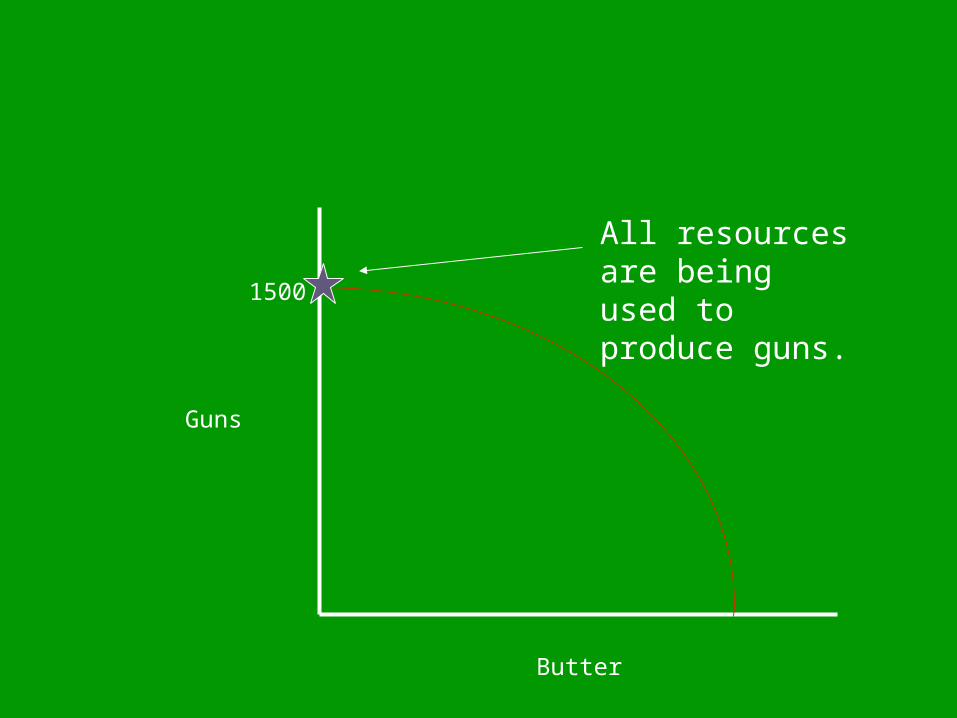
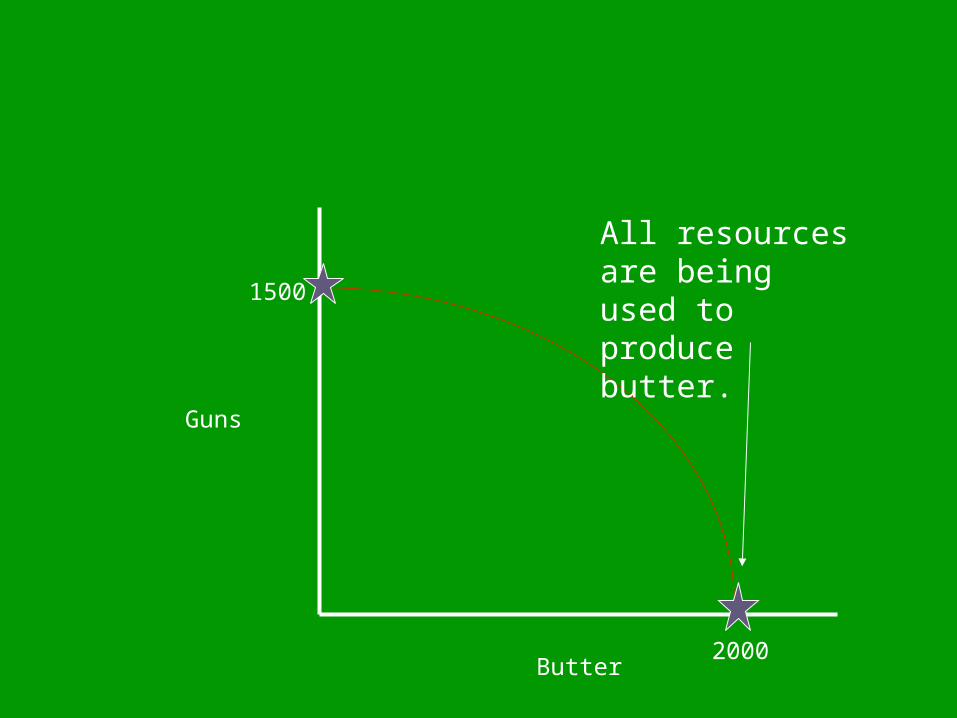
1500
All resources are being used to produce guns.
Guns
Butter
1500
2000
All resources are being used to produce butter.
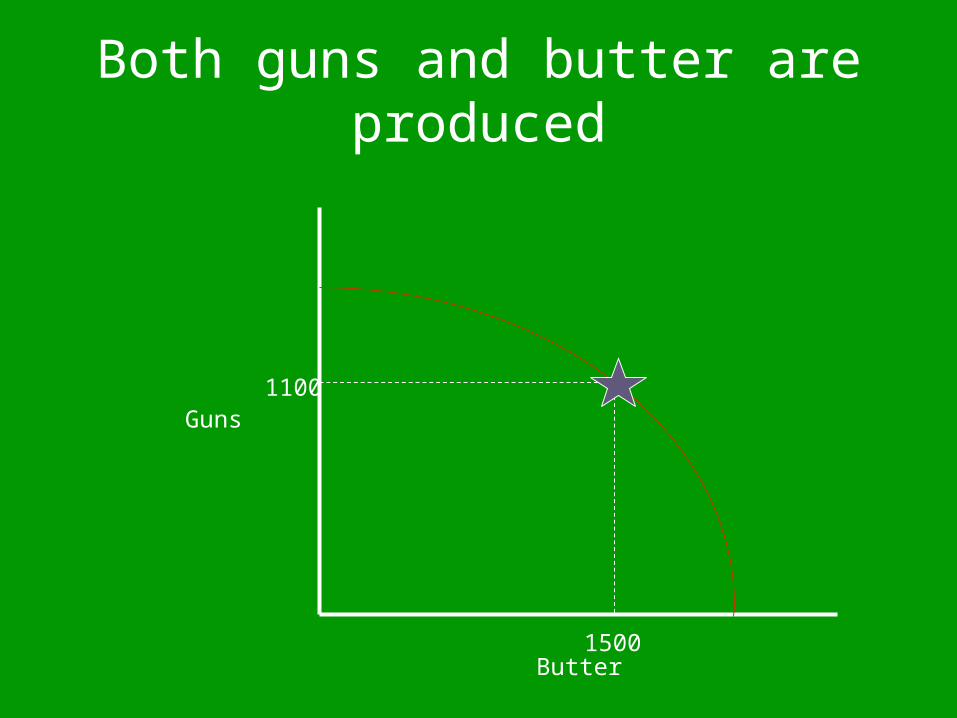
Both guns and butter are produced
Guns
Butter
1100
1500
Production can be anywhere on or under the curve.
It may NOT be outside the curve– there are not enough resources to
do so.
*PPC
Guns
Butter
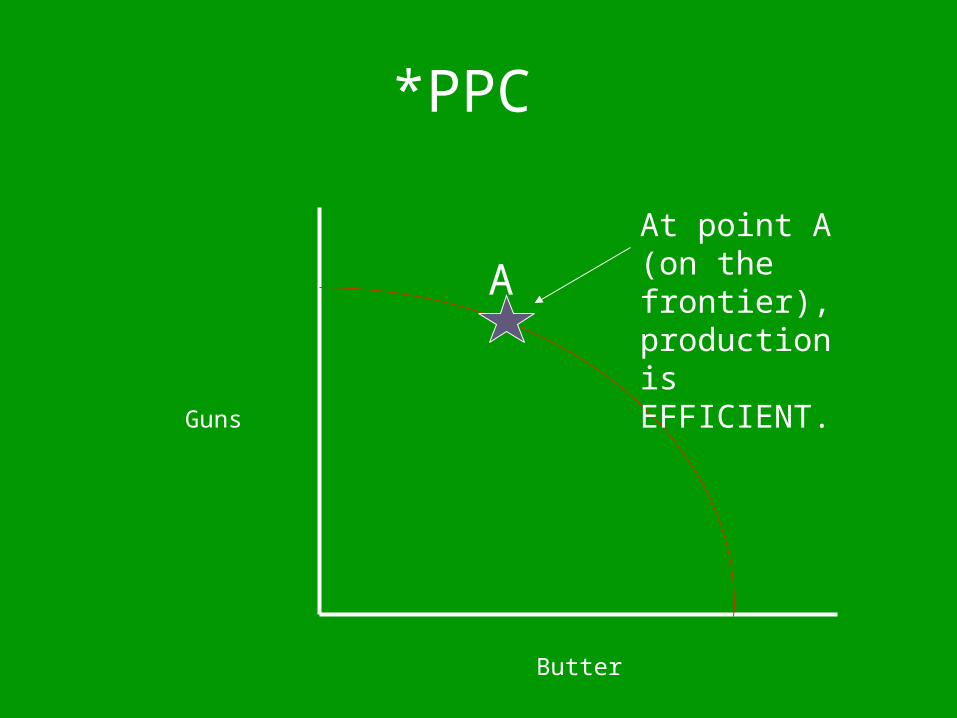
AAt point A (on the frontier), production is EFFICIENT.
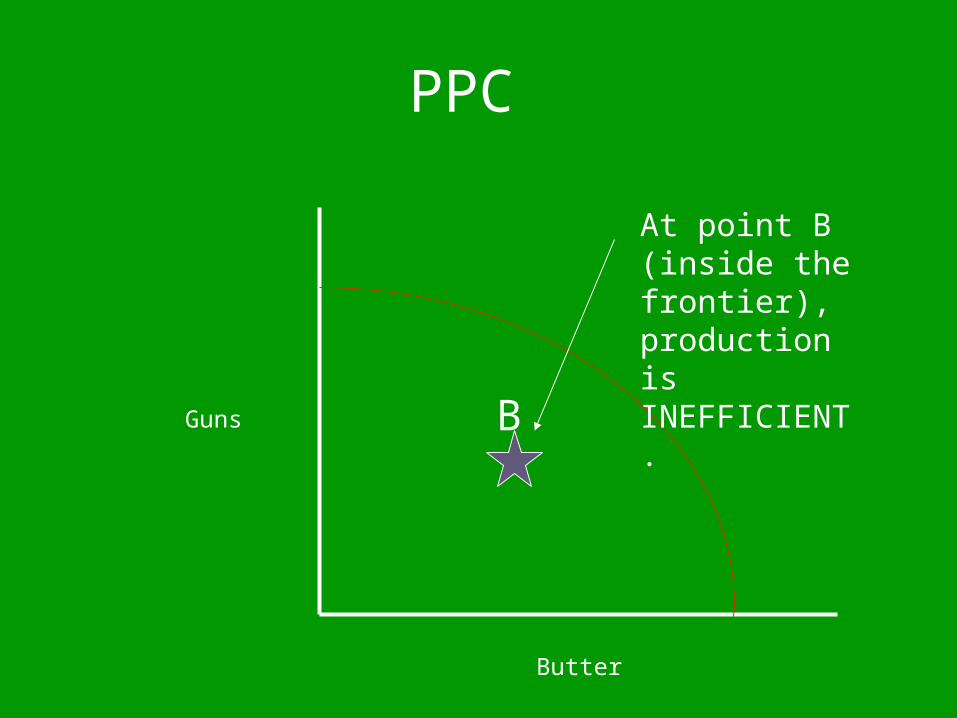
PPC
Guns
Butter
B
At point B (inside the frontier), production is INEFFICIENT.
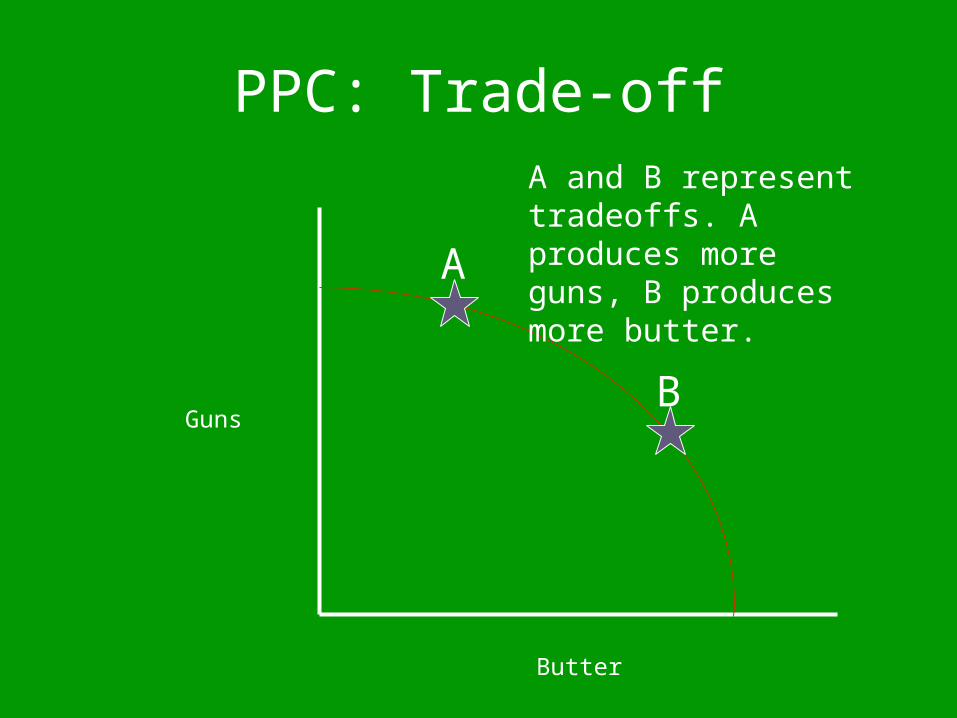
PPC: Trade-off
Guns
Butter
A
B
A and B represent tradeoffs. A produces more guns, B produces more butter.
The PPC can be used to show the opportunity cost of choosing
one good over the other.How much of the alternate must
be given up?
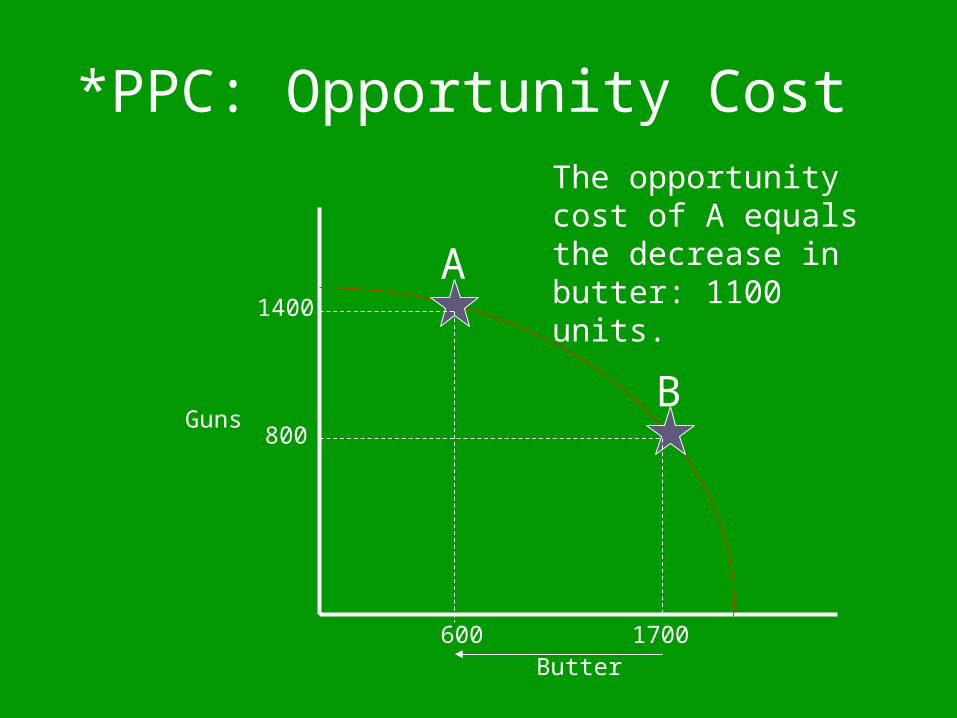
*PPC: Opportunity Cost
Guns
Butter
A
B
1400
800
1700600
The opportunity cost of A equals the decrease in butter: 1100 units.
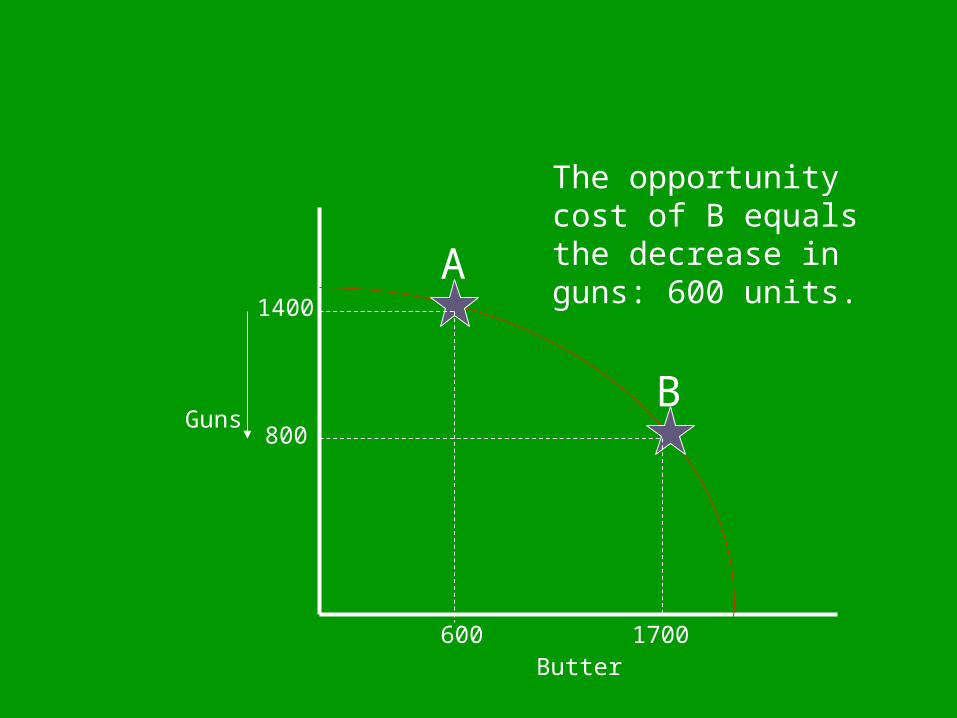
Guns
Butter
A
B
1400
800
1700600
The opportunity cost of B equals the decrease in guns: 600 units.
The PPC can also show economic growth by moving
outward.Due to additional resources, increasing population, or new
technology.
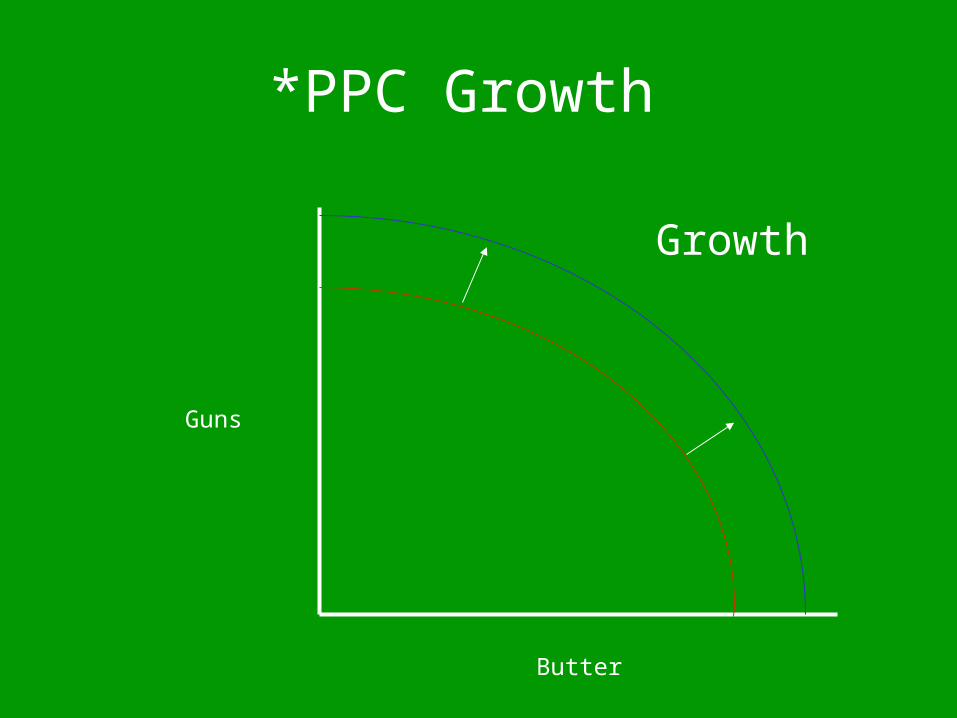
*PPC Growth
Guns
Butter
Growth
..
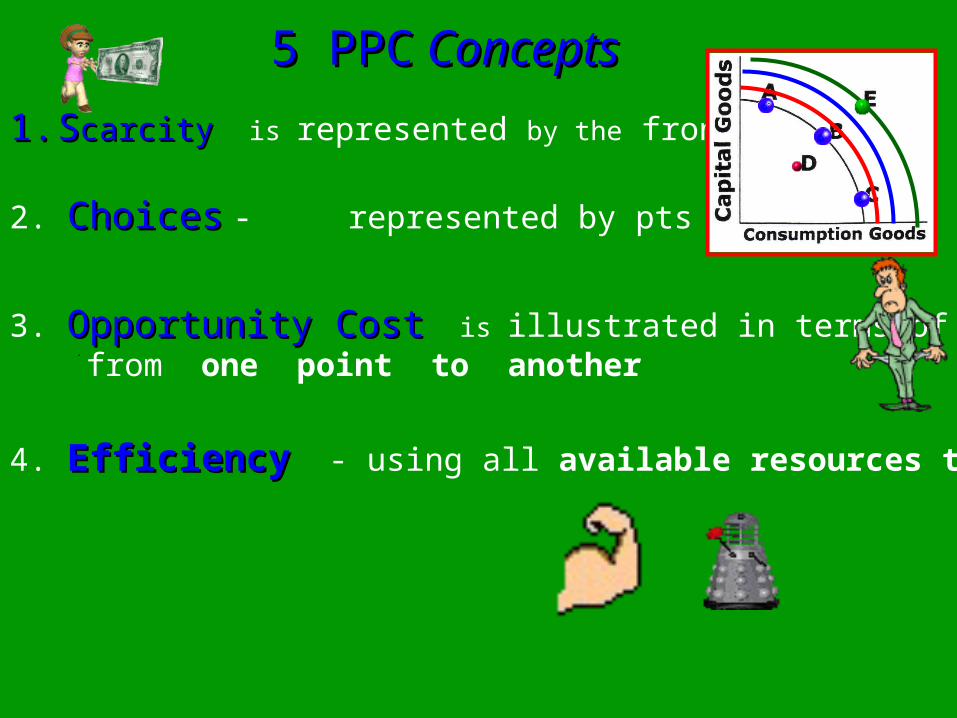
1.1. SScarcitycarcity is represented by the frontier line.
2. ChoicesChoices - represented by pts A, B. or C.
3. Opportunity CostOpportunity Cost is illustrated in terms of moving from one point to another
4. EfficiencyEfficiency - using all available resources to produce.
5 PPC5 PPC Concepts Concepts
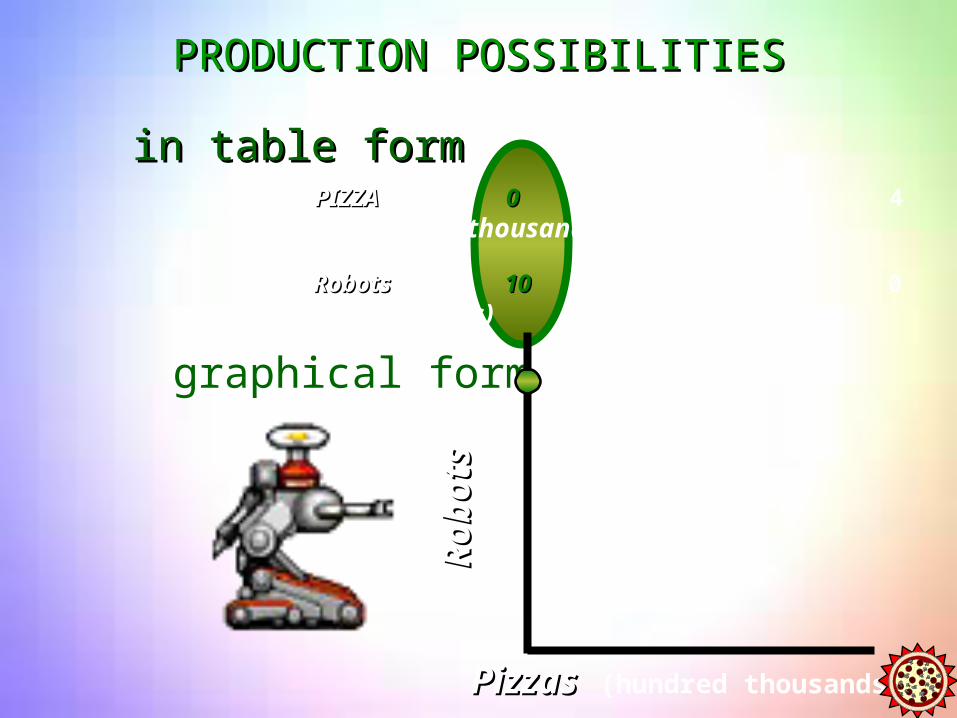
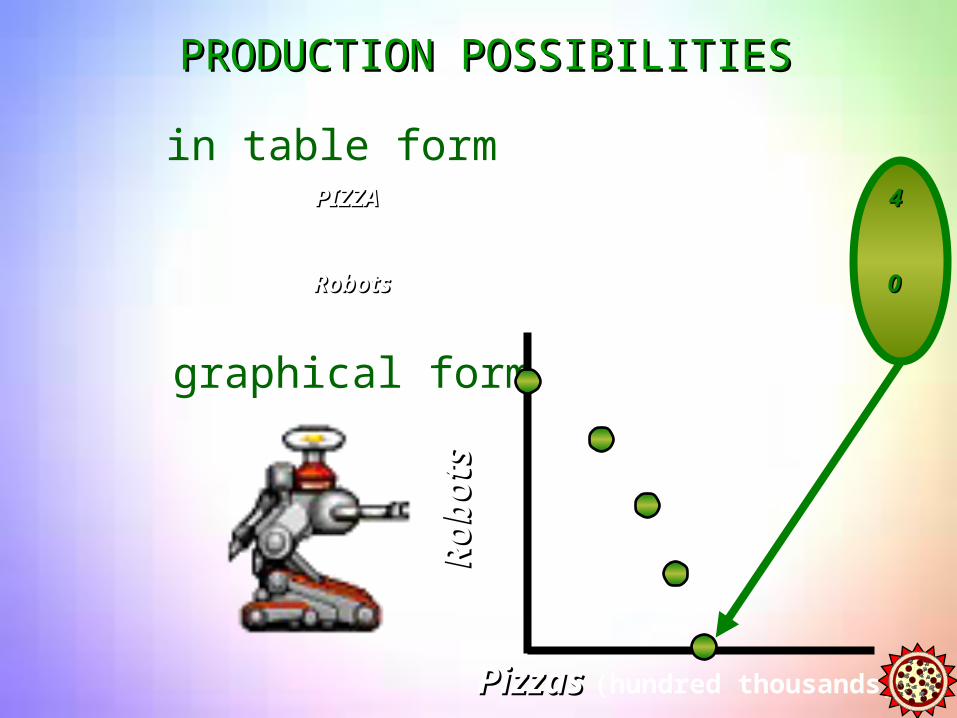
PIZZAPIZZA 00 1 2 3 4(in hundred thousands)
RobotsRobots 1010 9 7 4 0(in thousands)
in table formin table form
graphical form
Ro
bo
tsR
ob
ots
(th
ou
san
ds)
PizzasPizzas (hundred thousands)
PRODUCTION POSSIBILITIESPRODUCTION POSSIBILITIES
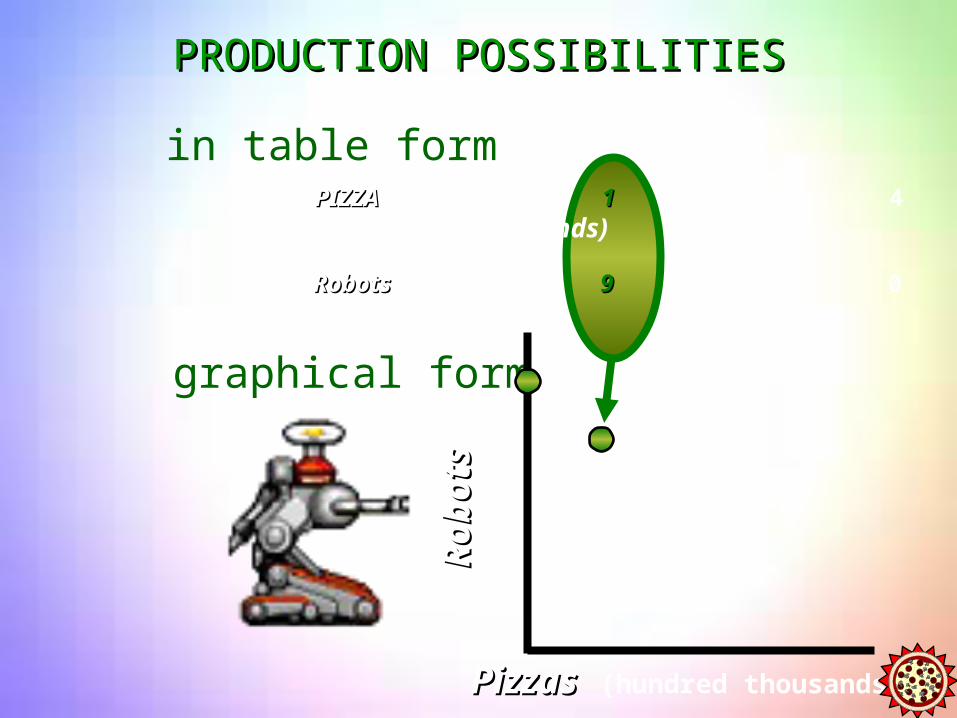
PIZZAPIZZA 0 11 2 3 4(in hundred thousands)
RobotsRobots 10 99 7 4 0(in thousands)
in table form
graphical form
Ro
bo
tsR
ob
ots
(th
ou
san
ds)
PizzasPizzas (hundred thousands)
PRODUCTION POSSIBILITIESPRODUCTION POSSIBILITIES
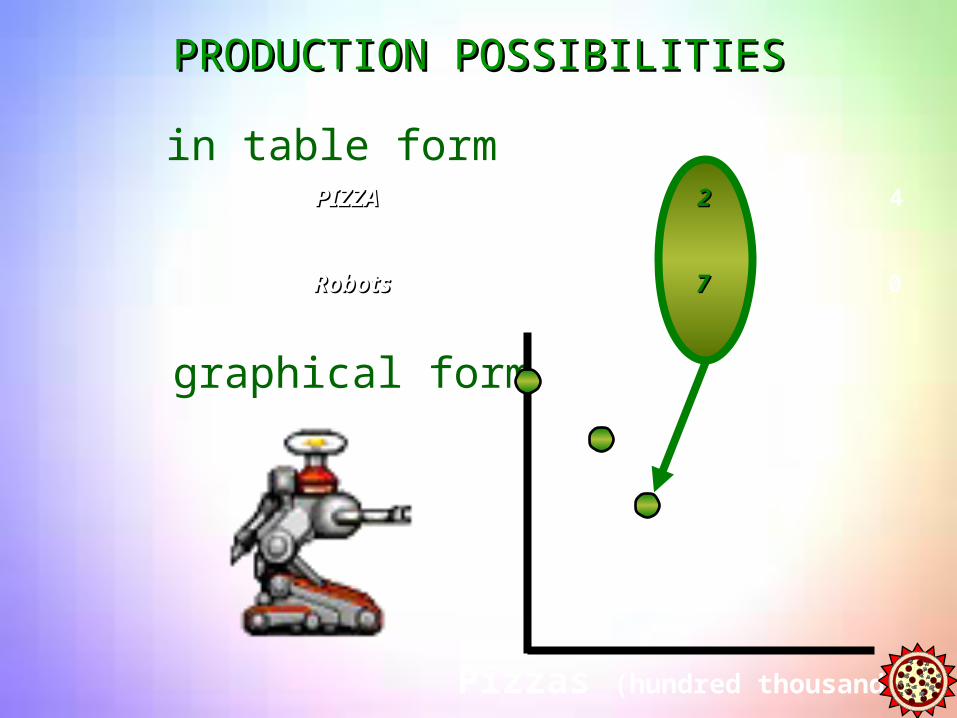
PIZZAPIZZA 0 1 22 3 4(in hundred thousands)
RobotsRobots 10 9 77 4 0(in thousands)
in table form
graphical form
Ro
bo
ts(t
ho
usa
nd
s)
Pizzas (hundred thousands)
PRODUCTION POSSIBILITIESPRODUCTION POSSIBILITIES
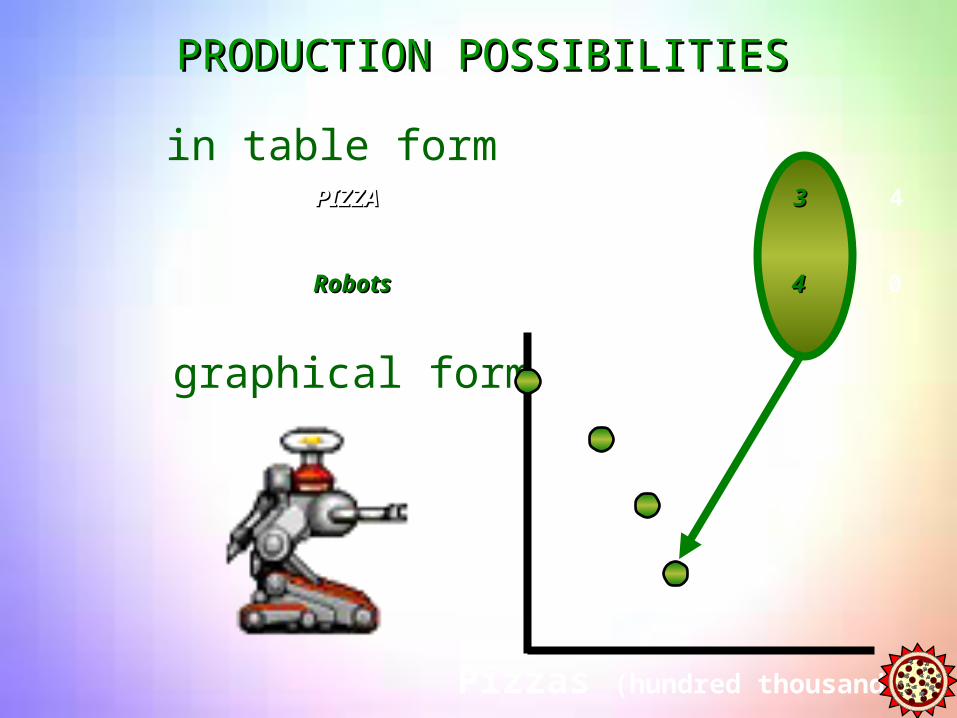
PIZZAPIZZA 0 1 2 33 4(in hundred thousands)
RobotsRobots 10 9 7 44 0(in thousands)
in table form
graphical form
Ro
bo
ts(t
ho
usa
nd
s)
Pizzas (hundred thousands)
PRODUCTION POSSIBILITIESPRODUCTION POSSIBILITIES
PIZZAPIZZA 0 1 2 3 44(in hundred thousands)
RobotsRobots 10 9 7 4 00(in thousands)
in table form
graphical form
Ro
bo
tsR
ob
ots
(th
ou
san
ds)
Pizzas Pizzas (hundred thousands)
PRODUCTION POSSIBILITIESPRODUCTION POSSIBILITIES
Q
Ro
bo
tsR
ob
ots
(th
ou
san
ds)
PizzasPizzas (hundred thousands)
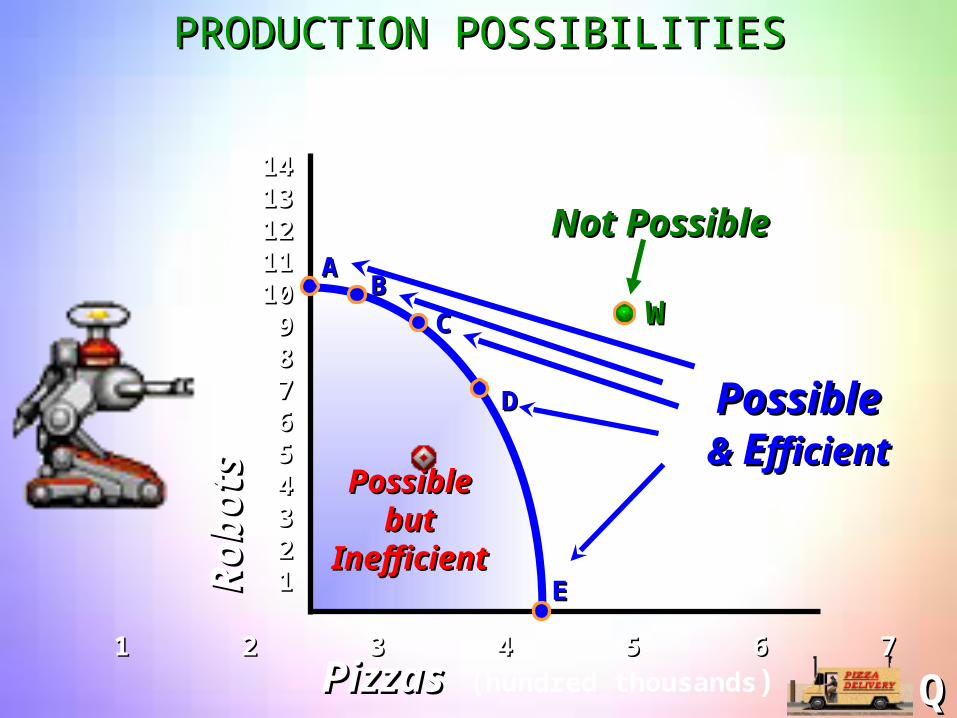
14141313121211111010 99 88 77 66 55 44 33 22 11
1 2 3 4 5 6 7 81 2 3 4 5 6 7 8
AABB
CC
DD
EE
WW
PossiblePossiblebutbut
InefficientInefficient
Not PossibleNot Possible
PossiblePossible& & EEfficientfficient
PRODUCTION POSSIBILITIESPRODUCTION POSSIBILITIES
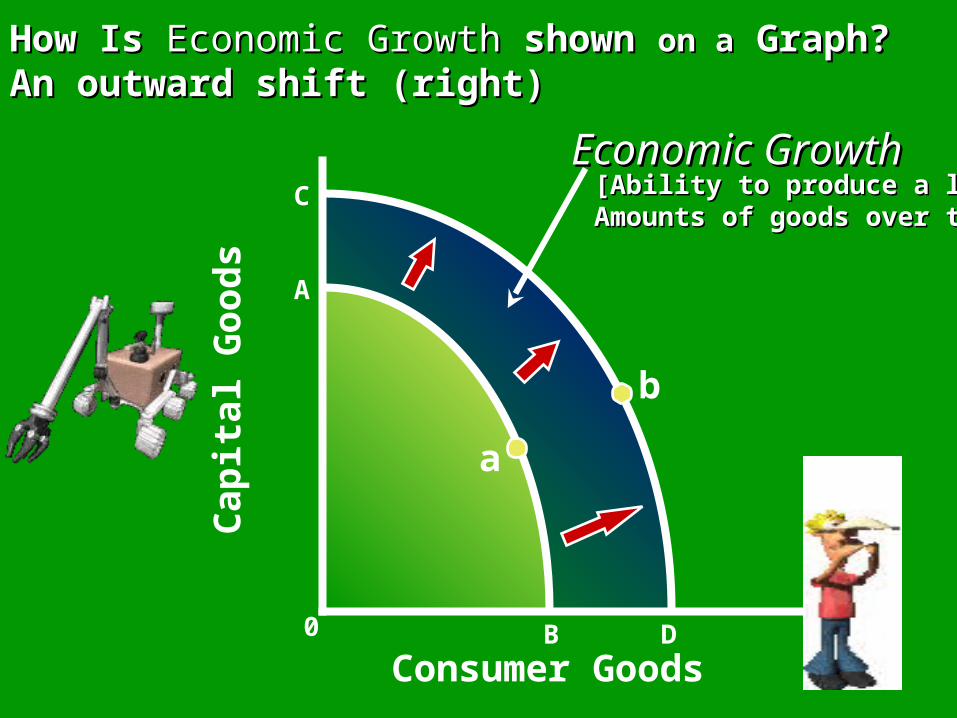
How Is How Is Economic GrowthEconomic Growth shown shown on aon a Graph? Graph? An outward shift (right)An outward shift (right)
Economic GrowthEconomic Growth
A
B
C
D
a
b
Cap
ital
Go
od
s
Consumer Goods0
[Ability to produce a larger[Ability to produce a largerAmounts of goods over time]Amounts of goods over time]
Q
Q
Ro
bo
tsR
ob
ots
(th
ou
san
ds)
PizzasPizzas (hundred thousands)
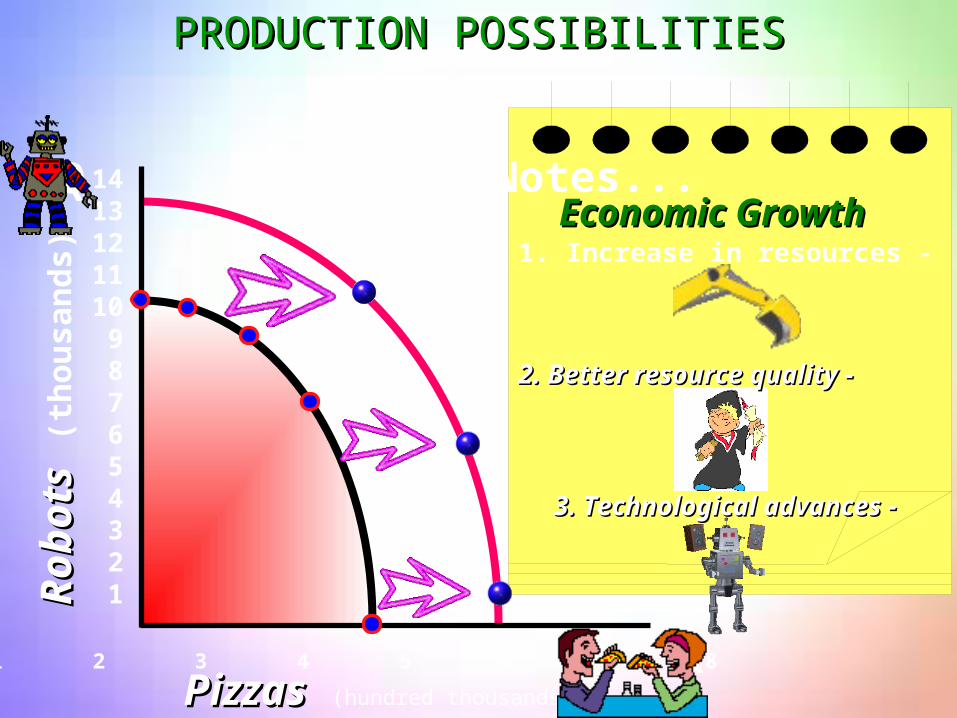
1413121110 9 8 7 6 5 4 3 2 1
1 2 3 4 5 6 7 8
More of either orboth is possible
PRODUCTION POSSIBILITIESPRODUCTION POSSIBILITIES
Notes...Economic GrowthEconomic Growth
1. Increase in resources -
2. Better resource quality -2. Better resource quality -
3. Technological advances -3. Technological advances -
Let’s Review
• What does the PPC show?• What do points inside the curve represent?• What do points outside the curve represent?• What do points on the curve represent?• How can we determine the opportunity cost?• How is economic growth represented on the
PPC?• What can cause economic growth?