the production and consumption of alcoholic beverages
TRANSCRIPT
The Production and Consumption of Alcoholic BeveragesSource: Publications of the American Statistical Association, Vol. 6, No. 41 (Mar., 1898), pp.57-59Published by: American Statistical AssociationStable URL: http://www.jstor.org/stable/2276397 .
Accessed: 25/05/2014 05:02
Your use of the JSTOR archive indicates your acceptance of the Terms & Conditions of Use, available at .http://www.jstor.org/page/info/about/policies/terms.jsp
.JSTOR is a not-for-profit service that helps scholars, researchers, and students discover, use, and build upon a wide range ofcontent in a trusted digital archive. We use information technology and tools to increase productivity and facilitate new formsof scholarship. For more information about JSTOR, please contact [email protected].
.
American Statistical Association is collaborating with JSTOR to digitize, preserve and extend access toPublications of the American Statistical Association.
http://www.jstor.org
This content downloaded from 195.78.109.123 on Sun, 25 May 2014 05:02:09 AMAll use subject to JSTOR Terms and Conditions
57] Production and Consumption of Alcoholic Beverages. 57
THE PRODUCTION AND CONSUMPTION OF ALCOHOLIC BEVERAGES.
A Memorandum recently prepared in the Commercial Department of the Board of Trade of Great Britain (summarized in the Board
of Trade Journal, vol. 24, p. 13) shows the production and con?
sumption of alcoholic liquors in the chief European countries and in the United States. The returns have been compiled from the
various official statistics issued by the governments of the different
countries referred to, supplemented in many cases by information
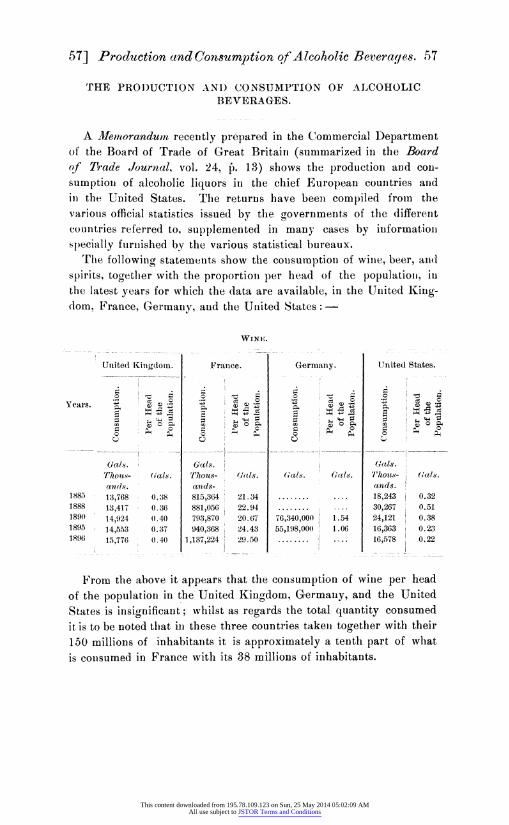
specially furnished by the various statistical bureaux. The following statements show the consumption of wine, beer, and
spirits, together with the proportion per head of the population, in
the latest years for which the data are available, in the United King? dom, France, Germany, and the United States : ?
Wine.
Years.
United Kingdom.
fe o Ph
1885 1888 1890 1895 1896
Gala. Thous? ands. 13,768 13,417 14,924 14,553 15,776
Gals.
0.38 0.36 0.40 0.37 0.40
W ? *
Gals. Thous- ands- 815,364 881,056 793,870 940,368
1,137,224
21.34 22.94 20.67 24.43 29.50
Germany.
a s,
Gals. Gals.
76,340,000 I 1.54 55,198,000 j 1.06
United States.
a 3 *
Gals. Thous? ands. 18,243 30,267 24,121 16,363 16,578
Gah.
0.32 0.51 0.38 0.23 0.22
From the above it appears that the consumption of wine per head
of the population in the United Kingdom, Germany, and the United
States is insignificant; whilst as regards the total quantity consumed
it is to be noted that in these three countries taken together with their
150 millions of inhabitants it is approximately a tenth part of what
is consumed in France with its 38 millions of inhabitants.
This content downloaded from 195.78.109.123 on Sun, 25 May 2014 05:02:09 AMAll use subject to JSTOR Terms and Conditions
58 American Statistical Association. [58
Years.
United Kingdom.
1885 1888 1890 1895 1896
Gals. Thous? ands. 975,645
1,003,475 1,124,525 1,160,127 1,211,529
Gals.
27.1 27.2 30.0 29.6 30.7
Gals. Thous? ands.
182,952 178,222 189,838 196,548 199,122*
W 5 ^
Gals.
4.6 4.4 4.8 5.1 5.2
Germany.
Gals. 'Thous? ands. 908,292
1,015,916 1,142,042 1,215,676 1,333,090
X 3 3
19.8 21.5 23.3 23.5 25.5
United States.
Gals. Thous? ands.
476,578 639,400 712,875 869,062 900,161
E 5 ?
8.8 10.7 11.4 12.4 12.7
* Proof gallons containing 50 per cent of alcohol.
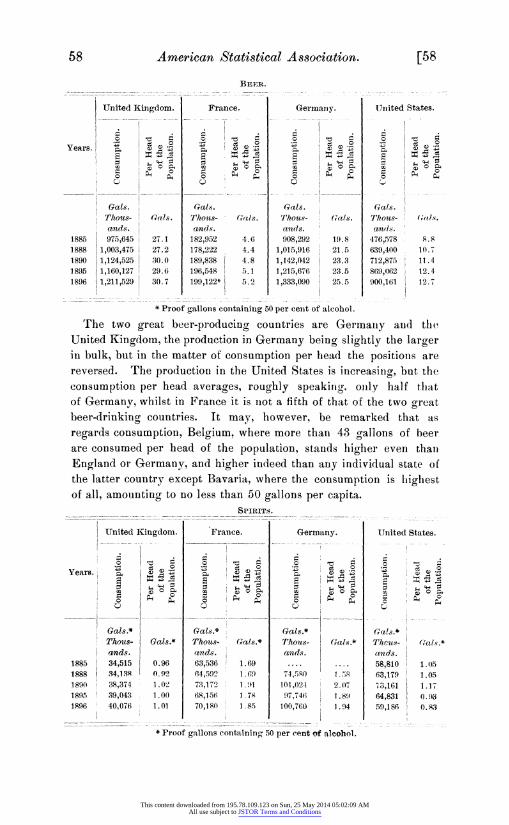
The two great beer-producing countries are Germany and the
United Kingdom, the production in Germany being slightly the larger in bulk, but in the matter of consumption per head the positions are reversed. The production in the United States is increasing, but the
consumption per head averages, roughly speaking, only half that of Germany, whilst in France it is not a fifth of that of the two great beer-drinking countries. It may, however, be remarked that as
regards consumption, Belgium, where more than 43 gallons of beer are consumed per head of the population, stands higher even than
England or Germany, and higher indeed than any individual state of the latter country except Bavaria, where the consumption is highest of all, amounting to no less than 50 gallons per capita.
Spirits.
Years.
United Kingdom.
W 5 ^
1885 1888 1890 1895 1896
Gals* Thous? ands. 34,515 34,138 38,374 39,043 40,076
Gals*
0.96 0.92 1.02 1.00 1.01
s_ ?** fl
Gals* Thous? ands. 63,536 64,592 73,172 68,156 70,180
1.69 1.69 1.91 1.78 1.85
Germany.
Gals* Thous? ands.
74,580 101,024 97,746
100,760
Gah."
1.58 2.07 1.89 1.94
United States.
w "B *
Gals* Thous? ands. 58,810 63,179 13,161 64,831 59,186
1.05 1.05 1.17 0.93 0.83
* Proof gallons containing 50 per cent of alcohol.
This content downloaded from 195.78.109.123 on Sun, 25 May 2014 05:02:09 AMAll use subject to JSTOR Terms and Conditions
59] Comparative Criminal Statistics. 59
From the above it appears that the consumption of spirits in the
United Kingdom and the United States does not differ very materially,
averaging in each instance about one gallon per head. In France, and in Germany, also, the case is, however, altogether different, for
here the consumption over a series of years averages more nearly two
gallons per head than one. . . . As regards the question of the taxation of alcoholic beverages it is
stated in the memorandum that the United Kingdom, France, Ger?
many, and the United States all derive large revenues from the
taxation of such beverages, the actual proportion so derived to the
total revenue being in the case of the United Kingdom 35 per cent; in France, 19 percent; in the United States, 30 per cent; and in
Germany, 17^- per cent; and it is in these countries that the amount
of drink consumed is the largest.? Board of Trade Journal, London, volume xxiv, number 138.
COMPARATIVE CRIMINAL STATISTICS.
The following summarized report is reprinted from Notes on the
Subjects Discussed at the St. Petersburg Meeting of the International
Statistical Institute, presented by Major P. E. Craigie at a meeting of the Royal Statistical Society : ?
M. Tarnovsky read a paper, which presented features of special in?
terest, on the proportion of Acquittals to Offences and Crimes in
Russia from 1889-98. He thought that sufficient attention had not
hitherto been given to the numerically recorded results of the differ?
ent systems of jurisdiction in vogue in the great European countries.
There were difficulties owing to the varied forms of criminal pro? cedure, but points for comparison might be found in such questions as
the relative proportion of acquittals by different tribunals.
In general there were more acquittals in trials by jury than with?
out. He gave a table illustrating this by the proportion of acquittals for every 100 persons tried in a court of first instance in the follow?
ing countries : ?
This content downloaded from 195.78.109.123 on Sun, 25 May 2014 05:02:09 AMAll use subject to JSTOR Terms and Conditions