the physiology and pathology of formula one grand prix ... · the physiology and pathology of...
TRANSCRIPT
CHAPTER 14
The Physiology and Pathology of Formula One Grand PrixMotor Racing
Eric S. Watkins, O.B.E., M.D., D.Sc., F.R.C.S.
INTRODUCTION
In 1978, Professor Watkins was appointed as Surgical Con-sultant to the Formula One Constructors Association, the
body representing Grand Prix racing in the World Champi-onship Formula One races of the Federation du Sport deL’automobile (FIA), the World Governing body for Interna-tional Motor Sport. His presence was required at all GrandPrix events from June 1978 until November 2004, a total of423 races. His role was to raise the standards of medicalresponse at the circuits and to provide specialist medicaladvice in the case of injury.
In May 1994, after a disastrous weekend at Imola, Italy,in which two drivers were killed, the President of the FIA,Max Mosley, appointed Professor Watkins to chair a com-mission of experts to examine all aspects of car construction,circuit design, and safety features, with the ultimate goal ofzero mortality in Formula One Grand Prix Racing. Muchresearch emanated from this important decision. Researchextended into other forms of motor racing and led to theformation of the Institute of Motor Sport Safety in 2004,which encompasses now all Open Cockpit car racing, Closedcar racing (Rally, Saloon, Grand Touring) and recently Go-kart racing.
THE PHYSIOLOGY OF MOTOR RACINGThe emotional and physical stresses experienced by a
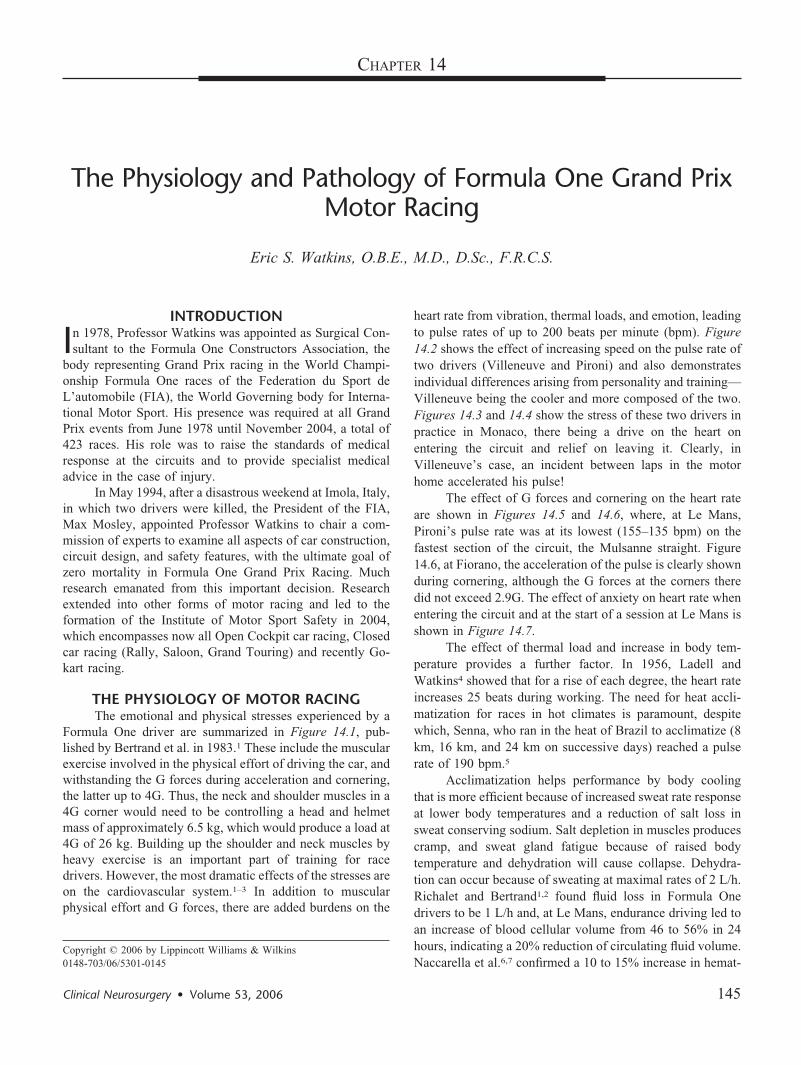
Formula One driver are summarized in Figure 14.1, pub-lished by Bertrand et al. in 1983.1 These include the muscularexercise involved in the physical effort of driving the car, andwithstanding the G forces during acceleration and cornering,the latter up to 4G. Thus, the neck and shoulder muscles in a4G corner would need to be controlling a head and helmetmass of approximately 6.5 kg, which would produce a load at4G of 26 kg. Building up the shoulder and neck muscles byheavy exercise is an important part of training for racedrivers. However, the most dramatic effects of the stresses areon the cardiovascular system.1–3 In addition to muscularphysical effort and G forces, there are added burdens on the
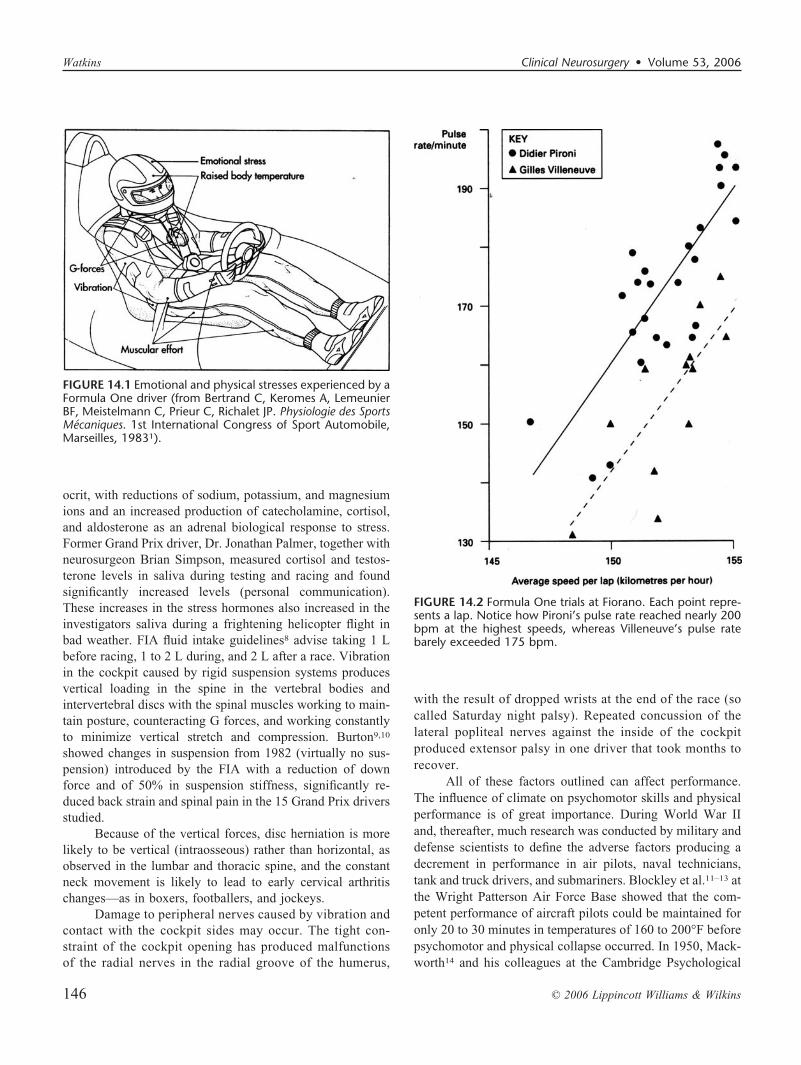
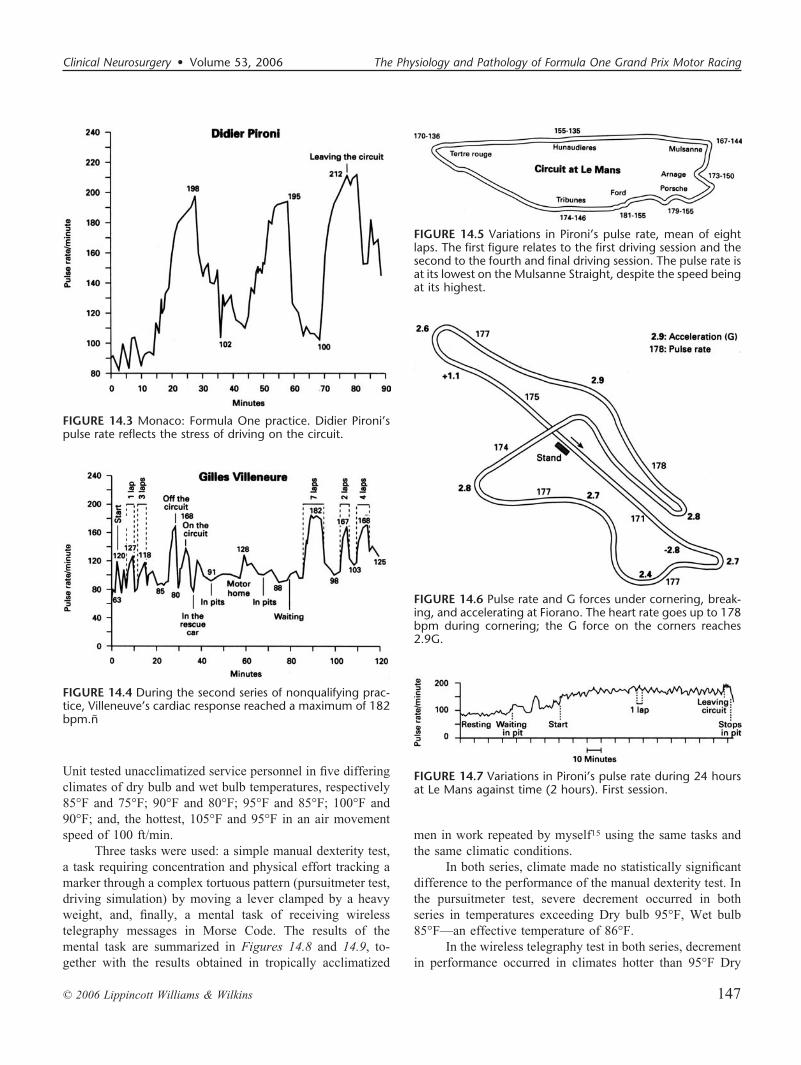
heart rate from vibration, thermal loads, and emotion, leadingto pulse rates of up to 200 beats per minute (bpm). Figure14.2 shows the effect of increasing speed on the pulse rate oftwo drivers (Villeneuve and Pironi) and also demonstratesindividual differences arising from personality and training—Villeneuve being the cooler and more composed of the two.Figures 14.3 and 14.4 show the stress of these two drivers inpractice in Monaco, there being a drive on the heart onentering the circuit and relief on leaving it. Clearly, inVilleneuve’s case, an incident between laps in the motorhome accelerated his pulse!
The effect of G forces and cornering on the heart rateare shown in Figures 14.5 and 14.6, where, at Le Mans,Pironi’s pulse rate was at its lowest (155–135 bpm) on thefastest section of the circuit, the Mulsanne straight. Figure14.6, at Fiorano, the acceleration of the pulse is clearly shownduring cornering, although the G forces at the corners theredid not exceed 2.9G. The effect of anxiety on heart rate whenentering the circuit and at the start of a session at Le Mans isshown in Figure 14.7.
The effect of thermal load and increase in body tem-perature provides a further factor. In 1956, Ladell andWatkins4 showed that for a rise of each degree, the heart rateincreases 25 beats during working. The need for heat accli-matization for races in hot climates is paramount, despitewhich, Senna, who ran in the heat of Brazil to acclimatize (8km, 16 km, and 24 km on successive days) reached a pulserate of 190 bpm.5
Acclimatization helps performance by body coolingthat is more efficient because of increased sweat rate responseat lower body temperatures and a reduction of salt loss insweat conserving sodium. Salt depletion in muscles producescramp, and sweat gland fatigue because of raised bodytemperature and dehydration will cause collapse. Dehydra-tion can occur because of sweating at maximal rates of 2 L/h.Richalet and Bertrand1,2 found fluid loss in Formula Onedrivers to be 1 L/h and, at Le Mans, endurance driving led toan increase of blood cellular volume from 46 to 56% in 24hours, indicating a 20% reduction of circulating fluid volume.Naccarella et al.6,7 confirmed a 10 to 15% increase in hemat-
Copyright © 2006 by Lippincott Williams & Wilkins0148-703/06/5301-0145
Clinical Neurosurgery • Volume 53, 2006 145
ocrit, with reductions of sodium, potassium, and magnesiumions and an increased production of catecholamine, cortisol,and aldosterone as an adrenal biological response to stress.Former Grand Prix driver, Dr. Jonathan Palmer, together withneurosurgeon Brian Simpson, measured cortisol and testos-terone levels in saliva during testing and racing and foundsignificantly increased levels (personal communication).These increases in the stress hormones also increased in theinvestigators saliva during a frightening helicopter flight inbad weather. FIA fluid intake guidelines8 advise taking 1 Lbefore racing, 1 to 2 L during, and 2 L after a race. Vibrationin the cockpit caused by rigid suspension systems producesvertical loading in the spine in the vertebral bodies andintervertebral discs with the spinal muscles working to main-tain posture, counteracting G forces, and working constantlyto minimize vertical stretch and compression. Burton9,10
showed changes in suspension from 1982 (virtually no sus-pension) introduced by the FIA with a reduction of downforce and of 50% in suspension stiffness, significantly re-duced back strain and spinal pain in the 15 Grand Prix driversstudied.
Because of the vertical forces, disc herniation is morelikely to be vertical (intraosseous) rather than horizontal, asobserved in the lumbar and thoracic spine, and the constantneck movement is likely to lead to early cervical arthritischanges—as in boxers, footballers, and jockeys.
Damage to peripheral nerves caused by vibration andcontact with the cockpit sides may occur. The tight con-straint of the cockpit opening has produced malfunctionsof the radial nerves in the radial groove of the humerus,
with the result of dropped wrists at the end of the race (socalled Saturday night palsy). Repeated concussion of thelateral popliteal nerves against the inside of the cockpitproduced extensor palsy in one driver that took months torecover.
All of these factors outlined can affect performance.The influence of climate on psychomotor skills and physicalperformance is of great importance. During World War IIand, thereafter, much research was conducted by military anddefense scientists to define the adverse factors producing adecrement in performance in air pilots, naval technicians,tank and truck drivers, and submariners. Blockley et al.11–13 atthe Wright Patterson Air Force Base showed that the com-petent performance of aircraft pilots could be maintained foronly 20 to 30 minutes in temperatures of 160 to 200°F beforepsychomotor and physical collapse occurred. In 1950, Mack-worth14 and his colleagues at the Cambridge Psychological
FIGURE 14.1 Emotional and physical stresses experienced by aFormula One driver (from Bertrand C, Keromes A, LemeunierBF, Meistelmann C, Prieur C, Richalet JP. Physiologie des SportsMecaniques. 1st International Congress of Sport Automobile,Marseilles, 19831).
FIGURE 14.2 Formula One trials at Fiorano. Each point repre-sents a lap. Notice how Pironi’s pulse rate reached nearly 200bpm at the highest speeds, whereas Villeneuve’s pulse ratebarely exceeded 175 bpm.
Watkins Clinical Neurosurgery • Volume 53, 2006
© 2006 Lippincott Williams & Wilkins146
Unit tested unacclimatized service personnel in five differingclimates of dry bulb and wet bulb temperatures, respectively85°F and 75°F; 90°F and 80°F; 95°F and 85°F; 100°F and90°F; and, the hottest, 105°F and 95°F in an air movementspeed of 100 ft/min.
Three tasks were used: a simple manual dexterity test,a task requiring concentration and physical effort tracking amarker through a complex tortuous pattern (pursuitmeter test,driving simulation) by moving a lever clamped by a heavyweight, and, finally, a mental task of receiving wirelesstelegraphy messages in Morse Code. The results of themental task are summarized in Figures 14.8 and 14.9, to-gether with the results obtained in tropically acclimatized
men in work repeated by myself15 using the same tasks andthe same climatic conditions.
In both series, climate made no statistically significantdifference to the performance of the manual dexterity test. Inthe pursuitmeter test, severe decrement occurred in bothseries in temperatures exceeding Dry bulb 95°F, Wet bulb85°F—an effective temperature of 86°F.
In the wireless telegraphy test in both series, decrementin performance occurred in climates hotter than 95°F Dry
FIGURE 14.3 Monaco: Formula One practice. Didier Pironi’spulse rate reflects the stress of driving on the circuit.
FIGURE 14.4 During the second series of nonqualifying prac-tice, Villeneuve’s cardiac response reached a maximum of 182bpm.ñ
FIGURE 14.5 Variations in Pironi’s pulse rate, mean of eightlaps. The first figure relates to the first driving session and thesecond to the fourth and final driving session. The pulse rate isat its lowest on the Mulsanne Straight, despite the speed beingat its highest.
FIGURE 14.6 Pulse rate and G forces under cornering, break-ing, and accelerating at Fiorano. The heart rate goes up to 178bpm during cornering; the G force on the corners reaches2.9G.
FIGURE 14.7 Variations in Pironi’s pulse rate during 24 hoursat Le Mans against time (2 hours). First session.
Clinical Neurosurgery • Volume 53, 2006 The Physiology and Pathology of Formula One Grand Prix Motor Racing
© 2006 Lippincott Williams & Wilkins 147
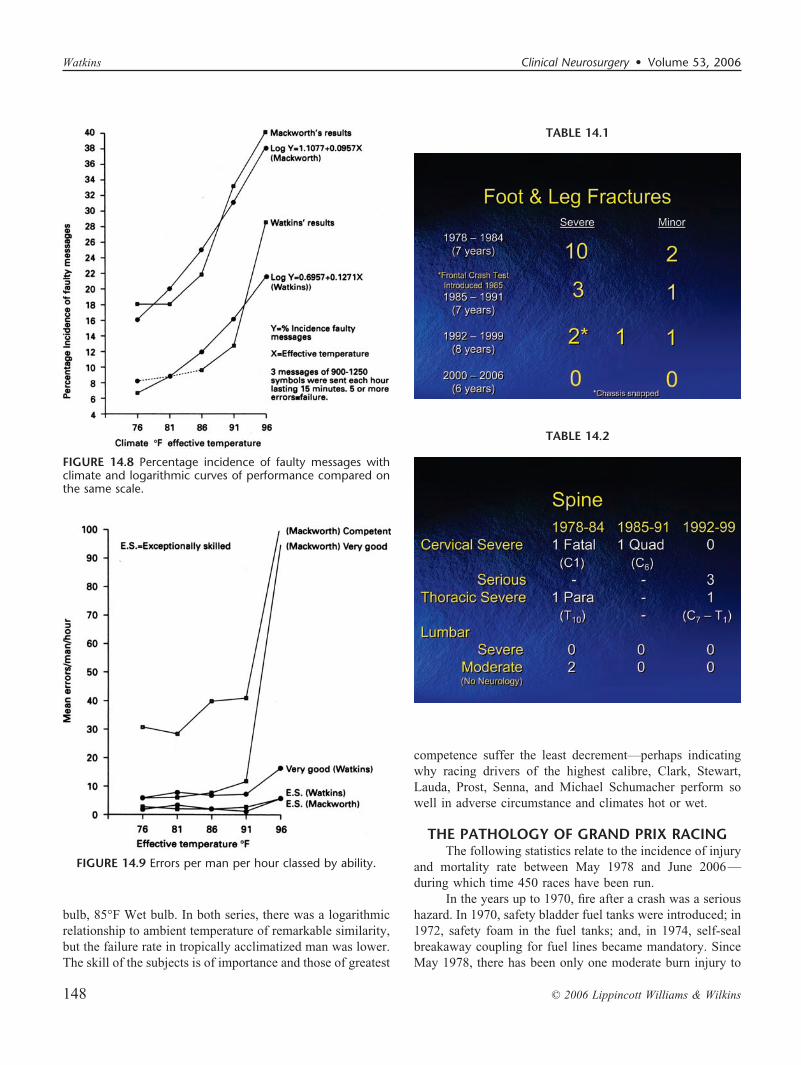
bulb, 85°F Wet bulb. In both series, there was a logarithmicrelationship to ambient temperature of remarkable similarity,but the failure rate in tropically acclimatized man was lower.The skill of the subjects is of importance and those of greatest
competence suffer the least decrement—perhaps indicatingwhy racing drivers of the highest calibre, Clark, Stewart,Lauda, Prost, Senna, and Michael Schumacher perform sowell in adverse circumstance and climates hot or wet.
THE PATHOLOGY OF GRAND PRIX RACINGThe following statistics relate to the incidence of injury
and mortality rate between May 1978 and June 2006—during which time 450 races have been run.
In the years up to 1970, fire after a crash was a serioushazard. In 1970, safety bladder fuel tanks were introduced; in1972, safety foam in the fuel tanks; and, in 1974, self-sealbreakaway coupling for fuel lines became mandatory. SinceMay 1978, there has been only one moderate burn injury to
TABLE 14.1
TABLE 14.2
FIGURE 14.8 Percentage incidence of faulty messages withclimate and logarithmic curves of performance compared onthe same scale.
FIGURE 14.9 Errors per man per hour classed by ability.
Watkins Clinical Neurosurgery • Volume 53, 2006
© 2006 Lippincott Williams & Wilkins148
the torso and two minor burns—to the hands in one casebecause of defective gloves and to the posterior neck skin inanother driver who took his helmet off—with the rear placedengine on fire! Similarly injury to upper limbs has been rare,one case of compound metacarpal fracture and one of fractureof the radius and ulna. In the years 1978 to 1984, however,there were frequent injuries to the legs.
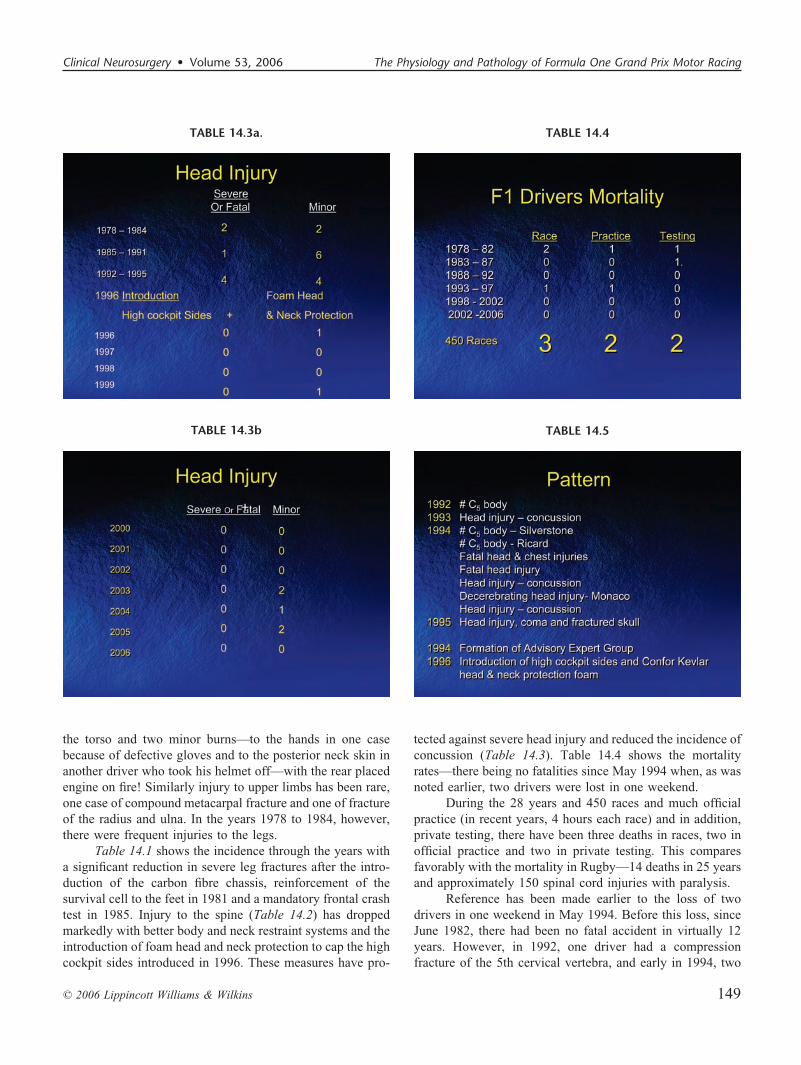
Table 14.1 shows the incidence through the years witha significant reduction in severe leg fractures after the intro-duction of the carbon fibre chassis, reinforcement of thesurvival cell to the feet in 1981 and a mandatory frontal crashtest in 1985. Injury to the spine (Table 14.2) has droppedmarkedly with better body and neck restraint systems and theintroduction of foam head and neck protection to cap the highcockpit sides introduced in 1996. These measures have pro-
tected against severe head injury and reduced the incidence ofconcussion (Table 14.3). Table 14.4 shows the mortalityrates—there being no fatalities since May 1994 when, as wasnoted earlier, two drivers were lost in one weekend.
During the 28 years and 450 races and much officialpractice (in recent years, 4 hours each race) and in addition,private testing, there have been three deaths in races, two inofficial practice and two in private testing. This comparesfavorably with the mortality in Rugby—14 deaths in 25 yearsand approximately 150 spinal cord injuries with paralysis.
Reference has been made earlier to the loss of twodrivers in one weekend in May 1994. Before this loss, sinceJune 1982, there had been no fatal accident in virtually 12years. However, in 1992, one driver had a compressionfracture of the 5th cervical vertebra, and early in 1994, two
TABLE 14.3a. TABLE 14.4
TABLE 14.5TABLE 14.3b
Clinical Neurosurgery • Volume 53, 2006 The Physiology and Pathology of Formula One Grand Prix Motor Racing
© 2006 Lippincott Williams & Wilkins 149
drivers had compression fractures of again the 5th cervicalvertebra. Subsequently, in May 1994, the two drivers killeddied from head injury, one of whom also had a C7–T1 spinalfracture and chest injuries. At the following race in May, inpractice, a driver sustained a decerebrating brain injury fromstriking his head against a protective barrier, but made a goodrecovery eventually. In the same period, two other drivers hadconcussion from striking their heads on the steering wheel.These events are summarized in Table 14.5. In response tothe May fatalities and the decerebrating head injury, MaxMosley, President of the FIA, appointed an Expert AdvisoryGroup to examine all aspects of safety—car and circuitdesign and barrier protection. Regulations were also intro-duced to reduce speed on the circuits, particularly at corners.The group consisted of expert engineers and designers, the
FIA safety delegates and race directors, an eminent FormulaOne driver, and, ultimately, expert bioengineers from theTransport Research Laboratory (UK) and Daimler MercedesBenz in Stuttgart. Research was immediately instituted withthe Motor Industry Research Association at Nuneaton andcrash testing with high-G sled tests started with instrumentedsophisticated dummies (Hybrid III) using a McLaren FormulaOne chassis. In frontal, rear, side impact, and angled frontaland rear impacts, the response of the facsimile human formwas cinephotographed at high speed, videotaped, and multi-ple accelerometers provided G force information sustained inthese simulations in the head, neck, chest, and pelvis of thedummies. The results were fascinating, showing that the headand neck movement were remarkably excessive. In frontalimpacts, the helmet of the dummy struck the steering wheel
TABLE 14.6
TABLE 14.7.
TABLE 14.8
TABLE 14.9
Watkins Clinical Neurosurgery • Volume 53, 2006
© 2006 Lippincott Williams & Wilkins150
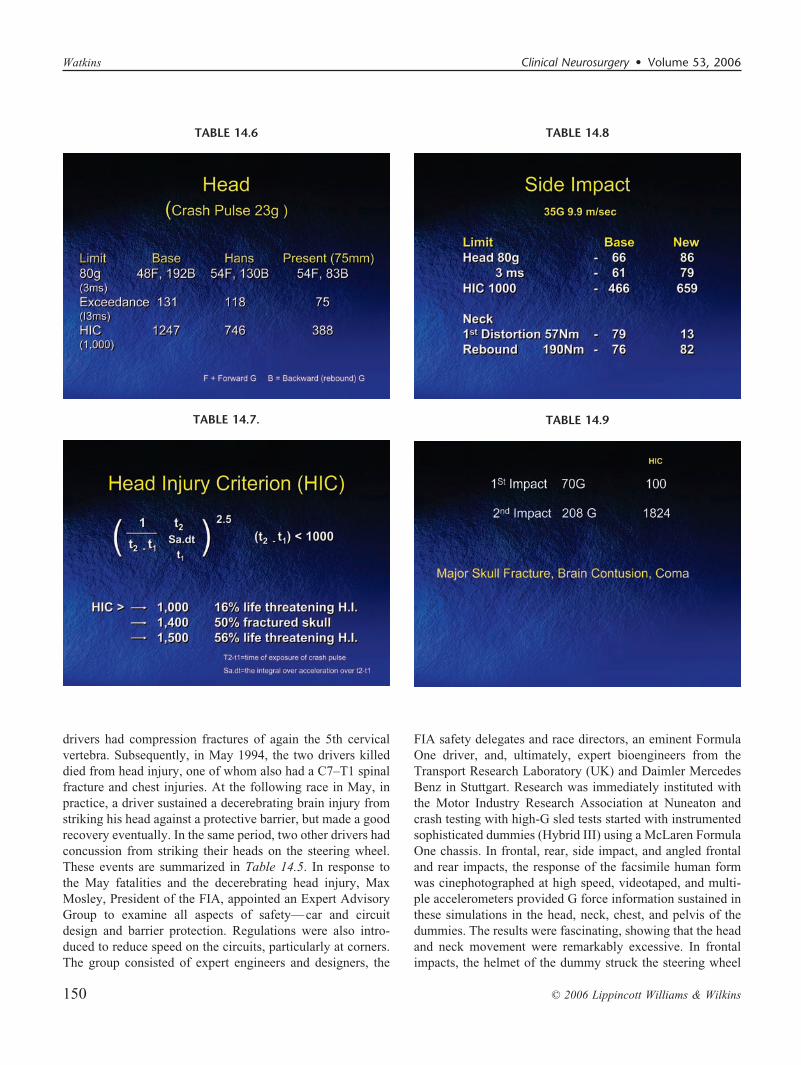
or the cockpit edge as the safety belts stretched, and then thehead was thrown back on rebound to impact the chassis at theback of the cockpit. Table 14.6 shows with a crash pulse ofonly 23G (speed 11.4 m/s), the head injury tolerance limit (80g during a 3-ms duration) was exceeded on rebound byapproximately 250%, reaching 192G. Correlations with pre-vious experience in road accidents using the Head InjuryCriterion (HIC) (Table 14.7) indicated at 192G a coefficientof 1247. As may be seen in Table 14.8, this could be expectedto result in a life-threatening head injury in 16% of cases. Theuse of the Head and Neck Restraint alone (HANS) inventedby Professor Hubbard of Michigan State University, wouldreduce the G force on rebound to 130G (HIC746) and,together with the Confor foam (75-mm thick) head and neckcockpit protection, to 83G (HIC388)—levels well below the
injury tolerance level of HIC 1000. Early experiments in-creasing the width of the seat belts from 50 mm to 75 mm tospread the load on the chest immediately reduced the chestloads to 43G—below the injury tolerance level of 60G during3 ms.
Cinephotography of the side impact tests with a crashpulse of 35G (speed 9.9 m/s) showed frightening lateraldistortion of the neck. Table 14.8 shows the head and neckloads, the primary neck distortion at 79 Nm exceeded theinjury tolerance level of 57 Nm. The rebound level 76 Nmwas well within the tolerance at 190 Nm. Introduction of highsides with Confor foam head and neck rest brought theprimary distortion down to 13 Nm and the rebound still wellwithin the tolerance level. The head G was increased some-what, but with a HIC of only 659, safe.
TABLE 14.10a TABLE 14.11
TABLE 14.12TABLE 14.10b
Clinical Neurosurgery • Volume 53, 2006 The Physiology and Pathology of Formula One Grand Prix Motor Racing
© 2006 Lippincott Williams & Wilkins 151
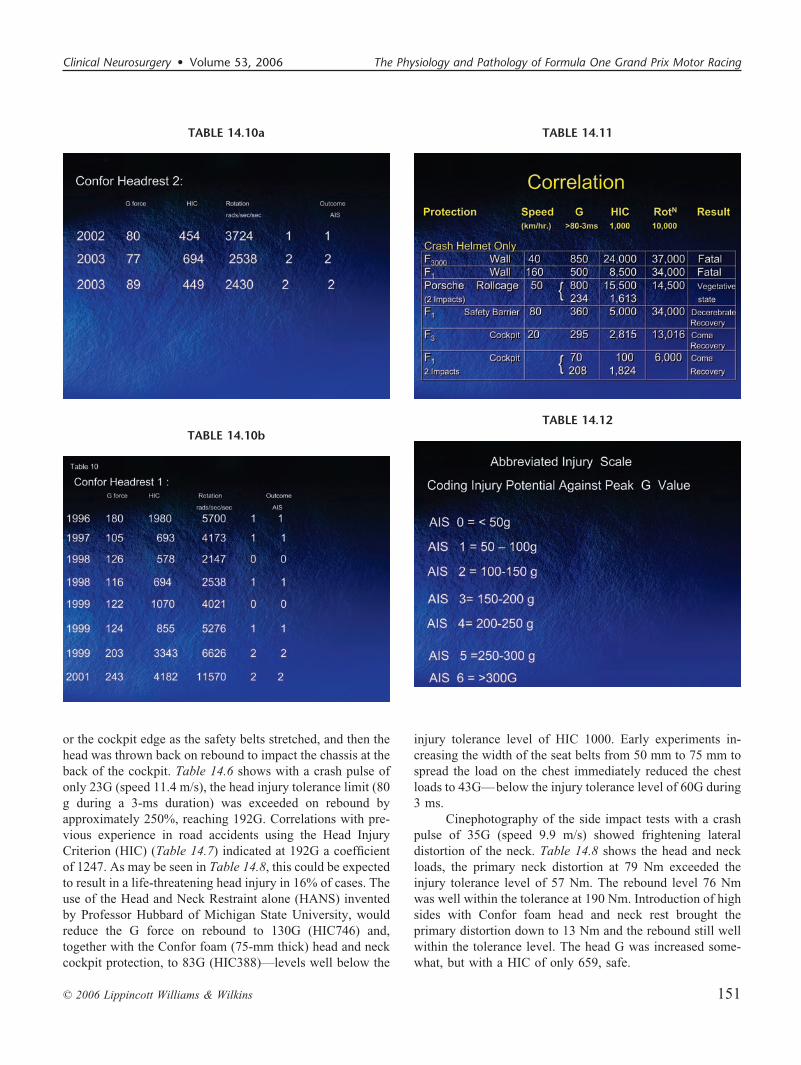
This work was performed in the summer of 1994 and in1995. In the last event of 1995, and before the high cockpitsides and foam protection was made mandatory at the start of1996, a major and important accident occurred, and a driversustained major skull fractures across the base of the craniumfrom mastoid process to mastoid process and through thepituitary fossa. He was immediately unconscious with bilat-eral facial palsies, and magnetic resonance imaging scanshowed multiple brain contusions. The accident was repli-cated at the TRL by Chinn and Mellor, and this showed thattwo impacts had occurred. The first impact was with the sideof the cockpit, at 70G with a HIC of 100, and a second impactfractured part of the steering wheel with an impact of 208Gand a HIC of 1824 (Table 14.9). The driver was in a coma for48 hours but made a slow but complete recovery after surgeryto relieve compression of both facial nerves and to replace theossicles that had dislocated. Since the high cockpit sides andfoam were introduced, there have been no serious headinjuries (Table 14.10), despite major accidents. However, ascan be seen, only minor concussions occurred, even in high-speed accidents, which have been replicated by Mellor.16 Thereplicated accidents with major head injuries in which thedriver was protected only with a crash helmet are summarizedin Table 14.11, together with the neurological outcome. Theenormous improvement since the introduction of the Conforfoam in 1996, and, more recently, the HANS in 2000, isobvious.
In 1997, Accident Data recorders (accelerometers x, y,z) were made compulsory to be fitted to the car to providedata for accident reconstruction. Figure 14.10 shows such arecording, with the peak acceleration reaching 16G.
Using coding injury potential (Abbreviated InjuryScale [AIS]) against peak G values (Table 14.12) and the dataobtained by accident replication, Mellor has produced corre-lations between linear and rotational acceleration and theAIS. These correlations are shown in Figs. 14.11, 14.12, and14.13, and previous criteria for serious or fatal injuries byNewman,17 Schuller,18 Lowenheilm,19 and Ryan et al.20 aresuperimposed on the data obtained by the motor sport acci-dent replication. From these studies, it would seem that the
threshold for injury in linear accidents would be in theseprotected circumstances between 200G and 300G. In rota-tional accidents, the threshold seems to be 5000 rad/s/s. Theseresults correlate well with the earlier studies.17–20
REFERENCES1. Bertrand C, Keromes A, Lemeunier BF, Meistelmann C, Prieur C,
Richalet JP: Physiologie des Sports Mecaniques. 1st International Con-gress of Sport Automobile, Marseilles, 1983.
2. Richalet JP, Bertrand C: Evaluation and Perspectives of Medical Studyon Race Car Drivers. Creteil, Paris, 1983.
3. Richalet JP, Bertrand C: Aspect Physiologique de la Competition Auto-mobile. Creteil, Paris, 1983.
4. Ladell WS, Watkins ES: Prediction of body temperature from heart rate.J Physiol 135:51, 1956.
5. Dallaire J, Marisi DQ, Fagnan R: Reports of Motor Sport ResearchGroup. McGill University, Montreal, 1986.
6. Naccarella F, Nanni G, Savoia M, Barbato G, Accorsi A, Caldarelli P,Bertacinni P, Martuzzi M, Brachetti D: Cardiovascular and HolterMonitoring and Laboristic Evaluation of Fluid, Electrolytes and StressHormone Response to Prolonged Rally Road Racing. Bologna, 1983.
7. Naccarella F, Nanni G, Savoia M, Accorsi A, Caldarelli P, VenturoliMG, Bertacinni P, Bertacinni B, Martuzzi M, Brachetti D: Cardiovas-cular and Holter Monitoring and Assessment of Fluid, Electrolytes andHormones Response Elicited by Psycho-physical Stress of ProlongedRally Road Racing. Bologna, 1987.
8. Communique issued by Isserman JJ. FISA Medical Commission, 1982.9. Burton AK: Back pain in Grand Prix drivers. Brit J Sports Medicine
17:150, 1983.10. Burton AK, Sandover J: Back pain in Grand Prix drivers; a “found”
experiment. Applied Ergonomics 18:1, 1987.11. Blockley WV, McCutcham JW, Craig LT: Prediction of Human Toler-
ance for Heat in Aircraft. Wright Air Development Centre TechnicalReport, 53:346, 1954.
12. Blockley WV, Lyman J: Psychomotor Performance of Pilots as indi-cated by a Task Simulating Aircraft Instrument Flight. Air ForceTechnical Report, 6521, Wright Patterson Air Force Base, 1951.
13. Blockley WV, Lyman J: Mental Performance under Heat Stress asindicated by Addition and Number Checking Tests. Air Force TechnicalReport 6022, Wright Patterson Air Force Base, 1950.
14. Mackworth NH: Researches on the Measurement of Human Perfor-mance. Medical Research Council Special Report, no.268, 1950.
15. Watkins ES: The effect of heat on psychomotor efficiency with partic-ular reference to tropical man. Liverpool, University of Liverpool, andreports to Medical Research Council, West Africa, 1956 (dissertation).
16. Mellor A: F1 Accident Investigation SAE00MSV-37, 2000.17. Newman J: Biomechanical Engineering, USA, 1999.18. Schuller E: University of Munich, Germany, 2000.19. Lowenheilm P: University of Lundt, Sweden, 1998.20. Ryan GA: RAR Unit Adelaide, 1999.
Watkins Clinical Neurosurgery • Volume 53, 2006
© 2006 Lippincott Williams & Wilkins152