the perceived demands of crossfit
DESCRIPTION
The Perceived Demands of CrossFitTRANSCRIPT
Northern Michigan UniversityThe Commons
NMU Master's Theses
4-2014
The Perceived Demands of CrossFitBryanne N. BellovaryNorthern Michigan University, [email protected]
Follow this and additional works at: http://commons.nmu.edu/thesesPart of the Exercise Physiology Commons, and the Exercise Science Commons
This Thesis is brought to you for free and open access by The Commons. It has been accepted for inclusion in NMU Master's Theses by an authorizedadministrator of The Commons. For more information, please contact [email protected],[email protected], [email protected],[email protected].
Recommended CitationBellovary, Bryanne N., "The Perceived Demands of CrossFit" (2014). NMU Master's Theses. Paper 3.

THE PERCEIVED DEMANDS OF CROSSFIT®
By
Bryanne Bellovary
THESIS
Submitted to Northern Michigan University
In partial fulfillment of the requirements For the degree of
MASTER OF SCIENCE
Office of Graduate Education and Research
2014

i
SIGNATURE APPROVAL FORM Title of Thesis: The Perceived Demands of CrossFit® This thesis by Bryanne Bellovary is recommended for approval by the student’s Thesis
Committee, by the Department Head of the School of Health and Human Performance, and by
the Assistant Provost of Graduate Education and Research.
____________________________________________________________ Dr. Scott Drum, PhD, FACSM CES, CSCS Date Thesis Committee Chair ____________________________________________________________ Dr. Randall Jensen, PhD, FACSM, FISBS, CSCS Date First Reader ____________________________________________________________ Dr. Maggy Moore, PhD, AT Date Second Reader ____________________________________________________________ Dr. Mary Jane Tremethick, PhD, RN, MCHES, FAAHE Date Department Head of the School of Health and Human Performance ____________________________________________________________ Dr. Brian D. Cherry, PhD, MPA Date Assistant Provost of Graduate Education and Research

i
ABSTRACT
THE PERCEIVED DEMANDS OF CROSSFIT®
By
Bryanne Bellovary
Rhabdomyolysis is the breakdown of muscle tissue causing myoglobin, creatine kinase, and
other intracellular proteins and electrolytes to leak into circulation, disrupting cell homeostasis.
Exertional rhabdomyolysis (ER) occurs after extremely rigorous physical training that could
include high amounts of strenuous eccentric exercise. There has been an increase in reports for
mild to severe ER as well as other musculoskeletal injuries as the popularity of extreme
conditioning programs (e.g., CrossFit®) increases. Therefore, the main purposes of this
investigation were to identify: primary risk factors associated with ER during CrossFit®,
CrossFit® workouts that might induce a higher risk for the development of ER, and ratings of
perceived exertion (RPE) for CrossFit® vs. American College of Sports Medicine (ACSM) training
guidelines. A questionnaire was completed by 101 CrossFit® participants and 56 ACSM
participants (n = 157). CrossFit® and ACSM groups reported significantly different RPEs of 7.29 ±
1.74 and 5.52 ± 1.35 (p ≤ 0.001), and performed significantly different hard days per week of
3.99 ± 1.07 and 3.55 ± 1.39 (p = 0.044), respectively. The top five perceived hardest workouts
based on frequency were Fran (47), Murph (27), Fight Gone Bad (10), Helen (9) and Filthy 50
(9). One occurrence of ER was reported out of 101 CrossFit® participants. Therefore, the overall
risk of developing ER may be minimal, especially if a participant understands their body’s
limitations in regard to the intensity of CrossFit®.

ii
Copyright by
BRYANNE BELLOVARY
2014

iii
ACKNOWLEDGMENTS
I would like to thank my thesis advisor, Dr. Scott Drum, for his support, encouragement and continued
guidance during this thesis research project. I would also like to thank the rest of my thesis committee,
Dr. Randall Jensen and Dr. Maggy Moore, for their guidance on statistics and grant proposals,
respectively, and for taking the time to review my work. Lastly, I would like to thank the Northern
Michigan University Spooner Grant Committee for awarding me with the Winter 2014 Spooner Grant to
help fund this project.
iv
PREFACE This thesis follows the format prescribed by the Journal of Strength and Conditioning Research
(JSCR). Instructions for Authors for the JSCR can be found at this website:
http://journals.lww.com/nsca-jscr/Pages/InstructionsforAuthors.aspx.
v
TABLE OF CONTENTS Contents
LIST OF TABLES ................................................................................................................................ xi
LIST OF FIGURES ............................................................................................................................. xv
CHAPTER 1: MANUSCRIPT .............................................................................................................. 1
INTRODUCTION ........................................................................................................................... 1
METHODS .................................................................................................................................... 4
EXPERIMENTAL APPROACH TO PROBLEM .............................................................................. 4
SUBJECTS ................................................................................................................................. 5
PROCEDURES ........................................................................................................................... 5
STATISTICAL ANALYSIS ............................................................................................................. 6
RESULTS ....................................................................................................................................... 7
DISCUSSION ............................................................................................................................... 10
PRACTICAL APPLICATIONS ......................................................................................................... 15
CHAPTER 2 LITERATURE REVIEW .................................................................................................. 17
INTRODUCTION ......................................................................................................................... 17
EXTREME CONDITONING PROGRAM ........................................................................................ 19
CROSSFIT® ................................................................................................................................. 21
Investigating CrossFit® ........................................................................................................... 23
EXERTIONAL RHABDOMYOLYSIS ............................................................................................... 28
Diagnosis and Treatment of Exertional Rhabdomyolysis ...................................................... 29
Creatine Kinase’s Association with Exercise and Exertional Rhabdomyolysis ...................... 31
Case Studies involving Exertional Rhabdomyolysis ............................................................... 32
Summary of the Case Studies ................................................................................................ 39
CROSSFIT’S® DEFFENSE AGAINST DEVELOPING EXERTIONAL RHABDOMYOLYSIS ................... 40
CONCLUSION ............................................................................................................................. 42
CHAPTER 3: CONCLUSIONS AND RECOMMENDATIONS .............................................................. 44

vi
PRACTICAL APPLICATIONS ......................................................................................................... 44
FUTURE RESEARCH CONSIDERATIONS ...................................................................................... 44
REFERENCES .................................................................................................................................. 46
APPENDIX A ................................................................................................................................... 50
A PERFORMANCE PROFILE RELATED TO BUILDING ELITE FITNESS IN MALE COMPETITORS ... 50
ABSTRACT .............................................................................................................................. 50
INTRODUCTION ..................................................................................................................... 51
METHODS .............................................................................................................................. 54
RESULTS ................................................................................................................................. 57
DISCUSSION ........................................................................................................................... 59
PRACTICAL APPLICATION ....................................................................................................... 60
APPENDIX B ................................................................................................................................... 62
TABLES AND FIGURES ................................................................................................................ 62
Table 1: Descriptive statistics on the CrossFit® and ACSM groups for age, height, weight, the
number of weeks completed in the respective exercise program, the average RPE and the
perceived number of hard days performed in a week ............................................................. 62
Table 2: Independent t-test comparing weeks completed in the respective exercise program,
average RPE for the program and the number of hard days completed in a week for the
Crossfit® and ACSM groups ....................................................................................................... 63
Table 3: Chi-square analysis via crosstabulation about whether participants had prior exercise
experience before starting their current exercise program ..................................................... 64
Table 4: Chi-square analysis via crosstabulation about whether participants warm-up prior to
starting their workout ............................................................................................................... 65
Table 5: Chi-square analysis via crosstabulation whether aspirin was regularly taken by
participants in their respective exercise program .................................................................... 66
Table 6: Chi-square analysis via crosstabulation whether anti-cholinergic agents were
regularly taken by participants in their respective exercise program ...................................... 67
Table 7: Chi-square analysis via crosstabulation whether statins were regularly taken by
participants in their respective exercise program .................................................................... 68
Table 8: Chi-square analysis via crosstabulation whether other medications were regularly
taken by participants in their respective exercise program ..................................................... 69

vii
Table 9: Chi-square analysis via crosstabulation as to whether participants had been
diagnosed with dehydration while attending their respected exercise program .................... 70
Table 10: Chi-square analysis via crosstabulation as to whether participants had been
diagnosed with fatigue while attending their respected exercise program ............................. 71
Table 11: Chi-square analysis via crosstabulation as to whether participants had been
diagnosed with delayed onset muscle soreness (DOMS) while attending their respected
exercise program ....................................................................................................................... 72
Table 12: Chi-square analysis via crosstabulation as to whether participants had been
diagnosed with overexertion injury while attending their respected exercise program ......... 73
Table 13: Chi-square analysis via crosstabulation as to whether participants had been
diagnosed with other medical conditions while attending their respected exercise program 74
Table 14: Chi-square analysis via crosstabulation as to whether participants had experienced
excessive fatigue within 48-hours of completing a workout .................................................... 75
Table 15: Chi-square analysis via crosstabulation as to whether participants had experienced
muscle soreness within 48-hours of completing a workout ..................................................... 76
Table 16: Chi-square analysis via crosstabulation as to whether participants had experienced
muscle swelling within 48-hours of completing a workout ...................................................... 77
Table 17: Chi-square analysis via crosstabulation as to whether participants had experienced
shortness of breath (SOB) within 48-hours of completing a workout ...................................... 78
Table 18: Chi-square analysis via crosstabulation as to whether participants had experienced
muscle weakness within 48-hours of completing a workout ................................................... 79
Table 19: Chi-square analysis via crosstabulation as to whether participants had experienced
sleep disturbances within 48-hours of completing a workout ................................................. 80
Table 20: Chi-square analysis via crosstabulation as to whether participants had experienced
muscle pain to light tight (MPLT) within 48-hours of completing a workout ........................... 81
Table 21: Chi-square analysis via crosstabulation as to whether participants had experienced
limited movement in muscles used during the workout (LMMW) within 48-hours of
completing a workout ............................................................................................................... 82
Table 22: Chi-square analysis via crosstabulation as to whether participants had experienced
chest pain within 48-hours of completing a workout ............................................................... 83
Table 23: Chi-square analysis via crosstabulation as to whether participants had experienced
cola-/tea-/brown-colored urine (CTBU) within 48-hours of completing a workout ................ 84
Table 24: Chi-square analysis via crosstabulation as to whether participants had experienced
other symptoms within 48-hours of completing a workout ..................................................... 85

viii
Table 25: Chi-square analysis via crosstabulation as to whether participants sought medical
attention for symptoms they had experienced within 48-hours of completing a workout ..... 86
Table 26: Chi-square analysis via crosstabulation as to whether participants had been
diagnosed with myoglobinuria (MG), an indicator of ER .......................................................... 87
Table 27: Chi-square analysis via crosstabulation as to whether participants had been
diagnosed with high serum creatine kinase (CK) levels, an indicator of ER ............................. 88
Table 28: Chi-square analysis via crosstabulation as to whether participants had been
diagnosed with arrhythmia, a complication of ER .................................................................... 89
Table 29: Chi-square analysis via crosstabulation as to whether participants had been
diagnosed with hyperkalemia, a complication of ER ................................................................ 90
Table 30: Chi-square analysis via crosstabulation as to whether participants had been
diagnosed with muscle compartment syndrome (MSC), a complication of ER ........................ 91
Table 31: Chi-square analysis via crosstabulation as to whether participants had been
diagnosed with any other medical conditions .......................................................................... 92
Table 32: Chi-square analysis via crosstabulation as to whether participants had to stay
overnight at a hospital due to medical conditions related to ER ............................................. 93
Table 33: Chi-square analysis via crosstabulation as to whether participants had been
diagnosed with ER ..................................................................................................................... 94
Table 34: The frequency of workouts of the day (WODs) as reported by the CrossFit® group
................................................................................................................................................... 95
Table 35: The Borg Category Ratings Scale (Ratings of Perceived Exertion Scale) as depicted
by Baechle and Earle ................................................................................................................. 96
Table 36: An example 16 day cycle from the CrossFit® program (19) ...................................... 97
Table 37: Descriptive data for each participant of the 2013 CrossFit® Games and the strength
based traditional fitness benchmarks (4) .................................................................................. 98
Table 38: The running based fitness benchmarks for each participant of the 2013 CrossFit®
Games (4) .................................................................................................................................. 99
Table 39: Bivariate correlation factoring in the groupings of T10, M10 and B10 for the fitness
benchmarks ............................................................................................................................. 100
Table 40: Partial correlation when controlling for the groupings of T10, M10 and B10 for the
fitness benchmarks ................................................................................................................. 101
Table 41: One-way ANOVA for maximum number of pull-ups (n = 18)................................. 102
Table 42: One-way ANOVA for the snatch (n = 24) ................................................................ 103

ix
Table 43: One-way ANOVA for the deadlift (n = 22) .............................................................. 104
Table 44: One-way ANOVA for the back squat (n = 23) .......................................................... 105
Table 45: One-way ANOVA for the 400 m sprint (n = 16) ....................................................... 106
Table 46: One-way ANOVA for the 5 k run (n = 16) ............................................................... 107
Table 47: Independent T-Test for comparing T10 and M10 in the clean & jerk .................... 108
Table 48: Independent T-Test for comparing T10 and B10 in the clean & jerk ..................... 109
Table 49: Independent T-Test for comparing M10 and B10 in the clean & jerk ................... 110
Table 50: Performance rankings of highest, middle and lowest for T10, M10 and B10 on the
fitness benchmarks based on the means for each benchmark for each group...................... 111
Table 51: The Intraclass Correlation for the questions concerning average RPE for the
workouts, number of hard days performed in a week and number of weeks of participation
that has occurred in the self-selected program ...................................................................... 112
Table 52: Strength of agreements based on Cohen’s Kappa statistic from Landis and Koch 113
Table 53: Reliability analysis via Cohen’s kappa and Landis and Koch .................................. 114
Figure 1: Bland-Altman plot for the number of hard days performed in a week .................. 116
Figure 2: Bland-Altman plot for the number of weeks of participation that has occurred in the
self-selected program ............................................................................................................. 117
Figure 3: Bland-Altman plot for the average RPE for the workouts ...................................... 118
APPENDIX C ................................................................................................................................. 119
A QUESTIONNAIRE’S RELIABILITIY IN DETERMINING RISK FACTORS OF EXERTIONAL
RHABDOMYOLYSIS IN EXTREME CONDITIONING PROGRAMS ............................................... 119
SUBJECTS AND PROCEDURES .............................................................................................. 119
STATISTICAL ANALYSIS ......................................................................................................... 119
RESULTS ............................................................................................................................... 120
DISCUSSION AND CONCLUSION .......................................................................................... 120
APPENDIX D ................................................................................................................................. 123
ADDITIONAL INFORMATION ................................................................................................... 123
APPENDIX E ................................................................................................................................. 130
EXERCISE TRAINING STUDY QUESTIONNAIRE ......................................................................... 130
APPENDIX F ................................................................................................................................. 127
INFORMED CONSENT FORM STUDY TESTING ......................................................................... 127

x
APPENDIX G ................................................................................................................................. 129
INFORMED CONSENT FORM RELIABILITY TESTING ................................................................. 129

xi
LIST OF TABLES
Table 1: Descriptive statistics on the CrossFit® and ACSM groups for age, height, weight, the
number of weeks completed in the respective exercise program, the average RPE and the perceived number of hard days performed in a week. (pg. 62)
Table 2: Independent t-test comparing weeks completed in the respective exercise program,
average RPE for the program and the number of hard days completed in a week for the Crossfit® and ACSM groups. (pg. 63)
Table 3: Chi-square analysis via crosstabulation about whether participants had prior exercise
experience before starting their current exercise program. (pg. 64) Table 4: Chi-square analysis via crosstabulation about whether participants warm-up prior to
starting their workout. (pg. 65) Table 5: Chi-square analysis via crosstabulation whether aspirin was regularly taken by
participants in their respective exercise program. (pg. 66) Table 6: Chi-square analysis via crosstabulation whether anti-cholinergic agents were regularly
taken by participants in their respective exercise program. (pg. 67) Table 7: Chi-square analysis via crosstabulation whether statins were regularly taken by
participants in their respective exercise program. (pg. 68) Table 8: Chi-square analysis via crosstabulation whether other medications were regularly
taken by participants in their respective exercise program. (pg. 69) Table 9: Chi-square analysis via crosstabulation as to whether participants had been diagnosed
with dehydration while attending their respected exercise program. (pg. 70) Table 10: Chi-square analysis via crosstabulation as to whether participants had been
diagnosed with fatigue while attending their respected exercise program. (pg. 71) Table 11: Chi-square analysis via crosstabulation as to whether participants had been
diagnosed with delayed onset muscle soreness (DOMS) while attending their respected
exercise program. (pg. 72) Table 12: Chi-square analysis via crosstabulation as to whether participants had been
diagnosed with overexertion injury while attending their respected exercise program. (pg. 73)

xii
Table 13: Chi-square analysis via crosstabulation as to whether participants had been
diagnosed with other medical conditions while attending their respected exercise
program. (pg. 74) Table 14: Chi-square analysis via crosstabulation as to whether participants had experienced
excessive fatigue within 48-hours of completing a workout. (pg. 75) Table 15: Chi-square analysis via crosstabulation as to whether participants had experienced
muscle soreness within 48-hours of completing a workout. (pg. 76) Table 16: Chi-square analysis via crosstabulation as to whether participants had experienced
muscle swelling within 48-hours of completing a workout. (pg. 77) Table 17: Chi-square analysis via crosstabulation as to whether participants had experienced
shortness of breath (SOB) within 48-hours of completing a workout. (pg. 78) Table 18: Chi-square analysis via crosstabulation as to whether participants had experienced
muscle weakness within 48-hours of completing a workout. (pg. 79) Table 19: Chi-square analysis via crosstabulation as to whether participants had experienced
sleep disturbances within 48-hours of completing a workout. (pg. 80) Table 20: Chi-square analysis via crosstabulation as to whether participants had experienced
muscle pain to light tight (MPLT) within 48-hours of completing a workout. (pg. 81) Table 21: Chi-square analysis via crosstabulation as to whether participants had experienced
limited movement in muscles used during the workout (LMMW) within 48-hours of completing a workout. (pg. 82)
Table 22: Chi-square analysis via crosstabulation as to whether participants had experienced
chest pain within 48-hours of completing a workout. (pg. 83) Table 23: Chi-square analysis via crosstabulation as to whether participants had experienced
cola-/tea-/brown-colored urine (CTBU) within 48-hours of completing a workout. (pg. 84)
Table 24: Chi-square analysis via crosstabulation as to whether participants had experienced
other symptoms within 48-hours of completing a workout. (pg. 85) Table 25: Chi-square analysis via crosstabulation as to whether participants sought medical
attention for symptoms they had experienced within 48-hours of completing a workout. (pg. 86)
xiii
Table 26: Chi-square analysis via crosstabulation as to whether participants had been diagnosed with myoglobinuria (MG), an indicator of ER. (pg. 87)
Table 27: Chi-square analysis via crosstabulation as to whether participants had been
diagnosed with high serum creatine kinase (CK) levels, an indicator of ER. (pg. 88) Table 28: Chi-square analysis via crosstabulation as to whether participants had been
diagnosed with arrhythmia, a complication of ER. (pg. 89) Table 29: Chi-square analysis via crosstabulation as to whether participants had been
diagnosed with hyperkalemia, a complication of ER. (pg. 90) Table 30: Chi-square analysis via crosstabulation as to whether participants had been
diagnosed with muscle compartment syndrome (MSC), a complication of ER. (pg. 91) Table 31: Chi-square analysis via crosstabulation as to whether participants had been
diagnosed with any other medical conditions. (pg. 92) Table 32: Chi-square analysis via crosstabulation as to whether participants had to stay
overnight at a hospital due to medical conditions related to ER. (pg. 93) Table 33: Chi-square analysis via crosstabulation as to whether participants had been
diagnosed with ER. (pg. 94) Table 34: The frequency of workouts of the day (WODs) as reported by the CrossFit® group.
(pg. 95) Table 35: The Borg Category Ratings Scale (Ratings of Perceived Exertion Scale) as depicted by
Baechle and Earle (7). (pg. 96) Table 36: An example 16 day cycle from the CrossFit® program (19). (pg. 97)
Table 37: Descriptive data for each participant of the 2013 CrossFit® Games and the strength based traditional fitness benchmarks (4). (pg. 98)
Table 38: The running based fitness benchmarks for each participant of the 2013 CrossFit® Games (4). (pg. 99)
Table 39: Bivariate correlation factoring in the groupings of T10, M10 and B10 for the fitness benchmarks. (pg. 100)
Table 40: Partial correlation when controlling for the groupings of T10, M10 and B10 for the
fitness benchmarks. (pg. 101)

xiv
Table 41: One-way ANOVA for maximum number of pull-ups (n = 18). (pg. 102)
Table 42: One-way ANOVA for the snatch (n = 24). (pg. 103)
Table 43: One-way ANOVA for the deadlift (n = 22). (pg. 104)
Table 44: One-way ANOVA for the back squat (n = 23). (pg. 105)
Table 45: One-way ANOVA for the 400 m sprint (n = 16). (pg. 106)
Table 46: One-way ANOVA for the 5 k run (n = 16). (pg. 107)
Table 47: Independent T-Test for comparing T10 and M10 in the clean & jerk. (pg. 108)
Table 48: Independent T-Test for comparing T10 and B10 in the clean & jerk. (pg. 109)
Table 49: Independent T-Test for comparing M10 and B10 in the clean & jerk. (pg. 110)
Table 50: Performance rankings of highest, middle and lowest for T10, M10 and B10 on the fitness benchmarks based on the means for each benchmark for each group. (pg. 111)
Table 51: The Intraclass Correlation for the questions concerning average RPE for the workouts,
number of hard days performed in a week and number of weeks of participation that has occurred in the self-selected program. (pg. 112)
Table 52: Reliability analysis via Cohen’s kappa and Landis and Koch (31) depicting poor, slight,
fair, moderate (Mod.), substantial (Substan.) and almost perfect agreements for the yes/no questions of the questionnaire. (pg. 113)
Table 53: Strength of agreements based on Cohen’s Kappa statistic from Landis and Koch (31).
(pg. 114 – 115)

xv
LIST OF FIGURES
Figure 1: Bland-Altman plot for the number of hard days performed in a week. (pg. 116) Figure 2: Bland-Altman plot for the number of weeks of participation that has occurred in the
self-selected program. (pg. 117) Figure 3: Bland-Altman plot for the average RPE for the workouts. (pg. 118)

1
CHAPTER 1: MANUSCRIPT
INTRODUCTION
CrossFit® is considered a core strength and extreme conditioning program (ECP)
designed to elicit a broad adaptation response (18). It mixes Olympic weightlifting, powerlifting,
sprints, plyometrics, calisthenics, gymnastics, and a few “hard-to-categorize exercises” like rope
climbing. Normally, CrossFit® workouts are short (usually 20 minutes or less), intense, and
constantly changing by using functional movements (22,23,46). Functional movements are
defined by Glassman (22) as motor recruitment patterning performed in waves of contraction
from core to extremity over multiple joints. Performing these workouts allows the individual to
complete all physical tasks [e.g., Olympic lifts, rope climbing, traditional sports, moving large
loads over long distances quickly] and prepares them for unknown tasks [e.g., surviving fights
and fires as described by CrossFit®] (18,22). CrossFit® athletes are able to perform multiple,
diverse, and random physical challenges (18), which has greatly captured the attention of
military, police, and firefighter personnel as well as athletes (22).
Bergeron et al. (11) suggested a need to determine the potential injury risks associated
with ECPs, in particular the risk of exertional rhabdomyolysis (ER). Rhabdomyolysis is the result
of muscular tissue damage leading to the release of myoglobin, creatine kinase (CK), and other
cell contents into the blood stream and thereby disrupting cell homeostasis
(8,12,13,27,35,38,45). When rhabdomyolysis occurs due to exercise, it is termed ER. The
exercises associated with ER are typically excessive, strenuous and/or repetitive, usually

2
eccentric in nature, and performed at intensities unaccustomed to the individual (38). Other
factors related to rhabdomyolysis are dehydration, heat stress, sickle cell trait, the use of
certain drugs, dietary supplements, and “high stakes training” typically undertaken by physical
intensity driven professionals, such as firefighters, law enforcement personnel or military
cadets (13,38).
The Center for Disease Control (CDC) reported 26,000 incidences of rhabdomyolysis per
year in the United States; forty-seven percent were reported as ER (13,43). Diagnosed
individuals tended to complain of muscular pain, swelling, weakness, and/or brown-, tea- or
cola-colored urine (12,27,35,45). Clinical lab tests are often ordered to determine myoglobin
and CK levels. If the urine test is positive for myoglobin but negative for red blood cell content
and CK levels are at least five times the upper limit (35,38,45) [i.e., normal CK ranges for men
are 55 to 170 IU/L and women are 30 to 135 IU/L (32)], then normally the individual is rapidly
rehydrated via intravenous fluids to prevent further complications such as renal failure (35,38).
Upon discharge from the hospital, ER patients are typically advised on appropriate exercise
intensity and resting occurrence, proper hydration, and proper safety during high intensity
workouts (17). CrossFit® is well aware of ER and has even reported occurrences among their
participants.
There is a limited amount of information on CrossFit® in peer-reviewed literature.
CrossFit® described their own five “victims” of ER; however, details were lacking (21). All
individuals required hospitalization and made full recoveries. The author referencing these
cases stated each person as having ER but no statement was made related to medical
personnel diagnosing it. The author also reported that each victim was new to CrossFit® and

3
developed ER in their first or second workout. Those who were able to perform a second
session had performed it within three days after the first workout. Lastly, Glassman (21)
declared that his program has never had an experienced “CrossFitter” develop ER. However,
this statement was from an article (21) released by CrossFit® in 2005. In 2010, CrossFit®
released another article (23) stating how CrossFit® was now designed to prevent against ER.
This seemed to imply a change in CrossFit’s® design, which was to protect against ER, not cause
it; even though, truly, ER might be a consequence of CrossFit® workouts.
Still, CrossFit® reportedly “defends” against ER occurrence by having workouts lasting 20
minutes or less (23). Moreover, each workout reportedly switches metabolic pathways during
the session and individuals are told to control their own intensity level. They alone remain
responsible for setting their own level of exertion and recognizing their body’s limitations (23).
Ultimately, the discrepancy between whether CrossFit® or the individual influences the
workout leads to the question, “What is the occurrence and risk associated with developing ER
while performing CrossFit®?”
Therefore, the main purposes of this study were to identify: primary risk factors
associated with ER during CrossFit®, CrossFit® workouts that might induce a higher risk for the
development of ER, and ratings of perceived exertion (RPE) for CrossFit® vs. American College
of Sports Medicine (ACSM) training guidelines. A secondary objective was to determine self-
reported occurrences of diagnosed ER in exercisers. A questionnaire was developed to address
these specific objectives and distributed to CrossFit® affiliates and ACSM professionals across
the United States. Proposed hypotheses were: primary risk factors associated with ER during
CrossFit® will be evident, certain CrossFit® workouts with an RPE of five or greater will be

4
reported more frequently than others, the overall RPE of CrossFit® workouts will be at least
rated a five or strong intensity, and CrossFit® sessions will produce a higher occurrence of ER, as
compared to exercisers following ACSM guidelines.
METHODS
EXPERIMENTAL APPROACH TO PROBLEM
The methodology of the current research project utilized a questionnaire completed by
exercisers to determine the most common risk factors associated with ER and self-reported RPE
values reflective of workouts of the day (WODs) and various CrossFit® programs. A secondary
objective of the questionnaire was to determine the possible occurrence of ER in exercisers,
from beginners to advanced participants. CrossFit® members who completed a workout at a
CrossFit® affiliate were included in the study. Beginners of CrossFit® workouts were surveyed
because past researchers found ER development within a first or second workout (21). Other
survey questions covered topics related to risks associated with ER after CrossFit® workouts,
including if the person had ever developed a diagnosis of ER. Finally, in general, the
questionnaire covered how participants perceived the intensity of completed workouts.

5
SUBJECTS
A total of 322 people responded to the request to complete the study questionnaire
after IRB approval at Northern Michigan University and having all risks explained to them and
giving informed consent (Appendix F). Of the total returned surveys, 203 participants
completely finished it, and 157 respondents were categorized into either CrossFit® (mean ± SD;
age: 34.50 ± 8.74 years; n = 101), or ACSM (mean ± SD; age: 35.41 ± 10.15 years; n = 56)
exercise groups. Forty-six participants listed themselves as using some other exercise program
and therefore were excluded from analysis. See Table 1 for subject characteristics.
PROCEDURES
Twenty-five out of the 50 United States were randomly selected as the questionnaire
pool. As it turned out, responses were received from 35 states and Canada because participants
were encouraged to spread the questionnaire to clients and fellow exercisers. To clarify,
random emails were sent to 905 CrossFit® affiliates, 930 ACSM certified personal trainers, and
265 ACSM certified clinical exercise specialists after IRB approval was received. CrossFit®
affiliates were gathered from the official CrossFit® website’s affiliate finder. ACSM certified
personal trainers were gathered via the ACSM ProFinderTM. Subjects were able to answer the
inquiry form at their own convenience via a website (Qualtrics) containing the questionnaire,
which consisted of 19 questions completed in approximately ten minutes. The questionnaire
was made available for five weeks. There was no direct contact with the participants. Because

6
surveys were completed anonymously, no follow-up occurred and therefore the response rate
was not tracked.
Notably, a pilot test performed using the current study’s questionnaire determined that
the questionnaire was reliable (Appendix C). Intraclass correlation values were 0.902, 0.971 and
0.801 for the questions yielding parametric results. Cohen’s kappa yielded zero agreements of
poor, seven agreements of slight, zero agreements of fair, three agreements of moderate, two
agreements of substantial, and 25 agreements of almost perfect for the yes/no questions.
STATISTICAL ANALYSIS
Statistical analysis of the experimental data utilized an independent t-test analysis via
SPSS (IBM® SPSS® Statistics Version 21). This was used to compare the statistical significance of
the means for the CrossFit® group and the ACSM guided group for questions related to the
average RPE for workouts, the number of weeks the individual participated in the program, and
the perceived average number of hard days completed during a week. When the assumption
for equality of variance was violated, as assessed by Levene’s test, appropriate adjustment of
the degrees of freedom was made. Chi-square analysis via crosstabulation was used to
determine if a significant difference existed for the yes/no questions. Significance in this study
was set to an alpha level of p ≤ 0.05. Lastly, the frequency of the perceived hardest CrossFit®
WODs was determined.

7
RESULTS
Using an independent t-test (with significance set at p ≤ 0.05), the number of weeks
participated in the exercise program, the average RPE reported for the programs, and the
perceived number of hard days performed in a week, were all found to have significant
differences between the CrossFit® and ACSM groups (Table 2). The mean number of weeks
completed in the CrossFit® and ACSM groups, respectively, were 7.81 ± 0.85 and 6.38 ± 2.50.
The mean RPE’s reported for CrossFit® and ACSM supervised programs, respectively, were 7.29
± 1.74 and 5.52 ± 1.35. The mean number of hard days performed or reported in a week for
CrossFit® and ACSM groups, respectively, were 3.99 ± 1.07and 3.55 ± 1.39.
The remainder of the questionnaire involved yes/no questions. Statistical analysis was
completed using Chi-square (p ≤ 0.05) via crosstabulation (Tables 3 - 33). Some of the analyses
had an expected count less than five. For a full list of observed counts and expected counts, see
Appendix D. For the question concerning whether or not the subjects had prior exercise
experience, the Pearson Chi-square was statistically significant and therefore a majority of both
groups answered that they had prior exercise experience before starting either their CrossFit®
or ACSM guided program. On the other hand, the Pearson Chi-square was not statistically
significant whether a warm-up was completed prior to exercising. In fact, a majority of both
groups answered that they completed a warm-up prior to exercise.
Another primary question was if subjects regularly took any form of medication during
their respective training program. No significance was found between groups, and thus for
aspirin, anti-cholinergic agents, statins, and any other medications taken, the Pearson Chi-

8
square was not statistically significant. Notably, a majority of both groups answered that they
did not take any of the previous listed medications while in CrossFit® or ACSM guided
programs. The Pearson Chi-square was not computed for phenothiazines as all subjects
answered “no” to taking this kind of medication. Other medications listed by the participants
consisted of Adderall, allergy medications, anabolic steroids, testosterone, and diabetic insulin.
Another question with multiple parts asked if the participants had been diagnosed with
a given list of conditions while attending their respective exercise program. For sickle cell trait,
renal insufficiency, and heat exhaustion, the Pearson Chi-square was not completed as every
subject answered no. For dehydration, fatigue, delayed onset muscle soreness (DOMS),
overexertion injury, and any other medical conditions diagnosed, the Pearson Chi-square was
not statistically significant. To be clear, a majority of both groups had not been diagnosed with
any of the previous medical conditions while participating in either CrossFit® or an ACSM
training program. Exercisers who listed other conditions were those who experienced muscle
and ligament tears, tendonitis, stress fractures, and ER – which will be discussed later.
The question concerning symptoms occurring within 48-hours post exercise also had
multiple parts. For excessive fatigue, muscle soreness, muscle swelling, shortness of breath,
muscle weakness, muscle pain to light touch, and limited movement in the muscles used during
the workout, the Pearson Chi-square was statistically significant. The percentage of the
CrossFit® group who said “yes” for experiencing the previously mentioned symptoms was
higher than those who said “yes” in the ACSM group. The Pearson Chi-square was not
significant for experiencing sleep disturbances, chest pains, cola-/tea-/brown-colored urine,

9
and/or any other symptom occurring within 48-hours post-exercise. Another symptom
reported, but not found to be significant, by subjects in both groups; was heart palpitations.
Another primary question queried whether participants had sought medical attention
due to the symptoms from the previous question (i.e., possible medical complications reported
post-exercise). The Pearson Chi-square was not statistically significant because a majority of
both groups answered that they had not visited a physician due to the previous symptoms in
either CrossFit® or an ACSM guided group. Most participants indicated that they felt no reason
to seek medical attention from the symptoms they experienced.
Another question we asked was related to ER symptoms and medical conditions
diagnosed by a physician. For a positive myoglobinuria test, high serum CK levels, heart
arrhythmia development, hyperkalemia development, muscle compartment syndrome, and
other medical conditions diagnosed, the Pearson Chi-square was not statistically significant. A
majority of both groups had not been diagnosed by a medical professional with any of the
previously mentioned conditions possibly related to ER. The Pearson Chi-square was not
calculated for renal insufficiency or failure and hypocalcaemia due to a “no” answer from all
participants. The other listed condition diagnosed was anemia, which was reported by both
participating groups but with no significant difference between them.
Next, participants were asked if they had to stay overnight at a hospital for any of the
previously diagnosed conditions. The Pearson Chi-square was not statistically significant
because a majority of both groups answered “no” to this question. Interestingly, a few
participants also reported staying a night or longer at a hospital, which included answers of
one, four, and eight nights.

10
In order to gain insight into the incidence of ER, the participants were asked if they had
been diagnosed with ER by a physician. As a majority of both groups had not developed ER from
their respective program, the Pearson Chi-square was not statistically significant. Per this
sample, ER was developed by one person who was from the CrossFit® group.
Finally, only CrossFit® participants were asked to identify their perceived five hardest
CrossFit® WODs (Table 34). Forty-five different workouts were mentioned with a total of 211
responses recorded. The top five most mentioned workouts were Fran (47), Murph (27), Fight
Gone Bad (10), Filthy 50 (nine) and Helen (nine).
DISCUSSION
Main findings consisted of significant differences found between groups for average RPE
and perceived number of hard days per week. Furthermore, non-parametric tests revealed that
prior experience before starting the chosen program varied as a function of the chosen exercise
program. Feelings of excessive fatigue, muscle soreness, muscle swelling, shortness of breath,
muscle pain to light touch, and limited movement in muscles used during exercise within 48-
hours post-exercise also varied as a function of the chosen exercise program. Therefore, the
hypotheses were adequately assessed and consistent with the results. However, the possible
existence of Type II error shall be discussed first.
As some of the yes/no questions yielded expected counts with less than five in the Chi-
squared analysis via crosstabulation, this would increase Type II error. Therefore, those yes/no
questions where p was close to 0.05 could be seen as a failure to reject the null hypothesis

11
when the null hypothesis was actually false (28). For instance, this could be seen in the
diagnosis of fatigue during the participants’ respective program, where p = 0.056. Another
example could include the question referring to the use of statins during the program, where p
= 0.056. Other instances involved questions where significance was found. For these questions,
the expected count was very close to five and they included those referring to feelings of
muscle soreness (expected count for one cell was 4.64) and shortness of breath (expected
count for one cell was 4.99). However, because significance was found and the null hypothesis
was rejected, Type I error occurred. Another case of Type I error may be when significance was
found between the number of hard days per week reported (p = 0.044).
Per this sample, prior exercise experience varied as a function of the exercise program
the participants attended. Exercise experience consisted of at least three days per week for at
least 30 minutes per day consistent with ACSM guidelines. While a majority of participants
answered “yes,” to having prior exercise experience, 21 (20.8%) CrossFit® participants
answered “no” compared to the four or 7.1% who answered “no” from the ACSM group. The
significant difference found (p = 0.025) is important and relates to literature describing ER to
primarily affect the physically untrained (35,38,45). Because the majority of those who
answered “no” were CrossFit® participants, then it is possible that CrossFit® programs could be
considered excessive and repetitive with frequent use of eccentric exercise, especially with a
mix of untrained individuals. Ultimately, if it is hypothesized that more beginner exercises tend
to choose CrossFit®, this has the potential to be a risk factor for ER (34,38,45).
Therefore, untrained individuals new to CrossFit® should be required to perform a
beginner program to minimize this risk. Despite this statement, the current sample did not

12
contain a majority of beginners. The mean for the number of weeks completed in their
respective programs was 7.81 ± 0.85 and 6.38 ± 2.50 weeks for the CrossFit® and ACSM trained
groups, respectively. This reflects a possible limitation whereby novices who dropped out of
their respective program were not surveyed and therefore not part of the analysis.
Researchers have found that certain medications such as aspirin, phenothiazines, anti-
cholinergic agents, and statins may predispose an individual to ER (17,35,38,45). However, for
the current sample, no significant differences were found between groups related to the use of
certain medications. The majority of participants answered “no” to having taken a medication.
However, the most commonly used medication was aspirin with 16 total participants (CrossFit®
= 12 and ACSM = 4) reporting its use. The reported use of aspirin was frequently due to muscle
soreness and DOMS.
Regarding the diagnosis of previous health conditions from a physical, no significant
differences were found between groups. Per this sample, the participants seemed to be in good
health. The most often reported health conditions were overexertion injury with seven total
participants (CrossFit® = 4 and ACSM = 3) and DOMS with four total participants (CrossFit® = 3
and ACSM = 1). A few participants seemed shocked that a physician would be sought over
DOMS. Though DOMS may be treated without medical attention, it should not be dismissed
quickly. Notably, the signs and symptoms of acute ER can be misinterpreted as DOMS since
both ER and DOMS involve damage to muscle tissue (13). It is also thought that ER exacerbates
and complicates DOMS with other factors, such as the use of certain medications and prior
medical history (13).

13
In addition to the prior mentioned risk factors, average RPE was quantitatively collected.
A significant difference (p < 0.001) was found for the RPEs given between participants. The
CrossFit® and ACSM groups reported RPEs of 7.28 ± 1.74 and 5.52 ± 1.35, respectively. Based on
Borg Categorical Ratio Scale (Table 35), per this sample, the RPE of CrossFit® was considered to
be very strong intensity as compared to a rating of strong intensity for an ACSM guided
program (7). The hypothesis that CrossFit® exercisers would rate the program as at least a five
or strong intensity was supported. In addition, ACSM exercisers also rated their program as at
least a five or strong intensity. Participants also reported the number of hard days experienced
in a week, where hard days had to rate as a five or above, per another part of our hypothesis.
CrossFit® was reported to have an average of 3.99 ± 1.07 hard days per week per this sample.
The ACSM group reported an average of 3.55 ± 1.39 hard days per week. The difference
between exercise groups was found to be significantly different (p = 0.044). Though RPE can be
affected by outside factors such as environmental temperature (7), CrossFit® was already
considered to be a highly intense workout where participants were expected to perform at
their personal best each session (19,23,39). Therefore, the RPEs reported based on this sample
may be an accurate assessment of the average intensity levels experienced during a CrossFit®
session.
Further assessment of CrossFit® workouts involved individuals listing their top five
hardest WODs. These CrossFit® WODs had to have an RPE of at least five. Based on the
frequency of the listed WODs, the top five most reported WODs were Fran (47), Murph (27),
Fight Gone Bad (10), Helen (9), and Filthy 50 (9). The use of this frequency list may provide
additional research opportunities. Whilst CK levels are the most reliable indicator of ER (32,35),

14
the monitoring of CK levels during the top five given WODs in this paper may help determine
the most taxing workouts on various skeletal muscle groups. Future comparisons could also be
made to more traditional sports (e.g., weightlifting, football, and triathlon).
In addition to creating a list of the hardest CrossFit® WODs, the signs and symptoms
related to ER were examined 48-hours post-exercise. All signs and symptoms of ER were
experienced to some degree by both groups. However ACSM exercisers had zero participants
experience cola-/tea/brown-colored urine. The CrossFit® group reported two participants.
CrossFit® participants also answered “yes” to a greater extent for every sign and symptom
listed (i.e., excessive fatigue, muscle soreness, muscle swelling, shortness of breath, muscle
weakness, sleep disturbance, muscle pain to light touch, limited movement in muscles used
during the workout, chest pain, and cola-/tea-/brown-colored urine) versus the percentage of
those who answered “yes” in the ACSM group. The signs and symptoms related to ER that
significantly (p < 0.05) varied as a function of the exercise program, whereby CrossFit®
exercisers answered “yes” more often, were excessive fatigue, muscle soreness, muscle
swelling, shortness of breath, muscle pain to light touch, and limited movement in the muscles
used during exercise. Often muscle soreness, swelling, and pain to light touch have been
reported in literature as common signs of ER in addition to brown-/tea-/cola-colored urine
(13,17,32,35,38).
Of note, the one reported case of ER from a CrossFit® participant might imply an
occurrence rate of 9.9 per 1000 (i.e., 1/101=0.0099). Said another way, occurrence of ER in the
entire active population surveyed was 1 in 156 or approximately 6 in 1000. The individual
experienced every sign and symptom listed in this paper except chest pain, and stayed at a

15
hospital for eight nights. After analyzing individual answers, only one other CrossFit® participant
reported experiencing all of these signs and symptoms except brown-/tea-/cola-colored urine.
However, no ER was reported and this individual did not have any previous medical history
compared to the other person’s reported case in which previous instances of dehydration and
overexertion injury were reported. Insofar as vigorous hydration was required for treatment,
and individuals who develop ER were often advised on adequate hydration rates (13,17,27,35),
low hydration levels seem to play a role in ER development. Knowingly, CrossFit® recommends
individuals be properly hydrated (23).
The reports of the individuals in this paper do not represent an immediate causal
relationship between their signs and symptoms observed and the development of ER.
Therefore, individual exercisers should make efforts to understand their individualized response
to exercise. Additionally, individual exercisers should strive to be discerning fitness industry
consumers and seek out qualified health and exercise professionals. This may lead to advances
in preventative consumer behavior aimed at attenuating the deleterious effects of DOMS. In
the end, a fine line exists between DOMS, acute ER, and the choice of a high intensity workout
(13), especially amongst motivated beginners.
PRACTICAL APPLICATIONS
Exertional rhabdomyolysis is a rare condition (13,27). While the occurrence of ER in
CrossFit® is rare, per the result of this paper, it seems more exercisers undergoing CrossFit’s®
intense bouts report greater RPEs and hard days per week vs. ACSM driven routines. Therefore,

16
participants of CrossFit® should strive to maintain a good understanding of their limitations
during exercise in order to cope with high intensity and repetitive exercise bouts. Furthermore,
all exercisers engaged in high intensity exercise should hydrate appropriately prior to exertion,
and seek out a highly qualified and experienced CrossFit® or strength and conditioning
professional. Ultimately, the various ways people exercise or train is ever changing, thus
emphasizing the importance of up-to-date research in order to ensure the most effective,
productive, and safe exercise routines are put into practice.

17
CHAPTER 2 LITERATURE REVIEW
INTRODUCTION
The body weight of individuals residing in the United States has progressively increased
over the last few decades. At least 35.5% of men and 35.8% of women in the United States
were considered obese from 2009 – 2010 (4). In an effort to get healthier, resolutions are made
to lose weight and exercise (3). However, many of these resolutions go unmet due to a
perceived lack of time during the individual’s day to complete a well-rounded exercise program
following guidelines set by the American College of Sports Medicine (ACSM) (3).
Many physicians and fitness experts accept the exercise guidelines set by the ACSM for
the general population. According to ACSM (16), most adults should engage in strength
exercises for two to three days per week that utilize each major muscle group, and includes the
incorporation of balance, agility, and coordination. Cardiorespiratory exercises of moderate
intensity should be performed five days per week for at least 30 minutes a day. However, if an
individual wishes to perform these exercises at a vigorous intensity only three days per week
are needed for 20 minutes a day (16). Lastly, flexibility should be incorporated into the exercise
program on a minimum of two days per week and 60 seconds should be spent on each exercise
(16). When examining these guidelines, overlap between exercise days is necessary to meet all
ACSM criteria; such that strength, cardio-respiratory, and flexibility exercises might be
performed on the same days. This could potentially make for a long workout. Thus, circuit
18
training has evolved to shorten workouts, in some cases, while utilizing multiple aspects of
training (47).
Anaerobic exercises can be combined to create a circuit training program incorporating
lighter resistance (40 – 60% of a one repetition maximum) and shorter rest periods between
sets (24,47). The intention is to move quickly through the exercises in a circuit while following
ACSM guidelines for vigorous training, allowing for a safe and effective training program. Circuit
training has evolved into extreme conditioning programs (ECP) made popular by Insanity®,
P90X® and CrossFit®. These programs tend to use a variety of high intensity exercises at high
volumes and timed maximal number of repetitions with short rest periods between sets
(11,33). Due to the lack of research, the safety has not been defined for such programs.
The number of reported cases of muscle strains, torn ligaments, stress fractures and
mild to severe cases of potentially life-threatening exertional rhabdomyolysis (ER) have
increased as the popularity of ECPs grows (11,37). This is not claimed to be causal but, ECPs
seem to disregard appropriate and safe training guidelines set by the ACSM for developing
muscular fitness (33). For example, repetitions are performed maximally and timed with
inadequate rest intervals. Experienced participants could be performing advanced exercises
with excessive neuromuscular fatigue and novices could be doing too much too soon (11,34),
making them potentially at risk for overuse injuries and the more serious condition, ER (33,34).
Therefore, the purpose of this article is to review the literature pertaining to extreme
conditioning programs, specifically CrossFit® training, ER and increasing the awareness for the
possible risk of developing ER from CrossFit®. Please see Appendix A for a research-based
description of CrossFit® athletes.

19
EXTREME CONDITONING PROGRAM
Gaining in popularity in the last 5 – 10 years, extreme conditioning programs (ECPs),
such as Gym Jones®, Insanity®, P90X® and CrossFit® are characterized by the use of high
intensity, aggressive training at high volume and timed, maximal number of repetitions with
short rest periods between sets (11,33,37). Helping to increase the popularity of ECPs is the
large number of anecdotal success stories. There are also benefits to ECPs that appeal to the
general population. Specifically, time efficiency and camaraderie along with the functionality of
blending strength and endurance though the variety of the workouts to minimize overuse injury
and in preparations for broadening the range of physical adaptations (15). ECPs tend to contain
a variety of resistance exercises coupled with body weight exercises and challenging running
intervals. The high intensity state of the exercises puts moderate to high demand on the energy
metabolism of active muscle fibers and the cardiovascular system. These aspects could possibly
provide a reduction in body fat along with increases in muscular endurance and cardiovascular
capacity (11). However, there are some perceived negative characteristics of ECPs. The high-
volume nature of these training sessions can result in greater perceived effort, degradation of
movement technique, decreased resistance to subsequent exercise strain, increased oxidative
stress and premature feelings of fatigue (11,34). In addition, there are very few research papers
on ECPs (37). This results in the concern of measureable effectiveness and safety with such
programs.

20
One non-peer-reviewed study (40) involved using 14 subjects from the U.S. Army
Command and General Staff College to determine the efficacy of CrossFit® in U.S. Army
Soldiers. A six week exercise program (consisting of a minimum of four one-hour training
sessions per week) was utilized with pre- and post-test assessments for each subject. The Army
Physical Fitness Test (APFT) including push-ups, sit-ups and a two mile run (the two mile run
was not completed post-test due to inclement weather) and three CrossFit® benchmark
workouts (Fran, Fight Gone Bad and CrossFit® Total) were the focus of the testing.
Unfortunately, no statistical analysis was performed and measures of aerobic fitness, strength
or power were not taken. An average overall increase in work capacity of 20.33% was reported.
Work capacity for Fran, Fight Gone Bad and CrossFit Total increased by 24.2%, 20.9% and 16.0%
respectively. Results of the APFT for push-ups and sit-ups reported a 7.7% and 4.7%
improvement respectively; however, declines in performance also occurred for some subjects.
This decline was speculated to have occurred due to either an overzealous increase in load or
reduction in scaling. Overall, it would seem a CrossFit program could help improve performance
in some soldiers (40).
Alcaraz et al. (1) performed a study using a circuit resistance training (CRT) protocol.
Though not an exact ECP routine, Alcaraz et al. (1) modified the CRT by using high-resistance
instead of using typical low-resistance making it similar to ECPs. This study involved 33 subjects,
divided into three groups: high-resistance circuit training (HRC), traditional high load strength
training (TS) and a control group (C). The training groups utilized an eight week training period.
A major finding was that the HRC resulted in improvements in strength and muscle mass similar
to the TS group. This is important because previous circuit training programs using lighter loads

21
had been unable to produce the same adaptations as TS training. Also, this study (1) was
performed using healthy men with a consistent history of strength training. Previously,
increases in strength results were difficult to produce in this population, suggesting that HRC
could be used to increase strength and muscle mass gains in athletic populations (1). A second
major finding was that HRC produces similar increases in muscular power as TS as measured
using various percentages of 1RM bench press tests. This could be due to two main factors:
low-repetition, high-load training demonstrates similar strength improvements to TS and that
the loads lifted were lifted quickly (1). Therefore, it could be inferred that force-generating
capacity and muscle shortening speed, which are two components of power, were increased,
(1). With HRC being similar to ECPs (high volume, high intensity, maximal repetitions, short
rest), these results could possibly be seen using an ECP; though from the literature, there does
not seem to be a clear approach for initiating these types of programs and for safely
progressing to harder exercises specifically for novices. Research on ECPs, more specifically
CrossFit® as a mode of exercise, has only just begun.
CROSSFIT®
CrossFit® is a vastly popular fitness program. As reported by CrossFit® in an article from
2012, (23) it has grown about 50% per year based on the number of affiliates [approval and
payment made to CrossFit® headquarters by the affiliate owner to use the CrossFit® name
when marketing training and classes (6)] and about 90% per year based on internet activity
(based on Google® Trends search interest data). This seems to be done by CrossFit® embracing

22
a “fitness as sport” idea thru utilization of core strength and conditioning workouts designed to
elicit a broad adaptation response (18,37,42).
Olympic weightlifting, powerlifting, sprints, plyometrics, calisthenics, gymnastics and a
few hard-to-categorize exercises, like rope climbing, are mixed into a workout to create the
workout of the day (WOD). These workouts tend to be short, intense and constantly changing
by using functional movement (22,42,46) in a circuit-like training mode. The owner of CrossFit®,
Glassman (22), defines functional movement as motor recruitment patterning performed in
waves of contraction from core to extremity over multiple joints. CrossFit® defines fitness as
the ability to do any type of real work movements (cardiorespiratory, strength, power, etc.) for
any amount of time (42). In following these definitions, CrossFit® workouts prepare individuals
to complete all physical and unknown tasks by keeping the training stimulus broad and
constantly varied (22,37). CrossFit® athletes are able to perform multiple, diverse and
randomized physical challenges (18), which has now started to draw in the general public as
well as athletic, military, police and firefighter personal (22).
CrossFit® was developed to be performed in any environment: the outdoors, in an
affiliated gym or in the trainees own home gym (39). CrossFit® promotes and sets out to
develop total fitness which rests on a foundation set by three standards (22,42). The first
encompasses improving the ten fitness domains: cardiovascular and respiratory endurance,
stamina, strength, flexibility, power, speed, coordination, agility, balance and accuracy (19). The
second standard is based on the performance in athletic tasks in relation to others (19). Lastly,
the third involves training in all three energy systems that drive human action (19). So far there
have been only a few peer-reviewed studies investigating CrossFit®.

23
Investigating CrossFit®
Jeffery (30) investigated whether CrossFit® effectively trains all three metabolic systems
as their third standard states they do. Thirty-seven males and females were studied, divided
into two groups: a CrossFit® group and a control group who trained using ACSM recommended
guidelines for exercise. In order to participate in this study, participants had to have been
previously training either with CrossFit® or completely following ACSM guidelines for four
months (30). It would seem that subjects had self-selected their group as compared to being
randomly assigned to a group. Subjects performed tests involving the Margaria Kalamen Power
test, the Anaerobic Step test, the Cooper 1.5 mile run and three CrossFit® style tests: 1RM
effort on a deadlift, a maximum row for meters in one minute, and a hero workout entitled
“Murph” (30) which consisted of running one mile, then performing 100 pull-ups, followed by
200 push-ups, next perform 300 squats, and finish with running a mile in the shortest amount
of time possible (2). Results indicated that individuals who have the highest anaerobic capacity
through the ATP-PCr energy system, also have the highest aerobic capacity through the aerobic
energy system (30). The CrossFit® group tended to score higher on all tests as compared to the
ACSM control group (30). Therefore, Jeffery (30) concluded that CrossFit® does train all three
energy systems; however the two groups seem to not be equally matched as noted by the self-
selection of groups. Further research is needed to verify the other two standards of CrossFit®.
Other research consists of examining whether CrossFit® improves aerobic fitness and body
composition.
Smith et al. (44) looked to determine if CrossFit® improved aerobic fitness and body
composition by measuring maximal oxygen consumption (VO2 max) and present body fat,

24
respectively. They utilized a high intensity power training (HIPT) program that involved
CrossFit®-based exercises. HIPT involves a lack of prescribed rest periods, focusing on sustained
high power outputs and using multi-joint movements; similar to CrossFit® (44). This study’s (44)
program chose to incorporate CrossFit® WODs. An example of a CrossFit® workout set up is
three sets of 21, 15 and 9 repetitions of barbell front squats with overhead presses, followed by
body weight pull-ups. This WOD is to be performed as quickly as possible. Other workouts may
require the athlete to perform as many rounds as possible in a set amount of time. This
CrossFit®-based HIPT program was carried out for 10 weeks and had 54 participants.
After the 10 week program was completed, VO2 max improved 13.6% and 11.8% for
men and women respectively. In absolute terms, body fat percentage dropped 3.7% across all
subjects. However, the authors pointed out that part of the body composition changes
experienced during CrossFit® training could be attributed to the Paleolithic diet that CrossFit®
advises participants to follow as this diet has been shown to improve body composition on its
own (44). This means that changes in body composition cannot be fully attributed to the
program. Another interesting note the authors (44) made was about the number of subjects
who actually completed the program.
Of the original 54 subjects who volunteered, 43 (23 males and 20 females) were able to
finish the program or return for follow up testing (44). Two of the 11 who dropped out reported
time concerns as their reason for discontinuing participation. The other nine participants (16%
of the total recruited subject) noted overuse or injury as their reason for dropping out (44). This
type of drop out occurred in spite of the author’s (44) deliberate periodization of the program
and required supervision by certified fitness professionals of the participants. While CrossFit®

25
does improve aerobic fitness and body composition, this study calls into question whether the
benefits outweigh the risks of the CrossFit® program (44). This article demonstrates a need for
additional research on the injury risks involved with CrossFit® and ECPs, especially as CrossFit®
starts to move into university classroom settings.
Barfield et al. (10) reported that the majority of colleges and universities (about 63% as
of 1998) require fitness classes for credit toward graduation. Colleges offer three different
types of fitness class formats: the traditional class, the independent class and the class that is
contracted out to a local exercise or sport organization (10). The traditional class is typically a
basic weight training and conditioning class instructed by one of the university’s faculty
members or athletic coaches. This can result in proper instruction, supervision and mentoring
(10). The independent class format allows the student to follow a university faculty member or
athletic coach’s weight training and conditioning plan without supervision (10). The contracted-
out class is usually used when the university does not have the facilities for a specific activity
such as golf or bowling (10). Universities will also use this format to provide their students with
the opportunity to participate in the latest popular fitness program. The purpose of the Barfield
et al. (10) study was to determine the students’ fitness changes between fitness class formats
over the course of a semester. In this study’s case, the contracted-out class used here was
CrossFit® (10).
Barfield et al. (10) measured the subjects’ body composition using his or her body mass
index (BMI), their muscular strength via hand grip dynamometer scores, muscular power via the
standing long jump and muscular endurance via the number of standard pull-ups completed,
the number of squat repetitions completed in one minute and the YMCA bench press test for

26
upper body endurance. Subjects in the traditional class format had greater gains in muscular
power and upper body muscular endurance. The students improved their scores by 60% for the
pull-up test and improved by 90% in the standing long jump. Overall, the average improvement
for students in the traditional resistance program was 20% (10).
In the independent class format the students improved their fitness the least. Hand grip
strength did increase by about 11%, YMCA bench press performance increased by 30% and
standing long jump performance increased by 35% (10). However, BMI increased and muscular
power and upper body muscular endurance decreased in these subjects. The authors (10)
deemed that the lack of results in the independent class format indicated that this format is not
effective for fitness gains in a college setting.
Finally, the CrossFit® group increased their overall fitness by 17% on average (10). This
group had great gains in lower body endurance. Their squat test scores improved by 70% and
60% improved their standing long jump performance. Yet when it came to upper body muscular
fitness, only 50% and 40% improved in the YMCA bench press and pull-up test, respectively.
The authors (10) determined that both the traditional resistance training format and the
CrossFit® format would be acceptable for college credit fitness class but not the independent
class format. From this, it is suggested that a CrossFit® based program could be a good addition
to the credit-worthy fitness classes for college students (10). In addition to college students,
CrossFit® has also extended their program to youths.
CrossFit® has developed a youth friendly program called CrossFit® Kids. The program is
still considered highly intense and challenging while utilizing functional fitness (42). The
difference is that the workouts are even shorter, typically 5 – 20 minutes long. The workouts

27
are also scaled down from the adult versions to accommodate safety of the youth (42). These
workouts are a part of CrossFit’s® open-source internet program as well as a part of affiliate
gym programs (42). Strength training youths requires that they first know proper techniques
using low-resistance exercises (14), this would seem the opposite of CrossFit® Kids if it is indeed
a version of the adult workouts. The American Academy of Pediatrics (14) also states that
preadolescents and adolescents should avoid body building, power lifting, competitive weight
lifting and maximal lifts until physical and skeletal maturity is reached. There is a lack literature
on CrossFit® Kids compared to the original version. This brings up a need to analyze CrossFit®
Kids to determine the efficacy and safety for youth participation as it does not seem to follow
guidelines already set in place by the American Academy of Pediatrics (14). As shown in the
previous literature, CrossFit® has grown in popularity throughout the general population from
adults to youths but, the safety of CrossFit® has yet to be explored.
There has been documented concerns of safety via the Consortium for Health and
Military Performance and American College of Sports Medicine Consensus Paper on Extreme
Conditioning Programs in Military Personnel (Consensus Paper) (11). In relation to this concern,
Hak et al. (2013) (26) performed a descriptive study using a questionnaire to gather data about
the injuries which occur from CrossFit®. Per their sample, it was determined that 3.1 injuries
occur per 1000 hours of training. This injury rate was seen as similar to weightlifting,
powerlifting and gymnastics (26). They found that 186 injuries were reported from the 132
responses received. Of the injuries reported, 25.8% were shoulder injuries which was
considered higher than the number of shoulder injuries reported for elite and competitive
Olympic weightlifters (26). This may be due to the use of heavy resistance, a high number of

28
repetitions and high intensity the CrossFit® program utilizes when performing Olympic lifts (26).
In addition, the Consensus Paper (11) seemed to place an emphasis on learning about potential
injury risks with other ECPs. In particular, a greater understanding of ER and its risk of
development when performing ECPs are required (11).
EXERTIONAL RHABDOMYOLYSIS
Rhabdomyolysis is a skeletal muscle injury resulting in the breakdown of muscle tissue
and the leakage of muscle cell contents, such as myoglobin and creatine kinase (CK), into the
circulatory system disrupting cell homeostasis (8,12,13,27,35,38,45). This conditioning could be
triggered by crush injuries, cocaine use, immobilization, alcohol use and exercise though it is
not well understood why one patient develops high CK levels or rhabdomyolysis and another
does not when they experience the same trigger (9,27). Episodes of rhabdomyolysis that have
occurred due to exercise have been termed exercise-induced or exertional rhabdomyolysis (ER).
Exertional rhabdomyolysis typically involves the use of strenuous, excessive or repetitive
physical training, usually of the eccentric nature, at an intensity the individual is unprepared for
(13,38,45). In addition to the overly physically demanding exercises, a combination of heat
stress, dehydration, being untrained, sickle cell trait, the use of certain drugs (statins,
anticholingergics, amphetamines, anabolic steroids, glycyrrhizinic acid - present in black
licorice), dietary supplements (ephedra and caffeine) or “high stakes training” for firefighters,
law enforcement or military cadets may increase the risk of developing ER (13,38). However,

29
incidence of ER has been known to occur in the absence of heat stress and dehydration and in
those who are well conditioned, healthy athletes (13).
About 26,000 incidences of rhabdomyolysis are reported annually in the United States
with about 47% of those being diagnosed as ER (13,27). Individuals reporting to the hospital
with complaints of muscle pain, swelling, weakness and brown (tea or cola-colored) urine after
exercise should result in the physician being suspicious of the presence of acute ER
(12,27,35,45). There needs to be an increased awareness for acute ER as it is often
underdiagnosed (35). This could be costly as ER can result in additional complications. Mild to
moderate acute ER can result in electrolyte abnormalities (hyperkalemia, hypernatremia and
hyperphosphatemia) (35,45). More serious cases can result in acute myoglobinuria, renal
failure, compartment syndrome, cardiac arrhythmia and death in 5% of cases (32,35,38,45).
Due to the seriousness of the complications that can arise with ER, diagnosis needs to be
accurate, followed by swift treatment.
Diagnosis and Treatment of Exertional Rhabdomyolysis
A physical examination is typically performed with emphasis on looking for swelling,
tenderness and tenseness in muscles with pain in the muscles used during the previous exercise
stint (35,45). In addition, lab tests for myoglobin and CK levels are performed. A simple dipstick
test is performed to identify blood in the urine. Diagnosis should be confirmed by measuring
serum CK levels if the dipstick test is positive for myoglobinuria and a microscopic examination
of the urine does not show it to contain red blood cells (35). Normal CK ranges for males are 55

30
to 170 IU/L and females are 30 to 135 IU/L (32). The most used diagnostic criteria for ER
involves having the CK levels at least five times the upper limit of normal (38,45). Creatine
kinase levels are considered the primary serum marker for ER due to its high sensitivity;
however it is not specific (27,32).
This is seen in the lack of consensus on what threshold of CK elevation relates with ER
(32). For example, the United States Food and Drug Administration states ER is defined as an
individual having CK levels more than 50 times the upper limit of normal or having CK levels of
10000 IU/L along with organ damage that is usually seen as renal compromise (32). The
National Lipid Association’s Muscle Safety Expert Panel (NLAMSEP) has a different take on what
is defined as ER. They state an individual has ER if any evidence of muscle cell destruction is
found regardless of the CK levels and the relationship to changes in renal function (32). In
addition, this panel also gives categories of CK elevations: mild (<10 times normal levels),
moderate (10-49 times normal levels) and marked (greater than or equal to 50 times normal
levels (32). ER can be diagnosed with a CK level at least five times greater than the norm, yet
that is only categorized as mild according to the NLAMSEP. Regardless of the diagnostic criteria
used to determine if a patient has ER, treatment needs to begin immediately.
Treatment typically involves early intravenous (IV) fluid replacement to increase urine
production while monitoring CK levels and monitoring for further complications such as
compartment syndrome or acute renal failure (35,38). However, there appears to be no
established link for normal, healthy individuals who regularly exercise or perform high intensity
eccentric exercise acutely with kidney dysfunction or muscle disorder (9). Patients could receive
as much as four to ten liters of normal saline to help re-hydrate (35). When monitoring CK

31
levels, there is not an acceptable level the patient must reach before being discharged or an
acceptable rate of decreased progression (38). When a patient is discharged, they are advised
on correct hydration, rest rates and safety in regards to exercise. They should also be instructed
to avoid eccentric exercise and exercising in hot environments (17). It may also be
recommended that the patient attend physical therapy in order to recondition gradually and to
help facilitate an early return to exercise (17). While specific diagnostic criteria and treatment
considerations in regard to CK levels for ER are not well agreed upon and is an area in need of
further research (45), most agree that CK levels normally increase with exercise (32).
Creatine Kinase’s Association with Exercise and Exertional Rhabdomyolysis
Exercise is known to increase CK levels but especially in males, African Americans and
untrained individuals (32). Moderate-intensity exercise (heart rate between 55% and 90% of
maximum) has been known to increase CK levels to the threshold for diagnosis of ER (32). The
greatest rise in CK levels tends to come from higher-intensity, longer-duration and weight-
bearing exercise involving eccentric muscular contractions and downhill running (32).
Endurance type exercises also produce less extreme rises in CK levels as compared to eccentric-
type exercise (17). For example, eccentric exercises could result in a rise of 10 to 20 times the
normal serum CK levels but, non-weight-bearing exercises and those involving fewer eccentric
movements, such as swimming and cycling, result in nominal increases in CK levels (32). Other
variables that could influence the rise in CK levels include gravitational forces, vibrations,

32
temperature and altitude (32). During exercise and post-exercise there is a rough time table as
to how CK levels rise.
Two to 12 hours after exercise, CK levels rise until they reach peak concentrations
around three to four days post-exercise (13,17). It is not clear if a rise in CK levels can be
compounded from one day to next by exercising multiple days in a row though it would seem
possible if the exercise resulted in additional levels of stress seen with muscular soreness; more
research would be needed in this area. If an individual presents to the hospital within 24 to 48
hours after strenuous exercise complaining of symptoms leading to the physician being
suspicious of ER, then inpatient therapy is highly recommended due to the chance of the
patient of developing high CK levels (17). However, if a patient presents to the hospital about
three days post-exercise with symptoms of ER but he or she is not dehydrated, has no urine
discoloration and no signs of compartment syndrome along with CK levels less than 15000 to
20000 IU/L, then it is possible they have already reached peak CK levels and can be managed as
an outpatient with oral hydration and rest (17). With an understanding of the working of CK
levels and the development of ER from exercise, practical examples can be applied.
Case Studies involving Exertional Rhabdomyolysis
From July 1971 to July 1972, 3.2 cases per 1000 recruits were reported to experience
acute ER at the Marine Corps Recruit Depot in Parris Island, South Carolina (15). More recently,
Smoot et al (45) reported that in civilian populations and military personnel, rates of ER range
from 2 per 10000 persons and 2.2 to 8 per 10000 persons, respectively, though most are

33
reported in single cases (45). The first case study from Inklebarger et al. (29) was on a 63 year
old female, recreational athlete. She presented to the hospital with lower back pain, leg pain
and stiffness after stationary bicycling one day prior. Inklebarger et al. (29) describes the
patient as having a history of lower back pain and sciatica due to a prior year-long disability
along with a family history of hypertension and non-insulin diabetes leading her to seek a more
active lifestyle and being referred for exercise prescription. The subject also described having
immediate onset of pain and weakness in both of her thighs post exercise. The symptoms felt
different from her normal baseline of pain. After checking her vital signs and urine, both were
unremarkable and she was discharged. The subject returned the next day with worsening leg
pain and dark urine. While the urinalysis remained negative, CK levels were at 38,120 IU/L. The
patient was then admitted for oral and IV hydration along with fluid balance monitoring. After
CK levels rapidly normalized, the subject was discharged two days later (29).
Line and Rust (35) described a case study about a 32 year old physician who was used to
running 30 miles per week. In this case, he was running in a marathon on a warm day
(85°F/29°C) and after about nine miles, collapsed due to severe pain in his calves and thighs. He
was hospitalized with his CK levels peaking at 108,000 IU/L. More severe complications arose
and he required dialysis therapy and treatment for compartment compression syndrome in his
thighs and calves. He eventually made a full recovery after six months (35).
Line and Rust (35) reported another case study describing a 24 year old man who had
completed a two hour, high-intensity weight lifting session with heavy weights two days before
visiting the hospital. He came to the hospital complaining of pain and bilateral swelling in his
arms and chest. The physical exam revealed bilateral swelling, tenderness and tenseness of the

34
pectoralis, biceps and triceps muscles. His urinalysis was normal except for 3+ positive heme
but under microscopic examination, the urine was negative for red blood cells. His CK levels
were 13,758 IU/L and so he was admitted to the hospital and vigorously hydrated. The CK levels
peaked at 50,200 IU/l before slowly returning to normal over the following six days. During this
time he had no overt bleeding and normal renal function and, he was able to successfully
recover (35).
The next case study was not on a single person but on a single sports team, specifically
the University of Iowa football team (45). After playing in their bowl game on December 28,
2010, they took a three week break. The team then participated in their first off-season
workouts on January 20, 21 and 24, 2011. The first workout consisted of sled pushes and
several weight lifting tasks such as performing a timed, 100 repetitions of back squats at 50% of
their one repetition maximum. For the back squats, the players were allowed to take as much
time and use as many sets as they needed to complete the task. Three players presented to the
athletic training staff with having three days of dark urine, severe muscle soreness and muscle
swelling. They also had antalgic gaits, tender, swollen lower extremity muscles and normal
neurovascular examinations. Smoot et al. (45) reported these three players as having CK levels
ranging from 166,991 to 233,167 IU/L. After a fourth player reported to an athletic trainer with
similar symptoms, the medical staff sent out a mass text to all players urging them to report to
medical staff immediately if they experienced any of the symptoms of ER. Nine additional
players responded to the text and all were admitted to the hospital. Of the 13 players who
developed ER, 10 allowed Smoot et al (45) to review their medical records.

35
These players had CK levels ranging from 96,987 to 331,044 IU/L, normal electrolyte
levels and had positive urinalyses but red blood cells were not seen under microscopic
examination. One of the 10 subjects tested positive for opiates, but that was due to the player
receiving narcotics for pain previous to the urine sample being collected. The other nine drug
tests were negative. One player had the sickle cell trait but the others did not. Treatment
involved IV fluids in order to produce 200 to 300 mL/h of urine output. After 24 hours, CK levels
started to drop back down. All players were discharged four to six days after being admitted
when myoglobinuria had resolved and their CK levels were about 10,000 IU/L. No one required
hemodialysis or acquired compartment syndrome. After two weeks of being discharged, all
subjects were asymptomatic and had CK levels between 100 to 700 IU/L. The athletes began to
gradually return to practice 14 to 24 days post-hospitalization. It was determined by the
authors (45) that the longer the player needed to complete 100 repetitions of back squats the
higher the individual’s risk was to develop ER. Due to this insight, the 100 repetitions of back
squats task was removed from future workout plans by the coaching staff (45).
This next case study comes from a patient’s own personal account with ER as posted on
the subject’s blog (36). This is purely the patient’s own telling of the events that occurred and is
in no way a peer-reviewed article. Lombardi (36) considered himself an athlete as he played
multiple high school sports and was recently playing basketball once a week, along with being
in an intramural soccer league and two intramural softball leagues. The subject went on to
launch his own start-up business and started to spend about 16 hours at his computer (36). This
may mean he was becoming more sedentary. Lombardi (36) gained weight, increasing from
about 79.38 kg to 88.45 kg (height, 185.42 cm). In order to get back into shape he planned to
36
perform P90X®. On the first day, he completed the first half of the first workout involving chest
and back exercises (push-ups and pull-ups). The next day, he noted feeling very sore and as the
day went on, he noticed swelling in his triceps, deltoids and pectorals. He still decided to
perform the day two P90X® workout which was more leg focused. On the third day, he
describes muscular pain which made it difficult for him to move. He decided he needed to take
a break from P90X®. The fourth day he noticed his urine was cola-colored and decided to visit a
kidney specialist who eventually sent him to the hospital on suspicions of ER. At the hospital he
was given 200 mL of IV fluids. On the fifth day, he was admitted to the hospital as his urine
contained blood and myoglobin. The subject’s CK levels were over 16,800 IU/L (that was the
maximum value the machine could go up to for that specific test for that hospital). The kidney
specialist determined his CK levels to be over 50,000 IU/L which was the maximum value the
specialist’s machine could detect. The subject was then given two bags of IV fluids (the amount
is unknown) and a catheter in hopes of preventing kidney failure. His liver enzymes were
reported as high on the sixth day. He was ordered an ultrasound and MRI on the organ but the
results of the tests were unknown to the patient when he reported his experience. On the
seventh day, CK levels fell to 12,000 IU/L and the patient was discharged from the hospital. He
was told to stay hydrated and follow up on the liver examination. In addition, he was told to not
exercise for a few weeks and to ease back into sports after resting (36). This reported
experience could still be considered as a good example of how ER can come with additional
complications when the individual is not aware of the signals his or her body is implying and so
results in delaying treatment.

37
In following with ECPs and ER, this case study involves a 33 year old law enforcement
officer who was previously healthy and physically fit before needing hospitalization (25). He
reported to the hospital three days after completing a high intensity CrossFit® workout with
feelings of fatigue, muscle soreness and swelling. He described the CrossFit® exercise program
as prolonged and extreme; and feeling fatigued, short of breath, muscularly weak and having
sleep disturbances after completion of the workout. He also reported to having completed five
days of exercise previous to the start of his CrossFit® program. The physical examination
revealed muscle tenderness to light palpation, bicep and tricep compartment swelling and
pectoralis muscle swelling along with difficulty performing full elbow flexion and extension due
to pain. A urinalysis came back positive for blood but microscopic examination revealed no red
blood cells were present and a blood test revealed CK levels of 26,000 IU/L. He was then
diagnosed with ER and admitted to the hospital. There he was treated with IV fluids and had CK
levels and muscle soreness monitored. He was discharged six days later with a CK level of 995
IU/L. He was able to return to high intensity training after four months of mild to moderate
aerobic training along with instructions for high intensity workout recovery and proper
hydration (25). While CrossFit® was performed leading up to this subject being diagnosed with
ER, it is not clear if ER was a direct result of CrossFit® or the compounding effect of CrossFit®
and the five previous days of exercise.
CrossFit® does acknowledge five people who have developed ER associated with their
program (21). They have even documented these cases. There are very few details as this was
not a peer-reviewed case study article. The article described the “victims” as all needing
hospitalization, with the longest stay being six days and the shortest being two days (21). All of

38
the subjects also made full recoveries. The first individual described was a female college
student in her early twenties who also surfed and mountain-biked. She attended her second-
ever CrossFit® workout within three days of the first one. This workout was described as a hard-
hitting, fast-moving group workout including high repetition assisted pull-ups. It seems she
became sore and then sorer and decided to go to the hospital where she was admitted for
three days but, it was reported, that she “didn’t feel sick” (21).
The second subject was a dermatologist in his late forties as well as an avid tennis
player. He attended his first CrossFit® workout on a Monday and his second on Wednesday. He
followed that up with playing multiple hours of tennis on Friday, Saturday and Sunday. That
next Monday he reported to the hospital with his major complaint being soreness.
The next subject was described as a female collegiate softball pitcher who had
challenged the “manhood” of her football running back boyfriend after he complained about
the CrossFit® workout called “Tabata This” (21). The boyfriend then challenged her to complete
the “Pepsi” challenge which she did not and resulted in her being hospitalized for four days
after presenting to the hospital three days post-exercise (21). She was described by the author
as being a “very sick girl” (21).
The fourth person was described as being male and special operations personnel. It
seems he was also a bodybuilder and runner who chose to ignore warnings to “learn
something” about CrossFit® before participating in a three day CrossFit® seminar (21). On his
first two days, he was described to have had suffered third and fourth quartile outputs resulting
in him needing to not participate in the workout on the third day. He was then hospitalized on

39
days four through eight. The article states that having to sit out on the third day may have
“saved his life” and that he had had “way too much CrossFit® way too soon” (21).
Lastly, was a middle-age male who was a fit SWAT officer. A friend took him through a
“Helen”-like workout on his first day (21). It is described that this workout, “almost killed him –
literally. Our first and worst bout of Rhabdo. Now an avid CrossFitter” (21). It was reported that
each of these individuals were new to CrossFit® and developed ER in their first or second
workouts. Those who were able to perform a second workout had performed it at least two
days after the first workout. They seem to have continued on with CrossFit® as their training
program. Lastly, Glassman (21) states that they have never had an experienced “CrossFitter”
develop ER.
Summary of the Case Studies
In summary of the peer-reviewed case studies, all four describe the subjects as having
muscular pain and/or swelling along with urinalysis that was positive for blood but had no red
blood cells present and what are considered high CK levels (25,29,35,45). Two reported
complaints of dark urine (29,45). They all stated that subjects were treated with IV fluids and
monitored further (25,29,35,45) with only one patient needing additional treatment due to
compartment compression syndrome and renal complications (35). They were all discharged
after being hospitalized for a range of two to six days and they all made full recoveries within
six months (25,29,35,45).

40
In addition to these case studies, another incident was reported by the patient on their
blog and the other incidents were depicted by CrossFit® (21,36). Both articles described similar
findings to those of the case studies with the exception that CrossFit® was unable to report
results of blood test, urinalyses and if they were actually medically diagnosed with ER (21,36).
The CrossFit® article states that they have yet to hear about ER cases involving sedentary or
inactive individuals (21) and with this article being written in 2005 it’s very possible that that is
true, considering the closest to a sedentary or inactive individual in the previous cases comes
from Lombardi (36) who describes his own experiences for everyone to see in 2013. He
describes himself to having started spending roughly 16 hours sitting in front of a computer
seven days a week and gaining enough weight to go from 79.38 kg to 88.45 kg (36). He could be
considered to be an individual who has started to fall into an inactive state after being an active
individual previously. One could also consider the 63 year old female who developed ER from
stationary biking. Her family history of hypertension and non-insulin diabetes led to seeking a
more active lifestyle and being prescribed exercise (29). However, it is unknown as to how far
she was into her exercise prescription. Though unclear, it is possible this subject may have also
been on the more inactive side of the spectrum of activity. Though, again, this published article
was written in 2010, five years after the CrossFit® article. This may mean CrossFit® needs to
reevaluate the literature and update their stance on ER.
CROSSFIT’S® DEFFENSE AGAINST DEVELOPING EXERTIONAL RHABDOMYOLYSIS

41
CrossFit® (23) states that their program is designed to defend against ER. This is
because workouts last 20 minutes or less. The tendency for CrossFit® to change the metabolic
pathways being used over the duration of the workout results in lessening the effects of lactic
acid as anaerobic exercise produces lactic acid and aerobic exercise absorbs lactic acid (23).
However, as participants are supposed to be performing at their personal best during every
workout, it is unclear how participants could avoid anaerobic levels while performing maximal
exercise. CrossFit® also advocates gradual conditioning by encouraging the individual to safely
challenge themselves during each workout (23) though there is not an explanation given on
how the progression should occur. With normal hydration before the workout and the
individualization of the CrossFit® program for each person to perform their personal best
lessens the risk of developing ER.
The individualization seems to come from the participant controlling the intensity of the
workout and each individual is encouraged to adjust loads or substitute workouts to their
capabilities. CrossFit® claims their participants are also not susceptible to overexertion due to
group training as all athletes are not held to the same standard of work production or power
output (23). Yet in the CrossFit® Induced Rhabdo (21) released by CrossFit®, it states that one of
the “victims” had participated in a group workout that possibly resulted in her hospitalization.
Therefore, there seems to be some discrepancy as to whether CrossFit® does or does not
require group workouts at some point in their training program.
Lastly, as part of CrossFit’s® consent and release form individuals are made aware that it
is their responsibility to know their own body’s limitations while exercising. They are
responsible for setting their own level of exertion and are not to exceed this limit which would

42
put them at risk for developing injuries (i.e. ER) (23). This type of policy seems to make the
assumption that the average CrossFit® participant has this type of knowledge. While it would
be an acceptable assumption for a highly trained athlete coming into CrossFit®, a novice should
not be expected to have this sort of understanding about his or her body. This could also call
into question the role of the CrossFit® trainer. Even though the participant is responsible for his
or her workout, the trainer should still be actively assisting, supervising and have the upmost
authority to tell the participant he or she needs to stop if/when a breakdown in movement
technique or fatigue compromising the participant’s judgment is observed.
CONCLUSION
It should be understood that the incidence of ER in the United States (13,27). However,
ER clearly has the occasional occurrence in CrossFit® (as well as other ECPs) as seen by their
own report on the few cases they have had (21). The issue of developing ER during CrossFit®
has even caught the attention of the media (41,48) but the actual incidence rate for developing
ER from CrossFit® is unknown (although most likely minimal). This could be further assured if
the participant has a good understanding of his or her limits and is taught by a highly qualified
and well-practiced CrossFit® trainer, it could be highly possibly to have very little risk of
developing ER. It is interesting however, that ER seemed to be a largely unknown condition
prior to CrossFit®, and other ECPs, catching on with the general population. Therefore,
additional research is clearly needed to gain a better understanding of the CrossFit® program’s
effects on the development of ER.

43
Additionally, how CK levels rise due to CrossFit® could be explored and compared to
other more traditional sports (i.e. weightlifting, football, triathlon, etc.). Due to the variation at
which CK levels can be at when ER develops, it may be more appropriate to analyze CK levels
for the various CrossFit® WODs available. Examples of the differing values of CK levels can be
seen in the different CK levels reported in the previous case studies mentioned. The range was
13,758 – 331,044 IU/L (35,45) from subjects of varying exercise backgrounds which could be a
similar background for the CrossFit® population. Analyzing the CrossFit® WODs may enable
researchers to determine which WODs are the most taxing for the skeletal muscle. It may be
possible to use the National Lipid Association’s Muscle Safety Expert Panel’s categories of CK
elevations (32) to help rank WODs from least to most taxing. This would allow for further
determination of the safety of CrossFit®.
From the current literature available it is clear researchers have only just begun their
investigation of CrossFit® and other ECPs. Due to ECPs program prescription avoiding the use of
appropriate and safe exercise prescriptions set by the ACSM (33), it is important to consult a
physician to make sure you are physically prepared to handle the high demands of the program.
As additional research on ECP’s effectiveness and safety is conducted, physicians could be able
to explain to their patients how to safely manage themselves in exercise programs of this
intensity. This could possibly decrease the potential for muscle strains, ligament damage and
potentially life threatening muscular injuries such as ER. The way people exercise is rapidly
changing, placing emphasis on the importance of up-to-date research in order to ensure that
the most effective and productive exercise regiments are being put into practice.

44
CHAPTER 3: CONCLUSIONS AND RECOMMENDATIONS
PRACTICAL APPLICATIONS
From this sample, there was one reported case of ER from a CrossFit® participant;
therefore, ER does have the rare occurrence in CrossFit®. However, CrossFit’s® highly intense
bouts seem to have exercisers reporting greater RPEs and hard days per week vs. ACSM training
routines. Therefore, participants of CrossFit® should strive to maintain a good understanding of
their limitations during exercise in order to cope with demanding intensity and repetitive
exercise bouts. Furthermore, all exercisers engaged in highly intense exercise should hydrate
appropriately prior to exertion, and seek highly qualified and experienced CrossFit® or strength
and conditioning professionals. Ultimately, exercise and training programs are ever changing,
placing an emphasis on the importance of up-to-date research in order to ensure that the most
effective, productive, and safe exercise regiments be put into practice.
FUTURE RESEARCH CONSIDERATIONS
Areas future researchers should consider are the changes in CK levels during CrossFit®;
in particular, the CK levels produced during each CrossFit® WOD. The list of CrossFit® WODs
with at least an RPE of five provides a good start. The CK levels of those WODs could yield
additional insights into the risk they yield for ER development via the National Lipid
Association’s Muscle Safety Expert Panel’s categories of CK elevations (32). Overall changes in

45
CK levels during CrossFit® could also be compared to traditional sports (i.e. weightlifting,
football, triathlon, etc.).
Lastly, utilizing similar methods from this study could help explore other ECPs (Insanity®
and P90X®). This could result in a greater understanding of these extreme exercise programs in
terms of overall intensity, the intensity of specific workouts and identification of primary risk
factors for ER development in those programs. More importantly, it could shed light on the
overall incidence of ER for ECPs.

46
REFERENCES 1. Alcaraz PE, Perez-Gomez J, Chavarrias M, Blazevich AJ. Similarity in Adaptations to High-Resistance
Circuit vs. Traditional Strength Training in Resistance-Trained Men. Journal of Strength and Conditioning Research 25: 2519–27, 2011.
2. Anonymous. CrossFit: Forging Elite Fitness: Thursday, Workout of the Day, 050818 [Internet]. CrossFit. , 2005.Available from: http://www.crossfit.com/mt-archive2/000881.html
3. Anonymous. Lack of Time Prevents Many Americans from Getting Fit. Obesity & Diabetes Week. 68, 2010.
4. Anonymous. Prevalence of Obesity in the United States, 2009-2010. Medical Benefits 29: 3–4, 2012.
5. Anonymous. Reebok CrossFit Games Leaderboard [Internet]. CrossFit Games. , 2013.Available from: http://games.crossfit.com/leaderboard
6. Anonymous. CrossFit - How to Affiliate [Internet]. Available from: http://www.crossfit.com/how-to-affiliate
7. Baechle TR, Earle RW. Essentials of Strength Training and Conditioning. Third. Human Kinetics, 2008.
8. Bagley W, Yang H, Shah K. Rhabdomyolysis. Internal and Emergency Medicine 2: 210–8, 2007.
9. Baird MF, Graham SM, Baker JS, Bickerstaff GF. Creatine-Kinase- and Exercise-Related Muscle Damage Implications for Muscle Performance and Recovery. Journal of Nutrition and Metabolism 2012: 1–13, 2012.
10. Barfield J., Channell B, Pugh C, Tuck M, Pendel D. Format of basic instruction program resistance training classes: effect on fitness change in college students. Physical Educator 69: 325+, 2012.
11. Bergeron MF, Nindl BC, Deuster PA, Baumgartner N, Kane SF, Kraemer WJ, et al. Consortium for Health and Military Performance and American College of Sports Medicine Consensus Paper on Extreme Conditioning Programs in Military Personnel. Current Sports Medicine Reports 10: 383 – 389, 2011.
12. Childs S. Rhabdomyolysis. Orthopedic Nursing 24: 443–9, 2005.
13. Cleary MA, Sadowski KA, Lee SY-C, Miller GL, Nichols AW. Exertional Rhabdomyolysis in an Adolescent Athlete during Preseason Conditioning: A Perfect Storm. Journal of Strength and Conditioning Research 25: 3506–13, 2011.
14. Committee on Sports Medicine and Fitness. Strength Training by Children and Adolescents. Pediatrics 107: 1470–2, 2001.

47
15. Demos MA, Gitin EL, Kagen LJ. Exercise Myoglobinemia and Acute Exertional Rhabdomyolysis. Archives of Internal Medicine 134: 669 – 673, 1974.
16. Garber CE, Blissmer B, Deschenes MR, Franklin BA, Lamonte MJ, Lee I-M, et al. Quantity and Quality of Exercise for Developing and Maintaining Cardiorespiratory, Musculoskeletal, and Neuromotor Fitness in Apparently Healthy Adults. Medicine & Science in Sports & Exercise 43: 1334–59, 2011.
17. George M, Delgaudio A, Salhanick SD. Exertional Rhabdomyolysis - When Should We Start Worrying/. Pediatric Hospitalist 26: 864 – 866, 2010.
18. Glassman G. Foundations. CrossFit Journal April: 1 – 8, 2002.
19. Glassman G. What is Fitness? CrossFit Journal October: 1 – 11, 2002.
20. Glassman G. What is CrossFit? CrossFit Journal March: 1 – 4, 2004.
21. Glassman G. CrossFit Induced Rhabdo. The CrossFit Journal 38, 2005.
22. Glassman G. The CrossFit Training Guide. CrossFit Journal September: 1 – 115, 2010.
23. Glassman JA. Consortium for Health and Military Performance and American College of Sports Medicine Consensus Paper on Extreme Conditioning Programs in Military Personnel: An Answer. CrossFit Journal 1 – 92, 2012.
24. Gotshalk LA, Berger RA, Kraemer WJ. Cardiovascular Responses to A High-Volume Continuous Circuit Resistance Training Protocol. Journal of Strength and Conditioning Research 18: 760 – 764, 2004.
25. Hadeed MJ, Kuehl KS, Elliot DL, Sleigh A. Exertional Rhabdomyolysis after Crossfit Exercise Program. Medicine & Science in Sports & Exercise 43: 224–5, 2011.
26. Hak PT, Hodzovic E, Hickey B. The nature and prevalence of injury during CrossFit training: Journal of Strength and Conditioning Research 1, 2013.
27. Hannah-Shmouni F, McLeod K, Sirrs S. Recurrent exercise-induced rhabdomyolysis. Canadian Medical Association Journal 184: 426 – 430, 2012.
28. Ho R. Handbook of Univariate and Multivariate Data Analysis and Interpretation with SPSS. Taylor & Francis Group, 2006.
29. Inklebarger J, Galanis N, Kirkos J, Kapetanos G. Exercise-induced rhabdomyolysis from stationary biking: a case report. Hippokratia 14: 279–80, 2010.
30. Jeffery C. CrossFit effectiveness on fitness levels and demonstration of successful program objectives [Internet] [M.S.E.S.]. [United States -- Arkansas]: Arkansas State University, 2012 [cited 2012 Oct 5].Available from: http://search.proquest.com/docview/1031212740/citation?accountid=2745

48
31. Landis JR, Koch GG. The Measurement of Observer Agreement for Categorical Data. Biometrics 33: 159 – 174, 1977.
32. Latham J, Campbell D, William N. How much can exercise raise creatine kinase level - and does it matter? The Journal of Family Practice 57: 545 – 547, 2008.
33. Leahy G. Evidence-Based Physical Training: Do CrossFit or P90X Make the Cut. Tactical Strength and Conditioning Report 22.1–22.3, 2012.
34. Leahy G. A Research Update on Extreme Conditioning Programs: Where are we now with CrossFit? Tactical Strength and Conditioning Report 4 – 8, 2014.
35. Line RL, Rust GS. Acute Exertional Rhabdomyolysis. American Family Physician 52: 502 – 506, 1995.
36. Lombardi M. How The Stress Of Running A Startup And Some P90X Led To A Week-Long Stay In The Hospital With Rhabdomyolysis [Internet]. College Spun - Social. Local. Consumable. College Sports. , 2013.Available from: http://collegespun.com/features/how-the-stress-of-running-a-startup-and-some-p90x-led-to-a-week-long-stay-in-the-hospital-with-rhabdomyolysis
37. McMilliam D. Extreme Conditioning Programs: Evaluating and Managing the Risk [Internet]. NSCA’s 2012 TSCA Conference: 2012 [cited 2013 Aug 9].Available from: http://nsca.com/Pages/ContentRightNav.aspx?pageid=2147490230
38. O’Connor FG, Brennan Jr FH, Campbell W, Heled Y, Deuster P. Return to physical activity after exertional rhabdomyolysis. Current Sports Medicine Reports 7: 328 – 331, 2008.
39. O’Hara RB, Serres J, Traver KL, Wright B, Vojta C, Eveland E. The Influence of Nontraditional Training Modalities on Physical Performance: Review of the Literature. Aviation Space and Environmental Medicine 83: 985 – 990, 2012.
40. Paine J, Upgraft J, Wylie R. CrossFit study. CrossFit Journal September: 1 – 69, 2010.
41. Robertson E. CrossFit’s Dirty Little Secret [Internet]. Huffington Post. , 2013.Available from: http://www.huffingtonpost.com/eric-robertson/crossfit-rhabdomyolysis_b_3977598.html
42. Sibley BA. Using sport education to implement a CrossFit unit: boost student interest by turning a fitness program into a competitive sport. The Journal of Physical Education, Recreation & Dance 83: 42+, 2012.
43. Sinert R, Kohl L, Rainone T, Scalea T. Exercise-induced rhabdomyolysis. Ann Emerg Med 23: 1301–6, 1994.
44. Smith MM, Sommer AJ, Starkoff BE, Devor ST. Crossfit-based high intensity power training improves maximal aerobic fitness and body composition. Journal of Strength and Conditioning Research 27: 3159 – 3172, 2013.
45. Smoot MK, Amendola A, Cramer E, Doyle C, Kregel KC, Chiang H, et al. A Cluster of Exertional Rhabdomyolysis Affecting a Division I Football Team. Clinical Journal of Sport Medicine 0: 1 – 8, 2013.
49
46. Stoddard G. Inside the Cult of CrossFit. Men’s Health 26: 130, 2011.
47. Taskin H. Effect of Circuit Training on the Sprint-Agility and Anaerobic Endurance. Journal of Strength and Conditioning Research 23: 1803–10, 2009.
48. Video: CrossFit Linked to Potentially Fatal Condition Rhabdomyolysis [Internet]. ABC News. Available from: http://abcnews.go.com/GMA/video/crossfit-linked-potentially-fatal-condition-rhabdomyolysis-20380676

50
APPENDIX A
A PERFORMANCE PROFILE RELATED TO BUILDING ELITE FITNESS IN MALE COMPETITORS
ABSTRACT
The feats of the best CrossFit® athletes are showcased in the CrossFit® Games. Currently fitness
benchmarks have yet to be summarized to determine a profile of CrossFit® Games athletes. The
purpose of this study was to determine a performance profile of the 2013 male CrossFit®
Games athletes using available fitness data. The top 30 participants were split into the top 10
(T10), middle 10 (M10) and bottom 10 (B10) competitors in order to stratify comparisons
between accomplished athletes. Seven documented, traditional fitness benchmarks were
analyzed for each group and included: clean and jerk, snatch, deadlift, back squat, 400 m
sprint, 5 k run and max number of pull-ups. These benchmarks were also divided into aerobic
(5K run and max pull-ups) or anaerobic (all others) categories. A one way ANOVA and
independent T-Test comparisons (p ≤ 0.007) between groups were employed. For each group
the number of tests they performed highest in (vs. the other groups) was depicted as a percent.
No significant difference was found among the groups for any benchmark. However, the T10
bested 57.14%, M10 28.57% and B10 14.29% of the seven benchmarks. Interestingly, B10
surpassed M10 (but not T10) in 71.43% of the benchmarks. Of the fitness tests T10 won out,

51
75% were anaerobic and 25% were aerobic. For M10, 50% were anaerobic and 50% were
aerobic. The only benchmark B10 won out was an anaerobic test (i.e., 400 m sprint time). If a
participant’s aim is to finish in the top 10 at the CrossFit® Games, then it would seem best to
focus on improving maximums for the anaerobic benchmarks mentioned above while
sacrificing aerobic training.
KEY WORDS: CrossFit, Crossfit Games, fitness benchmarks
INTRODUCTION
CrossFit® is becoming a vastly popular strength and conditioning program by embracing
a “fitness as sport” view (18,37,42). They aim to forge elite fitness through their three fitness
standards. The first is increasing the competence of the athlete in the ten general physical skills:
cardiovascular/respiratory endurance, stamina, strength, flexibility, power, coordination,
agility, balance and accuracy. The second standard aims to have the athlete perform well at any
and every task by maintaining a broad and constantly varied training stimulus. The last standard
aims to promote total fitness by training in all three of the metabolic pathways, phosphagen,
glycolytic and oxidative (19). Through these three standards, CrossFit® advocates the
development of fitness by creating workouts which are purposely broad, general and inclusive.
This can be seen in their definition of world-class fitness:
52
“Eat meat and vegetables, nuts and seeds, some fruit, little starch and no sugar. Keep
intake to levels that will support exercise but not body fat. Practice and train major lifts:
Deadlift, clean, squat, presses, clean and jerks, and snatch. Similarly, master the basics of
gymnastics: pull-ups, dips, rope climb, push-ups, sit-ups, presses to handstand, pirouettes, flips,
splits, and holds. Bike, run, swim, row, etc., hard and fast. Five or six days per week mix these
elements in as many combinations and patterns as creativity will allow. Routine is the enemy.
Keep workouts short and intense. Regularly learn and play new sports (19)”
Based on this definition, it is easy to see why CrossFit® has become so popular with the general
population. CrossFit® would be attractive to any athlete with any background because of how
broad and inclusive their program is.
The base of the CrossFit® program is built from functional movements. CrossFit® defines
functional movements as those which recruit motor patterns in waves of contraction from core
to extremity. These movements are multi-joint, requiring the body to move or move an object
efficiently and effectively (20). CrossFit® selects the functional movements for their program
based on, “range of joint motion, uniqueness of line of action, length of line of action, strength
of line of action, commonness of motor pattern, demands on flexibility, irreducibility, utility,
foundational value, neurological value, measurable impact on adherents, and, potential for
metabolically induced discomfort” (20). Through these movements CrossFit® seeks to improve
maximal oxygen consumption without the loss of strength, speed and power. Therefore, they
created varied and broad workouts which are meant to be performed at a high intensity using
mainly anaerobic efforts and intervals while avoiding the mastery of single modalities (19).

53
These workouts have been described as requiring to lift heavy loads and utilize high intensities
with short rest periods resulting in high heart rates (22). Diving further into the CrossFit®
program design, CrossFit® created a template called the “functional couplet.” This term refers
to simply pairing two functional movements, usually one is a classic weightlifting move such as
the deadlift and the other in a classic gymnastic or calisthenics move such as the handstand
push-up (20). It may then be required for the athlete to perform a set number of rounds
(generally three to five) of the couplet for best time or to perform as many rounds in a set
amount of time (usually no longer than 20 minutes). As these types of workouts are to be
performed at very high intensities, this requires a second template set up called the “focus day”
(20). There are three different types of “focus days,” one consists of a distance effort, the
second consists of developing a gymnastics skill and the third consists of single repetition
efforts on a basic lift or focusing on correct technique. A cycle would then be as follows:
couplet, focus, couplet, off. All of the workouts are performed on average at a high intensity
with the repetitions, sets, combinations of exercises and the length of the workout varying (20).
Table 36 provides an example of a 16 day cycle.
Through their program, based strongly in performance of functional movements at high
intensity with constantly varied and broad structure, CrossFit® firmly believes: their program is
essential to health and fitness, is comprised of only safe protocols, is the most effective in
rehabilitating from injury, is unique in developing core strength, elicits an inordinate
neuroendocrine response, produces superior cardiorespiratory adaptations and yields
unparalleled general physical preparedness or fitness (20). CrossFit’s® belief seems to be
backed by evidence based on their athletes improvement results from the workouts alone (20).

54
In relation to the 2013 CrossFit® Games, it would seem that those who finished higher overall
would then perform better in traditional fitness benchmarks. Currently traditional benchmarks
of fitness have yet to be summarized to determine a profile of CrossFit® Games athletes.
Therefore, the purpose of this article shall be to explore a possible performance profile of the
2013 male CrossFit® Games athletes based on available fitness data.
METHODS
Experimental Approach to the Problem
The objective will be to determine which/if any of the seven traditional benchmarks
relates to placement in the top 10 (T10), middle 10 (M10) or bottom 10 (B10) of the 2013
CrossFit® Games. This stratification will allow comparisons between accomplished athletes. The
seven fitness benchmarks were: clean and jerk, snatch, deadlift, back squat, 400 m sprint, 5 k
run and maximum number of pull-ups. Performances of these benchmarks will be examined to
see if any of the groups perform better than another (i.e. T10 bests M10 and B10 in the snatch)
by use of significant differences of the means. The analysis will be used to determine a
performance profile for future participants of the CrossFit® Games who wish to better their
pervious performance or perform well for the first timers.
Subjects

55
The top 30 male finishers (mean ± SD: age - 26.8 ± 3.32 yrs., n = 30; height - 177.63 ±
6.4 cm, n = 28; weight - 88.78 ± 6.22 kg, n = 30) were selected from the 2013 CrossFit® Games
for analysis as the top 30 participate in every event. The rest of the participants were cut from
the games based on points earned after the first 10 events. Participants were gathered via the
CrossFit® Games website (5) as well as data for their performances in the seven traditional
fitness benchmarks, age, weight, and height (Tables 37 and 38). Unfortunately, not every
athlete who participated in the 2013 CrossFit® Games had a short biography with their
benchmarks listed.
Procedures
The fitness benchmarks were divided into aerobic (5 k run and max pull-ups) or
anaerobic (all others) categories. For each group, the number of tests they performed highest
in (vs. the other groups) was depicted as a percent. Since data were collected from a public and
freely accessible internet source, IRB approve was not required. All of the data listed were in
the English system on the CrossFit® Games website (5), so height was converted from feet and
inches to centimeters to the nearest hundredth and pounds was converted to kilograms to the
nearest hundredth. Times reported were in hours, minutes and seconds and were converted to
seconds to the nearest tenth. Data were then entered into statistical software.
Statistical Analysis

56
To perform comparisons between groups, one way ANOVAs and independent T-Test
comparisons were done via IBM SPSS Statistics 21. As multiple comparisons were being made
using the same groups, the experimentwise error rate was increased. In order to account for
this, alpha will be significant at p ≤ 0.007 (0.005 ÷ 7) but an upper limit of alpha will be listed as
p ≤ 0.30. It should therefore be kept in mind that this was exploratory research, as a
performance profile involving participants from the 2013 CrossFit® Games was the first of its
kind. In addition, very little research had been conducted on CrossFit® participants in general
especially when it came to physiological or performance profiles.
Bivariate and partial correlations (Tables 39 and 40, respectively) were run to determine
if the groupings (T10, M10 and B10) alter the relationship among the benchmark variables. The
grouping should not be considered when it comes to relationships between clean and jerk verse
snatch, clean and jerk verse back squat, clean and jerk verse 400 m sprint, clean and jerk verse
5 k run, snatch verse max pull-ups, snatch verse 400 m sprint, snatch verse 5 k run, deadlift
verse max pull-ups, deadlift verse 5 k run, back squat verse max pull-up, 400 m sprint verse 5 k
run. This was because the r values did not differ by at least 0.10 when comparing a bivariate
correlation and a partial correlation controlling for the grouping. The groupings should be
considered when it comes to relationships between clean and jerk verse deadlift, clean and jerk
verse max pull-ups, snatch verse deadlift, snatch verse back squat, deadlift verse back squat,
deadlift verse 400 m sprint, back squat verse 400 m sprint, back squat verse 5 k run, max pull-
ups verse 400 m sprint, max pull-up verse 5 k run, as the r values differed by 0.10 when
comparing a bivariate correlation and a partial correlation controlling for the grouping.

57
RESULTS
Multiple one-way ANOVAs were used for these variables: snatch, deadlift, back squat,
400 m sprint, 5 k run and maximum number of pull-ups. As the skewedness for each variable
was below 2.58, a normal distribution can be assumed. When using the Levene Statistic (p ≤
0.05), the significance was p > 0.05 for each of these variables so a homogeneity of variance can
be assumed. The mean for the snatch was 120.50 kg with a standard deviation of 8.70 kg (n =
24). The mean for the deadlift was 231.08 kg with a standard deviation of 13.04 kg (n = 22). The
mean for the back squat was 199.60 kg with a standard deviation of 15.33 kg (n = 23). The
mean for the maximum number of pull-ups was 57.22 pull-ups with a standard deviation of
11.27 pull-ups (n = 18). The mean for the 400 m sprint was 58.19 s with a standard deviation of
5.59 s (n = 16). The mean for the 5 k run was 1206.63 s with a standard deviation of 93.34 s (n =
24).
Using a one-way ANOVA (p ≤ 0.007), for the maximum number of pull-ups (n = 18) the
degrees of freedom between groups was 2 and within groups was 15. A significance was not
found as F (2, 15) = 4.32, p = 0.033, as seen in Table 41. Using a one-way ANOVA (p ≤ 0.007), for
the snatch (n = 24) the degrees of freedom between groups was 2 and within groups was 21. A
significance was not found as F (2, 21) = 3.324, p = 0.056, as seen in Table 42. Using a one-way
ANOVA (p ≤ 0.007), for the deadlift (n = 22) the degrees of freedom between groups was 2 and
within groups was 19. A significance was not found as F (2, 19) = 2.196, p = 0.139, as seen in
Table 43. Using a one-way ANOVA (p ≤ 0.007), for the back squat (n = 23) the degrees of
freedom between groups was 2 and within groups was 20. A significance was not found as F (2,

58
20) = 0.484, p = 0.623, as seen in Table 44. Using a one-way ANOVA (p ≤ 0.007), for the 400 m
sprint (n = 16) the degrees of freedom between groups was 2 and within groups was 13. A
significance was not found as F (2, 13) = 0.165, p = 0.850, as seen in Table 45. Using a one-way
ANOVA (p ≤ 0.007), for the 5 k run (n = 16) the degrees of freedom between groups was 2 and
within groups was 13. A significance was not found as F (2, 13) = 0.281, p = 0.760, as seen in
Table 46.
The clean & jerk had to be analyzed via independent T-Tests as the Levene Statistic (p ≤
0.05) was significant, p = 0.035 when using a one-way ANOVA. The skewedness was below 2.58,
so a normal distribution is assumed. The mean for the clean and jerk was 146.26 kg with a
standard deviation of 9.39 kg. Using an Independent T-Test (p ≤ 0.007) for comparing T10 and
M10, the Levene Statistic (p ≤ 0.05) was p = 0.398, so homogeneity of variance was assumed.
The degree of freedom was 15 and t(15) = 1.463, p = 0.164 was not significant with a mean
difference of 5.56 kg and a standard error of difference of 3.80, as seen in Table 47. Using an
Independent T-Test (p ≤ 0.007) for comparing T10 and B10, the Levene Statistic (p ≤ 0.05) was p
= 0.135, so homogeneity of variance was assumed. The degree of freedom was 11 and t(11) =
0.410, p = 0.690 was not significant with a mean difference of 2.62 kg and a standard error of
difference of 6.41, as seen in Table 48. Using an Independent T-Test (p ≤ 0.007) for comparing
M10 and B10, the Levene Statistic (p ≤ 0.05) was p = 0.006, so homogeneity of variance was not
assumed. The degree of freedom was 6.301 and t(6.301) = -0.499, p = 0.635 was not significant
with a mean difference of 2.93 kg and a standard error of difference of 5.88, as seen in Table
49.
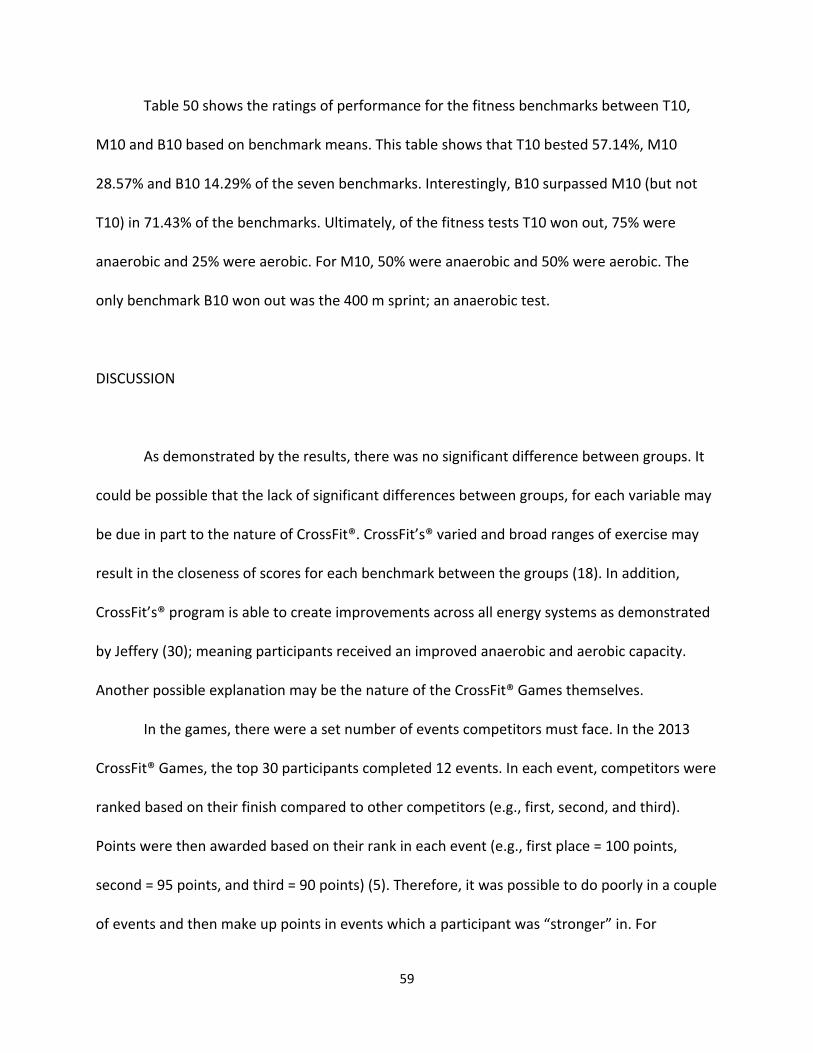
59
Table 50 shows the ratings of performance for the fitness benchmarks between T10,
M10 and B10 based on benchmark means. This table shows that T10 bested 57.14%, M10
28.57% and B10 14.29% of the seven benchmarks. Interestingly, B10 surpassed M10 (but not
T10) in 71.43% of the benchmarks. Ultimately, of the fitness tests T10 won out, 75% were
anaerobic and 25% were aerobic. For M10, 50% were anaerobic and 50% were aerobic. The
only benchmark B10 won out was the 400 m sprint; an anaerobic test.
DISCUSSION
As demonstrated by the results, there was no significant difference between groups. It
could be possible that the lack of significant differences between groups, for each variable may
be due in part to the nature of CrossFit®. CrossFit’s® varied and broad ranges of exercise may
result in the closeness of scores for each benchmark between the groups (18). In addition,
CrossFit’s® program is able to create improvements across all energy systems as demonstrated
by Jeffery (30); meaning participants received an improved anaerobic and aerobic capacity.
Another possible explanation may be the nature of the CrossFit® Games themselves.
In the games, there were a set number of events competitors must face. In the 2013
CrossFit® Games, the top 30 participants completed 12 events. In each event, competitors were
ranked based on their finish compared to other competitors (e.g., first, second, and third).
Points were then awarded based on their rank in each event (e.g., first place = 100 points,
second = 95 points, and third = 90 points) (5). Therefore, it was possible to do poorly in a couple
of events and then make up points in events which a participant was “stronger” in. For
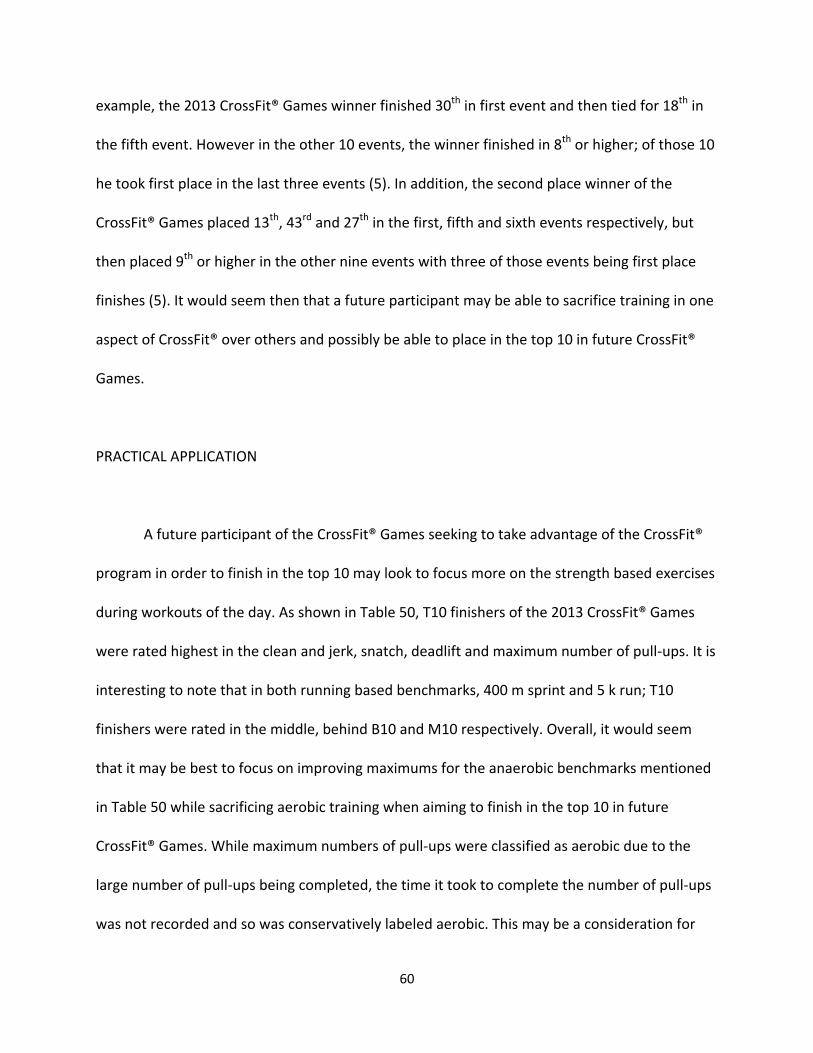
60
example, the 2013 CrossFit® Games winner finished 30th in first event and then tied for 18th in
the fifth event. However in the other 10 events, the winner finished in 8th or higher; of those 10
he took first place in the last three events (5). In addition, the second place winner of the
CrossFit® Games placed 13th, 43rd and 27th in the first, fifth and sixth events respectively, but
then placed 9th or higher in the other nine events with three of those events being first place
finishes (5). It would seem then that a future participant may be able to sacrifice training in one
aspect of CrossFit® over others and possibly be able to place in the top 10 in future CrossFit®
Games.
PRACTICAL APPLICATION
A future participant of the CrossFit® Games seeking to take advantage of the CrossFit®
program in order to finish in the top 10 may look to focus more on the strength based exercises
during workouts of the day. As shown in Table 50, T10 finishers of the 2013 CrossFit® Games
were rated highest in the clean and jerk, snatch, deadlift and maximum number of pull-ups. It is
interesting to note that in both running based benchmarks, 400 m sprint and 5 k run; T10
finishers were rated in the middle, behind B10 and M10 respectively. Overall, it would seem
that it may be best to focus on improving maximums for the anaerobic benchmarks mentioned
in Table 50 while sacrificing aerobic training when aiming to finish in the top 10 in future
CrossFit® Games. While maximum numbers of pull-ups were classified as aerobic due to the
large number of pull-ups being completed, the time it took to complete the number of pull-ups
was not recorded and so was conservatively labeled aerobic. This may be a consideration for

61
future research as CrossFit® tends to use more of a faster, kipping pull-up versus a slower,
stricter pull-up (22).
Other considerations may be to determine what is holding B10 finishers back from
finishing M10 when B10 was rated ahead of M10 in 71.43% of the traditional fitness
benchmarks. In addition, how M10 was still beating out B10 in the 2013 CrossFit® Games when
they are rated lower than B10 in majority of the benchmarks. There may be some other
variable(s) at work such as time to fatigue or time to recover. Lastly, to perform a similar
experimental design described using the 2013 female CrossFit® Games competitors.

62
APPENDIX B
TABLES AND FIGURES
Table 1: Descriptive statistics on the CrossFit® and ACSM groups for age, height, weight, the
number of weeks completed in the respective exercise program, the average RPE and the
perceived number of hard days performed in a week. (pg. 5)
CrossFit® group n = 101 ACSM group n = 56
Exercise Program Mean Standard Deviation
Age CrossFit® 34.50 8.74
ACSM 35.41 10.15
Weight CrossFit® 79.10 15.83
ACSM 75.19 27.25
Height CrossFit® 1.74 0.10
ACSM 1.71 0.11
Weeks Completed in Program
CrossFit® 7.81 0.85
ACSM 6.38 2.50
Ave. RPE CrossFit® 7.29 1.74
ACSM 5.52 1.35
Hard Days Performed in a
Week
CrossFit® 3.99 1.07
ACSM 3.55 1.39

63
Table 2: Independent t-test comparing weeks completed in the respective exercise program,
average RPE for the program and the number of hard days completed in a week for the
Crossfit® and ACSM groups. (pg. 7)
Levene’s Test for Equality of Variances
t-test for Equality of Means
F Sig. t df Sig. (2-
tailed)
Mean Difference
Std. Error Difference
Weeks Completed
in Program
Equal variances assumed
147.764 <0.001 5.27 155 <0.001 1.44 0.27
Equal variances
not assumed
4.18 62.07 <0.001 1.44 0.34
Ave. RPE
Equal variances assumed
5.888 0.016 6.59 155 <0.001 1.77 0.29
Equal variances
not assumed
7.08 138.50 <0.001 1.77 0.25
Number of Hard Days in a Week
Equal variances assumed
8.211 0.005 2.20 155 0.030 0.44 0.20
Equal variances
not assumed
2.04 91.93 0.044 0.44 0.21

64
Table 3: Chi-square analysis via crosstabulation about whether participants had prior exercise
experience before starting their current exercise program. (pg. 7)
Exercise Program
Total CrossFit ACSM
Prior Exercise Experience
Yes
Count 80 52 132
Expected Count
84.9 47.1 132.0
% within Prior Exer.
60.6% 39.4% 100.0%
% within Exer. Program
79.2% 92.9% 84.1%
% of Total 51.0% 33.1% 84.1%
No
Count 21 4 25
Expected Count
16.1 8.9 25.0
% within Prior Exer.
84.0% 16.0% 100.0%
% within Exer. Program
20.8% 7.1% 15.9%
% of Total 13.4% 2.5% 15.9%
Total
Count 101 56 157
Expected Count
101.0 56.0 157.0
% within Prior Exer.
64.3% 35.7% 100.0%
% within Exer. Program
100.0% 100.0% 100.0%
% of Total 64.3% 35.7% 100.0%
Chi-square Test
Value df Asymp. Sig.
(2-sided)
Pearson Chi-square
5.013 1 0.025
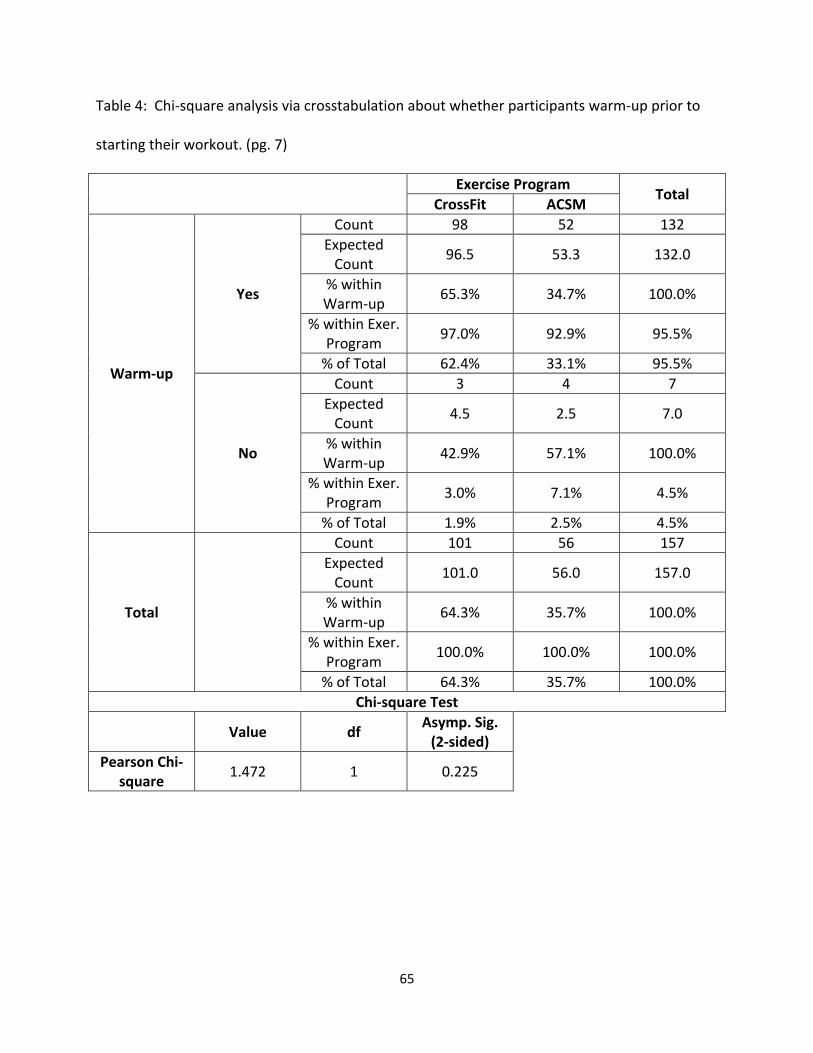
65
Table 4: Chi-square analysis via crosstabulation about whether participants warm-up prior to
starting their workout. (pg. 7)
Exercise Program
Total CrossFit ACSM
Warm-up
Yes
Count 98 52 132
Expected Count
96.5 53.3 132.0
% within Warm-up
65.3% 34.7% 100.0%
% within Exer. Program
97.0% 92.9% 95.5%
% of Total 62.4% 33.1% 95.5%
No
Count 3 4 7
Expected Count
4.5 2.5 7.0
% within Warm-up
42.9% 57.1% 100.0%
% within Exer. Program
3.0% 7.1% 4.5%
% of Total 1.9% 2.5% 4.5%
Total
Count 101 56 157
Expected Count
101.0 56.0 157.0
% within Warm-up
64.3% 35.7% 100.0%
% within Exer. Program
100.0% 100.0% 100.0%
% of Total 64.3% 35.7% 100.0%
Chi-square Test
Value df Asymp. Sig.
(2-sided)
Pearson Chi-square
1.472 1 0.225

66
Table 5: Chi-square analysis via crosstabulation whether aspirin was regularly taken by
participants in their respective exercise program. (pg. 7)
Exercise Program
Total CrossFit ACSM
Aspirin
Yes
Count 12 4 16
Expected Count
10.3 5.7 16.0
% within Aspirin
75.0% 25.0% 100.0%
% within Exer. Program
11.9% 7.1% 10.2%
% of Total 7.6% 2.5% 10.2%
No
Count 89 52 141
Expected Count
90.7 50.3 141.0
% within Aspirin
63.1% 36.9% 100.0%
% within Exer. Program
88.1% 92.9% 89.8%
% of Total 56.7% 33.1% 89.8%
Total
Count 101 56 157
Expected Count
101.0 56.0 157.0
% within Aspirin
64.3% 35.7% 100.0%
% within Exer. Program
100.0% 100.0% 100.0%
% of Total 64.3% 35.7% 100.0%
Chi-square Test
Value df Asymp. Sig.
(2-sided)
Pearson Chi-square
0.884 1 0.347

67
Table 6: Chi-square analysis via crosstabulation whether anti-cholinergic agents were regularly
taken by participants in their respective exercise program. (pg. 7)
Exercise Program
Total CrossFit ACSM
Anti-Cholinergic
Agents
Yes
Count 0 1 1
Expected Count
0.6 0.4 1.0
% within Anti-Cholinergic
Agents 0.0% 100% 100%
% within Exer. Program
0.0% 1.8% 0.6%
% of Total 0.0% 0.6% 0.6%
No
Count 101 55 156
Expected Count
100.4 55.6 156.0
% within Anti-Cholinergic
Agents 64.7% 35.3% 100.0%
% within Exer. Program
100.0% 98.2% 99.4%
% of Total 64.3% 35.0% 99.4%
Total
Count 101 56 157
Expected Count
101.0 56.0 157.0
% within Anti-Cholinergic
Agents 64.3% 35.7% 100.0%
% within Exer. Program
100.0% 100.0% 100.0%
% of Total 64.3% 35.7% 100.0%
Chi-square Test
Value df Asymp. Sig.
(2-sided)
Pearson Chi-square
1.815 1 0.178

68
Table 7: Chi-square analysis via crosstabulation whether statins were regularly taken by
participants in their respective exercise program. (pg. 7)
Exercise Program
Total CrossFit ACSM
Statins
Yes
Count 0 2 2
Expected Count
1.3 0.7 2.0
% within Statins
0.0% 100% 100%
% within Exer. Program
0.0% 1.8% 0.6%
% of Total 0.0% 0.6% 0.6%
No
Count 101 54 155
Expected Count
99.7 55.3 155.0
% within Statins
65.2% 34.8% 100.0%
% within Exer. Program
100.0% 96.4% 98.7%
% of Total 64.3% 34.4% 98.7%
Total
Count 101 56 157
Expected Count
101.0 56.0 157.0
% within Statins
64.3% 35.7% 100.0%
% within Exer. Program
100.0% 100.0% 100.0%
% of Total 64.3% 35.7% 100.0%
Chi-square Test
Value df Asymp. Sig.
(2-sided)
Pearson Chi-square
3.654 1 0.056

69
Table 8: Chi-square analysis via crosstabulation whether other medications were regularly
taken by participants in their respective exercise program. (pg. 7)
Exercise Program
Total CrossFit ACSM
Other Medications
Yes
Count 3 5 8
Expected Count
5.1 2.9 8.0
% within Other
37.5% 62.5% 100.0%
% within Exer. Program
3.0% 8.9% 5.1%
% of Total 1.9% 3.2% 5.1%
No
Count 98 51 149
Expected Count
95.9 53.1 149.0
% within Other
65.8% 34.2% 100.0%
% within Exer. Program
97.0% 91.1% 94.9%
% of Total 62.4% 32.5% 94.9%
Total
Count 101 56 157
Expected Count
101.0 56.0 157.0
% within Other
64.3% 35.7% 100.0%
% within Exer. Program
100.0% 100.0% 100.0%
% of Total 64.3% 35.7% 100.0%
Chi-square Test
Value df Asymp. Sig.
(2-sided)
Pearson Chi-square
2.645 1 0.104

70
Table 9: Chi-square analysis via crosstabulation as to whether participants had been diagnosed
with dehydration while attending their respected exercise program. (pg. 7)
Exercise Program
Total CrossFit ACSM
Dehydration
Yes
Count 2 0 2
Expected Count
1.3 0.7 2.0
% within Dehydration
100.0% 0.0% 100.0%
% within Exer. Program
2.0% 0.0% 1.3%
% of Total 1.3% 0.0% 1.3%
No
Count 99 56 155
Expected Count
99.7 55.3 155.0
% within Dehydration
63.9% 36.1% 100.0%
% within Exer. Program
98.0% 100.0% 98.7%
% of Total 63.1% 35.7% 98.7%
Total
Count 101 56 157
Expected Count
101.0 56.0 157.0
% within Dehydration
64.3% 35.7% 100.0%
% within Exer. Program
100.0% 100.0% 100.0%
% of Total 64.3% 35.7% 100.0%
Chi-square Test
Value df Asymp. Sig.
(2-sided)
Pearson Chi-square
1.123 1 0.289

71
Table 10: Chi-square analysis via crosstabulation as to whether participants had been
diagnosed with fatigue while attending their respected exercise program. (pg. 7)
Exercise Program
Total CrossFit ACSM
Fatigue
Yes
Count 0 2 2
Expected Count
1.3 0.7 2.0
% within Fatigue
0.0% 100.0% 100.0%
% within Exer. Program
0.0% 3.6% 1.3%
% of Total 0.0% 1.3% 1.3%
No
Count 101 54 155
Expected Count
99.7 55.3 155.0
% within Fatigue
65.2% 34.8% 100.0%
% within Exer. Program
100.0% 96.4% 98.7%
% of Total 64.3% 34.4% 98.7%
Total
Count 101 56 157
Expected Count
101.0 56.0 157.0
% within Fatigue
64.3% 35.7% 100.0%
% within Exer. Program
100.0% 100.0% 100.0%
% of Total 64.3% 35.7% 100.0%
Chi-square Test
Value df Asymp. Sig.
(2-sided)
Pearson Chi-square
3.654 1 0.056

72
Table 11: Chi-square analysis via crosstabulation as to whether participants had been
diagnosed with delayed onset muscle soreness (DOMS) while attending their respected exercise
program. (pg. 7)
Exercise Program
Total CrossFit ACSM
Delayed Onset
Muscles Soreness
Yes
Count 3 1 4
Expected Count
2.6 1.4 4.0
% within DOMS
75.0% 25.0% 100.0%
% within Exer. Program
3.0% 1.8% 2.5%
% of Total 1.9% 0.6% 2.5%
No
Count 98 55 153
Expected Count
98.4 54.6 153.0
% within DOMS
64.1% 35.9% 100.0%
% within Exer. Program
97.0% 98.2% 97.5%
% of Total 62.4% 35.0% 97.5%
Total
Count 101 56 157
Expected Count
101.0 56.0 157.0
% within DOMS
64.3% 35.7% 100.0%
% within Exer. Program
100.0% 100.0% 100.0%
% of Total 64.3% 35.7% 100.0%
Chi-square Test
Value df Asymp. Sig.
(2-sided)
Pearson Chi-square
0.204 1 0.652

73
Table 12: Chi-square analysis via crosstabulation as to whether participants had been
diagnosed with overexertion injury while attending their respected exercise program. (pg. 7)
Exercise Program
Total CrossFit ACSM
Overexertion Injury
Yes
Count 4 3 7
Expected Count
4.5 2.5 7.0
% within Overexertion
Injury 57.1% 42.9% 100.0%
% within Exer. Program
4.0% 5.4% 4.5%
% of Total 2.5% 1.9% 4.5%
No
Count 97 53 150
Expected Count
96.5 53.5 150.0
% within Overexertion
Injury 64.7% 35.3% 100.0%
% within Exer. Program
96.0% 94.6% 95.5%
% of Total 61.8% 33.8% 95.5%
Total
Count 101 56 157
Expected Count
101.0 56.0 157.0
% within Overexertion
Injury 64.3% 35.7% 100.0%
% within Exer. Program
100.0% 100.0% 100.0%
% of Total 64.3% 35.7% 100.0%
Chi-square Test
Value df Asymp. Sig.
(2-sided)
Pearson Chi-square
0.165 1 0.685

74
Table 13: Chi-square analysis via crosstabulation as to whether participants had been
diagnosed with other medical conditions while attending their respected exercise program. (pg.
7)
Exercise Program
Total CrossFit ACSM
Other Conditions
Yes
Count 3 3 6
Expected Count
3.9 2.1 6.0
% within Other
Conditions 50.0% 50.0% 100.0%
% within Exer. Program
3.0% 5.4% 3.8%
% of Total 1.9% 1.9% 3.8%
No
Count 98 53 151
Expected Count
97.1 53.9 151.0
% within Other
Conditions 64.9% 35.1% 100.0%
% within Exer. Program
97.0% 94.6% 96.2%
% of Total 62.4% 33.8% 96.2%
Total
Count 101 56 157
Expected Count
101.0 56.0 157.0
% within Other
Conditions 64.3% 35.7% 100.0%
% within Exer. Program
100.0% 100.0% 100.0%
% of Total 64.3% 35.7% 100.0%
Chi-square Test
Value df Asymp. Sig.
(2-sided)
Pearson Chi-square
0.558 1 0.455

75
Table 14: Chi-square analysis via crosstabulation as to whether participants had experienced
excessive fatigue within 48-hours of completing a workout. (pg. 7)
Exercise Program
Total CrossFit ACSM
Excessive Fatigue
Yes
Count 42 8 50
Expected Count
32.2 17.8 50.0
% within Excessive Fatigue
84.0% 16.0% 100.0%
% within Exer. Program
41.6% 14.3% 31.8%
% of Total 26.8% 5.1% 31.8%
No
Count 59 48 107
Expected Count
68.8 38.2 107.0
% within Excessive Fatigue
55.1% 44.9% 100.0%
% within Exer. Program
58.4% 85.7% 68.2%
% of Total 37.6% 30.6% 68.2%
Total
Count 101 56 157
Expected Count
101.0 56.0 157.0
% within Excessive Fatigue
64.3% 35.7% 100.0%
% within Exer. Program
100.0% 100.0% 100.0%
% of Total 64.3% 35.7% 100.0%
Chi-square Test
Value df Asymp. Sig.
(2-sided)
Pearson Chi-square
12.369 1 <0.001

76
Table 15: Chi-square analysis via crosstabulation as to whether participants had experienced
muscle soreness within 48-hours of completing a workout. (pg. 7)
Exercise Program
Total CrossFit ACSM
Muscle Soreness
Yes
Count 96 48 144
Expected Count
92.6 51.4 144.0
% within Muscle
Soreness 66.7% 33.3% 100.0%
% within Exer. Program
95.0% 85.7% 91.7%
% of Total 61.1% 30.6% 91.7%
No
Count 5 8 13
Expected Count
8.4 4.6 13.0
% within Muscle
Soreness 38.5% 61.5% 100.0%
% within Exer. Program
5.0% 14.3% 8.3%
% of Total 3.2% 5.1% 8.3%
Total
Count 101 56 157
Expected Count
101.0 56.0 157.0
% within Muscle
Soreness 64.3% 35.7% 100.0%
% within Exer. Program
100.0% 100.0% 100.0%
% of Total 64.3% 35.7% 100.0%
Chi-square Test
Value df Asymp. Sig.
(2-sided)
Pearson Chi-square
4.134 1 0.042

77
Table 16: Chi-square analysis via crosstabulation as to whether participants had experienced
muscle swelling within 48-hours of completing a workout. (pg. 7)
Exercise Program
Total CrossFit ACSM
Muscle Swelling
Yes
Count 19 4 23
Expected Count
14.8 8.2 23.0
% within Muscle Swelling
82.6% 17.4% 100.0%
% within Exer. Program
18.8% 7.1% 14.6%
% of Total 12.1% 2.5% 14.6%
No
Count 82 52 134
Expected Count
86.2 47.8 134.0
% within Muscle Swelling
61.2% 38.8% 100.0%
% within Exer. Program
81.2% 92.9% 85.4%
% of Total 52.2% 33.1% 85.4%
Total
Count 101 56 157
Expected Count
101.0 56.0 157.0
% within Muscle Swelling
64.3% 35.7% 100.0%
% within Exer. Program
100.0% 100.0% 100.0%
% of Total 64.3% 35.7% 100.0%
Chi-square Test
Value df Asymp. Sig.
(2-sided)
Pearson Chi-square
3.923 1 0.048

78
Table 17: Chi-square analysis via crosstabulation as to whether participants had experienced
shortness of breath (SOB) within 48-hours of completing a workout. (pg. 7)
Exercise Program
Total CrossFit ACSM
Shortness of Breath
Yes
Count 13 1 14
Expected Count
9.0 5.0 14.0
% within SOB 92.9% 7.1% 100.0%
% within Exer. Program
12.9% 1.8% 8.9%
% of Total 8.3% 0.6% 8.9%
No
Count 88 55 143
Expected Count
92.0 51.0 143.0
% within SOB 61.5% 38.5% 100.0%
% within Exer. Program
87.1% 98.2% 91.1%
% of Total 56.1% 35.0% 91.1%
Total
Count 101 56 157
Expected Count
101.0 56.0 157.0
% within SOB 64.3% 35.7% 100.0%
% within Exer. Program
100.0% 100.0% 100.0%
% of Total 64.3% 35.7% 100.0%
Chi-square Test
Value df Asymp. Sig.
(2-sided)
Pearson Chi-square
5.451 1 0.020

79
Table 18: Chi-square analysis via crosstabulation as to whether participants had experienced
muscle weakness within 48-hours of completing a workout. (pg. 7)
Exercise Program
Total CrossFit ACSM
Muscle Weakness
Yes
Count 31 12 43
Expected Count
27.7 15.3 43.0
% within Muscle
Weakness 72.1% 27.9% 100.0%
% within Exer. Program
30.7% 21.4% 27.4%
% of Total 19.7% 7.6% 27.4%
No
Count 70 44 114
Expected Count
73.3 40.7 114.0
% within Muscle
Weakness 61.4% 38.6% 100.0%
% within Exer. Program
69.3% 78.6% 72.6%
% of Total 44.6% 28.0% 72.6%
Total
Count 101 56 157
Expected Count
101.0 56.0 157.0
% within Muscle
Weakness 64.3% 35.7% 100.0%
% within Exer. Program
100.0% 100.0% 100.0%
% of Total 64.3% 35.7% 100.0%
Chi-square Test
Value df Asymp. Sig.
(2-sided)
Pearson Chi-square
1.555 1 0.212
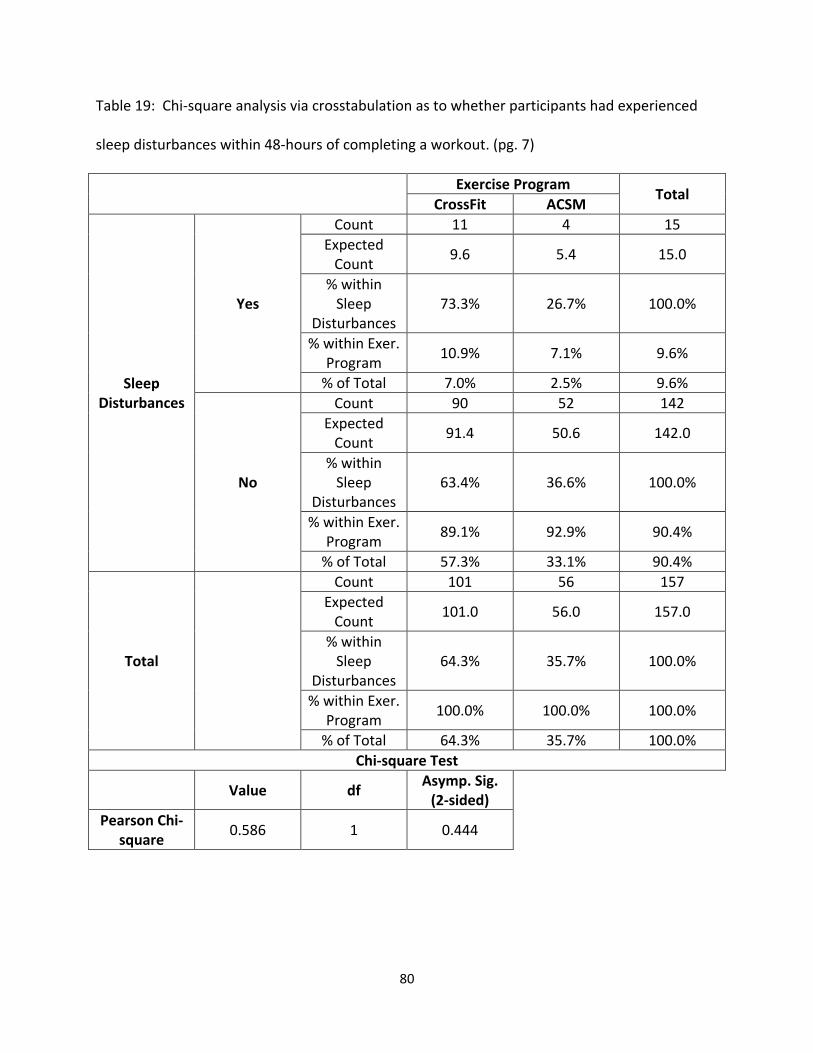
80
Table 19: Chi-square analysis via crosstabulation as to whether participants had experienced
sleep disturbances within 48-hours of completing a workout. (pg. 7)
Exercise Program
Total CrossFit ACSM
Sleep Disturbances
Yes
Count 11 4 15
Expected Count
9.6 5.4 15.0
% within Sleep
Disturbances 73.3% 26.7% 100.0%
% within Exer. Program
10.9% 7.1% 9.6%
% of Total 7.0% 2.5% 9.6%
No
Count 90 52 142
Expected Count
91.4 50.6 142.0
% within Sleep
Disturbances 63.4% 36.6% 100.0%
% within Exer. Program
89.1% 92.9% 90.4%
% of Total 57.3% 33.1% 90.4%
Total
Count 101 56 157
Expected Count
101.0 56.0 157.0
% within Sleep
Disturbances 64.3% 35.7% 100.0%
% within Exer. Program
100.0% 100.0% 100.0%
% of Total 64.3% 35.7% 100.0%
Chi-square Test
Value df Asymp. Sig.
(2-sided)
Pearson Chi-square
0.586 1 0.444

81
Table 20: Chi-square analysis via crosstabulation as to whether participants had experienced
muscle pain to light tight (MPLT) within 48-hours of completing a workout. (pg. 7)
Exercise Program
Total CrossFit ACSM
Muscle Pain to Light Touch
Yes
Count 31 4 35
Expected Count
22.5 12.5 35.0
% within MPLT
88.6% 11.4% 100.0%
% within Exer. Program
30.7% 7.1% 22.3%
% of Total 19.7% 2.5% 22.3%
No
Count 70 52 122
Expected Count
78.5 43.5 122.0
% within MPLT
57.4% 42.6% 100.0%
% within Exer. Program
69.3% 92.9% 77.7%
% of Total 44.6% 33.1% 77.7%
Total
Count 101 56 157
Expected Count
101.0 56.0 157.0
% within MPLT
64.3% 35.7% 100.0%
% within Exer. Program
100.0% 100.0% 100.0%
% of Total 64.3% 35.7% 100.0%
Chi-square Test
Value df Asymp. Sig.
(2-sided)
Pearson Chi-square
11.534 1 0.001
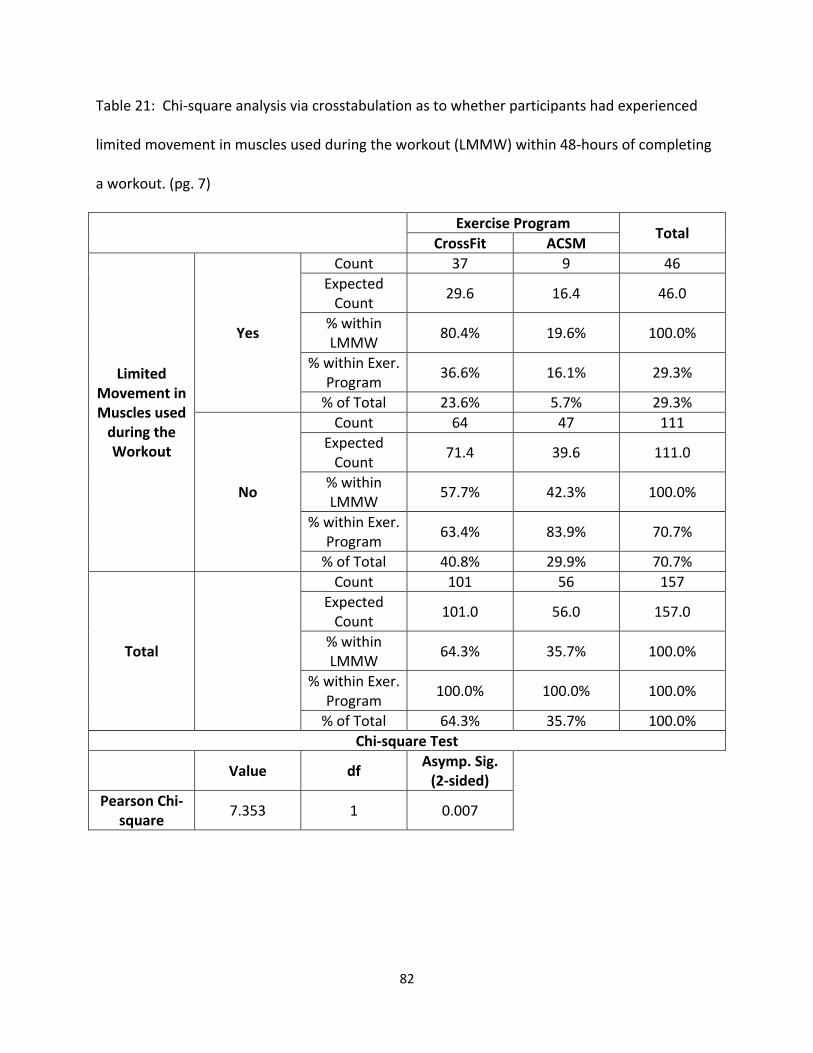
82
Table 21: Chi-square analysis via crosstabulation as to whether participants had experienced
limited movement in muscles used during the workout (LMMW) within 48-hours of completing
a workout. (pg. 7)
Exercise Program
Total CrossFit ACSM
Limited Movement in Muscles used
during the Workout
Yes
Count 37 9 46
Expected Count
29.6 16.4 46.0
% within LMMW
80.4% 19.6% 100.0%
% within Exer. Program
36.6% 16.1% 29.3%
% of Total 23.6% 5.7% 29.3%
No
Count 64 47 111
Expected Count
71.4 39.6 111.0
% within LMMW
57.7% 42.3% 100.0%
% within Exer. Program
63.4% 83.9% 70.7%
% of Total 40.8% 29.9% 70.7%
Total
Count 101 56 157
Expected Count
101.0 56.0 157.0
% within LMMW
64.3% 35.7% 100.0%
% within Exer. Program
100.0% 100.0% 100.0%
% of Total 64.3% 35.7% 100.0%
Chi-square Test
Value df Asymp. Sig.
(2-sided)
Pearson Chi-square
7.353 1 0.007
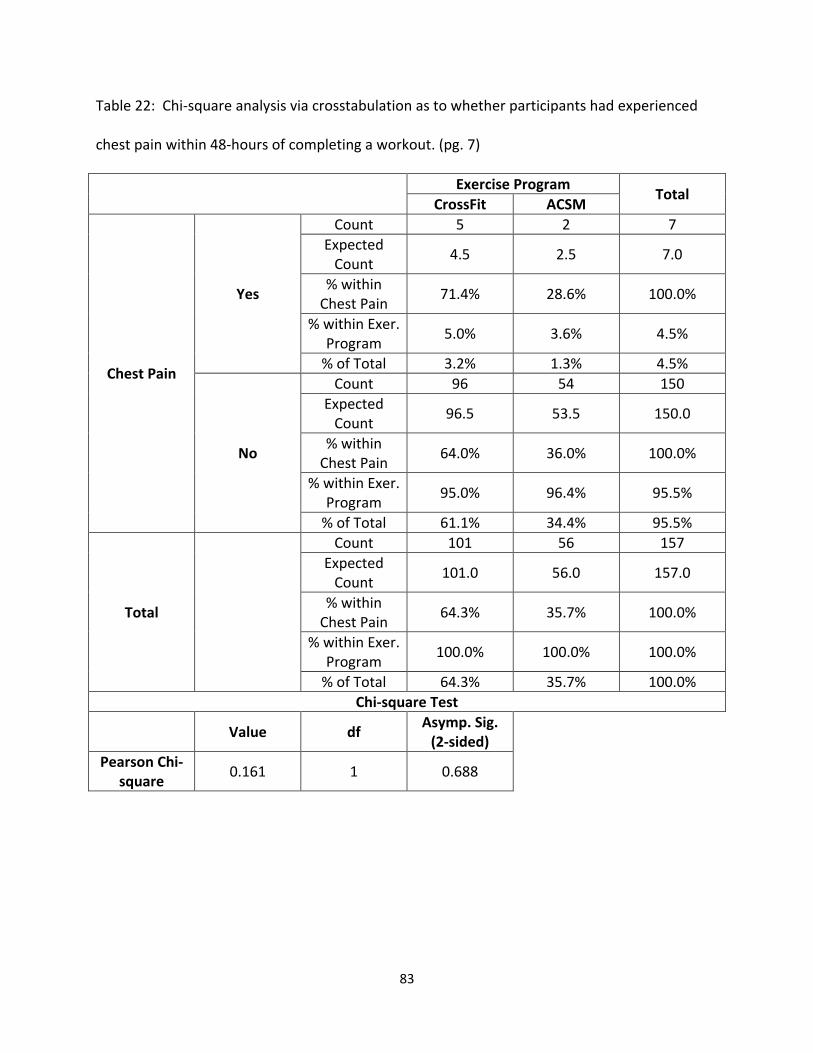
83
Table 22: Chi-square analysis via crosstabulation as to whether participants had experienced
chest pain within 48-hours of completing a workout. (pg. 7)
Exercise Program
Total CrossFit ACSM
Chest Pain
Yes
Count 5 2 7
Expected Count
4.5 2.5 7.0
% within Chest Pain
71.4% 28.6% 100.0%
% within Exer. Program
5.0% 3.6% 4.5%
% of Total 3.2% 1.3% 4.5%
No
Count 96 54 150
Expected Count
96.5 53.5 150.0
% within Chest Pain
64.0% 36.0% 100.0%
% within Exer. Program
95.0% 96.4% 95.5%
% of Total 61.1% 34.4% 95.5%
Total
Count 101 56 157
Expected Count
101.0 56.0 157.0
% within Chest Pain
64.3% 35.7% 100.0%
% within Exer. Program
100.0% 100.0% 100.0%
% of Total 64.3% 35.7% 100.0%
Chi-square Test
Value df Asymp. Sig.
(2-sided)
Pearson Chi-square
0.161 1 0.688

84
Table 23: Chi-square analysis via crosstabulation as to whether participants had experienced
cola-/tea-/brown-colored urine (CTBU) within 48-hours of completing a workout. (pg. 7)
Exercise Program
Total CrossFit ACSM
Cola-/Tea-/Brown-
colored Urine
Yes
Count 2 0 2
Expected Count
1.3 0.7 2.0
% within CTBU
100.0% 0.0% 100.0%
% within Exer. Program
2.0% 0.0% 1.3%
% of Total 1.3% 0.0% 1.3%
No
Count 99 56 155
Expected Count
99.7 55.3 155.0
% within CTBU
63.9% 36.1% 100.0%
% within Exer. Program
98.0% 100.0% 98.7%
% of Total 63.1% 35.7% 98.7%
Total
Count 101 56 157
Expected Count
101.0 56.0 157.0
% within CTBU
64.3% 35.7% 100.0%
% within Exer. Program
100.0% 100.0% 100.0%
% of Total 64.3% 35.7% 100.0%
Chi-square Test
Value df Asymp. Sig.
(2-sided)
Pearson Chi-square
1.123 1 0.289

85
Table 24: Chi-square analysis via crosstabulation as to whether participants had experienced
other symptoms within 48-hours of completing a workout. (pg. 7)
Exercise Program
Total CrossFit ACSM
Other Symptoms
Yes
Count 0 1 1
Expected Count
0.6 0.4 1.0
% within Other
Symptoms 0.0% 100.0% 100.0%
% within Exer. Program
0.0% 1.8% 0.6%
% of Total 0.0% 0.6% 0.6%
No
Count 101 55 156
Expected Count
100.4 55.6 156.0
% within Other
Symptoms 64.7% 35.3% 100.0%
% within Exer. Program
100.0% 98.2% 99.4%
% of Total 64.3% 35.0% 99.4%
Total
Count 101 56 157
Expected Count
101.0 56.0 157.0
% within Other
Symptoms 64.3% 35.7% 100.0%
% within Exer. Program
100.0% 100.0% 100.0%
% of Total 64.3% 35.7% 100.0%
Chi-square Test
Value df Asymp. Sig.
(2-sided)
Pearson Chi-square
1.815 1 0.178

86
Table 25: Chi-square analysis via crosstabulation as to whether participants sought medical
attention for symptoms they had experienced within 48-hours of completing a workout. (pg. 7)
Exercise Program
Total CrossFit ACSM
Medical Attention Required
Yes
Count 8 5 13
Expected Count
8.4 4.5 13.0
% within Medical
Attention 61.5% 38.5% 100.0%
% within Exer. Program
7.9% 8.9% 8.3%
% of Total 5.1% 3.2% 8.3%
No
Count 93 51 144
Expected Count
92.6 51.4 144.0
% within Medical
Attention 64.6% 35.4% 100.0%
% within Exer. Program
92.1% 91.1% 91.7%
% of Total 59.2% 32.5% 91.7%
Total
Count 101 56 157
Expected Count
101.0 56.0 157.0
% within Medical
Attention 64.3% 35.7% 100.0%
% within Exer. Program
100.0% 100.0% 100.0%
% of Total 64.3% 35.7% 100.0%
Chi-square Test
Value df Asymp. Sig.
(2-sided)
Pearson Chi-square
0.048 1 0.826

87
Table 26: Chi-square analysis via crosstabulation as to whether participants had been
diagnosed with myoglobinuria (MG), an indicator of ER. (pg. 7)
Exercise Program
Total CrossFit ACSM
Myoglobinuria
Yes
Count 1 1 2
Expected Count
1.3 0.7 2.0
% within MG 50.0% 50.0% 100.0%
% within Exer.
Program 1.0% 1.8% 1.3%
% of Total 0.6% 0.6% 1.3%
No
Count 100 55 155
Expected Count
99.7 55.3 155.0
% within MG 64.5% 35.5% 100.0%
% within Exer.
Program 99.0% 98.2% 98.7%
% of Total 63.7% 35.0% 98.7%
Total
Count 101 56 157
Expected Count
101.0 56.0 157.0
% within MG 64.3% 35.7% 100.0%
% within Exer.
Program 100.0% 100.0% 100.0%
% of Total 64.3% 35.7% 100.0%
Chi-square Test
Value df Asymp. Sig.
(2-sided)
Pearson Chi-square
0.181 1 0.670

88
Table 27: Chi-square analysis via crosstabulation as to whether participants had been
diagnosed with high serum creatine kinase (CK) levels, an indicator of ER. (pg. 7)
Exercise Program
Total CrossFit ACSM
High Serum Creatine
Kinase Levels
Yes
Count 2 1 3
Expected Count
1.9 1.1 3.0
% within CK Levels
66.7% 33.3% 100.0%
% within Exer. Program
2.0% 1.8% 1.9%
% of Total 1.3% 0.6% 1.9%
No
Count 99 55 154
Expected Count
99.1 54.9 154.0
% within CK Levels
64.3% 35.7% 100.0%
% within Exer. Program
98.0% 98.2% 98.1%
% of Total 63.1% 35.0% 98.1%
Total
Count 101 56 157
Expected Count
101.0 56.0 157.0
% within CK Levels
64.3% 35.7% 100.0%
% within Exer. Program
100.0% 100.0% 100.0%
% of Total 64.3% 35.7% 100.0%
Chi-square Test
Value df Asymp. Sig.
(2-sided)
Pearson Chi-square
0.007 1 0.932

89
Table 28: Chi-square analysis via crosstabulation as to whether participants had been
diagnosed with arrhythmia, a complication of ER. (pg. 7)
Exercise Program
Total CrossFit ACSM
Arrhythmia
Yes
Count 2 3 5
Expected Count
3.2 1.8 5.0
% within Arrhythmia
40.0% 60.0% 100.0%
% within Exer. Program
2.0% 5.4% 3.2%
% of Total 1.3% 1.9% 3.2%
No
Count 99 53 152
Expected Count
97.8 54.2 152.0
% within Arrhythmia
65.1% 34.9% 100.0%
% within Exer. Program
98.0% 94.5% 96.8%
% of Total 63.1% 33.8% 96.8%
Total
Count 101 56 157
Expected Count
101.0 56.0 157.0
% within Arrhythmia
64.3% 35.7% 100.0%
% within Exer. Program
100.0% 100.0% 100.0%
% of Total 64.3% 35.7% 100.0%
Chi-square Test
Value df Asymp. Sig.
(2-sided)
Pearson Chi-square
1.332 1 0.248

90
Table 29: Chi-square analysis via crosstabulation as to whether participants had been
diagnosed with hyperkalemia, a complication of ER. (pg. 7)
Exercise Program
Total CrossFit ACSM
Hyperkalemia
Yes
Count 1 0 1
Expected Count
0.6 0.4 1.0
% within Hyperkalemia
100.0% 0.0% 100.0%
% within Exer. Program
1.0% 0.0% 0.6%
% of Total 0.6% 0.0% 0.6%
No
Count 100 56 156
Expected Count
100.4 55.6 156.0
% within Hyperkalemia
64.1% 35.9% 100.0%
% within Exer. Program
99.0% 100.0% 99.4%
% of Total 63.7% 35.7% 99.4%
Total
Count 101 56 157
Expected Count
101.0 56.0 157.0
% within Hyperkalemia
64.3% 35.7% 100.0%
% within Exer. Program
100.0% 100.0% 100.0%
% of Total 64.3% 35.7% 100.0%
Chi-square Test
Value df Asymp. Sig.
(2-sided)
Pearson Chi-square
0.558 1 0.455

91
Table 30: Chi-square analysis via crosstabulation as to whether participants had been
diagnosed with muscle compartment syndrome (MSC), a complication of ER. (pg. 7)
Exercise Program
Total CrossFit ACSM
Muscle Compartment
Syndrome
Yes
Count 0 1 1
Expected Count
0.6 0.4 1.0
% within MCS 0.0% 100.0% 100.0%
% within Exer. Program
0.0% 1.8% 0.6%
% of Total 0.0% 0.6% 0.6%
No
Count 101 55 156
Expected Count
100.4 55.6 156.0
% within MCS 64.7% 35.3% 100.0%
% within Exer. Program
100.0% 98.2% 99.4%
% of Total 64.3% 35.0% 99.4%
Total
Count 101 56 157
Expected Count
101.0 56.0 157.0
% within MCS 64.3% 35.7% 100.0%
% within Exer. Program
100.0% 100.0% 100.0%
% of Total 64.3% 35.7% 100.0%
Chi-square Test
Value df Asymp. Sig.
(2-sided)
Pearson Chi-square
1.815 1 0.178

92
Table 31: Chi-square analysis via crosstabulation as to whether participants had been
diagnosed with any other medical conditions. (pg. 7)
Exercise Program
Total CrossFit ACSM
Other
Yes
Count 0 1 1
Expected Count
0.6 0.4 1.0
% within Other
0.0% 100.0% 100.0%
% within Exer. Program
0.0% 1.8% 0.6%
% of Total 0.0% 0.6% 0.6%
No
Count 101 55 156
Expected Count
100.4 55.6 156.0
% within Other
64.7% 35.3% 100.0%
% within Exer. Program
100.0% 98.2% 99.4%
% of Total 64.3% 35.0% 99.4%
Total
Count 101 56 157
Expected Count
101.0 56.0 157.0
% within Other
64.3% 35.7% 100.0%
% within Exer. Program
100.0% 100.0% 100.0%
% of Total 64.3% 35.7% 100.0%
Chi-square Test
Value Df Asymp. Sig.
(2-sided)
Pearson Chi-square
1.815 1 0.178

93
Table 32: Chi-square analysis via crosstabulation as to whether participants had to stay
overnight at a hospital due to medical conditions related to ER. (pg. 7)
Exercise Program
Total CrossFit ACSM
Stay Overnight at
a Hospital
Yes
Count 1 2 3
Expected Count
1.9 1.1 3.0
% within Stay Overnight
33.3% 66.7% 100.0%
% within Exer. Program
1.0% 3.6% 1.9%
% of Total 0.6% 1.3% 1.9%
No
Count 100 54 154
Expected Count
99.1 54.9 154.0
% within Stay Overnight
64.9% 35.1% 100.0%
% within Exer. Program
99.0% 96.4% 98.1%
% of Total 63.7% 34.4% 98.1%
Total
Count 101 56 157
Expected Count
101.0 56.0 157.0
% within Stay Overnight
64.3% 35.7% 100.0%
% within Exer. Program
100.0% 100.0% 100.0%
% of Total 64.3% 35.7% 100.0%
Chi-square Test
Value df Asymp. Sig.
(2-sided)
Pearson Chi-square
1.281 1 0.258

94
Table 33: Chi-square analysis via crosstabulation as to whether participants had been
diagnosed with ER. (pg. 7)
Exercise Program
Total CrossFit ACSM
Diagnosed with ER
Yes
Count 1 0 1
Expected Count
0.6 0.4 1.0
% within Diagnosed
with ER 100.0% 0.0% 100.0%
% within Exer. Program
1.0% 0.0% 0.6%
% of Total 0.6% 0.0% 0.6%
No
Count 100 56 156
Expected Count
100.4 55.6 156.0
% within Diagnosed
with ER 64.1% 35.9% 100.0%
% within Exer. Program
99.0% 100.0% 99.4%
% of Total 63.7% 35.7% 99.4%
Total
Count 101 56 157
Expected Count
101.0 56.0 157.0
% within Diagnosed
with ER 64.3% 35.7% 100.0%
% within Exer. Program
100.0% 100.0% 100.0%
% of Total 64.3% 35.7% 100.0%
Chi-square Test
Value df Asymp. Sig.
(2-sided)
Pearson Chi-square
0.558 1 0.455

95
Table 34: The frequency of workouts of the day (WODs) as reported by the CrossFit® group.
(pg. 10)
WODs Frequency Percent (%) WODs Frequency Percent (%)
JT 2 0.9 Hotshots 1 0.5
Nancy 3 1.4 Griff 1 0.5
Fight Gone Bad 10 4.7 Manion 1 0.5
Fran 47 22.3 Barbara 3 1.4
Kelly 2 0.9 King Kong 4 1.9
Karen 6 2.8 Mondays 1 0.5
DT 5 2.4 The Sevens 5 2.4
Elizabeth 7 3.3 Glen 1 0.5
Helen 9 4.3 Deck of Cards
1 0.5
Cindy 7 3.3 Blake 1 0.5
2008 1 0.5 Barbell Hell 1 0.5
Kalsu 6 2.8 Roy 2 0.9
Tears of the Spider Monkey
1 0.5 Annie 5 2.4
Murph 27 12.8 Mr. Joshua 1 0.5
Chelsea 1 0.5 13.1 3 1.4
Linda 1 0.5 Ship 1 0.5
Diane 8 3.8 Nutts 1 0.5
Angie 3 1.4 Jackie 2 0.9
Lumber Jack 20 2 0.9 Arnie 1 0.5
FYF 1 0.5 Bull 1 0.5
Grace 6 2.8 Tommy V 1 0.5
Filthy 50 9 4.3 Gallant 1 0.5
Eva 8 3.8
TOTAL 211 100.0

96
Table 35: The Borg Category Ratings Scale (Ratings of Perceived Exertion Scale) as depicted by
Baechle and Earle (7). (pg. 13)
Category-ratio Scale
0 Noting at all
0.3
0.5 Extremely weak
1 Very weak
1.5
2 Weak
2.5
3 Moderate
4
5 Strong
6
7 Very Strong
8
9
10 Extremely strong
11
Absolute maximum *

97
Table 36: An example 16 day cycle from the CrossFit® program (19). (pg. 53)
Sixteen-day Cycle
1. Five rounds for time of: Deadlift 185 pounds 15 reps/10 handstand push-ups 2. Run 5K for time 3. How many rounds can you complete in 20 minutes of: 24” Box Jump X 25 reps/5 Muscle-ups? 4. Off 5. How many rounds can you complete in 15 minutes of: Hang squat clean 135 pounds 12 reps/15 Ring dips? 6. 5 sets of 50 Sit-ups on GHD 7. Five rounds for time of: 35 pound Dumbbell thrusters X 15 reps (front squat/push-press)/12 pull-ups 8. Off 9. Five rounds for time of: 60 pound two hand dumbbell swing X 21 reps/Glute-ham developer medicine ball throw sit-up with 12 pound ball X 15 10. One set of max rep pull-ups every 12 minutes or six sets. 11. How many rounds can you complete in 20 minutes of: Run 400 meters/Deadlift 225 pounds X 7 reps? 12. Off 13. Seven rounds for time of: Front squat bodyweight 10 reps/30 feet of rope climb 14. Snatch nine sets 3-3-2-2-2-1-1-1-1 15. How many rounds can you complete in 20 minutes of: Bench press 135 pounds 10 reps/12 “L” Pull-ups? 16. Off

98
Table 37: Descriptive data for each participant of the 2013 CrossFit® Games and the strength
based traditional fitness benchmarks (4). (pg. 55)
Competitors’ Finished
Rank
Age (years)
Height (cm)
Weight (kg)
Clean and Jerk (kg)
Snatch (kg)
Deadlift (kg)
Back Squat (kg)
Maximum Number
of Pull-ups
1 26 175.26 88.45 167.83 136.08 247.21 201.85 75
2 28 175.26 95.25 151.95 120.20 249.48 204.12 50
3 23 180.34 86.18 145.15 129.27 244.94 204.12 76
4 25 175.26 86.18 - - - - -
5 22 187.96 95.25 147.42 127.01 229.06 192.78 65
6 24 177.80 89.81 151.95 120.20 226.80 181.44 63
7 30 165.10 74.84 - - - - -
8 29 170.18 81.65 138.35 120.02 244.94 183.71 -
9 35 177.80 92.99 142.88 133.36 229.06 206.39 60
10 24 185.42 97.52 - - - - -
11 31 185.42 102.06 150.00 130.00 220.00 200.00 45
12 23 177.80 86.18 142.88 111.13 226.80 183.71 50
13 25 180.34 95.25 147.42 120.20 233.60 210.92 -
14 28 180.34 88.45 145.15 117.93 242.67 188.24 53
15 26 174.00 85.00 130.00 100.00 200.00 180.00 30
16 26 170.18 81.65 138.35 115.67 222.26 210.92 56
17 27 182.88 94.35 145.15 120.20 233.60 210.92 60
18 22 - 86.18 140.61 113.40 233.60 195.05 -
19 24 170.18 83.91 151.05 125.65 - 222.26 -
20 31 172.72 83.91 147.42 111.13 219.99 230.43 52
21 35 177.80 95.25 154.68 124.74 247.21 197.31 50
22 26 172.72 86.18 - 115.67 247.21 226.80 -
23 26 185.42 92.99 154.22 129.27 - - -
24 29 177.80 81.65 129.27 108.86 215.46 174.63 50
25 26 174.00 85.00 - - - - -
26 24 - 87.09 129.27 110.22 213.19 179.17 62
27 27 195.58 99.79 - - - - -
28 25 172.72 81.65 156.49 127.01 227.70 204.12 62
29 28 175.26 89.81 156.49 124.74 229.06 201.85 71
30 29 178.00 89.00 - - - - -

99
Table 38: The running based fitness benchmarks for each participant of the 2013 CrossFit®
Games (4). (pg. 55)
Competitors’ Finished
Rank
Sprint 400m (s)
Run 5k (s)
1 - -
2 63 1400
3 58 1220
4 - -
5 55 1097
6 55 -
7 - -
8 47 1140
9 70 -
10 - -
11 60 1200
12 - 1190
13 - -
14 60 1140
15 67 1340
16 57 1140
17 60 1272
18 - 1083
19 - -
20 51 1151
21 60 1318
22 56 1285
23 - -
24 55 1115
25 - -
26 - 1215
27 - -
28 - -
29 57 -
30 - -

100
Table 39: Bivariate correlation factoring in the groupings of T10, M10 and B10 for the fitness
benchmarks. (pg. 56)

101
Table 40: Partial correlation when controlling for the groupings of T10, M10 and B10 for the
fitness benchmarks. (pg. 56)

102
Table 41: One-way ANOVA for maximum number of pull-ups (n = 18). (pg. 57)
Sum of Squares
df Mean Square F Sig.
Between Groups
788.563 2 394.282 4.315 0.033
Within Groups
1370.548 15 91.370
Total 2159.111 17

103
Table 42: One-way ANOVA for the snatch (n = 24). (pg. 57)
Sum of Squares
df Mean Square F Sig.
Between Groups
418.545 2 209.273 3.324 0.056
Within Groups
1322.159 21 62.960
Total 1740.705 23

104
Table 43: One-way ANOVA for the deadlift (n = 22). (pg. 57)
Sum of Squares
df Mean Square F Sig.
Between Groups
670.400 2 335.200 2.196 0.139
Within Groups
2900.121 19 152.638
Total 3570.521 21

105
Table 44: One-way ANOVA for the back squat (n = 23). (pg. 58)
Sum of Squares
df Mean Square F Sig.
Between Groups
238.431 2 119.215 0.484 0.623
Within Groups
4928.805 20 246.440
Total 5167.236 22

106
Table 45: One-way ANOVA for the 400 m sprint (n = 16). (pg. 58)
Sum of Squares
df Mean Square F Sig.
Between Groups
11.604 2 5.802 0.165 0.850
Within Groups
456.833 13 35.141
Total 468.438 15

107
Table 46: One-way ANOVA for the 5 k run (n = 16). (pg. 58)
Sum of Squares
df Mean Square F Sig.
Between Groups
5414.250 2 2707.125 0.281 0.760
Within Groups
125265.500 13 9635.808
Total 130679.750 15

108
Table 47: Independent T-Test for comparing T10 and M10 in the clean & jerk. (pg. 58)
Levene’s Test for Equality of Variances
t-test for Equality of Means
F Sig. t df Sig. (2-tailed)
Mean Difference
Std. Error Difference
95% Confidence Interval of the
Difference
Lower Upper
Clean & Jerk Equal variances assumed Equal variances not assumed
0.758 0.398
1.463 15 0.164 5.55843 3.79871 -2.53833 13.65519
1.358 9.617 0.205 5.55843 4.09277 -3.61024 14.72710

109
Table 48: Independent T-Test for comparing T10 and B10 in the clean & jerk. (pg. 58)
Levene’s Test for Equality of Variances
t-test for Equality of Means
F Sig. t df Sig. (2-tailed)
Mean Difference
Std. Error Difference
95% Confidence Interval of the
Difference
Lower Upper
Clean & Jerk Equal variances assumed Equal variances not assumed
2.607 0.135
0.410 11 0.690 2.62476 6.40686 -11.47663 16.72616
0.398 8.782 0.700 2.62476 6.59470 -12.35010 17.59962

110
Table 49: Independent T-Test for comparing M10 and B10 in the clean & jerk. (pg. 58)
Levene’s Test for Equality of Variances
t-test for Equality of Means
F Sig. t df Sig. (2-tailed)
Mean Difference
Std. Error Difference
95% Confidence Interval of the
Difference
Lower Upper
Clean & Jerk Equal variances assumed Equal variances not assumed
10.650 0.006
-0.596 14 0.561 -2.93367 4.92137 -13.48895 7.62161
-0.499 6.301 0.635 -2.93367 5.87895 -17.15424 11.28690

111
Table 50: Performance rankings of highest, middle and lowest for T10, M10 and B10 on the
fitness benchmarks based on the means for each benchmark for each group. (pg. 59)
Fitness Benchmark Rating of Performance on Fitness Benchmarks
Energy System Highest Middle Lowest
Clean & Jerk Top 10 Bottom 10 Middle 10 Anaerobic
Snatch Top 10 Bottom 10 Middle 10 Anaerobic
Deadlift Top 10 Bottom 10 Middle 10 Anaerobic
Back Squat Middle 10 Bottom 10 Top 10 Anaerobic
Max Pull-ups Top 10 Bottom 10 Middle 10 Aerobic
400 m Sprint Bottom 10 Top 10 Middle 10 Anaerobic
5 k Run Middle 10 Top 10 Bottom 10 Aerobic

112
Table 51: The Intraclass Correlation for the questions concerning average RPE for the workouts,
number of hard days performed in a week and number of weeks of participation that has
occurred in the self-selected program. (pg. 120)
Number of Hard Days
in a Week Average RPE for the
Workouts
Number of Weeks Completed in the Exercise Program
Intraclass Correlation 0.971 0.902 0.801

113
Table 52: Strength of agreements based on Cohen’s Kappa statistic from Landis and Koch (31).
(pg. 120)
Strength of Agreement Cohen’s Kappa Statistic (ĸ)
Poor <0.00
Slight 0.00 – 0.20
Fair 0.21 – 0.40
Moderate 0.41 – 0.60
Substantial 0.61 – 0.80
Almost Perfect 0.81 – 1.00

114
Table 53: Reliability analysis via Cohen’s kappa and Landis and Koch (31) depicting poor, slight,
fair, moderate (Mod.), substantial (Substan.) and almost perfect agreements for the yes/no
questions of the questionnaire. (pg. 120)
TRIAL 2
QUESTION # Q7 Q12 Q13A1 Q13A2 Q13A3 Q13A4 Q13A5
Yes No Yes No Yes No Yes No Yes No Yes No Yes No
TRIAL 1 Yes 9 0 13 0 5 0 0 0 0 0 0 0 0 1
No 1 8 0 5 0 13 0 18 0 18 0 18 0 17
COHENS’ KAPPA (ĸ)
0.88 1.00 1.00 - - - 0.00
AGREEMENT Almost
Perfect Almost Perfect
Almost Perfect
Almost Perfect
Almost Perfect
Almost Perfect
Slight
QUESTION # Q14A1 Q14A2 Q14A3 Q14A4 Q14A5 Q14A6 Q14A7
Yes No Yes No Yes No Yes No Yes No Yes No Yes No
TRIAL 1 0 0 0 0 0 0 0 0 0 0 0 0 0 1
0 18 0 18 0 18 0 18 0 18 0 18 0 17
COHENS’ KAPPA (ĸ)
- - - - - - 0.00
AGREEMENT Almost Perfect
Almost Perfect
Almost Perfect
Almost Perfect
Almost Perfect
Almost Perfect
Slight
QUESTION # Q14A8 Q15A1 Q15A2 Q15A3 Q15A4 Q15A5 Q15A6
Yes No Yes No Yes No Yes No Yes No Yes No Yes No
TRIAL 1 0 0 1 3 9 3 1 1 1 0 3 0 1 1
0 18 2 12 1 5 0 16 0 17 1 14 0 16
COHENS’ KAPPA (ĸ)
- 0.10 0.53 0.61 1.00 0.81 0.61
AGREEMENT Almost Perfect
Slight Mod. Substan. Almost Perfect
Almost Perfect
Substan.
QUESTION # Q15A7 Q15A8 Q15A9 Q15A10 Q15A11 Q16 Q17A1
Yes No Yes No Yes No Yes No Yes No Yes No Yes No
TRIAL 1 Yes 0 3 1 1 0 1 1 0 0 0 1 1 0 0
No 0 15 1 15 0 17 0 17 0 18 1 15 0 18
COHENS’ KAPPA (ĸ)
0.00 0.45 0.00 1.00 - 0.45 -
AGREEMENT Slight Mod. Slight Almost Perfect
Almost Perfect
Mod. Almost Perfect
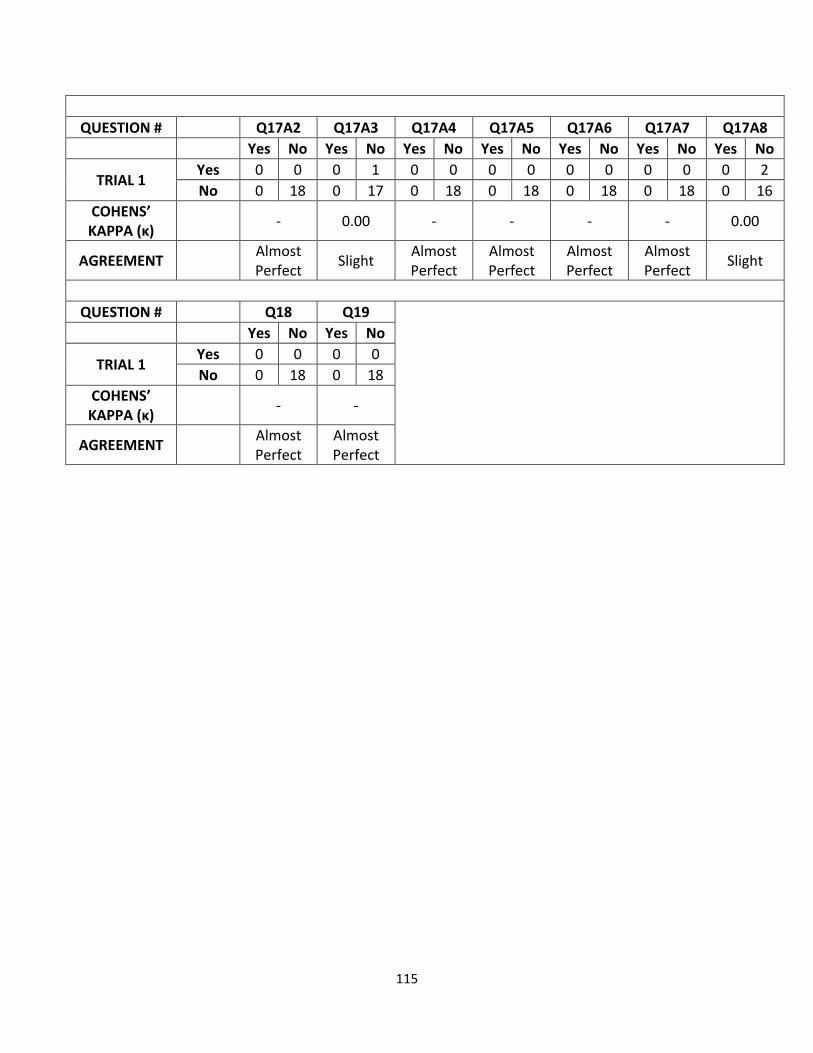
115
QUESTION # Q17A2 Q17A3 Q17A4 Q17A5 Q17A6 Q17A7 Q17A8
Yes No Yes No Yes No Yes No Yes No Yes No Yes No
TRIAL 1 Yes 0 0 0 1 0 0 0 0 0 0 0 0 0 2
No 0 18 0 17 0 18 0 18 0 18 0 18 0 16
COHENS’ KAPPA (ĸ)
- 0.00 - - - - 0.00
AGREEMENT Almost Perfect
Slight Almost Perfect
Almost Perfect
Almost Perfect
Almost Perfect
Slight
QUESTION # Q18 Q19
Yes No Yes No
TRIAL 1 Yes 0 0 0 0
No 0 18 0 18
COHENS’ KAPPA (ĸ)
- -
AGREEMENT Almost Perfect
Almost Perfect

116
Figure 1: Bland-Altman plot for the number of hard days performed in a week. (pg. 120)
-1.5
-1
-0.5
0
0.5
1
1.5
0 1 2 3 4 5 6 7
Dif
f Tr
ial 2
- T
rial
3 (
m2
)
Means Trials (m2)

117
Figure 2: Bland-Altman plot for the number of weeks of participation that has occurred in the
self-selected program. (pg. 120)
-4
-2
0
2
4
6
8
10
0 1 2 3 4 5 6 7 8 9
Dif
f Tr
ial 2
- T
rial
3 (
m2
)
Means Trials (m2)
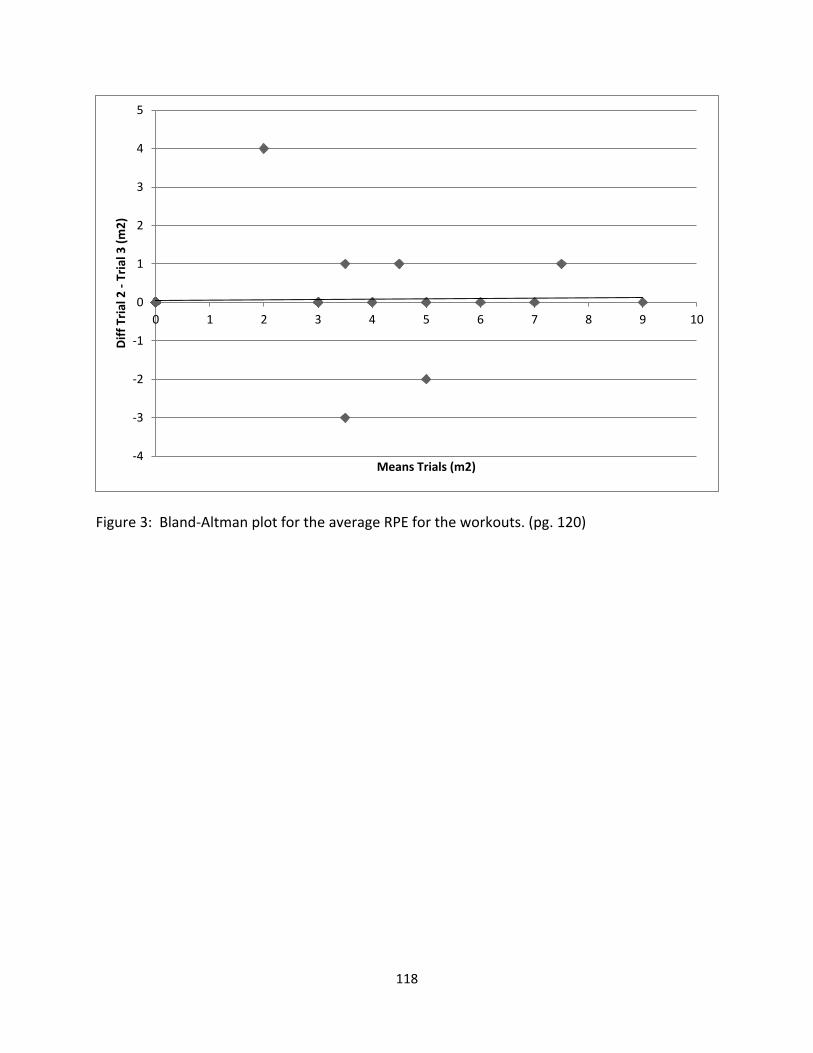
118
Figure 3: Bland-Altman plot for the average RPE for the workouts. (pg. 120)
-4
-3
-2
-1
0
1
2
3
4
5
0 1 2 3 4 5 6 7 8 9 10
Dif
f Tr
ial 2
- T
rial
3 (
m2
)
Means Trials (m2)

119
APPENDIX C
A QUESTIONNAIRE’S RELIABILITIY IN DETERMINING RISK FACTORS OF EXERTIONAL RHABDOMYOLYSIS IN EXTREME CONDITIONING PROGRAMS
SUBJECTS AND PROCEDURES
Prior to sending out an official questionnaire to CrossFit® and American College of
Sports Medicine (ACSM) trained individuals, 62 individuals were contacted to take the Exercise
Training Study Questionnaire (Appendix D) to determine its reliability. Eighteen subjects (17
females and one male) of the 62 volunteered to participate in determining the reliability of the
Exercise Training Study Questionnaire via the test-retest method. Subjects used were not those
consistent with the target exercisers following the CrossFit® or ACSM program. The subjects
were asked to complete the questionnaire via email twice with a reminder email sent to retake
the questionnaire two days later after having all the risks explained to them and giving
informed consent (Appendix G).
STATISTICAL ANALYSIS
The intraclass correlation (ICC) was determine for the questions pertaining to RPE,
number of hard days performed in a week and number of weeks of participation that occurred
in the self-selected program. In addition, Bland-Altman plots were created for these questions.
As the rest of the questions consisted of yes/no items, Cohen’s kappa was used to determine

120
the agreement between the first answer given and the second one. Agreement was determined
via techniques of Landis and Koch (31).
RESULTS
Due to normality calculated as less than 2.58 for the questions concerning RPE, number
of hard days performed in a week and number of weeks of participation that occurred in the
self-selected program, ICC was determined to be an appropriate analysis of the three prior
mentioned questions. The ICC (Table 51) for RPE, number of hard days performed in a week,
and number of weeks of participation that occurred in the self-selected program were 0.902,
0.971 and 0.801, respectively. The Bland-Altman plots depict this agreement in Figures 1 – 3.
For the yes/no questions, Cohen’s kappa was used and agreements were determined by
referencing Landis and Koch (31) as illustrated in Table 52. Yes or no questions consisted of
questions five & 10 – 19. In summary, questions regarding RPE, number of hard days performed
in a week, and number of weeks of participation that occurred in the self-selected program,
had strong ICC reliability values. As for the yes/no questions, there were zero agreements of
poor, seven agreements of slight, zero agreements of fair, three agreements of moderate, two
agreements of substantial, and 25 agreements of almost perfect. The specific data collected on
the reliability analysis on the strength of agreements can be found in Table 53.
DISCUSSION AND CONCLUSION

121
As the ICC for RPE, number of hard days performed in a week and number of weeks of
participation that occurred in the self-selected program was 0.902, 0.971 and 0.801 (Table 51),
respectively; this indicated very good reliability for these questions.
Landis and Koch (31) found that the kappa statistic (ĸ) was related to the strength of
agreement between the two variables, and therefore could yield an general idea of reliability
for the yes/no questions. Ideally the “almost perfect” agreement was sought after for the
yes/no questions; however, some questions did not hold that agreement. The most troubling
were those where one to three subjects changed one of their answers on one question from
“yes” on the first trial to “no” on the second trial. This would result in ĸ = 0.00 and a slight
agreement (Table 52) though it would seem reliability to be quite good with just one to three
people switching one answer to one question. This may be due to small sample size (18
subjects) or possibly due to where the subject was in the periodization of their chosen exercise
program resulting in changing their answer. Question 15 had greatest range in strength of
agreement as the subjects answered the yes/no questions. Strength of agreement ranged from
slight to almost perfect. This may be due to the nature of the question, which asked: within 48-
hours of any workout, have you had any of the symptoms mentioned below? It may be possible
for the subject to have worked out between trials resulting in additional symptoms being felt.
There was also the possibility of forgetting about previous symptoms due to fatigue from taking
the questionnaire, crunched for time, boredom, etc. Overall, the questionnaire had 25
questions with almost perfect agreement, two with substantial agreement, three with
moderate agreement, and seven with slight agreement. Six of the seven questions with slight

122
agreement involved the incident previously mentioned. Therefore, it was determined that the
questionnaire was reliable.

123
APPENDIX D
ADDITIONAL INFORMATION
This is a list of the exact count and expected count for the crosstabulation for chi-square analysis as they
appear in the paper.
Prior exercise experience:
Exact Count - CrossFit®: yes – 80 no – 21, ACSM: yes – 52 no – 4
Expected Count - CrossFit®: yes – 84.9 no – 16.1, ACSM: yes – 47.1 no – 8.9
Warm-up prior to exercise:
Exact Count - CrossFit®: yes – 98 no – 3, ACSM: yes – 52 no – 4
Expected Count - CrossFit®: yes – 96.5 no – 4.5, ACSM: yes – 53.5 no – 2.5
Medications:
Aspirin:
Exact Count - CrossFit®: yes – 12 no – 89, ACSM: yes – 4 no – 52
Expected Count - CrossFit®: yes – 10.3 no – 90.7, ACSM: yes – 5.7 no – 50.3
Anti-Cholinergic Agents:
Exact Count - CrossFit®: yes – 0 no – 101, ACSM: yes – 1 no – 55
Expected Count - CrossFit®: yes – 0.6 no – 100.4, ACSM: yes – 0.4 no – 55.6

124
Statins:
Exact Count - CrossFit®: yes – 0 no – 101, ACSM: yes – 2 no – 54
Expected Count - CrossFit®: yes – 1.3 no – 99.7, ACSM: yes – 0.7 no – 55.3
Other medications:
Exact Count - CrossFit®: yes – 3 no – 98, ACSM: yes – 5 no – 51
Expected Count - CrossFit®: yes – 5.1 no – 95.9, ACSM: yes – 2.9 no – 53.1
Diagnosis:
Dehydration:
Exact Count - CrossFit®: yes – 2 no – 99, ACSM: yes – 0 no – 56
Expected Count - CrossFit®: yes – 1.3 no – 99.7, ACSM: yes – 0.7 no – 55.3
Fatigue:
Exact Count - CrossFit®: yes – 0 no – 101, ACSM: yes – 2 no – 54
Expected Count - CrossFit®: yes – 1.3 no – 99.7, ACSM: yes – 0.7 no – 55.3
Delayed Onset Muscle Soreness:
Exact Count - CrossFit®: yes – 3 no – 98, ACSM: yes – 1 no – 55
Expected Count - CrossFit®: yes – 2.6 no – 98.4, ACSM: yes – 1.4 no – 54.6

125
Overexertion Injury:
Exact Count - CrossFit®: yes – 4 no – 97, ACSM: yes – 3 no – 53
Expected Count - CrossFit®: yes – 4.5 no – 96.5, ACSM: yes – 2.5 no – 53.5
Other diagnosed conditions:
Exact Count - CrossFit®: yes – 3 no – 98, ACSM: yes – 3 no – 53
Expected Count - CrossFit®: yes – 3.9 no – 97.1, ACSM: yes – 2.1 no – 53.9
48-hours post-exercise symptoms:
Excessive fatigue:
Exact Count - CrossFit®: yes – 42 no – 59, ACSM: yes – 8 no – 48
Expected Count - CrossFit®: yes – 32.2 no – 68.8, ACSM: yes – 17.8 no – 38.2
Muscle Soreness:
Exact Count - CrossFit®: yes – 96 no – 5, ACSM: yes – 48 no – 8
Expected Count - CrossFit®: yes – 92.6 no – 8.4, ACSM: yes – 51.4 no – 4.6
Muscle Swelling:
Exact Count - CrossFit®: yes – 19 no – 82, ACSM: yes – 4 no – 52
Expected Count - CrossFit®: yes – 14.8 no – 86.2, ACSM: yes – 8.2 no – 47.8

126
Shortness of breath:
Exact Count - CrossFit®: yes – 13 no – 88, ACSM: yes – 1 no – 55
Expected Count - CrossFit®: yes – 9.0 no – 92.0, ACSM: yes – 5.0 no – 51.0
Muscle Weakness:
Exact Count - CrossFit®: yes – 31 no – 70, ACSM: yes – 12 no – 44
Expected Count - CrossFit®: yes – 27.7 no – 73.3, ACSM: yes – 15.3 no – 40.7
Sleep Disturbance:
Exact Count - CrossFit®: yes – 11 no – 90, ACSM: yes – 4 no – 52
Expected Count - CrossFit®: yes – 9.6 no – 91.4, ACSM: yes – 5.4 no – 50.6
Muscle pain to light touch:
Exact Count - CrossFit®: yes – 31 no – 70, ACSM: yes – 4 no – 52
Expected Count - CrossFit®: yes – 22.5 no – 78.5, ACSM: yes – 12.5 no – 43.5
Limited movement in the muscles used during the workout:
Exact Count - CrossFit®: yes – 37 no – 64, ACSM: yes – 9 no – 47
Expected Count - CrossFit®: yes – 29.6 no – 71.4, ACSM: yes – 16.4 no – 39.6

127
Chest pain:
Exact Count - CrossFit®: yes – 5 no – 96, ACSM: yes – 2 no – 54
Expected Count - CrossFit®: yes – 4.5 no – 96.5, ACSM: yes – 2.5 no – 53.5
Cola-/Tea-/Brown-colored urine:
Exact Count - CrossFit®: yes – 2 no – 99, ACSM: yes – 0 no – 56
Expected Count - CrossFit®: yes – 1.3 no – 99.7, ACSM: yes – 0.7 no – 55.3
Other 48-hours post-exercise symptoms:
Exact Count - CrossFit®: yes – 0 no – 101, ACSM: yes – 1 no – 55
Expected Count - CrossFit®: yes – 0.6 no – 100.4, ACSM: yes – 0.4 no – 55.6
Doctor seen:
Exact Count - CrossFit®: yes – 8 no – 93, ACSM: yes – 5 no – 51
Expected Count - CrossFit®: yes – 8.4 no – 92.6, ACSM: yes – 4.6 no – 51.4
ER indicators:
Myoglobinuria:
Exact Count - CrossFit®: yes – 1 no – 100, ACSM: yes – 1 no – 55
Expected Count - CrossFit®: yes – 1.3 no – 99.7, ACSM: yes – 0.7 no – 55.3

128
High blood creatine kinase levels:
Exact Count - CrossFit®: yes – 2 no – 99, ACSM: yes – 1 no – 55
Expected Count - CrossFit®: yes – 1.9 no – 99.1, ACSM: yes – 1.1 no – 54.9
Arrhythmia:
Exact Count - CrossFit®: yes – 2 no – 99, ACSM: yes – 3 no – 53
Expected Count - CrossFit®: yes – 3.2 no – 97.8, ACSM: yes – 1.8 no – 54.2
Hyperkalemia:
Exact Count - CrossFit®: yes – 1 no – 100, ACSM: yes – 0 no – 56
Expected Count - CrossFit®: yes – 0.6 no – 100.4, ACSM: yes – 0.4 no – 55.6
Muscle compartment syndrome:
Exact Count - CrossFit®: yes – 0 no – 101, ACSM: yes – 1 no – 55
Expected Count - CrossFit®: yes – 0.6 no – 100.4, ACSM: yes – 0.4 no – 55.6
Other ER indicators:
Exact Count - CrossFit®: yes – 0 no – 101, ACSM: yes – 1 no – 55
Expected Count - CrossFit®: yes – 0.6 no – 100.4, ACSM: yes – 0.4 no – 55.6

129
Overnight hospital stay:
Exact Count - CrossFit®: yes – 1 no – 100, ACSM: yes – 2 no – 54
Expected Count - CrossFit®: yes – 1.9 no – 99.1, ACSM: yes – 1.1 no – 54.9
Diagnosed with ER:
Exact Count - CrossFit®: yes – 1 no – 100, ACSM: yes – 0 no – 56
Expected Count - CrossFit®: yes – 0.6 no – 100.4, ACSM: yes – 0.4 no – 55.6

130
APPENDIX E
EXERCISE TRAINING STUDY QUESTIONNAIRE
For this study, the purpose will be to determine what sort of risk CrossFit® possesses for
the development of exertional rhabdomyolysis. Secondary objectives will be to determine if
different affiliates and different workouts of the day yield differing risk levels for development
of exertional rhabdomyolysis. Lastly, the intensity of CrossFit® will be determined. These
objectives will be determined via the answers of CrossFit® participants about their past
experiences thru this questionnaire.
1. Do you participate in a CrossFit® program or an ACSM
guideline based program?
CrossFit® ACSM
Other
2. In what state do you train in?
State: _______________________________
3. Are you male or female?
Male Female
4. How old are you?
Age: _________________________________
5. How tall are you?
Height: _______________________________
6. How much do you weigh?
Weight: ______________________________
7. Before starting your current exercise program, did you
exercise for at least 3 days per week for at least 30
minutes per day?
Yes No
8. How many weeks have you been working out using
your current exercise program?
0 1 2 3 4 5
6 7 8 or more
9. How would you rate your average perceived exertion
during a session? (0 – at rest, 1 – very easy, 3 –
moderate, 5 – hard, 7- very hard, 10 – maximal)
0 1 2 3 4 5 6 7 8 9 10
10. For CrossFit® participants, rank your top 5 hardest
workouts of the day with 1 being the hardest and 5
being the least hard.
1.___________________________________________
2.___________________________________________
3.___________________________________________
4.___________________________________________
5.___________________________________________
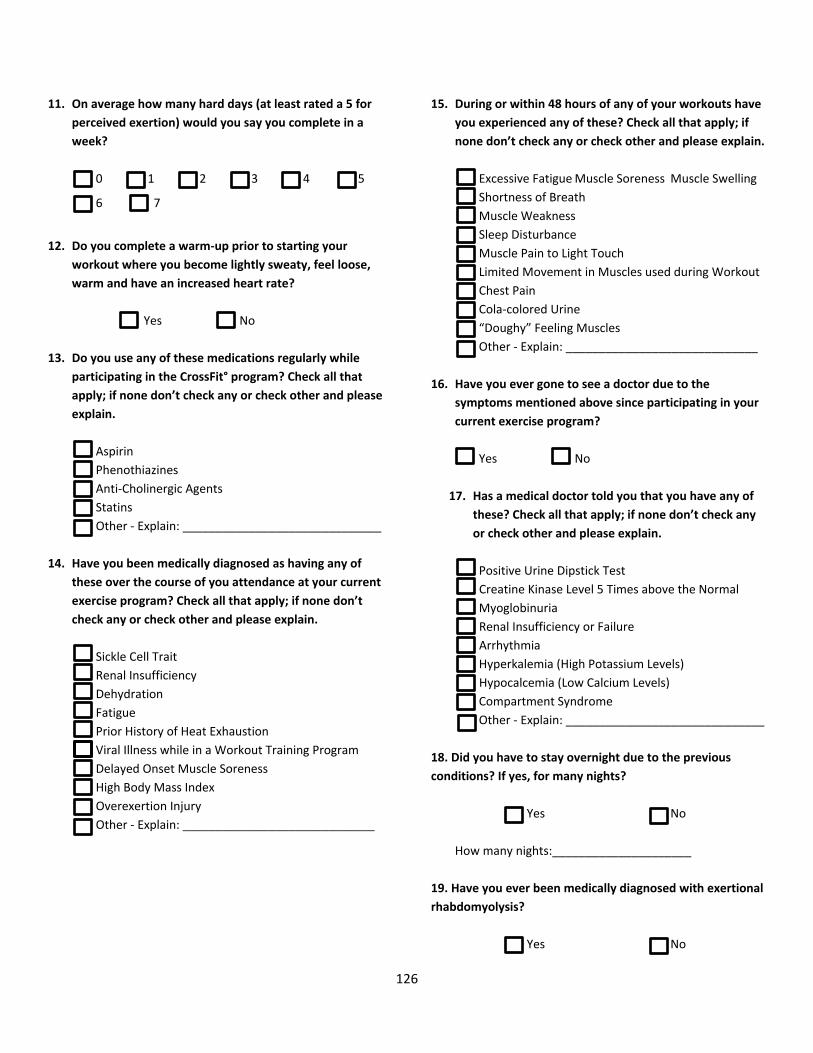
126
11. On average how many hard days (at least rated a 5 for
perceived exertion) would you say you complete in a
week?
0 1 2 3 4 5
6 7
12. Do you complete a warm-up prior to starting your
workout where you become lightly sweaty, feel loose,
warm and have an increased heart rate?
Yes No
13. Do you use any of these medications regularly while
participating in the CrossFit° program? Check all that
apply; if none don’t check any or check other and please
explain.
Aspirin
Phenothiazines
Anti-Cholinergic Agents
Statins
Other - Explain: ______________________________
14. Have you been medically diagnosed as having any of
these over the course of you attendance at your current
exercise program? Check all that apply; if none don’t
check any or check other and please explain.
Sickle Cell Trait
Renal Insufficiency
Dehydration
Fatigue
Prior History of Heat Exhaustion
Viral Illness while in a Workout Training Program
Delayed Onset Muscle Soreness
High Body Mass Index
Overexertion Injury
Other - Explain: _____________________________
15. During or within 48 hours of any of your workouts have
you experienced any of these? Check all that apply; if
none don’t check any or check other and please explain.
Excessive Fatigue Muscle Soreness Muscle Swelling
Shortness of Breath
Muscle Weakness
Sleep Disturbance
Muscle Pain to Light Touch
Limited Movement in Muscles used during Workout
Chest Pain
Cola-colored Urine
“Doughy” Feeling Muscles
Other - Explain: _____________________________
16. Have you ever gone to see a doctor due to the
symptoms mentioned above since participating in your
current exercise program?
Yes No
17. Has a medical doctor told you that you have any of
these? Check all that apply; if none don’t check any
or check other and please explain.
Positive Urine Dipstick Test
Creatine Kinase Level 5 Times above the Normal
Myoglobinuria
Renal Insufficiency or Failure
Arrhythmia
Hyperkalemia (High Potassium Levels)
Hypocalcemia (Low Calcium Levels)
Compartment Syndrome
Other - Explain: ______________________________
18. Did you have to stay overnight due to the previous
conditions? If yes, for many nights?
Yes No
How many nights:_____________________
19. Have you ever been medically diagnosed with exertional
rhabdomyolysis?
Yes No

127
APPENDIX F
INFORMED CONSENT FORM STUDY TESTING
To whom this may concern,
We are inviting you to participate in a research study. The purpose of the study is to compare
exercise training programs based on past experiences of their participants. Questions will cover areas
concerning your general exercise training background and your perceived intensity of the training
program(s).
We are inviting you to be in this study because you are currently participating in an exercise
program at the gym of your choosing. Our hope is that you will help provide further insights into your
fitness program for future participants to use as they decide the best program to suit their fitness needs.
If you agree to participate, you will be asked to answer a questionnaire where you will use your
experiences with your chosen exercise program to answer the questions. It will take approximately ten
(10) minutes of your time to answer this online questionnaire.
Your part in this study is anonymous. That means your answers are private. No one else can
know if you participated in this study and no one else can find out what your answers were. Scientific
reports will be based on group data and will not identify you or any individual as being in this project. On
data sheets your scores will be identified by a subject identification number. The questionnaires will only
be seen by the authors of this study. You may provide an email address separate from your
questionnaire at the end to be put into a drawing for $20 VISA gift cards to go toward a fitness
membership. Once contact of the winners has occurred, all email addresses will be discarded by the
main author.
Risks: Minimal risk is expected. The questionnaire may bring up memories of past, potentially
troublesome experiences associated with exercise. Such as if a participant had poor commitment or
motivation to stay with the exercise program and stopped exercising. Feelings of anxiety, anger or
helplessness may be brought up due to memories of a previous injury due to a prior exercise program. If
this is the case, you may contact the researcher (Bryanne Bellovary) to discuss options, such as
contacting a local behavior health specialist.
128
Benefits: It is hoped you will feel empowered to share your thoughts about your exercise habits
and any negative or positive outcomes so that future exercisers in various exercise programs will be
better prepared to handle the workout load.
Taking part in this research study is completely voluntary. You will be expected to answer
honestly on the questionnaire. If you decide to discontinue participation in this study, you can submit
the questionnaire as incomplete.
If you have any further questions regarding your rights as a participant in a research project you
may contact Dr. Brian Cherry of the Human Subjects Research Review Committee of Northern Michigan
University (906-227-2300) [email protected]. Any questions you have regarding the nature of this
research project will be answered by the principal researcher who can be contacted as follows: Bryanne
Bellovary (906-227-2130) [email protected] or Dr. Scott Drum at 906-227-2195 or [email protected].
------------------------------------------------------------------------------------------------------------------------------------------
I have read the above “Informed Consent Statement.” The nature, risks, demands, and benefits
of the project have been explained to me. I understand that I may ask questions and that I am free to
withdraw from the questionnaire at any time without incurring ill will or negative consequences. I also
understand that my questionnaire answers will be kept anonymous and if I choose to provide an email
address to be entered into the drawing these will be kept separate from the questionnaire and be kept
confidential. Access to this document is restricted to the principle investigators.
If you choose to accept the above terms and conditions please click “next” below to start the
questionnaire.
Thank you very much for your consideration.
Sincerely,
Bryanne Bellovary
Graduate Student
School of Health, Physical Education and Recreation
Northern Michigan University

129
APPENDIX G
INFORMED CONSENT FORM RELIABILITY TESTING
To whom this may concern,
We are inviting you to participate in a research study. The purpose of the study is to compare
exercise training programs based on past experiences of their participants. Questions will cover areas
concerning your general exercise training background and your perceived intensity of the training
program(s).
We are inviting you to be in this study because you are currently participating in an exercise
program at the gym of your choosing. Our hope is that you will help provide further insights into your
fitness program for future participants to use as they decide the best program to suit their fitness needs.
If you agree to participate, you will be asked to answer a questionnaire on two separate dates
with about two weeks in between where you will use your experiences with your chosen exercise
program to answer the questions. It will take approximately ten (10) minutes of your time to answer this
online questionnaire for each session.
Your part in this study is anonymous. That means your answers are private. No one else can
know if you participated in this study and no one else can find out what your answers were. Scientific
reports will be based on group data and will not identify you or any individual as being in this project. On
data sheets your scores will be identified by a subject identification number. The questionnaires will only
be seen by the authors of this study. You may provide your name separate to your questionnaire at the
end for two (2) points of extra credit in the class you are enrolled in with the instructor, Bryanne
Bellovary. If you choose to not participate in the study, please inform the instructor and she will provide
you with an alternate two (2) point extra credit opportunity.
Risks: Minimal risk is expected. The questionnaire may bring up memories of past, potentially
troublesome experiences associated with exercise. Such as if a participant had poor commitment or
motivation to stay with the exercise program and stopped exercising. Feelings of anxiety, anger or
helplessness may be brought up due to memories of a previous injury due to a prior exercise program. If
this is the case, you may contact the researcher (Bryanne Bellovary) to discuss options, such as
contacting a local behavior health specialist.

130
Benefits: It is hoped you will feel empowered to share your thoughts about your exercise habits
and any negative or positive outcomes so that future exercisers in various exercise programs will be
better prepared to handle the workout load.
Taking part in this research study is completely voluntary. You will be expected to answer
honestly on the questionnaire. If you decide to discontinue participation in this study, you can submit
the questionnaire as incomplete.
If you have any further questions regarding your rights as a participant in a research project you
may contact Dr. Brian Cherry of the Human Subjects Research Review Committee of Northern Michigan
University (906-227-2300) [email protected]. Any questions you have regarding the nature of this
research project will be answered by the principal researcher who can be contacted as follows: Bryanne
Bellovary (906-227-2130) [email protected] or Dr. Scott Drum at 906-227-2195 or [email protected].
------------------------------------------------------------------------------------------------------------------------------------------
I have read the above “Informed Consent Statement.” The nature, risks, demands, and benefits
of the project have been explained to me. I understand that I may ask questions and that I am free to
withdraw from the questionnaire at any time without incurring ill will or negative consequences. I also
understand that my questionnaire answers will be kept anonymous. If I choose to provide my name to
receive extra credit from taking the questionnaire, my name will be kept separate from the data
collected and kept confidential. I also understand that if I choose to not participate in this study, I can be
given an alternate extra credit assignment without consequence. Access to this document is restricted
to the principle investigators.
If you choose to accept the above terms and conditions please click “next” below to start the
questionnaire.
Thank you very much for your consideration.
Sincerely,
Bryanne Bellovary
Graduate Student
School of Health, Physical Education and Recreation
Northern Michigan University