the organizational life cycle stages and effectiveness578624/fulltext01.pdf · the organizational...
TRANSCRIPT
The Organizational Life Cycle Stages and Effectiveness
A Study of Swedish Gazelle Companies
Bachelor’s thesis within Business Administration
Author: Christoffer Nordström
Ga Eun Choi
Carlos Llorach
Tutor: Börje Boers
Jönköping December 2012
Acknowledgements
First, we would like to thank our tutor, Börje Boers, for conducting such interesting and helpful seminars that have guided us towards the completion of our thesis. His feedbacks and contributions are beyond what we have expected.
We also appreciate the 26 gazelle firms that have kindly and initiatively put their time and effort in answering the survey questions for our research. Without their help, we would not have been able to conduct the investigation and draw conclusions on the study of gazelles from the organizational life cycle perspective.
Thank you,
Jönköping, Sweden, December, 2012
Christoffer Nordström Ga Eun Choi Carlos Llorach
Bachelor’s Thesis in Business Administration
Title: The Organizational Life Cycle Stages and Effectiveness: A Study of Swedish Gazelle Companies
Author: Christoffer Nordström Ga Eun Choi Carlos Llorach
Tutor: Börje Boers
Date: 2012-12-04
Abstract
Purpose
Background/ Problem
Method
Conclusion
Key Words
The life cycle theory, organizational effectiveness, gazelles, SMEs, the organizational structure, firm growth, Sweden
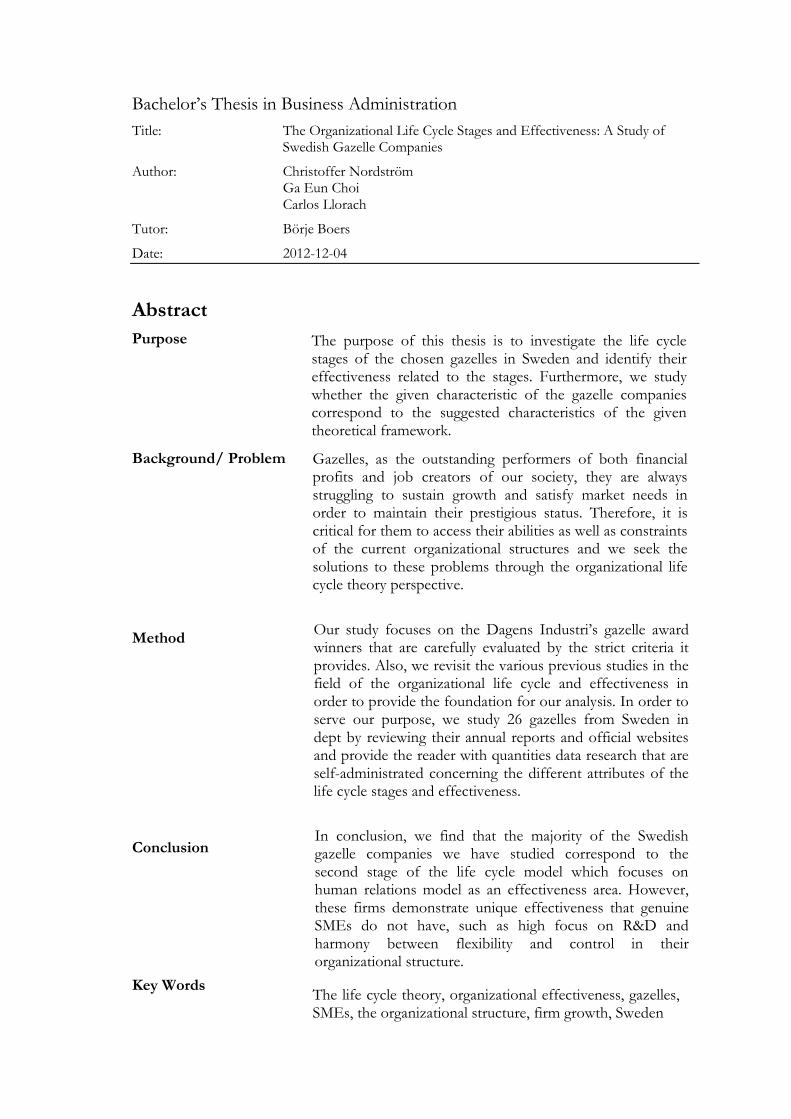
The purpose of this thesis is to investigate the life cycle stages of the chosen gazelles in Sweden and identify their effectiveness related to the stages. Furthermore, we study whether the given characteristic of the gazelle companies correspond to the suggested characteristics of the given theoretical framework.
Gazelles, as the outstanding performers of both financial profits and job creators of our society, they are always struggling to sustain growth and satisfy market needs in order to maintain their prestigious status. Therefore, it is critical for them to access their abilities as well as constraints of the current organizational structures and we seek the solutions to these problems through the organizational life cycle theory perspective.
Our study focuses on the Dagens Industri’s gazelle award winners that are carefully evaluated by the strict criteria it provides. Also, we revisit the various previous studies in the field of the organizational life cycle and effectiveness in order to provide the foundation for our analysis. In order to serve our purpose, we study 26 gazelles from Sweden in dept by reviewing their annual reports and official websites and provide the reader with quantities data research that are self-administrated concerning the different attributes of the life cycle stages and effectiveness.
In conclusion, we find that the majority of the Swedish gazelle companies we have studied correspond to the second stage of the life cycle model which focuses on human relations model as an effectiveness area. However, these firms demonstrate unique effectiveness that genuine SMEs do not have, such as high focus on R&D and harmony between flexibility and control in their organizational structure.
1
Table of Contents
1 Introduction .................................................................................... 3
1.1 Background .............................................................................................................. 3
1.2 Problems Discussion .............................................................................................. 4
1.3 Purpose ..................................................................................................................... 5
1.4 Structure of Thesis .................................................................................................. 5
2 Theoretical Framework .................................................................. 6
2.1 Literature Review on the Organizational Life Cycle Theory ............................ 6
2.2 Obstacles in Advancement .................................................................................... 8
2.3 The Organizational Effectiveness and the Life Cycle Stages ..........................10
2.4 Reflection on the Organizational Life Cycle Models .......................................14
3 Method ........................................................................................... 16
3.1 Research Approach ...............................................................................................16
3.2 Data Collection ......................................................................................................17
3.2.1 Primary Data Collection: Surveys ..........................................................17
3.2.2 Secondary Data Collection: Theory interpretation .............................17
3.2.3 Choice of Method ....................................................................................18
3.3 Quantitative Study .................................................................................................18
3.3.1 Choice of Sample .....................................................................................19
3.3.2 Significance of the Chosen Samples .....................................................20
3.4 Reliability of the Research Method.....................................................................20
4 Empirical Data ............................................................................... 22
4.1 Geographical Distribution of the Sample Gazelle Firms ................................22
4.2 Size of the Sample Gazelle Firms .......................................................................22
4.3 Background Knowledge on Respondents .........................................................23
4.4 Operational Profit and Net Turnover Growth .................................................24
5 Analysis .......................................................................................... 26
5.1 Open System Model .............................................................................................26
5.2 Rational Goal Model .............................................................................................29
5.3 Internal Process Model.........................................................................................30
5.4 Human Relations Model ......................................................................................32
5.5 Analysis of the Overall Tendencies ....................................................................34
6 Conclusion ..................................................................................... 37
6.1 Delimitation and Suggestions for Further Studies ...........................................38
List of References ................................................................................ 39
Appendix 1. Obstacles for Non Fast-Growing Firms in Sweden ...... 43
Appendix 2. The Model of Effectiveness Criteria ............................... 44
Appendix 3. The Survey Questions ..................................................... 45
Appendix 4. Descripitve Statistics ....................................................... 48
2
Figures Figure 1. Effectivenss Criteria in a Ladder Diagram from Quinn and Rohrbaugh(1983) .... 11
Figure 2. Quinn and Cameron's Four Models of Effectiveness Values (1983) ...................... 12
Figure 3. Quinn and Cameron’s Hypothized Patterns of Effectiveness During the Four Life Cycle Stages (1983) .................................................................................................................. 13
Figure 4. Average Number of Employees ................................................................................... 23
Figure 5. Respondents' Job Positions ........................................................................................... 23
Figures in Appendix
Figure A2.1. Quinn and Rohrbaugh's Spatial Model of Effectiveness Criteria (1983) ......... 45 Figure A4.1. Combined Operating Profits for the Sample Gazelles ....................................... 51
Tables
Table 1. The Summary of Different Life Cycle Models into Four Main Stages Suggested by Quinn and Cameron (1983) ............................................................................................................. 7
Table 2. Obstacles Presented in Each Stage of the Life Cycle Models ..................................... 9
Table 3. Distribution of Fimrs of Different Sizes in Sweden ................................................... 20
Table 4. Distribution of the Sample Gazelles.............................................................................. 22
Table 5. Distribution of Industrial Sectors of the Sample Gazelles ......................................... 24
Table 6. Survey Questionnaires for the Open System Model ................................................... 27
Table 7. Survey Questionnaires for the Rational Goal Model .................................................. 29
Table 8. Survey Questionnaires for the Internal Process Model .............................................. 31
Table 9. Survey Questionnaires for the Human Relations Model ............................................ 33
Tables in Appendix
Table A1.1. Obstacles for Medium Size Swedish Firms from the Sweidhs from the Swedish Agency for Economic and Regional Growth ............................................................................. 49
Table A4.1. Number of Employees of the Sample Gazelles .................................................... 49 Table A4.2. Net Turnover for the Sample Gazelles from 2008 to 2011 ................................ 49
Table A4.3. Operating Profits for the Sample Gazelles from 2008 to 2011........................... 50
3
1 Introduction
This section provides crucial background knowledge on the scope of the life cycle theory and how it is adopted to view the growth of gazelles. We will elaborate the importance of the chosen topic of interest and introduce the main purpose of the investigation along with follow-up questions.
1.1 Background
The organizational life cycle theory has many appealing aspects as it uses metaphors generally used for living organisms to explain the sequential stages of firm growth and development. These stages present unique sets of effectiveness and difficulties that companies face throughout their life cycles. The description of these stages vary across different literatures however, a common assumption is that they experience transitions often initiated by crisis in the course of ‘improvement’ (Phelps, Adams and Bessant, 2007). Nevertheless, fast growing small-medium sized ventures are no exceptions to these crises. Despite their successes in achieving high growth, if they do not adjust for constraints, they cannot sustain the growth rate that will eventually lead them to a downfall. Thus identifying the current life cycle stage of an organization is crucial for both the management and future plans. It is important that they recognize their competencies as well as constrains to overcome the growing pains in the future. The life cycle theory offers expected obstacles for each stage, which can help the firms to diagnose their problems and reframe their strategies accordingly. Therefore our paper focuses on the life cycle stages of these fast growing small medium sized enterprises (SMEs), revisiting the statement that most of these gazelles are in their first stages of growth. Furthermore, we provide an overview on the effectiveness areas that these firms have and study fast-growing initiators of their outstanding performance. In the end, we will briefly introduce possible difficulties these companies will eventually face when advancing towards next sequential stages in the life cycle theory. We focus on the successful gazelles that are still actively participating in the market competition and investigate what stages they have managed to reach and their effectiveness areas.
Gazelle, as we have previously referred to, is a term describing fast-growing company. As vague as the term ‘growth’ sounds, many literatures offer different sets of definitions to gazelles. According to Birch, Haggerty and Parsons (1995, p. 46), gazelles are those who “achieve a minimum of 20% sales growth each year over the interval, starting from a base-year revenue of at least $100,000”. In this case, the definition is more focused on the ‘growth’ of revenue. Mitusch and Schimke (2011) give a somewhat different definition to these fast-growers. They measure the growth in terms of “their propensity to generate jobs” (Mistusch and Schimke, 2011, p. 19,). Furthermore, they claims that another influential factor in categorizing them is the age of firms, as young enterprises tend to have more potential for further growth relative to older ones (Mistusch and Schimke, 2011). Some use the term, gazelles, as the representation of the “dynamic and evolutionary nature” of young SMEs without specifying qualifications (Hölzl, 2009, p. 2).
According to Dagens Industri (DI), a respected Swedish financial newspaper, there are seven major criteria to distinguish gazelles from genuine SMEs. Since, our sample companies are chosen from prize winners of the DI’s 2012 gazelle’s competition, we find it necessary to use DI’s definition of gazelle companies. The first and most important criterion is that a gazelle company should have an annual turnover of more than 10 million SEK. As it is easily recognized, this definition uses monetary term of growth instead of job creation or invention of new product. Second, it should have at least ten employees. It implies that we are not looking into small sized firms but we are mostly focusing on
4
medium sized enterprises when we consider gazelles as a subject of study. Third, their turnovers should have doubled since the first year of the evaluation. Fourth, its sales should have shown continuous growth over the last four year period. Fifth, it should have had a positive profit for the last four financial years. Sixth, the observed growth should have been raised internally thus not achieved by acquisitions or mergers. Lastly, it should present stable finances over the evaluation period (DI.se, 2012).
These fast growing firms have to satisfy multiple criteria in order to be referred as gazelles and also it takes more time and effort to protect their reputations as outstanding performers. The question is how to prevent setbacks while effectively utilize their advantages as fast-growers. There are many different theories explaining such phenomenon of organizational development. However, the key is to identify one’s ability and satisfy the constant demands for adjustment. There are many ways to seek for solutions and in our investigation; we study the question of firm growth and organizational structure from the organizational life cycle perspective.
1.2 Problems Discussion
Over the last decades, consumer demands have become more complex. Market trends are harder to predict and competition is severe than ever. In order to survive such an intensified competition, companies should be more adaptable in reframing their structures on daily basis. Some researchers argue that young and small firms are often the most fast growing entities as they have the required flexibility (Phelps et al., 2007). For outstanding performers like gazelles, this is a particularly important issue. Even though they are achieving greater success than any other in the market, in order to maintain growth, they need to predict and adapt constantly and continuously. Furthermore, in order to support the expected changes and meet external demands, firms must evolve in its internal structure. Then how should they actually predict these changes? The organizational life cycle theory suggests answers to these issues. It argues that there are sequential stages, which organizations follow despite the heterogeneity of companies. This is because firms experience similar sorts of problems in the course of enlargement in production and the conventional theories believe that these constraints are applicable on most cases (Phelps et al., 2007). As we discuss further on this in the theoretical framework, different researchers hypothesize unique characteristics of different stages in the life cycle theory such as birth, maturity and death. The main assumption that is repeatedly brought up in different models is that by analyzing today’s structure, you can evolve into tomorrow’s structure. From this perspective, the organizational life cycle accommodates the questions on what stages these gazelles belong to and what they are expected to face in the future.
We choose to target gazelles because “it is younger and smaller firms, in particular, that exhibit the highest growth rates, though they also have a higher failure rather than mature organization” (Phelps et al., 2007). It is a subject of our interest since they have not yet reached the ‘maturity level’ but experience the biggest changes in their structures over a short period of time. By analyzing them, we will be able to get closer to the success initiators as well as to suggest them how to adapt further. In addition, gazelles are playing crucial roles in creating jobs and initiating innovative ideas to the society. According to the Swedish Agency for Economic and Regional Growth (Tillväxtverket, 2011), the number of SMEs in Sweden accounts for more than 90% of the total number of Swedish firms. Thus it is one of the major sources of job creation and it would be a huge loss for our economy if these companies cannot manage their ways through the competition and contribute to development of the national economy. Therefore, we are interested in investigating the

5
effectiveness criteria of these fast growing firms that are in the different or similar stages of the life cycle so consequently, we will be able to suggest a role model in successful growth.
1.3 Purpose
The purpose of this thesis is to investigate the corporate life cycle stages of the chosen gazelles in Sweden and identify their effectiveness related to the stages.
For the investigation purpose, we choose Katz and Kahn’s (1978, p. 225) definition of effectiveness which is “maximization of return to the organization by all means”. Therefore, we can say that our study includes the sequential stages of firm growth and also the effectiveness criteria that lead to the maximization of return. Furthermore, we make a connection between the expected characteristics of the life cycle stages and our empirical data on the Swedish gazelles. Last, we briefly present what might be the source of future constraints in proceeding to the next stage.
1.4 Structure of Thesis
In order to study the investigation purpose, our thesis is structured as the following:
In the theoretical framework, we explain why the organizational life cycle theory is suitable for the study of gazelles and describe different models more in detail. The literature review on the corporate life cycle overviews different models within the field. In addition, we present our focal model of research that is the Quinn and Cameron’s effectiveness model (1983). We explain the effectiveness criteria of organizations for each life cycle stage and their development.
In Section 3, we elaborate the choice of research methods and how we have chosen the samples for the empirical analysis. We demonstrate our data collection process and provide further understanding in the empirical data section.
In Section 4, the empirical data highlights the background knowledge on the gazelle companies and important findings from the survey questions. We revisit the definition of gazelles and present empirical data on the indicators of economic performances.
In the analysis, we connect the empirical data to the given framework of the organizational life cycle theory and the model of effectiveness criteria provided by Quinn and Cameron (1983). We analyze the relation between the given data collection and the characteristics of stages thus we can provide the reader with conclusive answer on the life cycle stage of the Swedish gazelles.
Finally in the conclusion, we provide a brief summary on the most important findings from the analysis and answer the research topic. In addition, we discuss the limitations of our studies and suggestions for further studies.
6
2 Theoretical Framework
This section reviews the organizational life cycle models proposed by various literatures and summarizes the main assumptions that are repeatedly brought up by different studies. It is composed in a way for the reader to easily compare the similarities and differences between the suggested models, furthermore it allows us to overview the characteristics of firms in each stage within the framework of the organizational life cycle theory. Later in this section, the focal model for the empirical study will be presented in order to promote a deeper understanding of the subject.
2.1 Literature Review on the Organizational Life Cycle Theory
The organizational life cycle has many appealing aspects as it describes a life cycle of ‘non-living’ organization or institution with organismic metaphors such as birth, maturity and death. It states that there are sequential stages of development over a certain period of time and that firms do not only grow in sizes but they ‘mature’ in their structures as they adapt to support their growing demands both internally and externally (Phelps et. al., 2007). According to Phelps et al. (2007), these theories hold similar assumptions that ‘growth is linear, sequential, deterministic and invariant’ (Phelps et al., 2007, p. 1). Greiner (1998) also explains in his article that each stage in a firm’s development is a result of former state implying that the development comes in sequential order. Unless a firm identifies and overcomes the limitations of the current structure, it cannot move on to the next stage of maturity. Recently, these assumptions are challenged more intensively due to the fact that the rapidly changing environment allows companies to be more adaptive and flexible rather than following a certain passage of development. However, the organizational life cycle theory is still a common concept to evaluate the firm’s current status and the necessary steps for further development. The discussion on the reflection of the life cycle theory will be presented later in this section.
Another strong assumption in different models is that firms generally move on to a next stage after a crisis. Quinn and Cameron (1983) describe this turbulence time as a ‘struggle’, Greiner (1998) as a ‘revolutionary period’ and Phelps et al. (2007) use the term ‘tipping point’. The interesting factor is that during these periods of challenges, firms go through a major improvement of structure thus achieving an upper level of development. There is no ‘average’ year of each stage. However, the changes generally appear when modifications of former strategies no longer work but the company needs a radical restructuring in order to secure its position in the competition (Greiner, 1998).
Each of these theories presents different models of the organizational life cycle and there are varieties of different stages identified by these researchers. The number of stages can vary from two to 33 depending on how detailed these stages are (Phelps et al., 2007). In spite of the difficulties, Quinn and Cameron (1983) try to integrate these models, they can be categorized under four main stages.
The first is stage is the entrepreneurial stage. It is generally characterized as a stage where the biggest driving force behind growth is the founder’s motivation and commitment. Creativity is encouraged and tasks are not coordinated in systemized ways but rather ‘frantic’ (Adizes, 1979). There is easy and quick communication between members and also towards the market response. It is structurally and financially unstable whereas the decision making process is simple and quick as a leader takes all responsibilities (Greiner, 1998). This stage is continued on until the entrepreneur realizes that the firm needs more of a formal structure in order to increase efficiency in production. The expected obstacles in this stage are actually resulted from its strongest advantage for growth, which is flexibility. Due to a size increase in the firm, it becomes harder for the entrepreneur to be involved exclusively with every employee. The firm needs ‘managerial roles’ that can initiate production efficiency as well as bring internal competencies. As
7
Lippitt and Schmidt (1967) suggest, the ownership role is limited to the founder, however this one-man ownership cannot reach further as founders cannot handle all matters as firm grows. Furthermore, informal ways of bookkeeping or administrative works should be reformed as they become inappropriate for bigger operations.
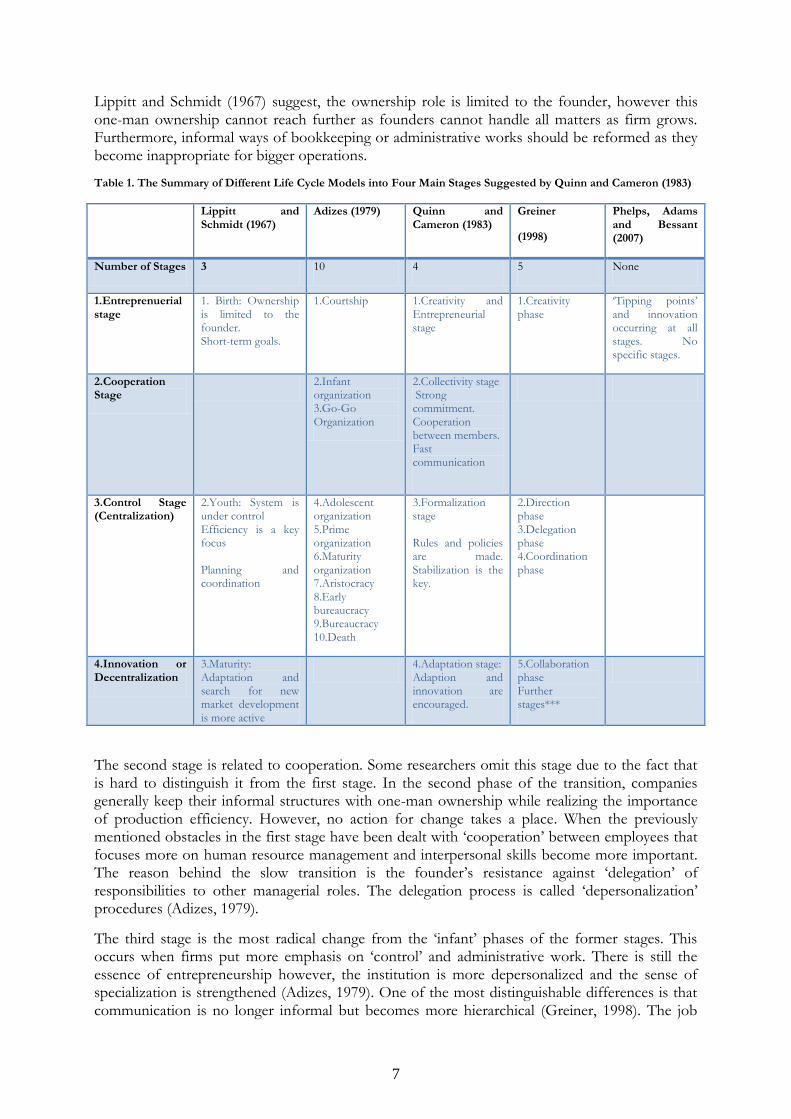
Table 1. The Summary of Different Life Cycle Models into Four Main Stages Suggested by Quinn and Cameron (1983)
Lippitt and Schmidt (1967)
Adizes (1979) Quinn and Cameron (1983)
Greiner
(1998)
Phelps, Adams and Bessant (2007)
Number of Stages 3 10 4 5 None
1.Entreprenuerial stage
1. Birth: Ownership is limited to the founder. Short-term goals.
1.Courtship
1.Creativity and Entrepreneurial stage
1.Creativity phase
‘Tipping points’ and innovation occurring at all stages. No specific stages.
2.Cooperation Stage
2.Infant organization 3.Go-Go Organization
2.Collectivity stage Strong commitment. Cooperation between members. Fast communication
3.Control Stage (Centralization)
2.Youth: System is under control Efficiency is a key focus Planning and coordination
4.Adolescent organization 5.Prime organization 6.Maturity organization 7.Aristocracy 8.Early bureaucracy 9.Bureaucracy 10.Death
3.Formalization stage Rules and policies are made. Stabilization is the key.
2.Direction phase 3.Delegation phase 4.Coordination phase
4.Innovation or Decentralization
3.Maturity: Adaptation and search for new market development is more active
4.Adaptation stage: Adaption and innovation are encouraged.
5.Collaboration phase Further stages***
The second stage is related to cooperation. Some researchers omit this stage due to the fact that is hard to distinguish it from the first stage. In the second phase of the transition, companies generally keep their informal structures with one-man ownership while realizing the importance of production efficiency. However, no action for change takes a place. When the previously mentioned obstacles in the first stage have been dealt with ‘cooperation’ between employees that focuses more on human resource management and interpersonal skills become more important. The reason behind the slow transition is the founder’s resistance against ‘delegation’ of responsibilities to other managerial roles. The delegation process is called ‘depersonalization’ procedures (Adizes, 1979).
The third stage is the most radical change from the ‘infant’ phases of the former stages. This occurs when firms put more emphasis on ‘control’ and administrative work. There is still the essence of entrepreneurship however, the institution is more depersonalized and the sense of specialization is strengthened (Adizes, 1979). One of the most distinguishable differences is that communication is no longer informal but becomes more hierarchical (Greiner, 1998). The job
8
between executives and lower-level managers are separated so that the functional level of production is divided from the decision making unit. Adizes (1979) describes this entering stage of the third level development as ‘adolescent organization’, implying that it is now one step closer to maturity leading to stabilization. He explains that at this stage, administrative effort rises at the expense of its entrepreneurial spirit as flexibility of interpersonal communication and decision making processes are hindered by more structured long-term priorities. The similar argument is presented in Greiner’s (1998) article that through the course of ‘centralization’, the structure becomes more restricted and rigid. It shows that the solution for the former state has become the limitation of the current stage.
The description of the last stage is rather vague. Despite the fact that the term, ‘maturity’ represents the stability of the organization, this cannot be the most desirable stage. Maturity is generally accompanied with ‘older’ and bigger size firms where both production and managerial structures are balanced. Adizes (1979) describes this stage as the most optimal stage for all firms where the growth rate peaks. However, there are many other interpretations on this stage. Phelps et al. (2007) claim that at the level of maturity, firms tend to have less failure level but then “it is younger and smaller firms, in particular exhibit the highest growth rates” (Phelps et al., 2007, p. 3). Thus maturity state might provide firms with market security but the high growth is no longer accompanied. They define the maturation as “a realization of the potential inherent in organizations”, emphasizing the importance of internal structure to it success but it is lacking external influences such as innovation. In the fourth level of development, many literatures claim that importance of innovation and adaptation. Firms must learn to regain the ‘creativity’ in order to sustain growth. One of the interesting aspects of this stage is that it demands firms to ‘de-specialization’. This seems like a reverse process however, it is not. It is a way of balancing the current efficiency oriented structure with a simple communication structure, encouraging fast and easy flow of information. Leadership style changes from a hierarchical to more collaborative and participative style. Greiner (1998) mentions ‘dual organizational structure’ as a future structure of firms, dividing tasks into habit structure, which deals with daily work and reflective structure, which promotes creativity.
2.2 Obstacles in Advancement
Each stage presents different sets of constraints, which are reflected in the current organizational structure. In this sub-section we study the obstacles more in detail. The first stage is the entrepreneurial stage. The main characteristics are its flexibility and entrepreneurial spirit. Thus its biggest limitations are originated from unorganized structure. Tasks are often distributed among the key members and there is no clear distinction between each department (Adizes, 1979). Overall, Team play is emphasized. Founders are very often struggling from a heavy workload as they have not yet reached a stage of ‘depersonalizing’ themselves from managerial roles (Adizes, 1979; Greiner 1998). At this stage, the conceptualized goals are realized therefore, it is in urgent need for capital. Financial maintenance and resource allocation are constantly challenged (Adizes, 1979; Greiner, 1998; Quinn and Cameron, 1983; Beverland and Lockshin, 2001; Phelps et al., 2007). All these setbacks lead to production inefficiency and thus a diminished growth rate.
In the second stage of the life cycle model, the most recognizable obstacle is to transform from the former flexible structure to a more controlled structure. At this stage, there are no significant changes made but only a brief realization of the need for a new structure suitable to control a bigger operation. Despite its high motivation to make a progress and sustain growth, it still has financial problems (Adizes, 1979) Furthermore, no long-term goals are established as they are ‘busy’ struggling for the survival. This is certainly an obstacle for them as long-term goals provide them with guidelines for further growth. It lacks in accessibility to reliable people, which coincides with the investigation conducted by the Swedish Agency for Economic and Regional
9
Growth (2011) in Appendix 1. Human resource management becomes a key issue in sustaining its success.
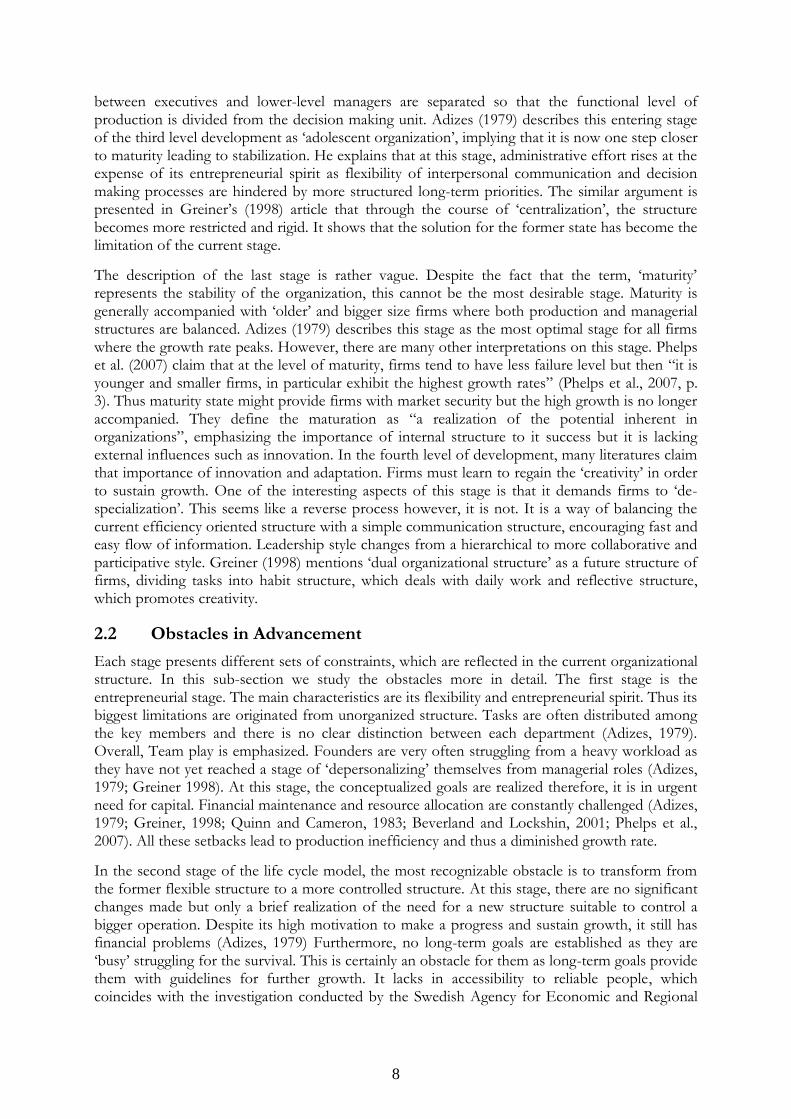
Table 2. Obstacles Presented in Each Stage of the Life Cycle Models
There is a distinguishable change in the third stage. The main constraint for firms in this stage is that they are too rigid to carry out fast communication. In fact, production efficiency has been achieved at the expense of flexibility in result; communication and creativity are harder to deliver as it is not a team-based structure anymore. There are different departments with its own specialization thus conflicting interests. It often works as barriers of recognizing any trouble in the business process (Adizes, 1979). As the structure becomes more hierarchical, there is less interaction between employees. Moreover, companies tend to focus on their focal product or service thus investing less into R&D. The main cause of diminished growth is companies’ fear of bringing new waves. Many previous researches reveal that when fast growing gazelles reach at
Stages Obstacles
Stage 1. Tasks are generally distributed in unorganized ways (The working
environment is generally frantic) (Adizes, 1979).
Informal structure leads to production inefficiency (Greiner, 1998).
There is heavy workload on founders (Adizes, 1979).
It struggles for capital and financial aids (Greiner, 1998).
Stage 2. Despite the fact that creativity and entrepreneurial spirit are diminished,
there are still no systemized regulations or procedures (Adizes, 1979).
It still struggles for capital or financial supports (Adizes, 1979).
The ownership is still concentrated on the founder and there is no
helping hand in management department (Adizes, 1979).
There are no established long-term goals (Adizes, 1979).
Company is inexperienced in financial records system (Adizes, 1979).
Stage 3. There is a higher possibility of break-up between partners(Adizes,
1979).
Formalized policies are diminishing fast communication (Adizes, 1979;
Greiner, 1998).
Administrative control is increased on the expense of creativity but the
structure is still ambivalent (Adizes, 1979; Greiner, 1998).
Less investment is put on R&D (Adizes, 1979).
Rigid structure undermines fast communication (Adizes, 1979).
Any recognized problems are hidden as the departments have
conflicting interests (Adizes, 1979).
It is more complicated to control diverse departments (Greiner, 1998).
Stage 4. Adaption and flexibility become the key issues for development, but it
requires times and investment (Greiner, 1998).
10
this stage, they lose the entrepreneurial spirit that is their focal competency in being outstanding performers (Adizes, 1979).
The last stage limitations are similar to the third stage obstacles. The obstacle here is that companies need to invest more time and effort in finding suitable structure for them to maintain both entrepreneurship and organized structure (Greiner, 1998).
However, we cannot simply look at the obstacles to identify what stage companies might belong to but also need to analyze company’s characteristics. Another way of interpreting firm’s competence with the organizational life cycle perspective is to study effectiveness, which we will explain further in the next section.
2.3 The Organizational Effectiveness and the Life Cycle Stages
One of our main purposes of the investigation is to find the relation between the current life cycle stage of a company and its effectiveness area. The study of organizational effectiveness has a long history as it is the core aspect of organizational analysis (Goodman and Pennigns, 1977). Many researchers have attempted to give an incorporative definition to the term ‘effectiveness’. However, as the methods of measuring the effectiveness vary to a great extent, there is no single definition that can explain all (Campbell, 1977; Steers, 1975). According to Quinn and Rohrbaugh (1983, p. 363), this might be because “effectiveness is not a concept but a construct” where construct requires a deeper understanding of a phenomenon with a high level of abstractions rather than conveying a simple implication through a specific event. However, in this research, we take the generally accepted terms of ‘effectiveness’, which is “maximization of return to the organization by all means” (Katz and Kahn, 1978, p. 225). Thus effectiveness criteria should be able to suggest us with the firm’s strengths in operation that that can initiate maximum profit with the given capital. These areas can differ according the firm’s organizational structure and maturity. Quinn and Cameron (1983) claim that these strengths can be categorized into four areas which we will soon describe. For the purpose of our study, we have adapted Quinn and Cameron’s (1983) criteria of organizational effectiveness, which is originally introduced by Quinn and Rohrbaugh (1983).
Quinn and Rohrbaugh (1983) attempt to combine former models of effectiveness studies into a single framework. Their motivation is to create a model that covers four areas of effectiveness depending on the degree of flexibility and control and other specified orientations. This is actually not a new concept as Scott (1977), Seashore (1979) and Cameron (1979) identified the three or four major models that categorize different effectiveness criteria. These four models are (1) Open System Model; (2) Rational Goal Model; (3) Internal Process Model; and (4) Human Relations Model. Each of these models suggest both strength and weakness of a firm’s organizational structure.
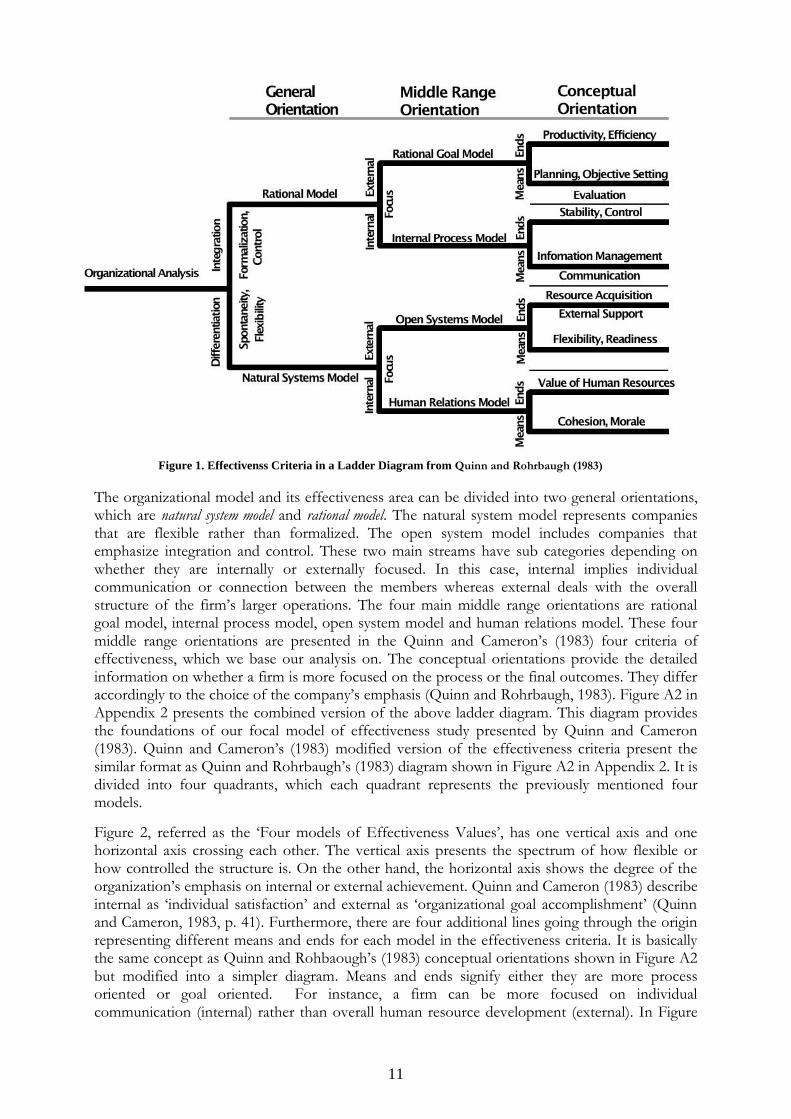
Figure 1 presents a simple diagram that sums up how Quinn and Rohrbaugh (1983) distinguish the four models based on the functional purposes of an organization.
11
The organizational model and its effectiveness area can be divided into two general orientations, which are natural system model and rational model. The natural system model represents companies that are flexible rather than formalized. The open system model includes companies that emphasize integration and control. These two main streams have sub categories depending on whether they are internally or externally focused. In this case, internal implies individual communication or connection between the members whereas external deals with the overall structure of the firm’s larger operations. The four main middle range orientations are rational goal model, internal process model, open system model and human relations model. These four middle range orientations are presented in the Quinn and Cameron’s (1983) four criteria of effectiveness, which we base our analysis on. The conceptual orientations provide the detailed information on whether a firm is more focused on the process or the final outcomes. They differ accordingly to the choice of the company’s emphasis (Quinn and Rohrbaugh, 1983). Figure A2 in Appendix 2 presents the combined version of the above ladder diagram. This diagram provides the foundations of our focal model of effectiveness study presented by Quinn and Cameron (1983). Quinn and Cameron’s (1983) modified version of the effectiveness criteria present the similar format as Quinn and Rohrbaugh’s (1983) diagram shown in Figure A2 in Appendix 2. It is divided into four quadrants, which each quadrant represents the previously mentioned four models.
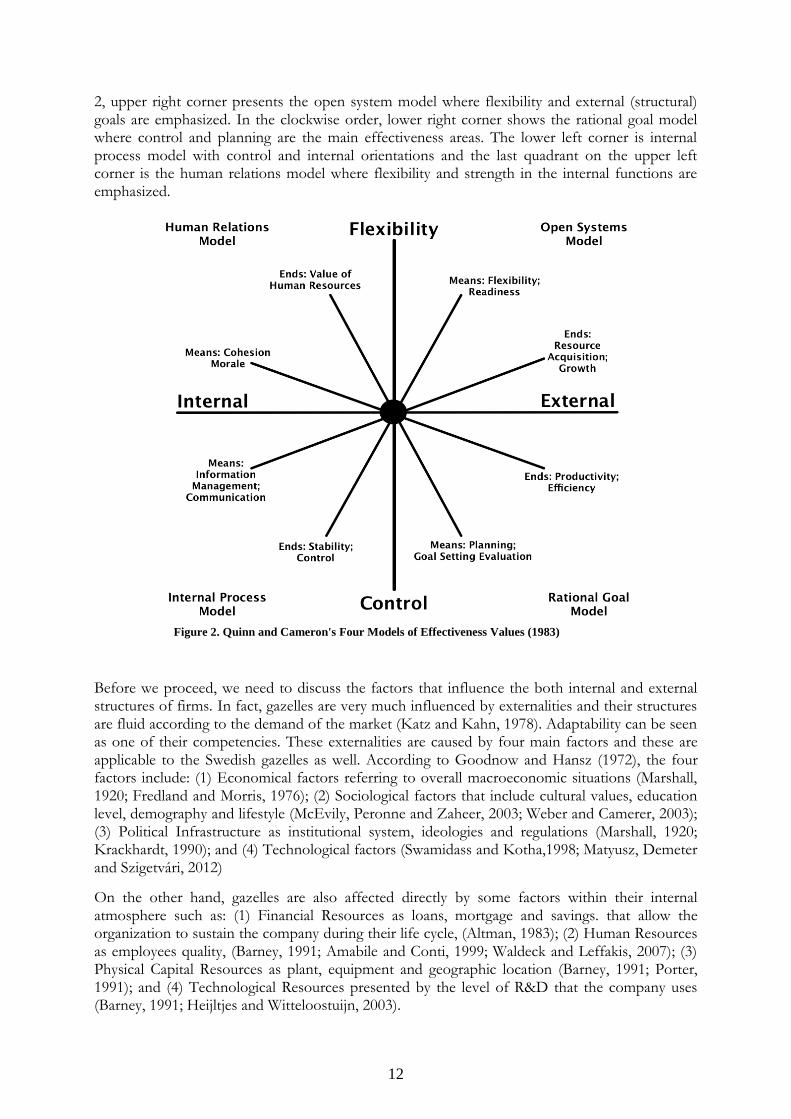
Figure 2, referred as the ‘Four models of Effectiveness Values’, has one vertical axis and one horizontal axis crossing each other. The vertical axis presents the spectrum of how flexible or how controlled the structure is. On the other hand, the horizontal axis shows the degree of the organization’s emphasis on internal or external achievement. Quinn and Cameron (1983) describe internal as ‘individual satisfaction’ and external as ‘organizational goal accomplishment’ (Quinn and Cameron, 1983, p. 41). Furthermore, there are four additional lines going through the origin representing different means and ends for each model in the effectiveness criteria. It is basically the same concept as Quinn and Rohbaough’s (1983) conceptual orientations shown in Figure A2 but modified into a simpler diagram. Means and ends signify either they are more process oriented or goal oriented. For instance, a firm can be more focused on individual communication (internal) rather than overall human resource development (external). In Figure
Figure 1. Effectivenss Criteria in a Ladder Diagram from Quinn and Rohrbaugh (1983)
12
2, upper right corner presents the open system model where flexibility and external (structural) goals are emphasized. In the clockwise order, lower right corner shows the rational goal model where control and planning are the main effectiveness areas. The lower left corner is internal process model with control and internal orientations and the last quadrant on the upper left corner is the human relations model where flexibility and strength in the internal functions are emphasized.
Before we proceed, we need to discuss the factors that influence the both internal and external structures of firms. In fact, gazelles are very much influenced by externalities and their structures are fluid according to the demand of the market (Katz and Kahn, 1978). Adaptability can be seen as one of their competencies. These externalities are caused by four main factors and these are applicable to the Swedish gazelles as well. According to Goodnow and Hansz (1972), the four factors include: (1) Economical factors referring to overall macroeconomic situations (Marshall, 1920; Fredland and Morris, 1976); (2) Sociological factors that include cultural values, education level, demography and lifestyle (McEvily, Peronne and Zaheer, 2003; Weber and Camerer, 2003); (3) Political Infrastructure as institutional system, ideologies and regulations (Marshall, 1920; Krackhardt, 1990); and (4) Technological factors (Swamidass and Kotha,1998; Matyusz, Demeter and Szigetvári, 2012)
On the other hand, gazelles are also affected directly by some factors within their internal atmosphere such as: (1) Financial Resources as loans, mortgage and savings. that allow the organization to sustain the company during their life cycle, (Altman, 1983); (2) Human Resources as employees quality, (Barney, 1991; Amabile and Conti, 1999; Waldeck and Leffakis, 2007); (3) Physical Capital Resources as plant, equipment and geographic location (Barney, 1991; Porter, 1991); and (4) Technological Resources presented by the level of R&D that the company uses (Barney, 1991; Heijltjes and Witteloostuijn, 2003).
Figure 2. Quinn and Cameron's Four Models of Effectiveness Values (1983)
13
The usefulness of this model lies in the fact that it is easy to use and it is aimed to evaluate younger organizations rather than older ones, which most former models have focused upon. According to Quinn and Cameron (1983), the importance of this model is that it combines all the aspects of all stages whereas former models have separate dimensions for each stage.
Nevertheless, there are limitations using this model for our empirical studies as this model is designed to show overall changes of effectiveness in each stage of life cycle whereas our empirical study will not provide long term observations.
In short, Figure 2 and Figure 2A suggest how we can identify a certain organization’s effectiveness model and their orientations. During the empirical analysis, we strictly follow the above model of Quinn and Cameron’s (1983) and categorized our survey questions according to them. We will explain this idea further in the empirical analysis.
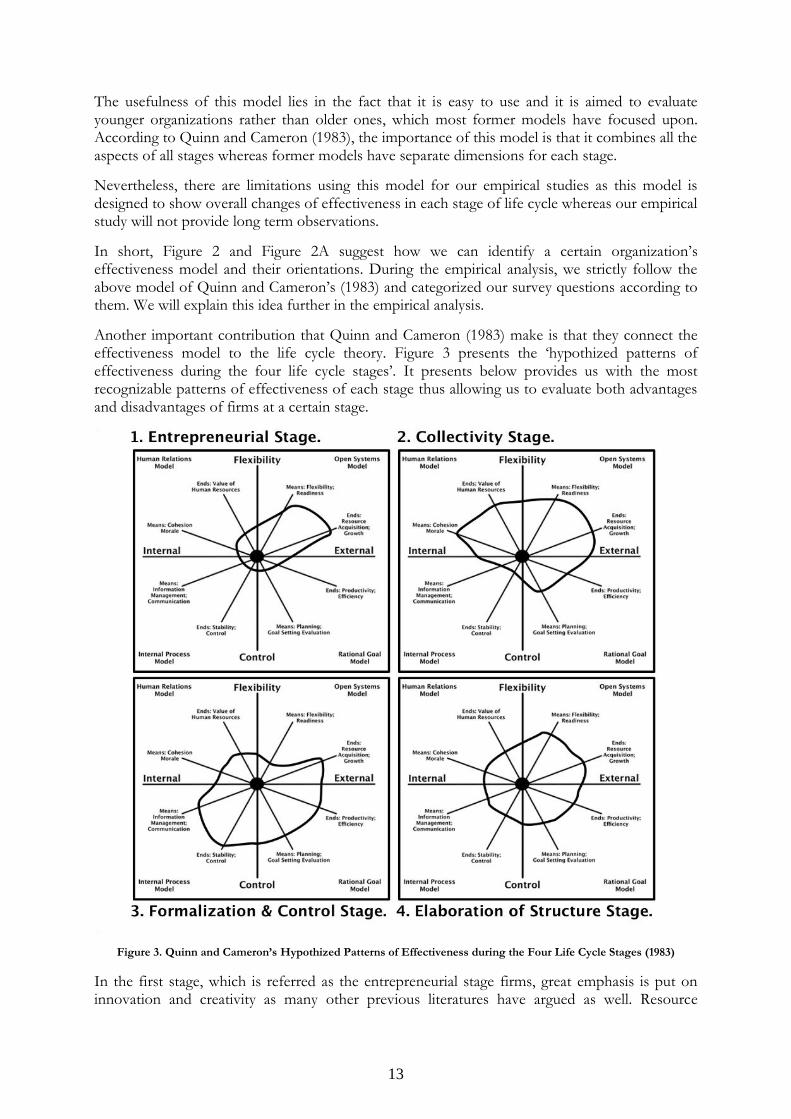
Another important contribution that Quinn and Cameron (1983) make is that they connect the effectiveness model to the life cycle theory. Figure 3 presents the ‘hypothized patterns of effectiveness during the four life cycle stages’. It presents below provides us with the most recognizable patterns of effectiveness of each stage thus allowing us to evaluate both advantages and disadvantages of firms at a certain stage.
Figure 3. Quinn and Cameron’s Hypothized Patterns of Effectiveness during the Four Life Cycle Stages (1983)
In the first stage, which is referred as the entrepreneurial stage firms, great emphasis is put on innovation and creativity as many other previous literatures have argued as well. Resource
14
acquisition is the key factor in boosting its growth and there is relatively very small attention put on the control side of the diagram. The importance of human resource is realized but only to a limited extent. This claim coincides with both Greiner (1998) and Adizes (1979), where they argue that the main purpose of a firm at this stage is to ‘survive’.
In the collectivity stage, the diagram is more spread out and there is a larger area for the effectiveness. Company maintains the essence of flexibility and entrepreneurship while expanding its competencies in human resource area. It implies that cooperation and high commitment of employees are crucial factors for growth.
In the third stage of formalization and control, the effectiveness values shift more towards control and stability rather than flexibility. Planning and coordination are the source of sustaining growth. High skill in administration work and systemized procedures provide them to maintain firm growth. It is both their advantage and disadvantage of being ‘regulated’ yet, at this stage, being in control and experiences gained through operation are important initiators of growth.
In the elaboration of structure stage, which is known to be the last stage in Quinn and Cameron’s life cycle model (1983), we can see a larger spread on the diagram. It is more centralized, balancing both flexibility and control. It is still somewhat similar to the second stage but there is more emphasis put on creativity and adaption.
We take this information into account as we analyze our survey outcomes. This model will help us to identify the gazelle companies’ effectiveness area and thereafter what states they are located in. Eventually, we will be able to observe any recognizable tendencies in the characteristics of these firms from the life cycle theory perspective. Any further information on the survey questions and analysis will be provided in the Empirical data and Analysis.
2.4 Reflection on the Organizational Life Cycle Models
Despite the important implications that the organizational life cycle models suggest, there are different reflections on the validity of the assumptions that the theory argues. The reader must acknowledge that we are fully aware of the concern and that we will try to reflect the following arguments when we construct the coming discussion.
The nature of the life cycle perspective is often debated on its strong assumptions on linearity of firm growth. It is hard to assume that all firms follow a homogeneous path and that the life cycle follows predetermined and sequential patterns. Phelps et al. (2007) explains that the core problem of this kind of studies is that complexity is reduced to show more uniform results. He states “like all classifications, the models represent reduction of large amount of complex, voluminous data into manageable chunks […] for sense-making through configuration or pattern recognition” and thus overlook the implications that are relatively small but reflect the heterogeneity (Phelps et al., 2007, p. 2). However, this can also be interpreted as that there is a certain level of validity of the life cycle theory as it captures the main stream and represents the “growth patterns of organizations in a systematic way” (Phelps et al., 2007).
Another concern related to the life cycle theory is that there are varieties of different models. Phelps et al. (2007) record that there are models with one to 33 stages, claiming the difficulties in incorporating their arguments. Also, it is hard to decide, which model is the most applicable as they use different research methods. There have been a few attempts along the way of the life cycle theory and they actually have succeeded in combing them into three or four main stages. For instance, Quinn and Cameron (1983) present “an integration of nine life cycle models” by
15
identifying the four major patterns between different models. These kinds of attempts allow researchers to categorize different models into a simpler format.
After all, there is no model that can comprehensively explain all internal and external factors related to the growth of organizations (Smallbone, Leigh and North, 2011). It is important that the reader realizes the difficulties of constructing such a comprehensive model. There is much room for improvement and more sophisticated empirical studies; however, the life cycle theory still poses many crucial aspects in the field of organizational growth.
16
3 Method
In this section, we introduce the methodology behind our investigation and the choice of sample companies within the given framework. We revisit the criteria of gazelles and the size of population of the gazelles. We provide the reasoning behind the chosen method and how this information is retrieved.
3.1 Research Approach
In order to investigate the effectiveness and the obstacles that gazelles face during their growth from the life cycle perspective, we construct a quantitative research based on survey questions. Through this approach, we aim to identify the current stages of the gazelles in the life cycle theory and thus recognize their model of the effectiveness criteria presented by Quinn and Cameron (1983).
Quantitative research generally intends to describe “attributes of interviewees” and distributions of these attributes in the population (Richards, 2005, p. 85). According to Richards (2005), quantitative and qualitative research methods differ in several ways. One of the most distinctive characteristics is that quantitative data often follows ‘predetermined categories’ whereas qualitative data is collected to ‘generate categories’. In other words, qualitative research method is used for inductive study in order to identify new patterns or to develop existing theories whereas quantitative method takes a deductive approach of testing the validity of a theoretical framework. In our case, we attempt to identify the distribution of already existing categories. Thus we find quantitative study suitable for our data collection.
A method we use within the field of quantitative research is survey. Survey “entails the collection of data on a number of units and usually at a single juncture in time, with a view to collecting systematically a body of quantifiable data in respect of a number of variables, which are then examined to discern patterns of associations.” (Bryman, 1989, p. 104). It is one of the most commonly used method in research studies as it is a quick and easy way to collect a vast amount of data (Bourque and Fielder, 2002). Before the supply of mass communication tools such as the internet and email system, most of the questionnaires including surveys were constructed with papers and pencils. However, it is more frequent that we use online surveys nowadays, which enable electronic data collection (Bourque and Fielder, 2002). There are many advantages and disadvantages of using survey methods. These advantages include efficient costs, large geographic coverage comparatively to in-person interviews, more chance of participation and time saving qualities. Simsek and Lubatkin (2005, p. 180) also agree that an online survey is a convenient way of collecting data, since it offers “faster data gathering, error-free data entry and lower costs”. Furthermore, it is an easy way to increase participation rate by allowing the respondent to answer at a time of convenience.
In our case, these are very much desirable qualities since we have to manage both time and resources in a convenient manner. Therefore, our main source of data collection is online surveys, which are self-administrated based on the theories and the focal models we have described in the previous section. As we will discuss later, our sample gazelles are distributed all around Sweden and they are not concentrated in a specific region. Therefore, the online survey technique is desirable for many reasons.
We are well aware of the limitations of online surveys such as sampling, order effects and lack of control over respondents (Bourque and Fielder, 2002). The sampling issue is one of the critical matters in survey techniques. If a surveyor does not have a complete list of its population, it is often very hard to say that the results from the chosen sample represent the whole population. Furthermore, most of the times online surveys are not conducted under the supervision of surveyors therefore; there are possibilities that respondents might answer the questions in
17
different orders than the surveyor intended. Also, there is a possibility of an unqualified respondent answering the questions instead of a targeted respondent (Bourque and Fielder, 2002). For our study, we try to reduce the possibilities by asking the respondents to notify their positions at the firms and the company name. The survey questions are not intended to be answered in a certain order therefore that is beyond our concern. However, our main concern is the validity of our sampling procedure and we will deal with this issue in the empirical data.
Our survey questions are presented both in Swedish and English in Appendix 3. Respondents are asked to complete the questions based on a likert scale and also leave comments for each question if necessary but the comments are not the main source of our data collection. There are a total of 30 questions and additional two questions are provided in the beginning to gather information on the company names and the respondents’ positions at the firms. Companies are allowed to remain as anonymous if they wish.
Even though we have constructed the questions based on the four stages of the life cycle theory and the attributes of four models of effectiveness criteria (open system model, rational goal model, internal process model and human relations model) presented in the theoretical framework, respondents are not provided with the background information on theories but they are only introduced with the purpose of the survey, which we have stated as the ‘study of fast-growing firms (gazelles) and their structural growth’.
3.2 Data Collection
The data collection is divided into two main sources, which are primary data and secondary data. Primary data collection is consisted of online surveys from the respondents of the gazelle companies and their comments. Secondary data is mainly collected from related previous studies, which provide us with the basics of the survey questions. Also, we have gathered information on the respondents’ financial performances and other related criteria in order to identify any common patterns between them.
3.2.1 Primary Data Collection: Surveys
Our survey consists of 30 questions based on prior research and theory. To serve the purpose of the research, we base the questions on both life cycle literatures and organizational effectiveness studies. The respondents are asked to answer based on a likert scale depending on how much they perceive the firm corresponds to the given attributes. It is important to explain that the survey responses can differ according to many external factors such as respondents’ perceptions, their positions and also their senses of responsibilities over the firm’s image. These factors are beyond our control however, we are aware of the limitations in the framework of surveys and will try to reflect this on our analysis.
Since the companies we have contacted are located in Sweden, all respondents are provided with Swedish survey questions in order to convey the exact meanings of our statements. Thus we attempt to avoid language barrier issues. Both the Swedish and English survey questions are presented in Appendix 3.
3.2.2 Secondary Data Collection: Theory interpretation
Our main source of secondary data is previous studies in the same field of our investigation. There are many organizational life cycle models and organizational effectiveness research therefore; we aim to overview the most crucial aspects of the studies. We are well aware of the difficulties in incorporating them in to a single theoretical framework as they are complex in their own manners and it is almost impossible to judge whether one theory is better than the other. Thus, we have tried to sum up repeatedly brought up arguments and fundamental ideas behind
18
them. We have focused our literature review on a certain number of studies in order to reduce any confusion. Furthermore, we have chosen a focal model, which we mostly use in constructing our analysis.
We make a use of annual reports and different websites that offer financial overviews of companies in order to present background knowledge on the respondents.
Last, we have gathered statistical information from the Swedish Agency for Economic and Regional Growth (Tillväxtverket), Dagens Industri, Svenskt Näringsliv and Statistiska Centralbyrån which is also referred as Statistics Sweden.
3.2.3 Choice of Method
In this study, we test several factors that show characteristics of gazelles in Sweden. In order to construct the investigation, we use several focal theoretical frameworks and arrange data collection accordingly. The quantitative data collection consists of the survey results from the targeted Swedish gazelles, where top managers from each company are asked to evaluate how much their firms correspond with the 30 attributes related to the organizational effectiveness and the life cycle stages. Our chosen method is online survey and to be more specific, it is a likert scale survey.
Prior to the 30 questions, respondents have to fill in three optional questions. These are the names of company, respondent’s job position and whether they are interested in reviewing the investigation afterwards. These questions are asked beforehand to gather information on the respondents and to account the respondents’ attributes in the survey analysis.
For the 30 questions we have constructed, respondents are asked to mark the scale of one to five depending on how much they perceive their firms match with the given statement. These scales signify the extent of their agreeableness to the given questions. A respondent can choose between the following scales on the survey questions: (1) Strongly disagree, (2) Disagree, (3) Neither agrees nor disagrees, (4) Agree and (5) Strongly agree. According to Fabrigar and Wood (2007, p. 537), likert scale are referred as the “method of summated ratings” which “consist of a set of statements (items) implying favorable or unfavorable reactions to the attitudinal object”.
This online likert scale survey is suitable to use as we require respondent’s perspective on whether his or her firm coincides with a certain characteristics of a life cycle stage. Furthermore, they are asked to make comments if necessary but these are not compulsory. We offer unified sets of questions for all companies despite their different characteristics in order to evaluate them according to the same criteria.
After the surveys are completed, they are automatically saved in our electronic data base where it is organized to reflect both individual and overall patterns of the respondents’ answers. All the answers are categorized based on the attributes of the four models, which will be presented in the analysis section.
3.3 Quantitative Study
Our quantitative study is based on the award winners of the DI’s gazelle competition 2012 (DI.se, 2012-10-01). There are a total of 678 Swedish firms1 verified as gazelles and our sample
1 The total number of the Swedish gazelles in 2012 is retrieved from Svenskt Näringsliv, a respected Swedish
financial newspaper.
19
consists of 26 firms among the 130 who have received the surveys. The validity and reliability issues are dealt in the following sub sections.
3.3.1 Choice of Sample
As we have previously mentioned in the introduction, there are many different definitions of gazelles and the criteria that they must fulfill. Some definitions mostly focus on the monetary terms of profit and others emphasis gazelles’ propensity to create jobs. In order to increase the reliability of our samples and to reduce the time to evaluate potential gazelles according to academic definitions of gazelles (which are not universal and sometimes rather vague), we have decided to use the DI’s gazelle award winners that have satisfied the DI’s criteria of gazelles. We should revisit the criteria in order to explain our choice of samples. The DI’s definitions of gazelles2 include the companies with:
An annual turnover exceeding 10 million SEK
At least ten employees
At least doubled its turnover, if you compare the first financial year of the evaluation to
the last financial year of the evaluation.
Increased sales every year for the past three years
An overall profit for the four financial years is positive
Essentially grown organically, not through acquisitions or mergers
Stable financial status
We have assumed that the winners, who have received the gazelle’s diplomas, have fulfilled the above criteria and that they have been verified by the DI’s team of experts. In order to make sure that all these criteria are met especially by our respondents, we have reviewed these criteria for all gazelles in Section 4. The DI’s criteria for gazelles can be perceived as reliable as they correspond greatly with academic definitions we have explained before.
During the several months of our investigation, we have asked 130 gazelles to fill in the online surveys for our study. Despite the confirmed number of total gazelles for the year 2012, which are 678, not all regions have published the winners yet (Svenskt Näringsliv, 2012-10-01). As of November, 2012, we have sent out the surveys to gazelles in the following six regions. These are:
- Halland
- Värmland
- Småland
- Skåne
- Jönköping
- Jämtland
Unfortunately, the response rate has only reached 20%, which is 26 gazelles that are located in the regions above. The low participation rate can be speculated from few of the replies we have received during the research. Many of them have answered that they do not enough time to do so. Our total number of the respondents accounts for approximately 4% of the total number of gazelles in Sweden. As we will present later in the empirical data, a variety of different industries have participated for the study. All the data is collected from an online survey provider, namely
2 These definitions are tranlsted from a Swedish article publisehd on Dagens Industri page on 23rd of October,
2012 (http://www.di.se/dagens-industri/di-gasell/).
20
SurveyMonkey (www.surveymonkey.com). It provides you with user friendly features that assist surveyors with different data processing methods at a fair price.
3.3.2 Significance of the Chosen Samples
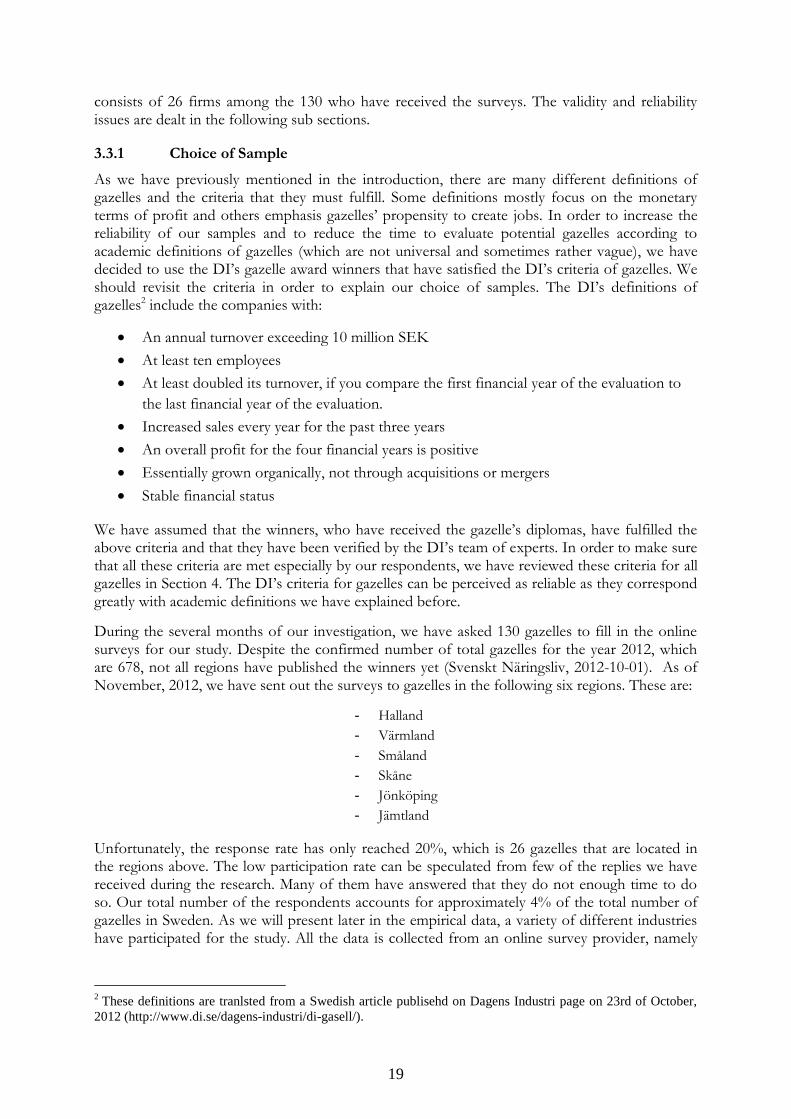
According to SCB (Statistiska Centralbyrån, 2012-11-16), there are a total number of 1,120,702 companies currently operating in the Swedish market as of 2011. Surprisingly, almost 99% of the companies are small-medium sized firms with the maximum of 49 employees as it is shown in Table 3. It is evident that these SMEs play a huge role in Swedish economy. Curran and Blackburn (2001) highlight the importance of research, targeting SMEs due to their great influence in the market.
Table 3. Distribution of Firms of Different Sizes in Sweden
It is inevitable to mention the importance of SMEs in our societies and since they contribute to the country’s competence to a great extent. Gazelles especially generate large profit as well as to initiate new ideas for company’s growth. Therefore, conducting a research about these outstanding performers is meaningful in many ways. It is important that we study the effectiveness of these fast growing firms because it can provide us with vital information on why some firms are more successful than others in sustaining high growth.
3.4 Reliability of the Research Method
Before we proceed on to the next section, it is important that we review the reliability of the research method and the chosen samples. As we have explained before, our research method has been chosen on the basis of the purpose of our investigation, which is to evaluate the validity of already existing models. However, there is a limitation in using quantitative research method for our investigation. Despite our effort of increasing the participation rate, the number of collected sample gazelles is rather small. Bourque and Fielder (2002) state that there is a limitation to the data collection if the surveyor does not have a complete list of their population. In our case, even though we were able to access the total number of gazelles, we could not access the full list of the Swedish gazelles since our research was constructed prior to the complete announcement of all gazelle award winners of 2012. Therefore, it is difficult to say that the results represent the whole population. However, we attempt to overcome the reliability issue by trying random sampling in order to reduce any bias results. Bouma and Atkinson (1995) contend that random sampling can significantly increase the reliability of the chosen samples.
Number of employees
Number of companies
Self-employed 841,559 1-4 196,493 5-9 41,429 10-19 21,551 20-49 12,411 50-99 3,699 100-199 1,663 200-499 1,007 500+ 890
21
“A random sampling procedure provides the greatest assurance that those selected are representative sample of the larger group”. Furthermore, we give the respondents with an option of staying anonymous if necessary which initiates more genuine answers (Shenton, 2004).
As we will discuss more in the empirical data, we receive answers from various industries reflecting a variety of different circumstances in these industrial areas. In addition we provide the reader with literature reviews which can portray the previous results of the studies which according to Shenton (2004) increases credibility of the research.
Last, we try to understand our shortcomings and reflect it on the analysis which will hopefully increase our conformability (Shenton, 2004).
22
4 Empirical Data
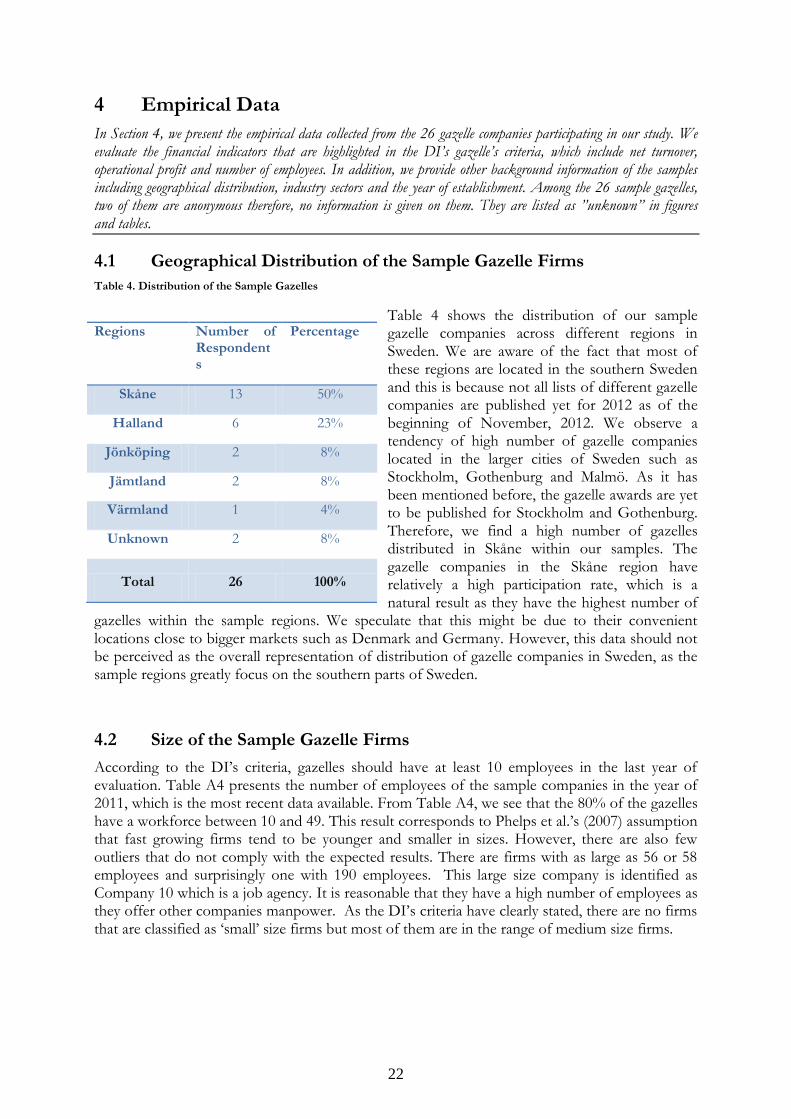
In Section 4, we present the empirical data collected from the 26 gazelle companies participating in our study. We evaluate the financial indicators that are highlighted in the DI’s gazelle’s criteria, which include net turnover, operational profit and number of employees. In addition, we provide other background information of the samples including geographical distribution, industry sectors and the year of establishment. Among the 26 sample gazelles, two of them are anonymous therefore, no information is given on them. They are listed as ”unknown” in figures and tables.
4.1 Geographical Distribution of the Sample Gazelle Firms
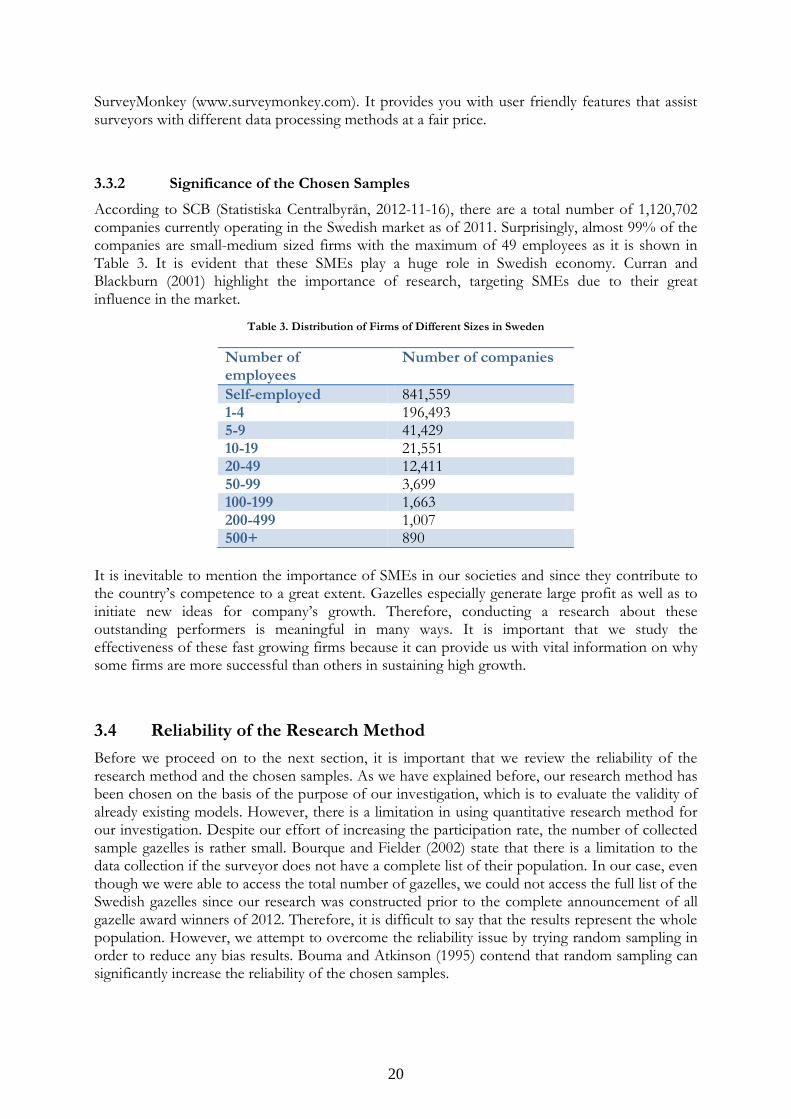
Table 4. Distribution of the Sample Gazelles
Table 4 shows the distribution of our sample gazelle companies across different regions in Sweden. We are aware of the fact that most of these regions are located in the southern Sweden and this is because not all lists of different gazelle companies are published yet for 2012 as of the beginning of November, 2012. We observe a tendency of high number of gazelle companies located in the larger cities of Sweden such as Stockholm, Gothenburg and Malmö. As it has been mentioned before, the gazelle awards are yet to be published for Stockholm and Gothenburg. Therefore, we find a high number of gazelles distributed in Skåne within our samples. The gazelle companies in the Skåne region have relatively a high participation rate, which is a natural result as they have the highest number of
gazelles within the sample regions. We speculate that this might be due to their convenient locations close to bigger markets such as Denmark and Germany. However, this data should not be perceived as the overall representation of distribution of gazelle companies in Sweden, as the sample regions greatly focus on the southern parts of Sweden.
4.2 Size of the Sample Gazelle Firms
According to the DI’s criteria, gazelles should have at least 10 employees in the last year of evaluation. Table A4 presents the number of employees of the sample companies in the year of 2011, which is the most recent data available. From Table A4, we see that the 80% of the gazelles have a workforce between 10 and 49. This result corresponds to Phelps et al.’s (2007) assumption that fast growing firms tend to be younger and smaller in sizes. However, there are also few outliers that do not comply with the expected results. There are firms with as large as 56 or 58 employees and surprisingly one with 190 employees. This large size company is identified as Company 10 which is a job agency. It is reasonable that they have a high number of employees as they offer other companies manpower. As the DI’s criteria have clearly stated, there are no firms that are classified as ‘small’ size firms but most of them are in the range of medium size firms.
Regions Number of Respondents
Percentage
Skåne 13 50%
Halland 6 23%
Jönköping 2 8%
Jämtland 2 8%
Värmland 1 4%
Unknown 2 8%
Total 26 100%
23
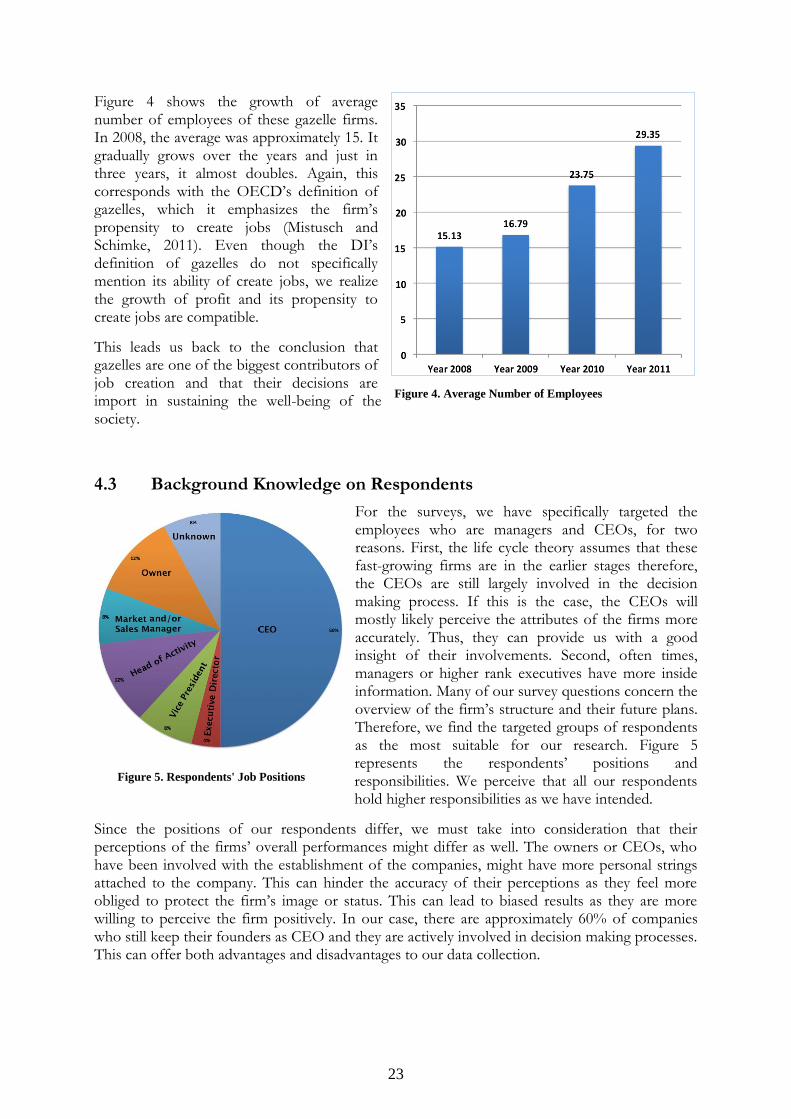
Figure 4 shows the growth of average number of employees of these gazelle firms. In 2008, the average was approximately 15. It gradually grows over the years and just in three years, it almost doubles. Again, this corresponds with the OECD’s definition of gazelles, which it emphasizes the firm’s propensity to create jobs (Mistusch and Schimke, 2011). Even though the DI’s definition of gazelles do not specifically mention its ability of create jobs, we realize the growth of profit and its propensity to create jobs are compatible.
This leads us back to the conclusion that gazelles are one of the biggest contributors of job creation and that their decisions are import in sustaining the well-being of the society.
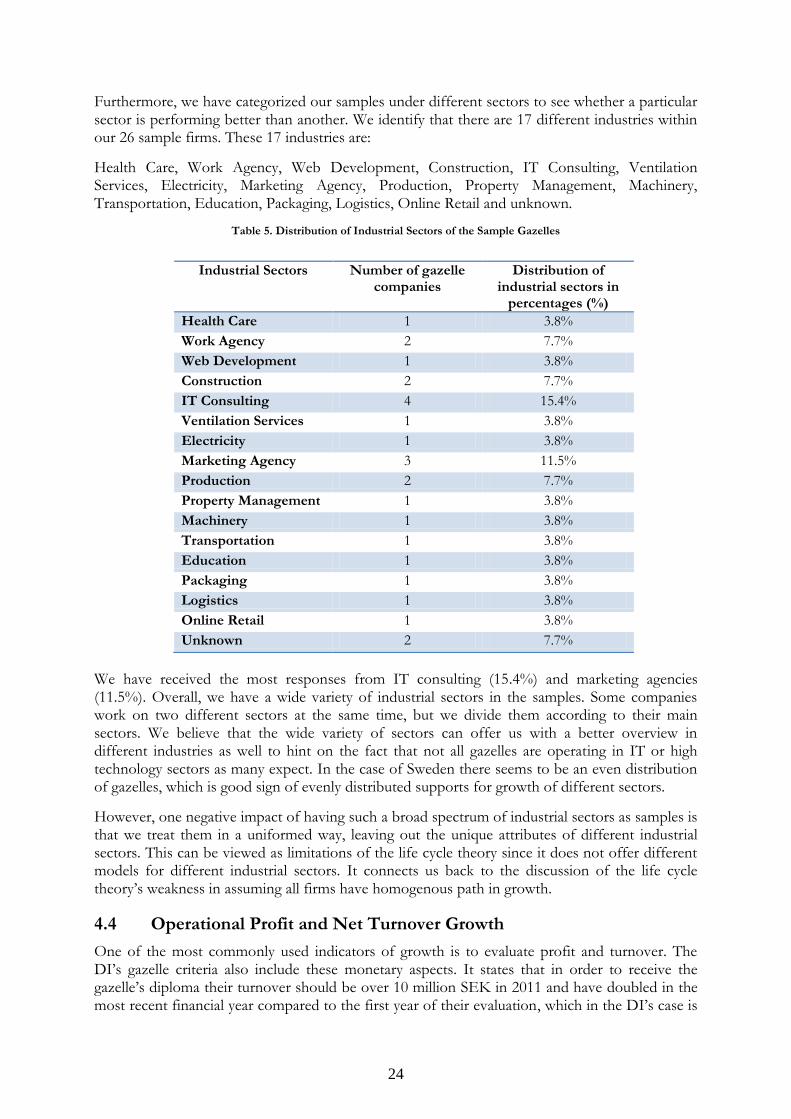
4.3 Background Knowledge on Respondents
For the surveys, we have specifically targeted the employees who are managers and CEOs, for two reasons. First, the life cycle theory assumes that these fast-growing firms are in the earlier stages therefore, the CEOs are still largely involved in the decision making process. If this is the case, the CEOs will mostly likely perceive the attributes of the firms more accurately. Thus, they can provide us with a good insight of their involvements. Second, often times, managers or higher rank executives have more inside information. Many of our survey questions concern the overview of the firm’s structure and their future plans. Therefore, we find the targeted groups of respondents as the most suitable for our research. Figure 5 represents the respondents’ positions and responsibilities. We perceive that all our respondents hold higher responsibilities as we have intended.
Since the positions of our respondents differ, we must take into consideration that their perceptions of the firms’ overall performances might differ as well. The owners or CEOs, who have been involved with the establishment of the companies, might have more personal strings attached to the company. This can hinder the accuracy of their perceptions as they feel more obliged to protect the firm’s image or status. This can lead to biased results as they are more willing to perceive the firm positively. In our case, there are approximately 60% of companies who still keep their founders as CEO and they are actively involved in decision making processes. This can offer both advantages and disadvantages to our data collection.
Figure 4. Average Number of Employees
Figure 5. Respondents' Job Positions
24
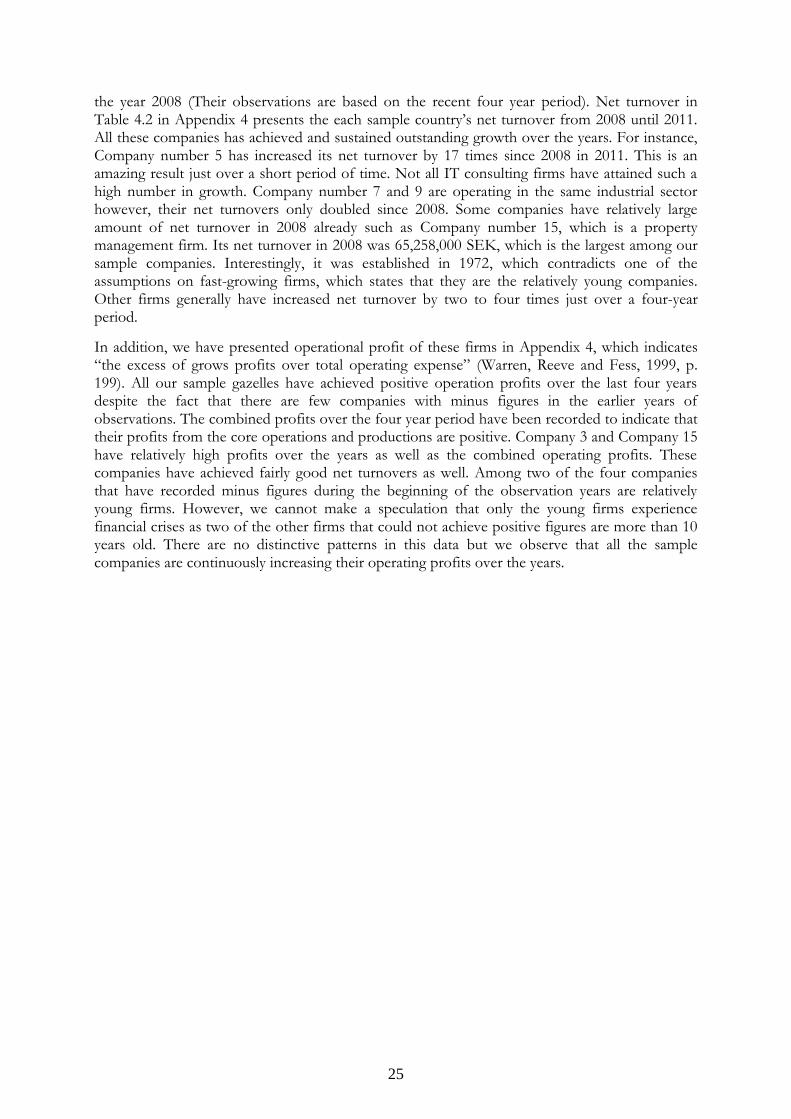
Furthermore, we have categorized our samples under different sectors to see whether a particular sector is performing better than another. We identify that there are 17 different industries within our 26 sample firms. These 17 industries are:
Health Care, Work Agency, Web Development, Construction, IT Consulting, Ventilation Services, Electricity, Marketing Agency, Production, Property Management, Machinery, Transportation, Education, Packaging, Logistics, Online Retail and unknown.
Table 5. Distribution of Industrial Sectors of the Sample Gazelles
We have received the most responses from IT consulting (15.4%) and marketing agencies (11.5%). Overall, we have a wide variety of industrial sectors in the samples. Some companies work on two different sectors at the same time, but we divide them according to their main sectors. We believe that the wide variety of sectors can offer us with a better overview in different industries as well to hint on the fact that not all gazelles are operating in IT or high technology sectors as many expect. In the case of Sweden there seems to be an even distribution of gazelles, which is good sign of evenly distributed supports for growth of different sectors.
However, one negative impact of having such a broad spectrum of industrial sectors as samples is that we treat them in a uniformed way, leaving out the unique attributes of different industrial sectors. This can be viewed as limitations of the life cycle theory since it does not offer different models for different industrial sectors. It connects us back to the discussion of the life cycle theory’s weakness in assuming all firms have homogenous path in growth.
4.4 Operational Profit and Net Turnover Growth
One of the most commonly used indicators of growth is to evaluate profit and turnover. The DI’s gazelle criteria also include these monetary aspects. It states that in order to receive the gazelle’s diploma their turnover should be over 10 million SEK in 2011 and have doubled in the most recent financial year compared to the first year of their evaluation, which in the DI’s case is
Industrial Sectors Number of gazelle companies
Distribution of industrial sectors in
percentages (%)
Health Care 1 3.8%
Work Agency 2 7.7%
Web Development 1 3.8%
Construction 2 7.7%
IT Consulting 4 15.4%
Ventilation Services 1 3.8%
Electricity 1 3.8%
Marketing Agency 3 11.5%
Production 2 7.7%
Property Management 1 3.8%
Machinery 1 3.8%
Transportation 1 3.8%
Education 1 3.8%
Packaging 1 3.8%
Logistics 1 3.8%
Online Retail 1 3.8%
Unknown 2 7.7%
25
the year 2008 (Their observations are based on the recent four year period). Net turnover in Table 4.2 in Appendix 4 presents the each sample country’s net turnover from 2008 until 2011. All these companies has achieved and sustained outstanding growth over the years. For instance, Company number 5 has increased its net turnover by 17 times since 2008 in 2011. This is an amazing result just over a short period of time. Not all IT consulting firms have attained such a high number in growth. Company number 7 and 9 are operating in the same industrial sector however, their net turnovers only doubled since 2008. Some companies have relatively large amount of net turnover in 2008 already such as Company number 15, which is a property management firm. Its net turnover in 2008 was 65,258,000 SEK, which is the largest among our sample companies. Interestingly, it was established in 1972, which contradicts one of the assumptions on fast-growing firms, which states that they are the relatively young companies. Other firms generally have increased net turnover by two to four times just over a four-year period.
In addition, we have presented operational profit of these firms in Appendix 4, which indicates “the excess of grows profits over total operating expense” (Warren, Reeve and Fess, 1999, p. 199). All our sample gazelles have achieved positive operation profits over the last four years despite the fact that there are few companies with minus figures in the earlier years of observations. The combined profits over the four year period have been recorded to indicate that their profits from the core operations and productions are positive. Company 3 and Company 15 have relatively high profits over the years as well as the combined operating profits. These companies have achieved fairly good net turnovers as well. Among two of the four companies that have recorded minus figures during the beginning of the observation years are relatively young firms. However, we cannot make a speculation that only the young firms experience financial crises as two of the other firms that could not achieve positive figures are more than 10 years old. There are no distinctive patterns in this data but we observe that all the sample companies are continuously increasing their operating profits over the years.
26
5 Analysis
As we have previously discussed in the theoretical framework, we use Quinn and Cameron’s (1983) four criteria of effectiveness and relate this model to the life cycle perspective. The survey questions we have conducted are divided into these four criteria as well as the four stages of entrepreneurial, collectivity, formalization and elaboration stages. The following analysis will lead us to a conclusive overview on identified stages of these gazelle companies and also the initiators behind their outstanding growth.
In the framework of Quinn and Cameron’s (1983) effectiveness model, there are four models that can elaborate the unique competencies of a company’s organizational structure. These four models include open system, goal oriented, internal process and human resource models. Each of them differs in their orientations. Some are more focused on flexibility than control and some prioritize internal and individual management rather than external and overall structures of operations. Initially, their orientations can differ depending on whether they put more emphasis on means (process) or ends (outcomes) of their productions.
Our model analysis takes three steps in concluding an organization’s attributes and the current stage of the life cycle model. First, we categorize the survey questions, which are originally conducted based on the implications given on the each stage of the four models in the life cycle theory, according to the characteristics of the previously mentioned effectiveness models. Second, we analyze how much these gazelle firms correspond to certain attributes in these models. Last, we conclude the stages of these gazelle firms by referring back to the theoretical framework and especially the diagram of ‘hypothesized patterns of the effectiveness model’. Once, we have identified the tendencies among these gazelle firms, we will further discuss their effectiveness as well as the obstacles they are likely to meet as they advance to the next stage in the life cycle model.
These survey results are derived from the 26 respondents of the gazelle’s competition winners in Sweden in 2012. There has been a random selection among them and they present varieties of industries and we do not focus on high technology sector as Quinn and Cameron (1983) have studied.
5.1 Open System Model
The main focus of the open system model is flexibility and external orientation. Its core goal is to acquire sufficient resources and utilize its adaptability in order to sustain growth. Most of the gazelles that are characterized by the open system model are in their early years of establishment. The open system model assumes that organizations are dynamic thus they are interactive and largely dependent on environmental factors (Katz and Kahn, 1978; Smith and Grimm, 1987). Our empirical study shows that many of the gazelles match the characteristics of the open system model.
From the survey results, approximately, 92% of the sample companies have answered that they have sufficient resources for short-term daily operations. This conveys deeper meaning that these companies show no struggle sustaining its operations except for the two cases where they have ‘disagreed’ to the statement. These two companies are from different sectors such as health care and marketing consulting sectors. There is no relation between them in other following questions. Despite their healthy finances, a few have commented on this issue. One company has commented that their stability (liquidity) depends on seasons, signifying that its financial status is not always guaranteed. Other firm states that “our industry has low margins therefore we must manage within a small budget”. This indicates that not all gazelles have escaped from such financial issues even though the majority has agreed that they have sufficient capital for daily
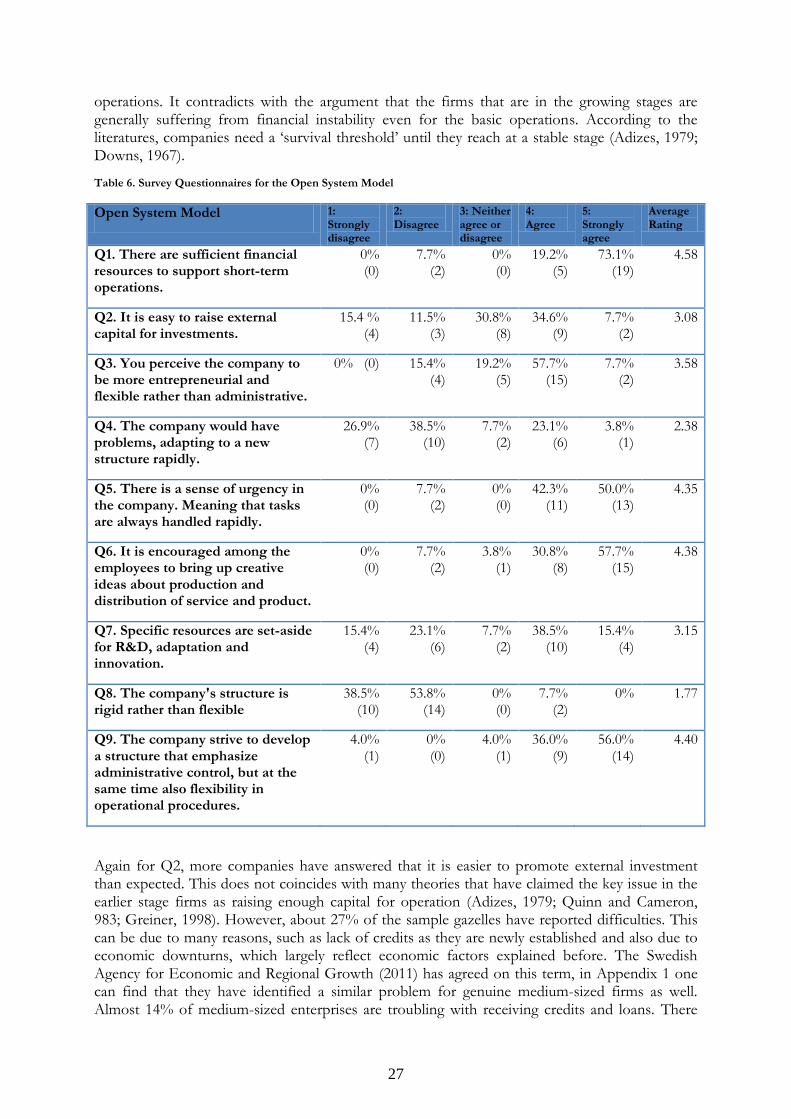
27
operations. It contradicts with the argument that the firms that are in the growing stages are generally suffering from financial instability even for the basic operations. According to the literatures, companies need a ‘survival threshold’ until they reach at a stable stage (Adizes, 1979; Downs, 1967).
Table 6. Survey Questionnaires for the Open System Model
Open System Model 1: Strongly disagree
2: Disagree
3: Neither agree or disagree
4: Agree
5: Strongly agree
Average Rating
Q1. There are sufficient financial resources to support short-term operations.
0% (0)
7.7% (2)
0% (0)
19.2% (5)
73.1% (19)
4.58
Q2. It is easy to raise external capital for investments.
15.4 % (4)
11.5% (3)
30.8% (8)
34.6% (9)
7.7% (2)
3.08
Q3. You perceive the company to be more entrepreneurial and flexible rather than administrative.
0% (0) 15.4% (4)
19.2% (5)
57.7% (15)
7.7% (2)
3.58
Q4. The company would have problems, adapting to a new structure rapidly.
26.9% (7)
38.5% (10)
7.7% (2)
23.1% (6)
3.8% (1)
2.38
Q5. There is a sense of urgency in the company. Meaning that tasks are always handled rapidly.
0% (0)
7.7% (2)
0% (0)
42.3% (11)
50.0% (13)
4.35
Q6. It is encouraged among the employees to bring up creative ideas about production and distribution of service and product.
0% (0)
7.7% (2)
3.8% (1)
30.8% (8)
57.7% (15)
4.38
Q7. Specific resources are set-aside for R&D, adaptation and innovation.
15.4% (4)
23.1% (6)
7.7% (2)
38.5% (10)
15.4% (4)
3.15
Q8. The company's structure is rigid rather than flexible
38.5% (10)
53.8% (14)
0% (0)
7.7% (2)
0% 1.77
Q9. The company strive to develop a structure that emphasize administrative control, but at the same time also flexibility in operational procedures.
4.0% (1)
0% (0)
4.0% (1)
36.0% (9)
56.0% (14)
4.40
Again for Q2, more companies have answered that it is easier to promote external investment than expected. This does not coincides with many theories that have claimed the key issue in the earlier stage firms as raising enough capital for operation (Adizes, 1979; Quinn and Cameron, 983; Greiner, 1998). However, about 27% of the sample gazelles have reported difficulties. This can be due to many reasons, such as lack of credits as they are newly established and also due to economic downturns, which largely reflect economic factors explained before. The Swedish Agency for Economic and Regional Growth (2011) has agreed on this term, in Appendix 1 one can find that they have identified a similar problem for genuine medium-sized firms as well. Almost 14% of medium-sized enterprises are troubling with receiving credits and loans. There
28
are many who have answered that they are unsure about the possibility to do so. Company number 3 states that “there is no need for it” so it answered ‘neither agree nor disagree’. Some companies contend that they refuse any risk capital and it depends on the kind of capitals that are offered. It shows the importance of the source of the external investment and that companies do not simply take them no matter how accessible they are. One of the companies answer that they try to limit their capital source to the banks, relying on the safe financial support. About 42% of the sample firms have agreed that it is easy to raise external investments. This result contradicts with the investigation on non fast-growing firms, which states one of the biggest obstacle is lack of financial accessibilities. We can speculate good financial support is one of its effectiveness that distinguishes fast-growing firms from non fast-growing firms.
Another important finding in our sample study is that the majority of the firms still have flexible structure as many of the literatures have predicted small and fast growing firms to be. They perceive their structures as flexible rather than administrative. It is important for gazelles to adjust themselves to the necessities of the market in order to fulfill the demand (Pfeffer, 1998). The interesting implication is that even few of the older firms that were established in the 1980s replied that they are rather flexible than administrative. Therefore, not all older and larger firms have to be administrative in order to achieve success. It is a contradicting result to what the life cycle predicts which states in order for firms to manage bigger operations; they must advance towards a more controlled system such as goal orientation model. There are many informative quotes we have received. Company number 4 which is a construction firm states that “as many quote, ‘paper’ is a necessary evil. In order to achieve entrepreneurship and flexibility, administrative base must be profound” (Company 4, Online Survey, 2012-11-06). Another firm also emphasized that they are “constantly struggling for balance” (Company 4, Online Survey, 2012-11-09). The implication is that these firms seem to agree with one of the fourth stage attributes of the life cycle theory. Whether they have already achieved the fourth stage, or are in the progress of doing so, is questionable. These companies clearly show the importance of balancing both structures in order to achieve high growth.
Even though the gazelles have previously answered that their organizations are characterized as flexible, approximately 23% of the gazelles perceive that if there is a need for change they will struggle to adapt into a new structure. Furthermore, Q8 emphasizes the flexibility in structure as the average rating on this question is 1.77, which is closer to disagreeing the fact that they are more rigid than flexible.
Other aspects of the questions have identified the similar patterns and most of the sample companies recognize themselves as rather flexible and creative. This is also something to do with the Swedish organizational culture where there is generally a flat structure where rather than a hierarchical structure (Kessler and Wong-MingJi, 2009). As Q6 shows, employees can freely bring in ideas for both production and distribution. Q7 and Q9 are the questions related to the fourth stage of the life cycle where the balance between administration and creativity is achieved. Interestingly, firms have confirmed that they specifically put aside R&D budget despite that they are expected to be in the first or the second stages of the life cycle. Furthermore, 20 companies out of 21 respondents have perceived that they are in the balanced state where they can handle adaptability with structure. At this stage, we have speculated the possibility of the gazelles in the fourth stage without specifically going through the third stage of the life cycle.
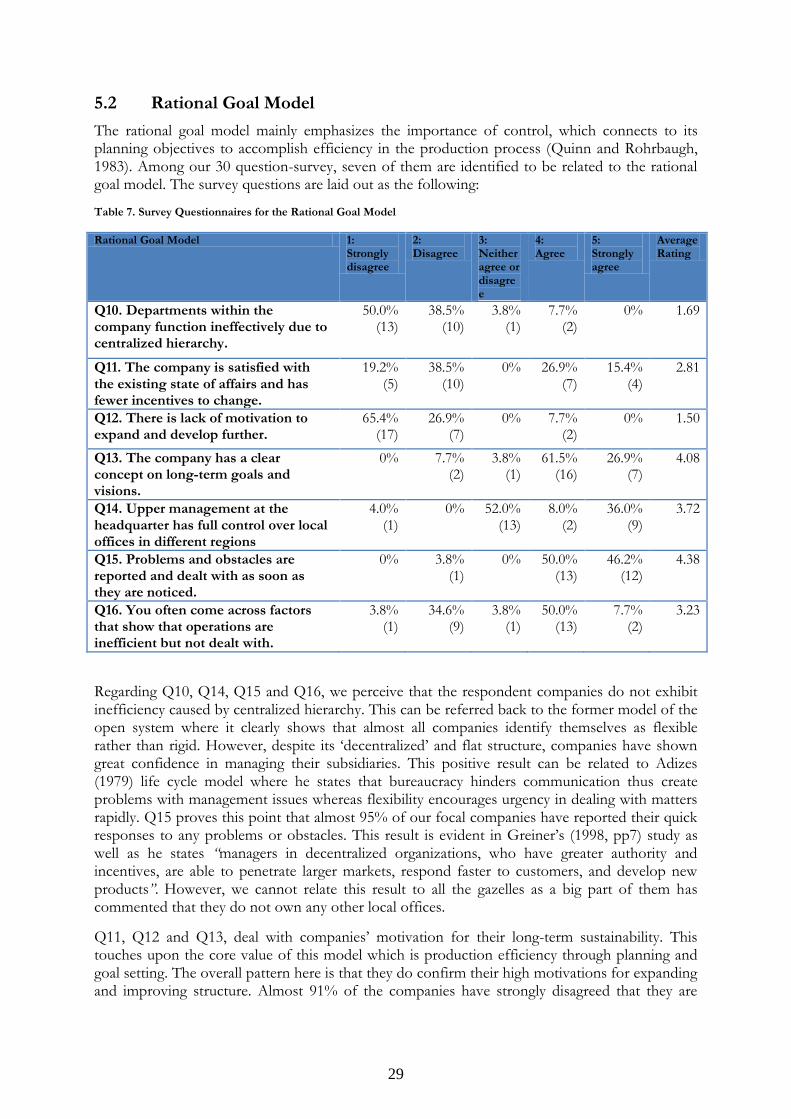
29
5.2 Rational Goal Model
The rational goal model mainly emphasizes the importance of control, which connects to its planning objectives to accomplish efficiency in the production process (Quinn and Rohrbaugh, 1983). Among our 30 question-survey, seven of them are identified to be related to the rational goal model. The survey questions are laid out as the following:
Table 7. Survey Questionnaires for the Rational Goal Model
Rational Goal Model 1: Strongly disagree
2: Disagree
3: Neither agree or disagree
4: Agree
5: Strongly agree
Average Rating
Q10. Departments within the company function ineffectively due to centralized hierarchy.
50.0% (13)
38.5% (10)
3.8% (1)
7.7% (2)
0% 1.69
Q11. The company is satisfied with the existing state of affairs and has fewer incentives to change.
19.2% (5)
38.5% (10)
0% 26.9% (7)
15.4% (4)
2.81
Q12. There is lack of motivation to expand and develop further.
65.4% (17)
26.9% (7)
0% 7.7% (2)
0% 1.50
Q13. The company has a clear concept on long-term goals and visions.
0% 7.7% (2)
3.8% (1)
61.5% (16)
26.9% (7)
4.08
Q14. Upper management at the headquarter has full control over local offices in different regions
4.0% (1)
0% 52.0% (13)
8.0% (2)
36.0% (9)
3.72
Q15. Problems and obstacles are reported and dealt with as soon as they are noticed.
0% 3.8% (1)
0% 50.0% (13)
46.2% (12)
4.38
Q16. You often come across factors that show that operations are inefficient but not dealt with.
3.8% (1)
34.6% (9)
3.8% (1)
50.0% (13)
7.7% (2)
3.23
Regarding Q10, Q14, Q15 and Q16, we perceive that the respondent companies do not exhibit inefficiency caused by centralized hierarchy. This can be referred back to the former model of the open system where it clearly shows that almost all companies identify themselves as flexible rather than rigid. However, despite its ‘decentralized’ and flat structure, companies have shown great confidence in managing their subsidiaries. This positive result can be related to Adizes (1979) life cycle model where he states that bureaucracy hinders communication thus create problems with management issues whereas flexibility encourages urgency in dealing with matters rapidly. Q15 proves this point that almost 95% of our focal companies have reported their quick responses to any problems or obstacles. This result is evident in Greiner’s (1998, pp7) study as well as he states “managers in decentralized organizations, who have greater authority and incentives, are able to penetrate larger markets, respond faster to customers, and develop new products”. However, we cannot relate this result to all the gazelles as a big part of them has commented that they do not own any other local offices.
Q11, Q12 and Q13, deal with companies’ motivation for their long-term sustainability. This touches upon the core value of this model which is production efficiency through planning and goal setting. The overall pattern here is that they do confirm their high motivations for expanding and improving structure. Almost 91% of the companies have strongly disagreed that they are
30
lacking in motivation to expand. Only with an exception of one case, they all show their enthusiasm in expanding further
Also, all companies have reported that they do have long-term goals, signifying they do not belong to the first stage of the life cycle where only the short-term goals are established for daily operation (Adizes, 1979). After all, they seem to be ‘process’ orientated where the process of achieving goals is highly emphasized as an effectiveness area. Phelps et al. (2007, p. 9) point out that it is critical for firm growth to move away from its ‘opportunistic’ short term view and adapt “focused strategy of targeting and accepting certain specified types of work and client”. Furthermore they argue that “high-growth firms tend to have a more structured approach to organizing their business and are more likely to have articulated strategy goals across a range of strategy possibilities” (Phelps et al., 2007, p. 9). Our empirical data certainly coincides with Phelps et al’s (2007) view on the causality between clear objective planning and high growth.
5.3 Internal Process Model
The Internal process model that is located to the bottom right in the ‘Four Models of Effectiveness Values’ characterized by internal, personal and communication-oriented processes that strive for stability and control (Quinn and Cameron, 1983). We asked our respondents to answer eight questions that are categorized in this model.
At first, we start by summarizing few implications about the opinions of the respondents for these four statements. We can see that the founders are still highly involved in most of the companies and in many cases also run the operations as the CEOs. From the survey result, we see that more than 92% of the gazelles have agreed to this statement except for the two cases where companies have disagreed commented that the founder is no longer alive or he is not a CEO but has taken his position as a chief board of directors. This means that almost all companies are still under the control of the founders either one way or another. This high percentage of the founders’ involvement seems somewhat related to the manager’s high workload signifying the possibility of ‘personalized leadership’. The survey supports the phenomenon of ‘one-person show’, which Adizes (1979) describes as the leader’s incapability of depersonalizing his or her control over the firm. Most of the founders in our sample companies are still actively participating in the decision making process despite their earlier answers on the fact that they have acquired skilled workers for their operations. The tendency of high work load for the managers/founders is clearly visible in all our respondents.
According to Phelps et al. (2007), challenges of handling staffs may arise as small firms grow in sizes and the founder cannot deal with employees exclusively any longer. Most of the companies, participating in our research, state that their founders are still active as CEOs while the size of the companies is still increasing. This complicates the ability of the founder to manage the employees directly (Phelps et al., 2007). Furthermore, Phelps et al. (2007, p. 8), suggest the issue of rapid growth and difficulties in employment as “issues of delegation, leadership, recruitment and training, compensation and workloads”. Hornsby, Kuratko, LaFollette, Hodgetts and Cox (1999) also stress the importance of proper people management at firms advance to a next level. In the life cycle theory, the repeatedly brought up argument is that the founder should be able to depersonalize him/herself from the management in order to bring in professional management to take on the business (Adizes, 1979; Cameron and Quinn, Greiner, 1998). However, from our study we notice that almost all of the gazelle companies still have founders operating as CEOs. This is an interesting outcome as this contradicts with many articles that suggest the importance of professional management in order to achieve successful outcomes.
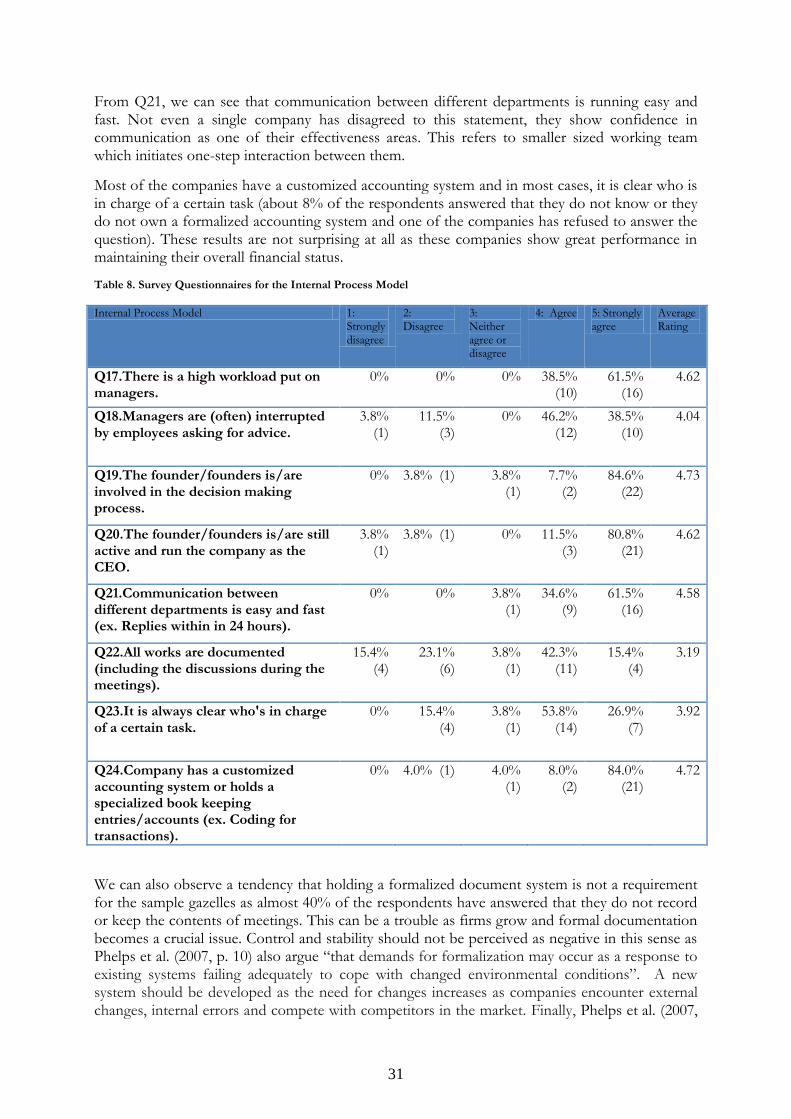
31
From Q21, we can see that communication between different departments is running easy and fast. Not even a single company has disagreed to this statement, they show confidence in communication as one of their effectiveness areas. This refers to smaller sized working team which initiates one-step interaction between them.
Most of the companies have a customized accounting system and in most cases, it is clear who is in charge of a certain task (about 8% of the respondents answered that they do not know or they do not own a formalized accounting system and one of the companies has refused to answer the question). These results are not surprising at all as these companies show great performance in maintaining their overall financial status.
Table 8. Survey Questionnaires for the Internal Process Model
Internal Process Model 1: Strongly disagree
2: Disagree
3: Neither agree or disagree
4: Agree 5: Strongly agree
Average Rating
Q17.There is a high workload put on managers.
0% 0% 0% 38.5% (10)
61.5% (16)
4.62
Q18.Managers are (often) interrupted by employees asking for advice.
3.8% (1)
11.5% (3)
0% 46.2% (12)
38.5% (10)
4.04
Q19.The founder/founders is/are involved in the decision making process.
0% 3.8% (1) 3.8% (1)
7.7% (2)
84.6% (22)
4.73
Q20.The founder/founders is/are still active and run the company as the CEO.
3.8% (1)
3.8% (1) 0% 11.5% (3)
80.8% (21)
4.62
Q21.Communication between different departments is easy and fast (ex. Replies within in 24 hours).
0% 0% 3.8% (1)
34.6% (9)
61.5% (16)
4.58
Q22.All works are documented (including the discussions during the meetings).
15.4% (4)
23.1% (6)
3.8% (1)
42.3% (11)
15.4% (4)
3.19
Q23.It is always clear who's in charge of a certain task.
0% 15.4% (4)
3.8% (1)
53.8% (14)
26.9% (7)
3.92
Q24.Company has a customized accounting system or holds a specialized book keeping entries/accounts (ex. Coding for transactions).
0% 4.0% (1) 4.0% (1)
8.0% (2)
84.0% (21)
4.72
We can also observe a tendency that holding a formalized document system is not a requirement for the sample gazelles as almost 40% of the respondents have answered that they do not record or keep the contents of meetings. This can be a trouble as firms grow and formal documentation becomes a crucial issue. Control and stability should not be perceived as negative in this sense as Phelps et al. (2007, p. 10) also argue “that demands for formalization may occur as a response to existing systems failing adequately to cope with changed environmental conditions”. A new system should be developed as the need for changes increases as companies encounter external changes, internal errors and compete with competitors in the market. Finally, Phelps et al. (2007,
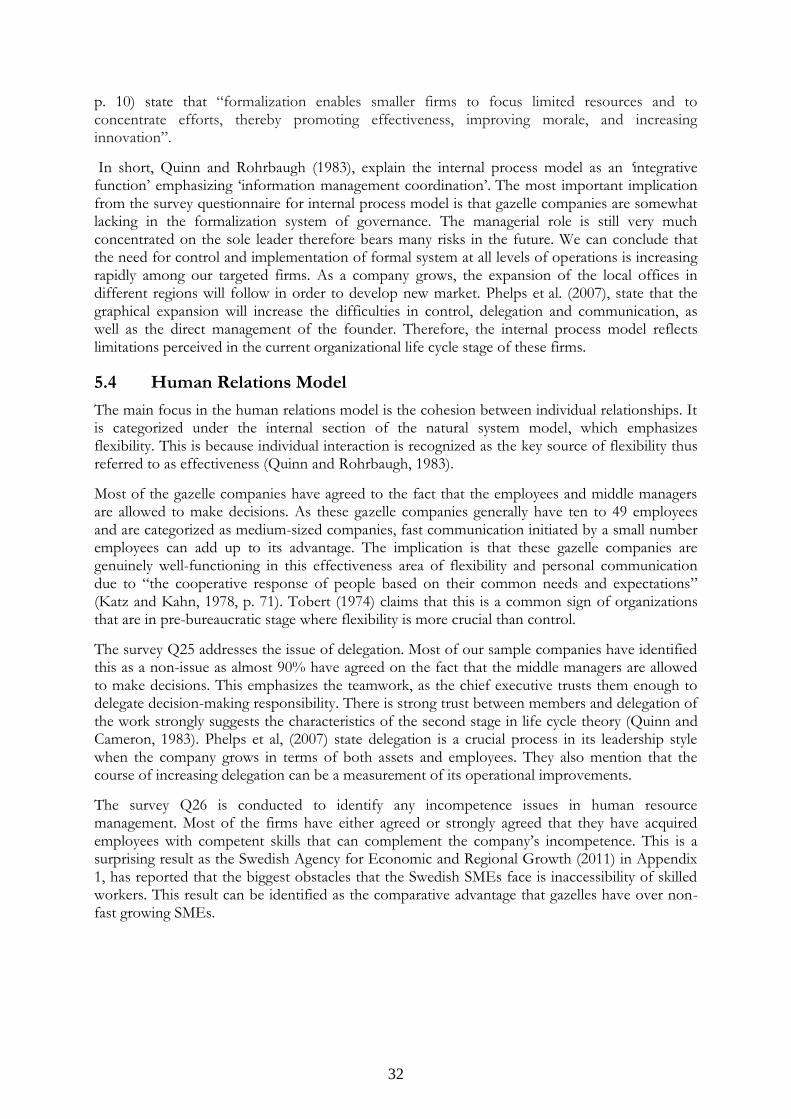
32
p. 10) state that “formalization enables smaller firms to focus limited resources and to concentrate efforts, thereby promoting effectiveness, improving morale, and increasing innovation”.
In short, Quinn and Rohrbaugh (1983), explain the internal process model as an ‘integrative function’ emphasizing ‘information management coordination’. The most important implication from the survey questionnaire for internal process model is that gazelle companies are somewhat lacking in the formalization system of governance. The managerial role is still very much concentrated on the sole leader therefore bears many risks in the future. We can conclude that the need for control and implementation of formal system at all levels of operations is increasing rapidly among our targeted firms. As a company grows, the expansion of the local offices in different regions will follow in order to develop new market. Phelps et al. (2007), state that the graphical expansion will increase the difficulties in control, delegation and communication, as well as the direct management of the founder. Therefore, the internal process model reflects limitations perceived in the current organizational life cycle stage of these firms.
5.4 Human Relations Model
The main focus in the human relations model is the cohesion between individual relationships. It is categorized under the internal section of the natural system model, which emphasizes flexibility. This is because individual interaction is recognized as the key source of flexibility thus referred to as effectiveness (Quinn and Rohrbaugh, 1983).
Most of the gazelle companies have agreed to the fact that the employees and middle managers are allowed to make decisions. As these gazelle companies generally have ten to 49 employees and are categorized as medium-sized companies, fast communication initiated by a small number employees can add up to its advantage. The implication is that these gazelle companies are genuinely well-functioning in this effectiveness area of flexibility and personal communication due to “the cooperative response of people based on their common needs and expectations” (Katz and Kahn, 1978, p. 71). Tobert (1974) claims that this is a common sign of organizations that are in pre-bureaucratic stage where flexibility is more crucial than control.
The survey Q25 addresses the issue of delegation. Most of our sample companies have identified this as a non-issue as almost 90% have agreed on the fact that the middle managers are allowed to make decisions. This emphasizes the teamwork, as the chief executive trusts them enough to delegate decision-making responsibility. There is strong trust between members and delegation of the work strongly suggests the characteristics of the second stage in life cycle theory (Quinn and Cameron, 1983). Phelps et al, (2007) state delegation is a crucial process in its leadership style when the company grows in terms of both assets and employees. They also mention that the course of increasing delegation can be a measurement of its operational improvements.
The survey Q26 is conducted to identify any incompetence issues in human resource management. Most of the firms have either agreed or strongly agreed that they have acquired employees with competent skills that can complement the company’s incompetence. This is a surprising result as the Swedish Agency for Economic and Regional Growth (2011) in Appendix 1, has reported that the biggest obstacles that the Swedish SMEs face is inaccessibility of skilled workers. This result can be identified as the comparative advantage that gazelles have over non-fast growing SMEs.
33
Table 9. Survey Questionnaires for the Human Relations Model
The second sets of questions from Q27 to Q29 presents cohesion issues that these firms are supposed to experience as they approach to the mature (bureaucratic) stage in the life cycle theory. These questions relate to the threat of owners’ separation as well as rivalry issues often identified in the third and fourth stages of the life cycle. Most of the companies have answered that these obstacles are irrelevant to them since there is no visible rivalry as far as they are concerned. Again, this addresses the strong team work and supports the hypothesis that fast-growing firms are generally in their first and second stage of the life cycle models (Adizes, 1979; Quinn and Cameron, 1983). Only one out of the 26 companies has reported a case where a manager left the company due to severe competition.
The last question sums up all the previous questions, emphasizing the fact that the team works in the gazelle companies are strongly exercised. All 26 companies have replied that they do have strong team work and that it reduces miscommunication between them. This result coincides with Quinn and Cameron’s (1983) expectations on the early stage companies. They suggest ‘informal communication and structure, a sense of family and cooperativeness among members and high member commitment’ are most recognizable in the first and second stages (Quinn and Cameron, 1983, p. 44).
Human Relations model 1. Strongly disagree
2. Disagree
3. Neither agree or disagree
4. Agree
5. Strongly agree
Average Rating
Q 25. Employees and middle managers are allowed to make decisions.
0% 7.7% (2) 3.8% (1) 46.2% (12)
42.3% (11)
4.23
Q26. The founder/founders is/are has managed to fill positions with employees that compliment his/her own lack of skills.
0% 15.4% (4)
3.8% (1) 42.3% (11)
38.5% (10)
4.04
Q27. There is risk of separation between stakeholders.
68.0% (17)
16% (4)
12.0% (3)
4.0% (1)
0% 1.52
Q28. There is rivalry between managers.
57.7% (15)
30.8% (8)
7.7% (2) 3.8% (1)
0% 1.58
Q29. People have left the company due to rivalry.
68.0% (17)
16.0% (4)
8.0% (2) 8.0% (2)
0% 1.56
Q30. Teamwork is strongly practiced within the company in order to decrease the level of miscommunication.
0% 0% 0% 26.9% (7)
73.1% (19)
4.73
34
5.5 Analysis of the Overall Tendencies
In the previous sections, we have reviewed the survey questions that are categorized under the four models of effectiveness criteria. The overall tendencies associated with these gazelle firms are their strong communications skills, high involvement of founders and flexibility of organizational structure. Most of the respondents have identified themselves with the open system model, the rational goal model and have shown great confidence in the attributes that are related to the human relations model. They perceive themselves as effective in communicating with different departments and that their small numbers of employees, which do not exceed the range of ten to 49, seem to influence the structure greatly. Many researchers argue that setting up small teams can be more effective and in our analysis, we also see a clear connection in that (Sundstrom, Meuse and Furtrell, 1990). Among the 26 sample gazelle companies, we have only observed 3 companies that have over 50 employees. Tornatzky (1986) claim new technologies allow firms to reduce the size of the work teams while exerting more responsibilities on them. However, not all small teams are successful but the “crucial ingredient of team viability has been found to be correlated with communication and conformity to group norms” (Sundstrom et al., 1990, p. 127). For the case of our samples, individual cohesion in the firm can be characterized as healthy and there is a high degree of trust and commitment among the team members. Despite the strong dependence on the founders and CEOs in decision making process, which indicates negative aspects of the leaders’ inability to depersonalize managerial roles, the majority of the companies have answered that their middle managers are allowed to make decisions, indicating that there is an essence of delegation among these firms. Smallbone, Leigh and North (2011, p. 60) claim the similar point in discussing the delegation issue. They argue that in order to achieve an extended period of success, leaders should be able to “delegate responsibility for operational tasks and focus more on planning and higher level strategic functions”. Unlike what many life cycle theorists argue, the founders’ involvement seems to support the strong commitment and work efficiency rather than hindering the work communication. Some form of delegation is present, balancing the sole decision making power of the ownership. Mature communication accompanied with fast and easy interaction seems to be a key issue in these fast-growing firms.
Concerning the survey outcomes on the founder’s strong influence over decisions can be related to commitment and task motivation of the entrepreneur. For the sample gazelles, almost all founders are either operating as CEOs or any other influential positions such as a chief of board of directors. Despite the both size and the age of the firms, they seem to be under the great influence of the entrepreneur supporting the Adizes’ (1979) phenomenon on ‘one-person show’ characteristics of venture firms. For instance, Adizes explains that the strong commitment of the owner only helps the firm in the very beginning stages of the establishment when the enterprise needs much attention in order to survive. As we have previously mentioned, many of the sample gazelles tend to have corresponding attributes to the human relations model. According to Quinn and Cameron (1983), the human relations model is associated with the stage 2 in the life cycle theory, which is referred as a ‘collectivity stage’. If this is the case, the high influence of the entrepreneurs in these gazelle firms should have been reflected through their performances or production inefficiency. Yet, for the chosen samples, we do not observe any negative signs initiated by the founders’ influence. In fact, Miner, Smith and Bracker (1989) claim that there is a strong correlation between the task motivation of entrepreneur and the firm’s growth. Most of our respondents who are CEO, vice CEO, chair of board of executives and owners, have shown their strong will to expand their firms. They strongly disagree with the phrase that they have lack of motivation to develop further and that they are currently operating under great workload. They have also given consents to the fact that there is a long term goal, which they are willing to pursue over the next coming years of their operations. These aspects portrait entrepreneur’s strong desire for self achievement, which is one of the aspects explained in the Miner et al.’s (1989) entrepreneur’s motivation and growth study. Furthermore, their willingness to innovate is
35
reflected well through their answers on Q7 where they report that they set specific budgets just for R&D. More than the half of the respondents agrees to this statement, indicating their efforts to keep up with constantly changing demands.
Flexibility is another main issue to the study of gazelles in relation to the life cycle theory. Many of the survey questions ask the respondents to evaluate firm’s flexibility and adaptability. Approximately, 58% agree that they are flexible rather than administrative and almost 8% claim that they strongly agree to the statement. Only four companies out of 26 have answered that they have more administrative structure. Quinn and Cameron (1983) contend the effectiveness of first and second stage companies are their flexibility and creativity. The definition of flexibility differs in many senses however, Golden and Powell (2000) gives an incorporative definition as the “capacity to adapt”. It is a commonly used term to evaluate organizational effectiveness (Steers, 1975). Flexibility might be associated with increased production costs as it implies diversity and creativity but as Golden and Powell (2000) portrait, flexibility is generally accepted as a positive term. Majority of our sample companies are operating in service sector and for them the ability to adapt fast according to customer’s needs are the major competencies they hold.
Other than the previously introduced major tendencies that lead us to the conclusion that gazelle firms are generally in their second stage of the life cycle model, there are several outliers that suggest the otherwise. Many companies report that they do not have any short-term financing issues. Furthermore, about half of the sample companies have answered that raising external investment is not hard for them, reflecting their confidence in financial capitals. The causality between their high profits and growth is unclear in the analysis as this is not the purpose of our investigation, however, these results seem rather surprising as many previous life cycle models suggest financial obstacles as the sign of the first and second stages. These outcomes contradict the results of the Swedish Agency for Regional Growth and Economic (2011) on non fast-growing SMEs in Appendix 1 that one of the most noticeable constraints for their growths are ‘access to loans and credit’, ‘access to external capital’ and ‘the company’s profitability’. These gazelles have relatively good financial status and these are certainly a comparative advantage that they have over genuine SMEs. Moreover, another interesting speculation is that these companies have shown the hint of the fourth stage, which is the ‘last’ stage of the Quinn and Cameron’s organizational life cycle. In this stage, firms should have attained balance between administration and flexibility. Despite the fact that the respondents have perceived their structures as flexible rather than administrative, there are many who have positively responded towards the goal oriented model attributes. For example, their R&D oriented perspectives and stabilized financial system indicate the combination of stage two and three in the life cycle theory. There are few constraints that these gazelle firms experience such as their incompetence in lack of formalized documentation system and decentralization of their managerial role, which show attributes of family business. These constraints will eventually hinder growth as they approach to the next stage of the life cycle theory.
However, not all companies follow the exact same patterns, which make the researchers hard formulate a uniformed model across different researches. According to the introduced tendencies above, we can speculate that many of the gazelle firms belong to the second stage of the organizational life cycle model. Their strongest effectiveness areas are human resource management followed by a positive cohesion between people, and their flexibility. We cannot overlook other attributes such as stabilized financial status as well as their efforts for research and development. We strongly believe that the mixture of these advantageous features distinguish them from non fast-growing gazelles however, it is hard to distinguish whether these gazelles fall under a one single category of the organizational life cycle stage. As we have previously discussed in Section 2.4, there are many other theories that counteract or complement the assumptions of the life cycle theory. Despite our attempt in finding a tendency in the effectiveness values of fast-
36
growing firms, there are many difficulties in explaining organization’s growth using one or two theories that we perceive are relevant. Heterogeneity is another crucial issue that complicates the use of the organizational life cycle theory. Smallbone et al. (2011) contend that the heterogeneity of firms can alter any basic assumptions we have on growing firms and influential factors that offer so many different outcomes of their performances. After all, conducting a comprehensive model on firm growth is almost impossible as there are many unexpected source of disturbances.
Organizational development theories such as organizational life cycle and organizational effectiveness are just small contributions in explaining firm’s growth (Smallbone et al., 2011). Externalities such as market trends, which bring out unanticipated winners are good examples of these circumstances. However, this should not be perceived as if the organizational life cycle theory has no usefulness. In fact, our data collection supports that these firms are in the second stage of the life cycle as many life cycle literatures claim young and fast growing firms to be. Also, the life cycle theory offers evaluation criteria of the effectiveness areas and future plans for operations in order to sustain growth.
37
6 Conclusion
The organizational life cycle theory and structural effectiveness describe the sequential stages of enterprise development and their competencies in the given life cycle stage. In the life cycle theory, firm growth is described as “linear, sequential, deterministic and invariant”, leading to the assumption that despite heterogeneity of firm’s internal and external factors, they tend to demonstrate similar growth pattern of “entrepreneurial”, “collectivity”, “control” and “elaboration” in consecutive order. Each stage has its own effectiveness and constraints that organizations have to deal with in order to advance to the next stage. The Swedish gazelles, as our subject of study, have been investigated regarding the life cycle stages of these outstanding performers and have identified their effectiveness in their organizational structure. In addition we attempt to predict possible restraints in the future when these firms reach the next level of advancement.
With the modified framework of Quinn and Cameron’s life cycle model and effectiveness’s criteria (1983) and several other academic studies within the field, we analyze the DI’s gazelle’s award winners and conclude with the following implications.
First, we conclude that our sample gazelle companies are in their earlier stages of the life cycle, namely the second stage referred as ’collectivity’. Firms that are in this stage can be characterized with the three key words, which are communication, commitment and flexibility. These gazelle firms have strong communication skills, not just between individuals but also on the organizational level, which initiate flexibility and adaptability. Team members are encouraged to suggest creative ideas and firms do not settle for the current organizational structure but majority of them strive to develop and motivate further in order to adapt. Nevertheless, there are few typical obstacles of the earlier model structures such as founder’s high involvement rather than bringing in new managerial roles however; this issue seems to be well-balanced with delegation among our respondents. Surprisingly, in the case of gazelles, founder’s motivation and commitment for growth are positively influencing the structure rather than portraying the ‘centralization’ issues where entrepreneurs cannot let go of all the responsibilities. In our case, founders’ motivation for growth suggests clearer long term goals and endurance of high workloads on managers.
Second, despite the conclusion drawn from the tendencies, we find that not all gazelles exhibit the attributes of the second stage in the life cycle model. There are many positive effectiveness attributes that the gazelles have identified themselves with that are not necessarily the aspects of the second stage. For instance, more than a half of the companies have agreed that they set a specific amount of budget for research and development. Also they do not have difficulties in raising necessary external capitals, which can work as comparative advantages over non fast-growing firms that have elaborated their difficulties in doing so. These attributes are more related the fourth stage of life cycle, which is referred as ‘elaboration and structure stage’. The harmony between administration and adaptability is already initiated and both systems complement each other’s operations in the few of the gazelle firms.
Third, these gazelle firms reflect the expected obstacles as the second stage firms. Despite their huge achievement in profit and turnover, many companies have reported the lack of formalized documentation system and problem addressing procedure. Almost 40% of the companies state that they do not document all works, including meetings and 57% of the firms have answered that there are inefficiency factors in operations which is not dealt with. In order for them to expand, these issues must be handled through either clear instructions or contingency plans. However, according to the life cycle theory, these are typical issues that the second stage firms experience before they advance to the next level of ‘control’ stage where their entrepreneurial
38
nature shifts to more administrative structure.
Lastly, we recognize the problems of addressing organizational structure and development through a single theory perspective. There is no comprehensive theory that can explain all internal and external factors and also how they interact to create varieties of different options (Smallbone et al., 2011). Yet, the organizational life cycle theory still shows validity in studying the firms’ growth despite its limitations. It suggests the level of organizational development and what it needs to improve in order to prepare for the up comings. It is a suitable theory to re-access their current issues.
In conclusion, we have investigated the effectiveness and future constraints of the Swedish gazelles from the life cycle perspective. The one final suggestion for them is to create a balance between flexibility and administration, which the final stage of the life cycle suggests. Constant elaboration and evolution are the keys to stay at the top of the situation. Flexibility, communication and strong motivations are their guidelines as they already possess the skills to utilize them as their comparative advantages.
6.1 Limitations and Suggestions for Further Research
As it has been briefly mentioned during the analysis, there are many limitations in explaining the growth of firms simply from the organizational life cycle theory perspective. It is not a comprehensive model that can deal with both internal and external factors however; this is not something that the life cycle theory suffers alone. In order to pursue a deeper analysis, one must utilize a combination of different models and be able to judge, which one is more applicable. Management theories in relation to life cycles do not take into consideration that companies coexist in different environments within different contexts and industries. Therefore, the applicability and validity of using the life cycle theory in the study of gazelles must be reviewed from multiple dimensions as these firms have particular abilities in growing in such a fast pace. Even though some authors suggest that the life cycle theory is more suitable than contingency theory for new and developing firms since “organizations must go through the first three stages in the developmental model before many of our conventional theories are appropriate”, development of new theories will do no harm in making profound ground for the gazelle studies with the life cycle theory (Quinn and Cameron, 1983, p. 50).
Furthermore, even though we believe that studying a variety of different industries is meaningful to certain ways, we must address the issue that maybe for further studies, it will be more interesting to construct studies segmenting different industrial sectors. In that case, we will be able to observe new patterns among them. Considering the sample, we observe another constraint that is the size of our sample. Even thought we have chosen them randomly among the published lists of the DI’s gazelle award winners, our sample size accounts for approximately 4% of the total number of gazelles in Sweden. The participation rate is also around 20% as we have asked 130 firms to participate and only 26 among them have replied. Thus, if one can access to a bigger population proportion, this will improve the research significantly. Furthermore, any complementing qualitative data will enhance the reliability as we have only received short comments due to lack of time and resources. Interview and direct observations can give more detailed information about strategies, behaviors, core business, organizational structure, decision making processes, culture and etc.
Finally, the last suggestion for further research is to conduct comparative studies between non fast-growing and fast-growing firms. Different case studies and their differed behaviors in advancing to the next level of the life cycle theory will be interesting to observe and identify the effectiveness of gazelles compared with the genuine SMEs.
39
List of References
Adizes, I. (1979). Organizational passages: diagnosing and treating lifecycle problems of organizations. Organizational Dynamics, 8(1), 3-25.
Altman, E. I. (1983). Corporate financial distress: A complete guide to predicting, avoiding and dealing with bankruptcy. New York: John Wiley & Sons, Inc.
Amabile, T. M., & Conti, R. (1999). Changes in the work environment for creativity during downsizing. Academy of Management Journal, 42(6), 630-640.
Barney, J. (1991). Firm resources and sustained competitive advantage. Journal of Management, 17(1), 99-120.
Beverland, M., & Lockshin, L. S. (2001). Organizational life cycles in small New Zealand wineries. Journal of Small Business Management, 39(4), 354–362.
Birch, D. L., Haggerty, A., & Parsons, W. (1995). Who’s creating jobs?. Boston: Cognetics Inc.
Bouma, G. D., & Atkinson, G. B. (1995). A handbook of social science research (2nd ed.). New York: Oxford University Press.
Bourque, L., & Fielder, E. (2002). How to conduct self-administered and mail surveys. California: SAGE Publications.
Bryman, A. (1989). Research methods and organization studies: Contemporary social research. London: Routledge.
Cameron, K. (1979). Evaluating Organizational Effectiveness in Organized Anarchies. Meetings of the Academy of Management.
Campbell, J. P. (1977). On the nature of organizational effectiveness. In Goodman, P. S., & Pennings, J. M. (Eds.), New perspectives on organizational effectiveness (pp. 13-55). San Francisco: Jossey-Bass.
Curran, J., & Blackburn, R. (2001). The need for small business research. In Curran, J., & Robert A. (Eds.), Researching the small enterprise (pp. 2-30). London: SAGE Publications, Ltd.
Dagens Industri. (2012). DI belönar snabbväxande företag. Retrieved September 21, 2012, from http://www.di.se/dagens-industri/di-gasell/
Downs, A. (1967). The life cycle of bureaus. In A. Downs (Ed.), Inside bureaucracy (pp. 296-309). San Francisco: Little, Brown and Company and Rand Corporation.
Fabrigar, L., & Wood, J. (2007). Likert Scaling. In Salkind, N., & Rasmussen, K (Eds.), Encyclopedia of measurement and statistics (First ed.). Retrieved from: http://srmo.sagepub.com.bibl.proxy.hj.se/view/encyclopedia-of-measurement-and-statistics/n255.xml
Fredland, E. J., & Morris, C. E. (1976). A Cross Section Analysis of Small Business Failure. American Journal of Small Business, 76(1), 7–18.
Golden, W., & Powell, P. (2000). Towards a definition of flexibility: in search of the Holy Grail?. Omega, 28(4), 373-384.
40
Goodman, P., & Pennings, J. (1977). New perspectives on organizational effectiveness. San Francisco: Jossey- Bass.
Goodnow, J.D., & Hansz, J.E. (1972). Environmental determinants of overseas market entry strategies. Journal of international Business Studies, 3(1), 33-50.
Greiner, L. (1998). Evolution and revolution as organizations grow. Harvard Business Review, 76(3), 55-68.
Heijltjes, M. G., & Van Witteloostuijn, A. (2003). Configurations of market environments, competitive strategies, manufacturing technologies and human resource management policies: A two-industry and two-country analysis of fit. Scandinavian Management Journal, 19(1), 31-62.
Hölzl, W. (2009). Is the R&D behaviour of fast-growing SMEs different? Evidence from CIS III data for 16 countries. Small Business Economics, 33(1), 59-75. Hornsby, J., Kuratko, D., LaFollete, W., Hodgetss, R., & Cox, L. (1999). A study of human resource practices and trends in US small businesses. In Annual conference of the United States Association for small business and entrepreneurship in San Diego: CA. Katz, D, & Kahn, R. (1978). Social Psychology of Organizations. New York: Wiley.
Kessler, E. H., & Wong-Mingji, D. J. (Eds.). (2010). Cultural mythology and global leadership. Cheltenham: Edward Elgar Publishing Limited.
Kirchhoff, B. A. (1977). Organization effectiveness: measurement and policy research. Academy of Management Review, 2, 347-355.
Krackhardt, D. (1990). Assessing the political landscape: Structure, cognition and power in organizations. Administrative Science Quarterly, 35(2), 342-369.
Levie, J., & Hay, M. (1998). Progress or just proliferation? A historical review of stages models of early corporate growth. London Business School Working Paper, 1-36.
Lippitt, G., & Schmidt, W. (1967). Crises in a developing organization. Harvard Business Review, 45(6), 102-112.
Marshall, A. (1920). Principles of Economics. London: MacMillan.
Matyusz, Z., Dementer, K., & Szigetvari, C. (2012). The impact of external market factors on the operational practices and performance of companies. Society and Economy, 34(1), 73-93.
McEvily, B., Peronne, B., & Zaheer, A. (2003). Trust as an organizing principle. Organization Science, 14(1), 91-103.
Miner, J., Smith, N., & Bracker, J. (1989). Role of entrepreneurial task motivation in the growth of technologically innovative firms. Journal of Applied Psychology, 74(4), 554-560.
Mitusch, K., & Schimke, A. (2011). Gazelles: high-growth companies (Research Report No. 05.4). Retrieved from European Commission: http://ec.europa.eu/enterprise/policies/innovation/files/proinno/gazelles-final-report_en.pdf
41
Pfeffer, J. (1998). Seven practices of successful organizations. California Management Review, 40, 5-34. Phelps, R., Adams, R., & Bessant, J. (2007). Life cycles of growing organizations: A review with implications for knowledge and learning. International Journal of Management Reviews, 9, 1, 1-30. Porter, M. (1980). Competitive strategy: techniques for analyzing industries and competitors. New York: The Free Press.
Porter, M. E. (1991). Towards a dynamic theory of strategy. Strategic Management Journal, 12, 95-78.
Quinn R., & Rohrbaugh, J. (1983). A spatial model of effectiveness criteria - towards a competing values approach to organizational analysis. Management Science, 29, 363-377.
Quinn, R., & Cameron, K. (1983). Organizational life-cycles and shifting criteria of effectiveness: some preliminary evidence. Management Science, 29, 33-51.
Richards, L.(2005). Handling Qualitative Data: A Practical Guide. London: Sage Publications.
Scott, W. R. (1977). Effectiveness of organizational effectiveness studies. In Goodman, P. S., & Pennings, J. M. (eds.), New Perspectives on Organizational Effectiveness. San Francisco: Jossey-Bass.
Seashore, S. E. (1979). Assessing organizational effectiveness with reference to member needs. Meetings of the Academy of Management.
Shenton, A. K. (2004). Strategies for ensuring trustworthiness in qualitative research projects. Education For Information, 22(2), 63-75.
Simsek, Z., Veiga, J., & Lubatkin, M. (2005). Challenges and guidelines for conducting internet-based surveys in strategic management research. In Ketchen, D., & Bergh, D. (Eds), Research methodology in strategy and management (2, pp. 179-196). Emerald Group Publishing Limited.
Smallbone, D., Leig, R., & North, D. (1995). The characteristics and strategies of high growth SMEs. International Journal of Entrepreneurial Behavior & Research, 1, 44-62.
Smith, K., & Grimm, C. (1987). Environmental variation, strategic change and firm performance: A Study of railroad deregulation. Strategic Management Journal, 8(4), 363-376.
Statistiska Centralbyrån. (2012). Företagsdatabasen (FDB). Retrieved October 15, 2012, from http://www.scb.se/Pages/Product____299123.aspx
Steers, R. M. (1975). Problems in the measurement of organizational effectiveness. Administrative Science Quarterly, 20(4), 546-558.
Sundstrom, E., Meuse, K., & Furtrell, D. (1990). Work teams: applications and effectiveness. American Psychologists, 42(2), 120-133.
SurveyMonkey. (2012). Templates for conducting a survey. Retrieved November 5, 2012, from http://sv.surveymonkey.com/mp/survey-templates/
Svenskt Näringsliv. (2012). Kraftig ökning av antalet gasellföretag i värmland. Retrieved October 15, 2012, from http://www.svensktnaringsliv.se/regioner/karlstad/kraftig-okning-av-antalet-gasellforetag-i-varmland_171030.html
42
Swamidass, P. M., & Kotha, S. (1998): Explaining Manufacturing Technology Use, Firm Size and Performance Using a Multidimensional View of Technology. Journal of Operations Management, 17(1), 23–37.
Tillväxtverket. (2011). Survey of Swedish SMEs: Företagens villkor och verklighet 2011. Retrieved October 21, 2012, from http://www.tillvaxtverket.se/download/18.3c075973137a2e9d3a825e/Opportunities+and+obstacles+to+growth+in+Swedish+SMEs.pdf
Tornatzky, L.G. (1986). Technological change and the structure of work. In Pallak, M. S., & Perloff, R. (Eds.), Psychology and work (pp. 89-136). Washington, DC: American Psychological Association.
Waldeck, N. E., & Leffakis, Z. M. (2007). HR Perceptions and the Provision of Workforce Training in an AMT Environment: An Empirical Study. The International Journal of Management Science , 35(2), 161–172.
Warren, C., Reeve, J., & Fess, P. (1999). Accounting for merchandising business: Financial and managerial accounting (6 ed.). Cincinnati: South- Western College Publishing.
Weber, R. A., & Camerer, C. F. (2003). Cultural conflict and merger failure: An experimental approach. Management Science Journal, 49(4), 400-415.
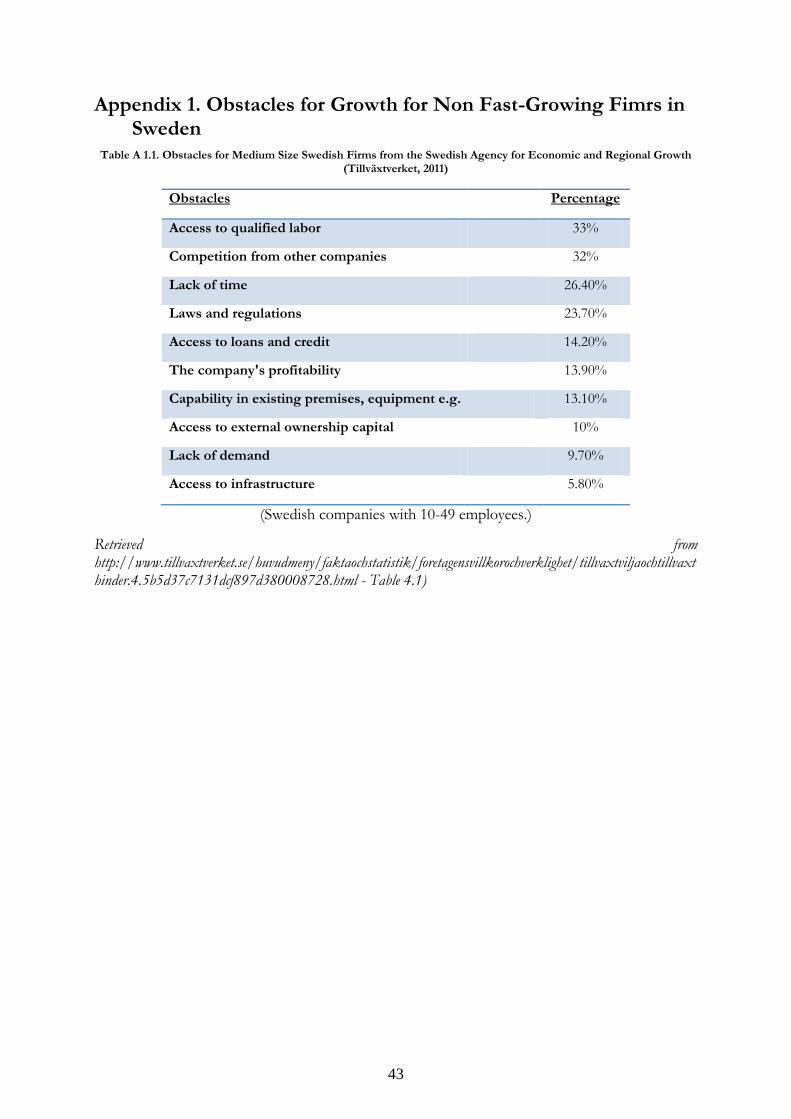
43
Appendix 1. Obstacles for Growth for Non Fast-Growing Fimrs in Sweden
Table A 1.1. Obstacles for Medium Size Swedish Firms from the Swedish Agency for Economic and Regional Growth (Tillväxtverket, 2011)
Obstacles Percentage
Access to qualified labor 33%
Competition from other companies 32%
Lack of time 26.40%
Laws and regulations 23.70%
Access to loans and credit 14.20%
The company's profitability 13.90%
Capability in existing premises, equipment e.g. 13.10%
Access to external ownership capital 10%
Lack of demand 9.70%
Access to infrastructure 5.80%
(Swedish companies with 10-49 employees.)
Retrieved from http://www.tillvaxtverket.se/huvudmeny/faktaochstatistik/foretagensvillkorochverklighet/tillvaxtviljaochtillvaxthinder.4.5b5d37c7131dcf897d380008728.html - Table 4.1)
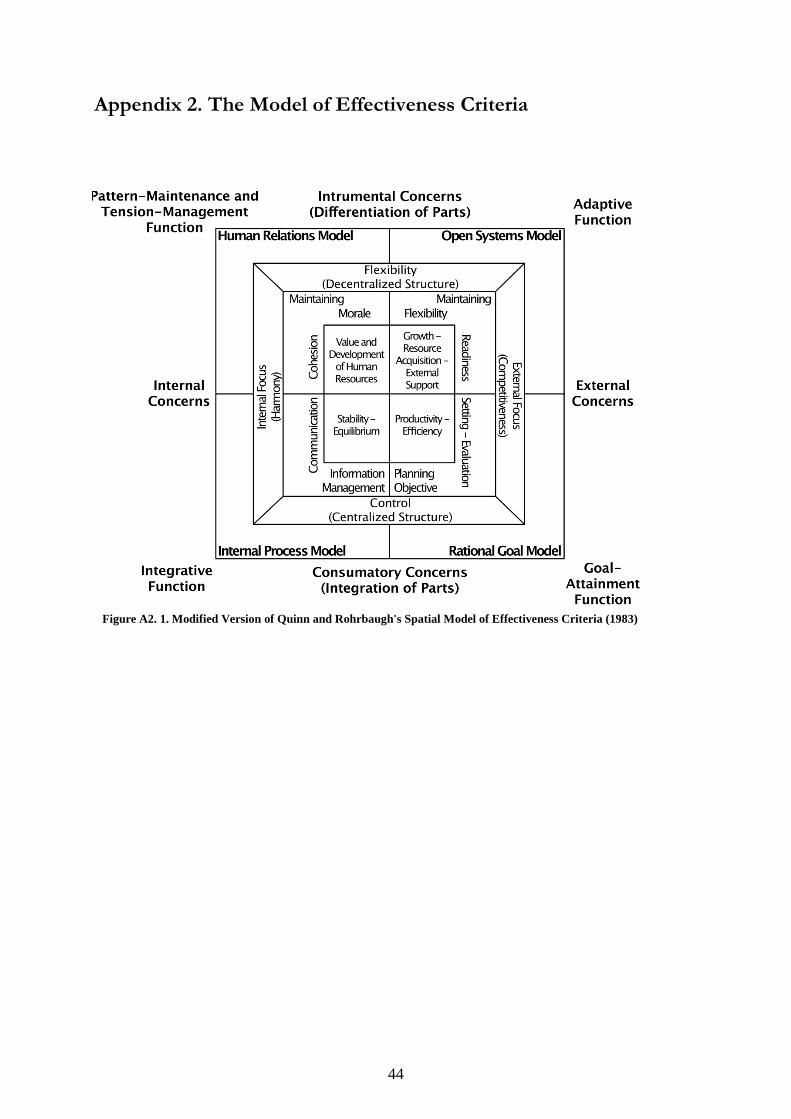
44
Appendix 2. The Model of Effectiveness Criteria
Figure A2. 1. Modified Version of Quinn and Rohrbaugh's Spatial Model of Effectiveness Criteria (1983)
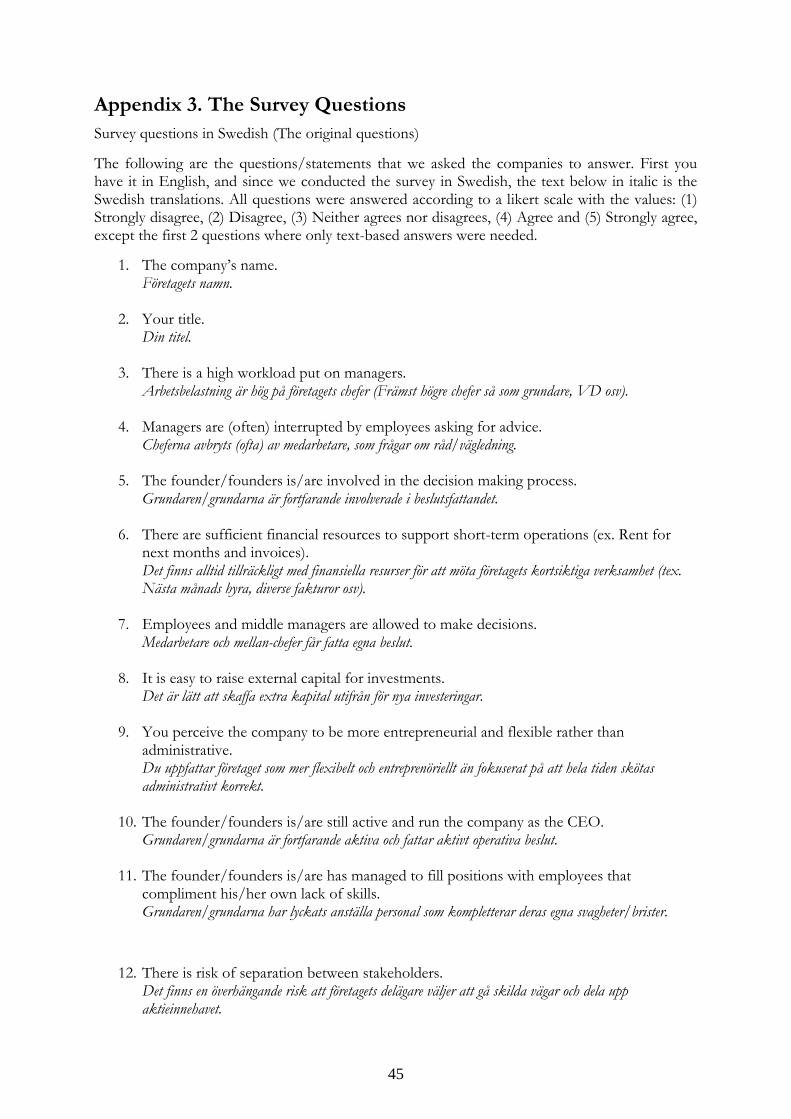
45
Appendix 3. The Survey Questions
Survey questions in Swedish (The original questions)
The following are the questions/statements that we asked the companies to answer. First you have it in English, and since we conducted the survey in Swedish, the text below in italic is the Swedish translations. All questions were answered according to a likert scale with the values: (1) Strongly disagree, (2) Disagree, (3) Neither agrees nor disagrees, (4) Agree and (5) Strongly agree, except the first 2 questions where only text-based answers were needed.
1. The company’s name. Företagets namn.
2. Your title. Din titel.
3. There is a high workload put on managers. Arbetsbelastning är hög på företagets chefer (Främst högre chefer så som grundare, VD osv).
4. Managers are (often) interrupted by employees asking for advice. Cheferna avbryts (ofta) av medarbetare, som frågar om råd/vägledning.
5. The founder/founders is/are involved in the decision making process. Grundaren/grundarna är fortfarande involverade i beslutsfattandet.
6. There are sufficient financial resources to support short-term operations (ex. Rent for next months and invoices). Det finns alltid tillräckligt med finansiella resurser för att möta företagets kortsiktiga verksamhet (tex. Nästa månads hyra, diverse fakturor osv).
7. Employees and middle managers are allowed to make decisions. Medarbetare och mellan-chefer får fatta egna beslut.
8. It is easy to raise external capital for investments. Det är lätt att skaffa extra kapital utifrån för nya investeringar.
9. You perceive the company to be more entrepreneurial and flexible rather than administrative. Du uppfattar företaget som mer flexibelt och entreprenöriellt än fokuserat på att hela tiden skötas administrativt korrekt.
10. The founder/founders is/are still active and run the company as the CEO. Grundaren/grundarna är fortfarande aktiva och fattar aktivt operativa beslut.
11. The founder/founders is/are has managed to fill positions with employees that compliment his/her own lack of skills. Grundaren/grundarna har lyckats anställa personal som kompletterar deras egna svagheter/brister.
12. There is risk of separation between stakeholders. Det finns en överhängande risk att företagets delägare väljer att gå skilda vägar och dela upp aktieinnehavet.
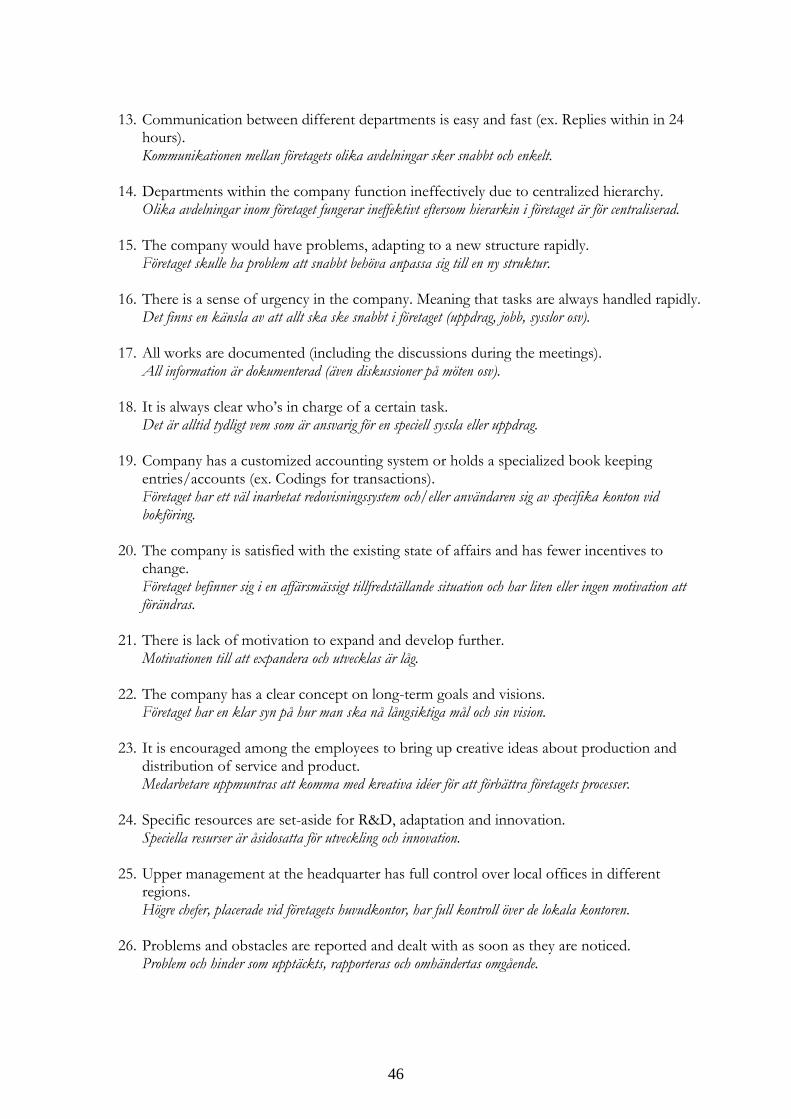
46
13. Communication between different departments is easy and fast (ex. Replies within in 24
hours). Kommunikationen mellan företagets olika avdelningar sker snabbt och enkelt.
14. Departments within the company function ineffectively due to centralized hierarchy. Olika avdelningar inom företaget fungerar ineffektivt eftersom hierarkin i företaget är för centraliserad.
15. The company would have problems, adapting to a new structure rapidly. Företaget skulle ha problem att snabbt behöva anpassa sig till en ny struktur.
16. There is a sense of urgency in the company. Meaning that tasks are always handled rapidly. Det finns en känsla av att allt ska ske snabbt i företaget (uppdrag, jobb, sysslor osv).
17. All works are documented (including the discussions during the meetings). All information är dokumenterad (även diskussioner på möten osv).
18. It is always clear who’s in charge of a certain task. Det är alltid tydligt vem som är ansvarig för en speciell syssla eller uppdrag.
19. Company has a customized accounting system or holds a specialized book keeping entries/accounts (ex. Codings for transactions). Företaget har ett väl inarbetat redovisningssystem och/eller användaren sig av specifika konton vid bokföring.
20. The company is satisfied with the existing state of affairs and has fewer incentives to change. Företaget befinner sig i en affärsmässigt tillfredställande situation och har liten eller ingen motivation att förändras.
21. There is lack of motivation to expand and develop further. Motivationen till att expandera och utvecklas är låg.
22. The company has a clear concept on long-term goals and visions. Företaget har en klar syn på hur man ska nå långsiktiga mål och sin vision.
23. It is encouraged among the employees to bring up creative ideas about production and distribution of service and product. Medarbetare uppmuntras att komma med kreativa idéer för att förbättra företagets processer.
24. Specific resources are set-aside for R&D, adaptation and innovation. Speciella resurser är åsidosatta för utveckling och innovation.
25. Upper management at the headquarter has full control over local offices in different regions. Högre chefer, placerade vid företagets huvudkontor, har full kontroll över de lokala kontoren.
26. Problems and obstacles are reported and dealt with as soon as they are noticed. Problem och hinder som upptäckts, rapporteras och omhändertas omgående.
47
27. The company’s structure is rigid rather than flexible. Företaget har en fast/stel struktur snarare än flexibel.
28. You often come across factors that show that operations are inefficient but not dealt with. Det händer ofta att du upptäcker tecken som antyder att vissa processer inom företaget fungerar ineffektivt.
29. There is rivalry between managers. Det finns rivalitet mellan chefer på företaget.
30. People have left the company due to rivalry. Anställda har slutat på grund av rivalitet och motsättningar på företaget.
31. The company strive to develop a structure that emphasize administrative control, but at the same time also flexibility in operational procedures. Företaget strävar efter att utveckla en struktur som förbättrar administrativ kontroll, men på samma gång är flexibel i operativa processer.
32. Teamwork is strongly practiced within the company in order to decrease the level of miscommunication. Teamwork/lagarbete är något som är viktigt för att minska problem som kan uppstå vid brist i kommunikationen på företaget.
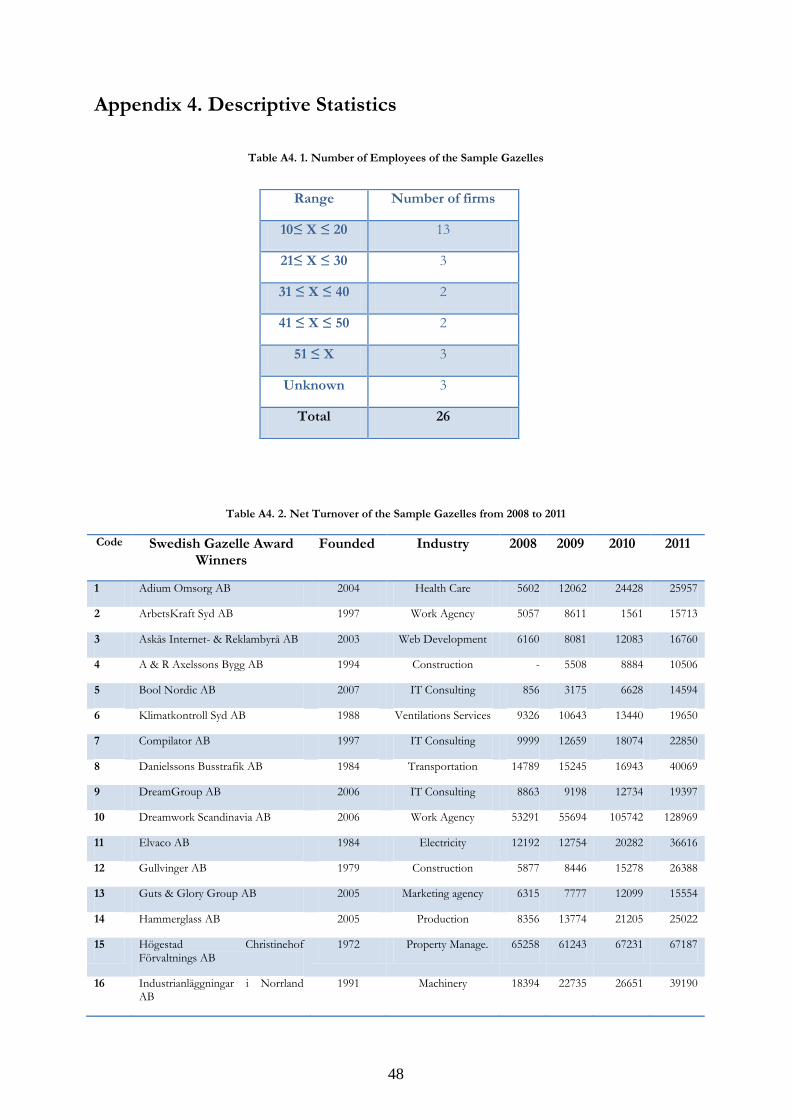
48
Appendix 4. Descriptive Statistics
Table A4. 1. Number of Employees of the Sample Gazelles
Table A4. 2. Net Turnover of the Sample Gazelles from 2008 to 2011
Code Swedish Gazelle Award Winners
Founded Industry 2008 2009 2010 2011
1 Adium Omsorg AB 2004 Health Care 5602 12062 24428 25957
2 ArbetsKraft Syd AB 1997 Work Agency 5057 8611 1561 15713
3 Askås Internet- & Reklambyrå AB 2003 Web Development 6160 8081 12083 16760
4 A & R Axelssons Bygg AB 1994 Construction - 5508 8884 10506
5 Bool Nordic AB 2007 IT Consulting 856 3175 6628 14594
6 Klimatkontroll Syd AB 1988 Ventilations Services 9326 10643 13440 19650
7 Compilator AB 1997 IT Consulting 9999 12659 18074 22850
8 Danielssons Busstrafik AB 1984 Transportation 14789 15245 16943 40069
9 DreamGroup AB 2006 IT Consulting 8863 9198 12734 19397
10 Dreamwork Scandinavia AB 2006 Work Agency 53291 55694 105742 128969
11 Elvaco AB 1984 Electricity 12192 12754 20282 36616
12 Gullvinger AB 1979 Construction 5877 8446 15278 26388
13 Guts & Glory Group AB 2005 Marketing agency 6315 7777 12099 15554
14 Hammerglass AB 2005 Production 8356 13774 21205 25022
15 Högestad Christinehof Förvaltnings AB
1972 Property Manage. 65258 61243 67231 67187
16 Industrianläggningar i Norrland AB
1991 Machinery 18394 22735 26651 39190
Range Number of firms
10≤ X ≤ 20 13
21≤ X ≤ 30 3
31 ≤ X ≤ 40 2
41 ≤ X ≤ 50 2
51 ≤ X 3
Unknown 3
Total 26
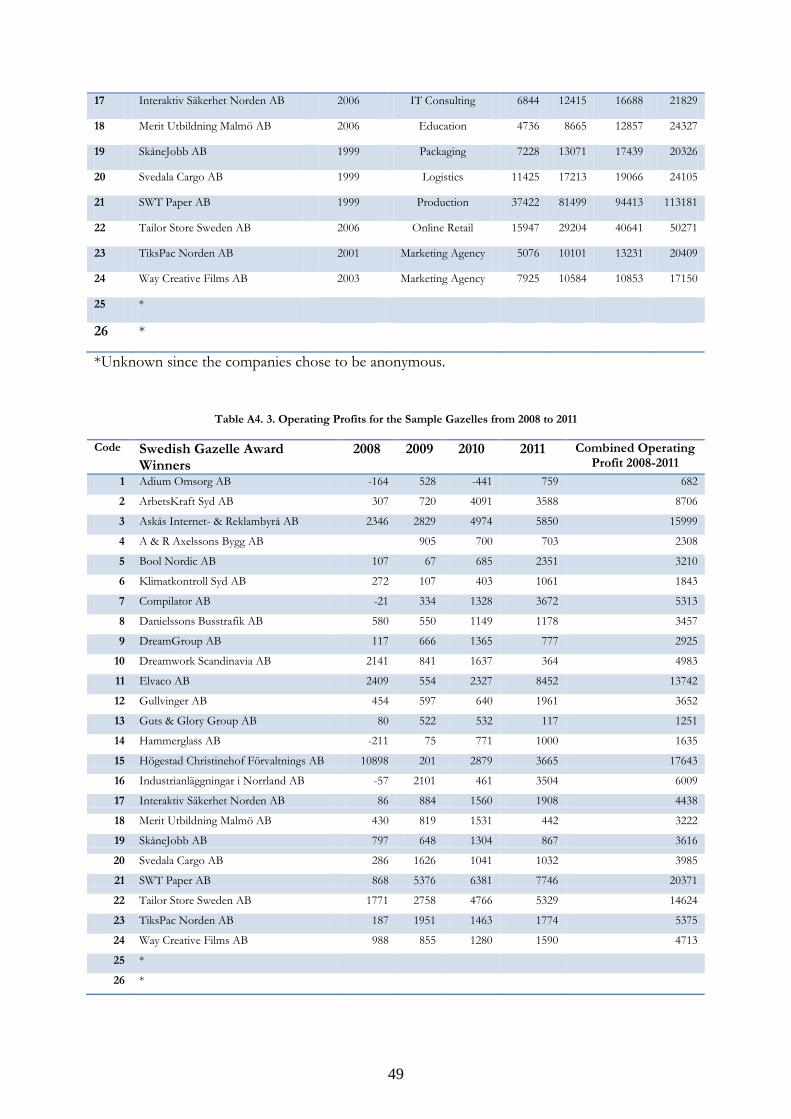
49
17 Interaktiv Säkerhet Norden AB 2006 IT Consulting 6844 12415 16688 21829
18 Merit Utbildning Malmö AB 2006 Education 4736 8665 12857 24327
19 SkåneJobb AB 1999 Packaging 7228 13071 17439 20326
20 Svedala Cargo AB 1999 Logistics 11425 17213 19066 24105
21 SWT Paper AB 1999 Production 37422 81499 94413 113181
22 Tailor Store Sweden AB 2006 Online Retail 15947 29204 40641 50271
23 TiksPac Norden AB 2001 Marketing Agency 5076 10101 13231 20409
24 Way Creative Films AB 2003 Marketing Agency 7925 10584 10853 17150
25 *
26 *
*Unknown since the companies chose to be anonymous.
Table A4. 3. Operating Profits for the Sample Gazelles from 2008 to 2011
Code Swedish Gazelle Award Winners
2008 2009 2010 2011 Combined Operating Profit 2008-2011
1 Adium Omsorg AB -164 528 -441 759 682
2 ArbetsKraft Syd AB 307 720 4091 3588 8706
3 Askås Internet- & Reklambyrå AB 2346 2829 4974 5850 15999
4 A & R Axelssons Bygg AB 905 700 703 2308
5 Bool Nordic AB 107 67 685 2351 3210
6 Klimatkontroll Syd AB 272 107 403 1061 1843
7 Compilator AB -21 334 1328 3672 5313
8 Danielssons Busstrafik AB 580 550 1149 1178 3457
9 DreamGroup AB 117 666 1365 777 2925
10 Dreamwork Scandinavia AB 2141 841 1637 364 4983
11 Elvaco AB 2409 554 2327 8452 13742
12 Gullvinger AB 454 597 640 1961 3652
13 Guts & Glory Group AB 80 522 532 117 1251
14 Hammerglass AB -211 75 771 1000 1635
15 Högestad Christinehof Förvaltnings AB 10898 201 2879 3665 17643
16 Industrianläggningar i Norrland AB -57 2101 461 3504 6009
17 Interaktiv Säkerhet Norden AB 86 884 1560 1908 4438
18 Merit Utbildning Malmö AB 430 819 1531 442 3222
19 SkåneJobb AB 797 648 1304 867 3616
20 Svedala Cargo AB 286 1626 1041 1032 3985
21 SWT Paper AB 868 5376 6381 7746 20371
22 Tailor Store Sweden AB 1771 2758 4766 5329 14624
23 TiksPac Norden AB 187 1951 1463 1774 5375
24 Way Creative Films AB 988 855 1280 1590 4713
25 *
26 *
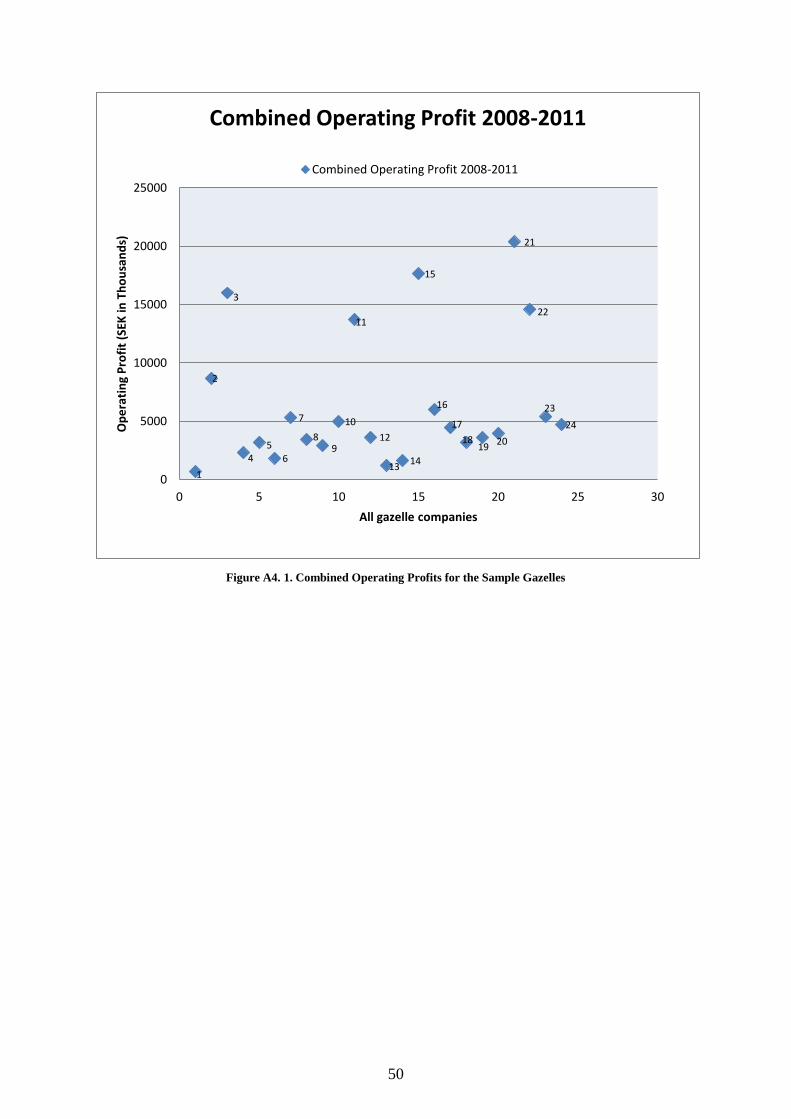
50
Figure A4. 1. Combined Operating Profits for the Sample Gazelles
1
2
3
4 5
6
7
8 9
10
11
12
13 14
15
16
17
18 19
20
21
22
23
24
0
5000
10000
15000
20000
25000
0 5 10 15 20 25 30
Op
era
tin
g P
rofi
t (S
EK in
Th
ou
san
ds)
All gazelle companies
Combined Operating Profit 2008-2011
Combined Operating Profit 2008-2011