the nonprofit and voluntary sector in ontario · the nonprofit and voluntary sector in ontario ......
TRANSCRIPT

Regional Highlights of the National Survey of Nonprofit and Voluntary Organizations
The Nonprofit and Voluntary
Sector in Ontario
Authors:
Katherine Scott Spyridoula Tsoukalas
Paul Roberts David Lasby

© Imagine Canada, 2006 Copyright for The Nonprofit and Voluntary Sector in Ontario: Regional Highlights from the National Survey of Nonprofit and Voluntary Organizations is waived for charitable and nonprofit organizations for non‐commercial use. All charitable and nonprofit organizations are encouraged to copy and distribute this document, with proper acknowledgement to the author and Imagine Canada. For more information about Imagine Canada’s Research Program, please visit www.imaginecanada.ca. Imagine Canada 425 University Avenue, Suite 900 Toronto, Ontario Canada M5G 1T6 Tell: 416.597.2293 / 1.800.263.1178 Fax: 416.597.2294 [email protected] ISBN: 1-55401-178-7 This research was supported by funding from the Voluntary Sector Initiative (VSI) through the Social Development Partnerships Program of Social Development Canada (SDC). The views expressed in this publication do not necessarily reflect those of the Government of Canada.

The Nonprofit and Voluntary Sector in Ontario Regional Highlights from the National Survey of Nonprofit and Voluntary Organizations By Katherine Scott, Canadian Council on Social Development Spyridoula Tsoukalas, Canadian Council on Social Development Paul Roberts, Canadian Council on Social Development David Lasby, Imagine Canada

Ontario’s Nonprofit and Voluntary Sector i
Table of Contents Table of Contents............................................................................................................. i
List of Figures ................................................................................................................ iii
List of Tables.................................................................................................................... v
Executive Summary .......................................................................................................vi
Introduction ..................................................................................................................... 1
Methodology.................................................................................................................... 2
Key Characteristics ......................................................................................................... 3
How many organizations are there in Ontario?...................................................... 3 What do organizations do?......................................................................................... 4 Who do Ontario organizations serve? ...................................................................... 6 Geographic Reach .................................................................................................... 6 Population Served.................................................................................................... 7
What role do members play in Ontario organizations? ......................................... 9
Financial Resources ...................................................................................................... 12
How is revenue distributed across Ontario organizations? ................................ 13 How do Ontario organizations generate revenue?............................................... 16 What is the mix of funding among sub‐sector organizations?............................ 17 How do sources of revenues vary by size of organization? ................................ 21 How much revenue is transferred to other organizations? ............................. 22 How much do organizations rely on in‐kind donations of goods and services?................................................................................................................... 22 What is the pattern of financial resource dependency among Ontario organizations?......................................................................................................... 24 How did revenues levels vary between 2000 and 2003?.................................. 25
Human Resources ......................................................................................................... 28
Volunteers ................................................................................................................... 29 How many volunteers work in Ontario organizations? .................................. 29 Where do volunteers contribute their time? ...................................................... 29 Which areas of the nonprofit and voluntary sector draw the greatest numbers of volunteers?......................................................................................... 31 How have volunteer numbers changed between 2000 and 2003?.................. 33 Are changes in revenues linked to changes in volunteer levels?.................... 34
Paid Staff ..................................................................................................................... 35

Ontario’s Nonprofit and Voluntary Sector ii
How many people are employed in the nonprofit and voluntary sector in Ontario? ................................................................................................................... 35 Are paid staff more likely to work full‐time or part‐time, or on a permanent or temporary basis? ............................................................................................... 36 Which areas of the nonprofit and voluntary sector employ the greatest numbers of paid staff?........................................................................................... 37 Where are paid staff concentrated? ..................................................................... 38 How have employment levels changed between 2000 and 2003? .................. 40 Are changes in revenues linked to changes in employment levels? .............. 42 What is the connection between staff and volunteer numbers? ..................... 43
Organizational Capacity .............................................................................................. 45
Do all organizations share the same capacity problems? .................................... 46 Does the source of funding affect organizational capacity? ................................ 51 How does primary area of activity affect capacity?.............................................. 55
Conclusions.................................................................................................................... 63

Ontario’s Nonprofit and Voluntary Sector iii
List of Figures Figure 1: Percentage of organizations and number of organizations per 100,000
population by region ................................................................................................ 3 Figure 2: Percentage of organizations by primary activity area ............................... 5 Figure 3: Main geographic areas served....................................................................... 6 Figure 4: Population served............................................................................................ 8 Figure 5: Membership composition............................................................................... 9 Figure 6: Primary beneficiaries of services or products ........................................... 10 Figure 7: Percentage of organizations and percentage of total revenues by region
.................................................................................................................................... 12 Figure 8: Percentage of organizations and percentage of total revenues by
primary activity area............................................................................................... 14 Figure 9: Percentage of organizations and percentage of total revenues by
revenue size, excluding Hospitals, Universities and Colleges ......................... 15 Figure 10: Sources of revenue ...................................................................................... 16 Figure 11: Sources of revenue, excluding Hospitals, Universities and Colleges.. 17 Figure 12: Sources of revenue by primary activity area........................................... 18 Figure 13: Sources of government revenue by primary activity area .................... 20 Figure 14: Sources of government revenue by revenue size, excluding Hospitals,
Universities and Colleges....................................................................................... 22 Figure 15: Percentage of organizations receiving in‐kind donations by region ... 23 Figure 16: Revenue dependency by region ................................................................ 25 Figure 17: Reported change in revenues over the past three years by region ...... 26 Figure 18: Reported change in revenues over the past three years by revenue
dependency .............................................................................................................. 27 Figure 19: Percentage of organizations, percentage of volunteers, and percentage
of paid staff by region............................................................................................. 28 Figure 20: Percentage of organizations by number of volunteers .......................... 30 Figure 21: Percentage of organizations and percentage of volunteers by revenue
size ............................................................................................................................. 31 Figure 22: Percentage of organizations and percentage of volunteers by primary
activity area .............................................................................................................. 32 Figure 23: Reported change in volunteers over the past three years by region.... 34 Figure 24: Reported change in volunteers over the past three years by reported
change in revenues.................................................................................................. 35 Figure 25: Percentage of organizations and paid staff by primary activity area.. 38 Figure 26: Percentage of organizations and paid staff by revenue size ................. 39

Ontario’s Nonprofit and Voluntary Sector iv
Figure 27: Percentage of organizations and paid staff by revenue size, excluding Hospitals, Universities and Colleges.................................................................... 40
Figure 28: Reported change in paid staff over the past three years by region...... 41 Figure 29: Reported change in paid staff over the past three years by number of
paid staff ................................................................................................................... 42 Figure 30: Reported change in paid staff over the past three years by reported
change in revenues.................................................................................................. 43 Figure 31: Reported change in volunteers over the past three years by reported
change in paid staff ................................................................................................. 44

Ontario’s Nonprofit and Voluntary Sector v
List of Tables Table 1: Detailed sources of revenue........................................................................... 19 Table 2: Percentage of organizations that receive in‐kind donations..................... 23 Table 3: Approximate value of in‐kind donations received by organizations...... 23 Table 4: Number of paid staff....................................................................................... 37 Table 5: Top three ‘serious’ problems for Ontario organizations ........................... 46 Table 6: Financial issues by revenue size ................................................................... 47 Table 7: External funding issues by revenue size...................................................... 48 Table 8: Paid staff issues by revenue size ................................................................... 49 Table 9: Volunteer issues by revenue size .................................................................. 50 Table 10: Structural issues by revenue size ................................................................ 51 Table 11: Financial capacity issues by revenue dependency................................... 52 Table 12: Paid staff issues by revenue dependency .................................................. 52 Table 13: Volunteer issues by revenue dependency ................................................. 53 Table 14: Structural issues by revenue dependency ................................................. 53 Table 15: External funding issues by revenue dependency..................................... 54 Table 16: External funding issues by primary activity area..................................... 56 Table 17: Financial issues by primary activity area .................................................. 57 Table 18: Paid staff issues by primary activity area.................................................. 58 Table 19: Volunteer issues by primary activity area................................................. 59 Table 20: Structural issues by primary activity area ................................................. 60 Table 21: Severity of capacity problems by activity area ......................................... 61

Ontario’s Nonprofit and Voluntary Sector vi
Executive Summary Organizations within the nonprofit and voluntary sector provide a wide range of essential services and programs that touch virtually all aspects of society – social justice, sport, environment, health, faith, arts and culture. Over 45,000 organizations were in operation in 2003, 369 organizations per 100,000 population.
The two largest areas of activity are Religion (23% of organizations) and Sports and Recreation (16% of organizations). Ontario has a larger share of Religion groups and organizations involved in Grant‐making, Fundraising and Voluntarism Promotion than the Canadian average. By contrast, there are proportionally fewer Sport and Recreation groups compared to the average for Canada.
As is true for the rest of Canada, most nonprofit and voluntary organizations in Ontario serve their local communities, although Ontario has a relatively large share of organizations with a national and international reach.
The nonprofit and voluntary sector in Ontario commands a substantial economic presence. Ontario organizations reported $47.7 billion in annual revenues in 2003. This represents 43% of all revenues generated by all organizations across Canada – a total of nearly $112 billion. Total sector revenues in Ontario are highly skewed. Hospitals, Universities and Colleges account for less than 1% of all organizations but received 38% of total sector revenues in 2003. Indeed, Ontario has a comparatively large number of organizations in the top revenue bracket compared to other regions combined, including many in Hospitals, Universities and Colleges (38 versus 33%).
In 2003, governments were the largest single source of revenue for Ontario nonprofit and voluntary organizations, providing just under half (45%) of all revenues received. Earned revenues (36%) and donations and gifts (15%) were much smaller sources of revenue for organizations in Ontario. Large organizations, particularly those in Hospitals and Universities and Colleges, depend on government as their primary source of funds. For this group, 70% of revenues come from government whereas the remaining amount comes from other sources such as memberships and the sales of goods and services. By contrast, gifts and donations are an important source of revenue among smaller groups, as measured by annual revenues.
Ontario organizations engage the largest number and share of paid staff and volunteers in Canada. Ontario organizations employ 47%E of all such paid staff in Canada, more than twice as many as Quebec with 23% and Alberta and the Prairies, each with 9%. In

Ontario’s Nonprofit and Voluntary Sector vii
Ontario, just under one million people — 15% of the active work force1 — were employed in nonprofit and voluntary organizations in 2003.
Forty percent of all volunteers are engaged with Ontario voluntary organizations, compared to 23% E in Quebec and 13% in Alberta. The overall number of volunteers reported by organizations is 7.8 million, representing roughly 400,000 board volunteers and 7.4 million non‐board volunteers. These substantial numbers result in part from the fact that volunteers often volunteer for more than one organization.
Just as the distribution of revenues is skewed, so is the distribution of volunteers and staff. Larger organizations tend to have larger staff and volunteer complements than smaller ones. For instance, more than half of the voluntary and nonprofit organizations in Ontario (53%) have no paid staff and are wholly voluntary.
As is true for Canada as a whole, there appears to be two distinct realities in the nonprofit and voluntary sector in Ontario. At one extreme, over half of Ontario organizations operate with the assistance of volunteers with very low revenues in areas such as Sport and Recreation and Religion; at the other extreme there are a number of very large organizations with significant revenues, staff and volunteer complements.
Of course, the challenges facing each group are distinct. Nevertheless, the majority of organizations clearly report problems with acquiring adequate resources, whether human or financial. Ontario organizations expressed considerable concern about their capacity to pursue and sustain their goals and activities within the context of a changing social, political and economic environment. Both the level and structure of available support are identified as key issues. As well, there are significant human resources concerns, most notably with the ability to retain paid staff and to recruit the types of volunteers needed.
Large organizations dependent on government funding, such as those working in Hospitals, Universities and Colleges, Health or Social Services, are most likely to report problems across a range of areas, despite their positive revenue growth and reported increases in both volunteers and paid staff. At the same time, organizations in the two largest sectors – Religion and Sports and Recreation – do not appear to be experiencing the same level of difficulty.
The nonprofit and voluntary sector is a vital contributor to our social and economic quality of life in Ontario. The sector delivers many critical services to communities across the province and plays a key role in bringing together and engaging citizens. Unfortunately, many organizations in Ontario face serious capacity challenges which impede their ability to fulfill their mission. The NSNVO data provides insight into the
1 Statistics Canada, Labour Force Survey Historical Review, 2003. CD‐Rom Catalogue No. 71F0004X CB

Ontario’s Nonprofit and Voluntary Sector viii
characteristics and challenges of nonprofit and voluntary organization in Ontario, and presents us with an opportunity to address those challenges.

Ontario’s Nonprofit and Voluntary Sector 1
Introduction The nonprofit and voluntary sector has been described as “the third pillar of Canadian society and its economy.”2 Organizations within the sector provide a wide range of essential services and programs that touch virtually all aspects of our society – social justice, sports, environment, health, faith, arts and culture. They play a critical role in promoting active citizenship, supporting economic and community development, and advocating on behalf of diverse communities and causes – establishing connections between citizens, communities and governments that build social capital and sustain democracy.
Nonprofit and voluntary organizations in Ontario have a rich history, dating back over 100 years. Histories of the province identify the central role that charitable and other community‐based voluntary organizations played in its social, cultural and political development. Today, an estimated 45,360 incorporated nonprofits and registered charities operate in the province in many different fields within large diverse urban areas as well as rural districts and villages.
Until recently, however, there was little awareness of the sector in general, the types of activities organizations engaged in, or the regional similarities and differences across Canada. The NSNVO allows us to explore these questions for the first time.
In this report, we present an overview of the nonprofit and voluntary sector in Ontario, including basic information about its composition, its financial resources and the people engaged in its activities as volunteers and paid staff. In the last section, we explore the capacity challenges that organizations are experiencing in their efforts to pursue their missions.
2 Liberal Party of Canada, Red Book II, 1997.

Ontario’s Nonprofit and Voluntary Sector 2
Methodology NSNVO data were collected by Statistics Canada via personal interviews with 13,000 individuals representing incorporated nonprofit organizations and registered charities3 in 2003. The NSNVO defines nonprofit and voluntary organizations as:
• non‐governmental (i.e., are institutionally separate from government);
• non‐profit distributing (i.e., do not return any profits generated to their owners or directors);
• self‐governing (i.e., are independent and able to regulate their own activities);
• voluntary (i.e., they benefit to some degree from voluntary contributions of time or money); and
• formally incorporated or registered under specific legislation4 with provincial, territorial, or federal governments.
Symbols:
The following symbols have been used in this publication:
* Suppressed to meet the confidentiality requirements of the Statistics Act.
E Use with caution.
3 Registered charities are organizations that have obtained registered charitable status from the Government of Canada. 4 The NSNVO excluded grass‐roots organizations or citizens’ groups that are not formally incorporated or registered with provincial, territorial, or federal governments. It also excluded some registered charities that are considered to be public sector agencies (e.g., school boards, public libraries, and public schools)

Ontario’s Nonprofit and Voluntary Sector 3
Key Characteristics
How many organizations are there in Ontario?
There were 45,360 nonprofit and voluntary organizations operating in Ontario in 2003, representing 28% of all organizations in Canada (see Figure 1). These organizations include both registered charities and incorporated nonprofits.5 Ontario is second only to Quebec in number of organizations, yet given the size of Ontario’s population – over 12 million in 2003 – there are fewer organizations per population than in every other region of the country. In Canada there is an average of 508 organizations per 100,000 population compared to only 369 organizations per 100,000 population in Ontario. In view of Ontario’s predominant demographic and economic position in Canadian society, the relatively low number of organizations in the province, compared to other parts of the country, requires further exploration.
Figure 1: Percentage of organizations and number of organizations per 100,000 population by region
5 According to the NSNVO, 60% of Ontario nonprofit and voluntary organizations are registered charities and 40% are incorporated nonprofits.
0%
5%
10%
15%
20%
25%
30%
% all organizations
AtlanticQuebecOntarioPrairies &Territories
AlbertaBritishColumbia
0
100
200
300
400
500
600
700
800
Number of organizations per 100,000 population
486
610
752
369
549
617
13%12%
11%
28%29%
8%

Ontario’s Nonprofit and Voluntary Sector 4
What do organizations do?
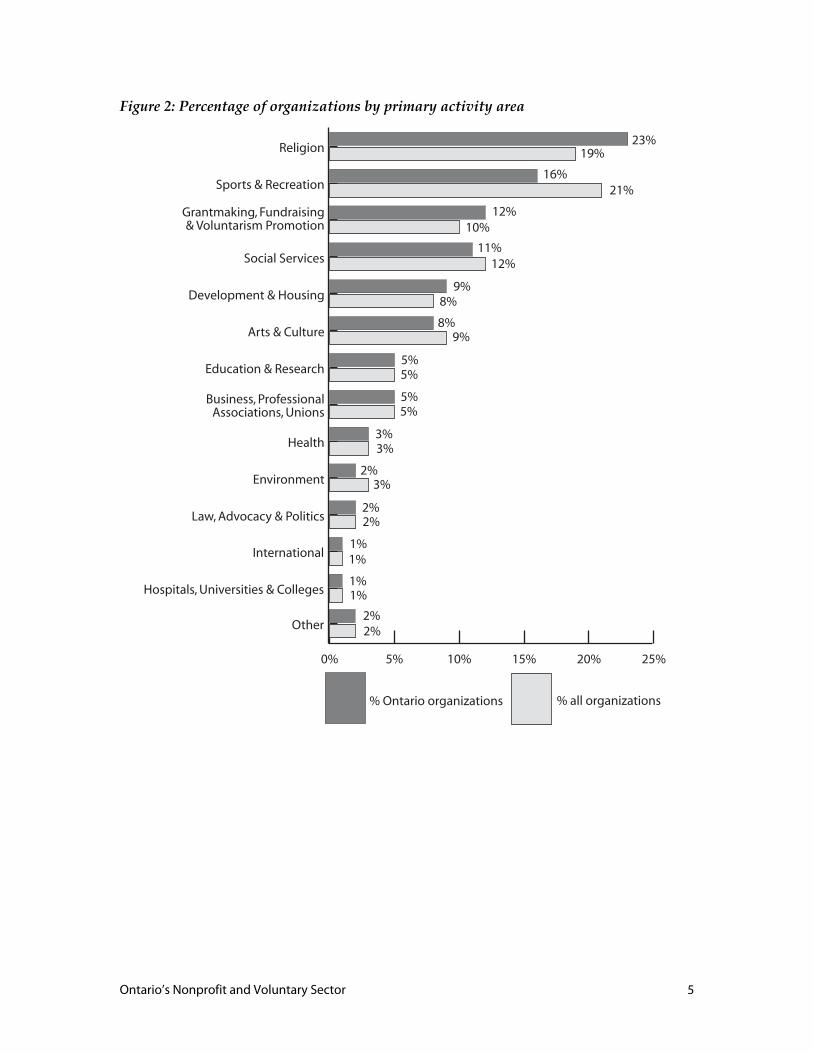
Nonprofit and voluntary organizations are engaged in a wide range of activities in communities across the province.6 As seen in Figure 2, the two largest areas of activity in Ontario are Religion (23% of organizations) and Sports and Recreation (16% of organizations). Organizations working in the areas of Grant‐making, Fundraising and Voluntarism Promotion (12%) and Social Services (11%) rank third and fourth, respectively. Each of the remaining groups makes up 9% or less of all nonprofit and voluntary organizations.
The composition of the Ontario nonprofit and voluntary sector mirrors the Canadian sector quite closely, with the exception of the top two groups. Overall, in Canada, a greater proportion of organizations list Sports and Recreation as their primary activity than in Ontario (21% compared to 16%, see Figure 2). Conversely, the proportion of Ontario organizations whose primary activity is Religion is higher than the national average (23% compared to 19%).
6 The NSNVO employed the International Classification of Nonprofit Organizations (ICNPO) to group organizations into primary areas of activity. This typology was developed by L.M. Salamon and H.K. Anheier. See Salamon, L.M. and Anheier, H.K. Defining the Nonprofit Sector: A Cross‐national Analysis. Manchester, N.Y. Manchester University Press, 1997. The ICNPO has been modified for use in Canada and is divided into 15 broad categories with 71 broad sub‐categories.
Ontario’s Nonprofit and Voluntary Sector 5
Figure 2: Percentage of organizations by primary activity area
0% 5% 10% 15% 20% 25%
% all organizations% Ontario organizations
Hospitals, Universities & Colleges
International
Other
Law, Advocacy & Politics
Environment
Health
Business, Professional Associations, Unions
Education & Research
Arts & Culture
Development & Housing
Social Services
Grantmaking, Fundraising & Voluntarism Promotion
Sports & Recreation
Religion23%
19%
16%21%
12%10%
11%12%
9%8%
8%9%
5%5%
5%5%
3%3%
2%3%
2%2%
2%2%
1%1%
1%1%

Ontario’s Nonprofit and Voluntary Sector 6
Who do Ontario organizations serve?
Organizations in Ontario serve a variety of groups and geographic areas. This section will examine the geographic scope of nonprofit and voluntary organizations in Ontario and the populations served.
Geographic Reach
Nonprofit and voluntary organizations in Ontario, as with those in the rest of Canada, primarily serve local constituencies such as neighbourhoods, towns, cities and regional municipalities. Two‐thirds of Ontario organizations (65%) report that they serve their local community (see Figure 3). One in six organizations (18%) has a regional mandate. Not surprisingly, given the number of national offices and international organizations in Ontario, Ontario has a larger proportion of organizations that serve a broad audience (at 11%) compared to the national average (6%).
Figure 3: Main geographic areas served
0%
10%
20%
30%
40%
50%
60%
70%
80%
% all organizations% Ontario organizations
64%
19%
9%
2% 3%3%
65%
18%
6%1%
6% 5%0.5%0.4%
OtherInternationalCanadaMore than one province
ProvinceRegion of a province
Local, municipality

Ontario’s Nonprofit and Voluntary Sector 7
Population Served
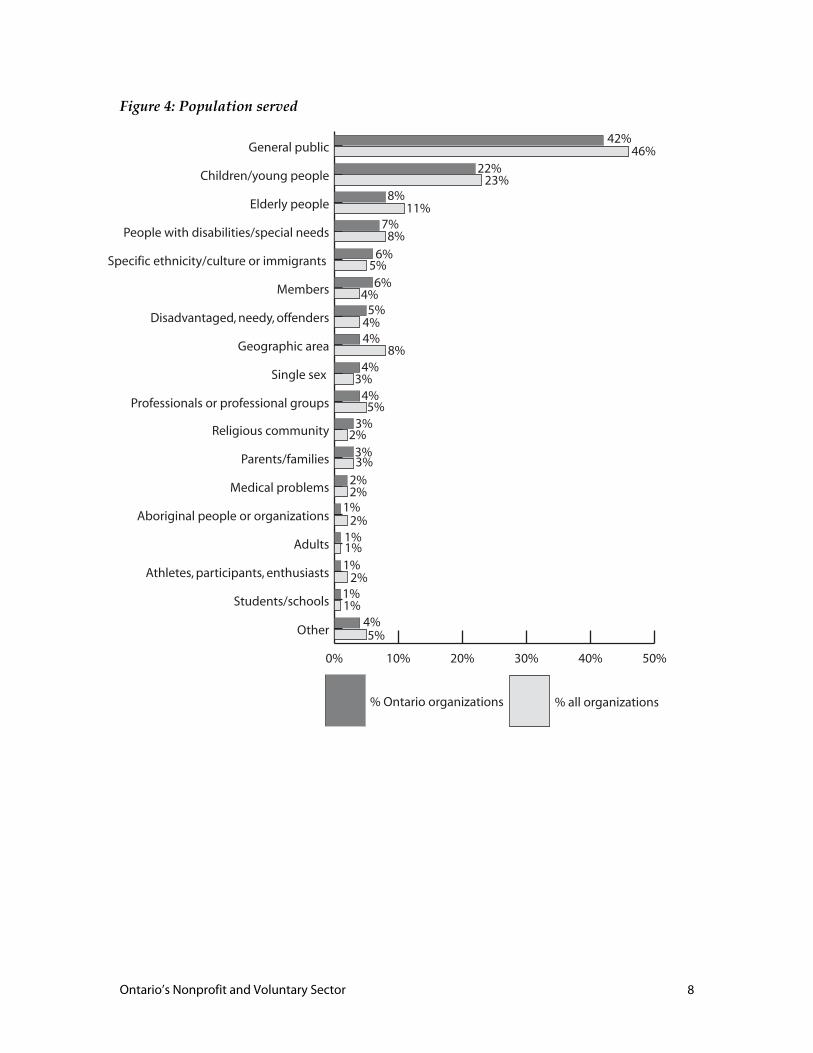
Organizations in Ontario serve a variety of groups through their programs and activities.7 The largest number of Ontario organizations report that their main clientele is the general public (42%), slightly less than the Canada average of 46% (see Figure 4). A significant number in Ontario primarily serve children and youth (22%), while a much smaller proportion serve the elderly (8%), a pattern of service is similar to the overall Canadian average. Comparatively few nonprofit and voluntary organizations in Ontario specifically serve the needy or disadvantaged, Aboriginals, ethnic groups, or persons with disabilities, as appears to be true for Canada as a whole.
7 These figures apply only to the 75% of organizations that provide services or products directly to people.
Ontario’s Nonprofit and Voluntary Sector 8
Figure 4: Population served
0% 10% 20% 30% 40% 50%
% all organizations% Ontario organizations
Students/schools
Athletes, participants, enthusiasts
Adults
Aboriginal people or organizations
Medical problems
Parents/families
Religious community
Other
Professionals or professional groups
Single sex
Geographic area
Disadvantaged, needy, offenders
Members
Specific ethnicity/culture or immigrants
People with disabilities/special needs
Elderly people
Children/young people
General public42%
46%22%
23%8%
11%7%
8%6%
5%6%
4%5%
4%4%
8%4%
3%4%
5%
4%5%
3%2%
3%3%
2%
1%2%
1%1%1%
2%1%
2%
1%

Ontario’s Nonprofit and Voluntary Sector 9
What role do members play in Ontario organizations?
A distinguishing feature of many nonprofit and voluntary organizations is that they have members. Members can include people, organizations, or both.8 Eight in ten (79%) of all nonprofit and voluntary organizations in Canada have members (people, other organizations or both, see Figure 5). In Ontario, the figure is slightly lower at 77%. Almost one‐quarter of all organizations in Ontario (23%) have no members. A very small proportion serves other organizations exclusively.
Nonprofit and voluntary organizations count people and other organizations as their members. In Ontario, 74% of nonprofit and voluntary organizations directly serve people as members by providing services or products (see Figure 5). By contrast, the national average is 76%.
Figure 5: Membership composition
Many Canadians and Ontarians are active in nonprofit and voluntary organizations. Organizations in Canada report a total of 139.4 million members; those in Ontario report
8 The definition of membership is somewhat arbitrary since the decision is left to individual organizations to define the concept. Therefore, all comparisons across Canada should be interpreted with caution.
0%
10%
20%
30%
40%
50%
60%
70%
80%
% all organizations% Ontario organizations
No membersBoth as members
Organizations as members
People as members
66% 66%
3% 3%8% 10%
23% 21%

Ontario’s Nonprofit and Voluntary Sector 10
a total membership of 68.8 million. Thus, just under half of all members (49%) are found in Ontario.
Thirteen per cent of all organizations have organizations as members, their collective membership totaling nearly 4 million in Canada. In Ontario, 11% have organizational members, for a total of 780,230. Clearly, many individuals and organizations hold multiple memberships.
A little over one‐quarter of organizations (27%), with people as members, provide their members with special benefits or privileges, beyond voting rights or newsletters, such as discounts on products or services. This is the same as the Canadian average.9
Of the organizations that have people as members, 43% of Ontario nonprofits and volunteer organizations report that they benefit both members and non‐members equally, while 39% indicate that only their members benefit most (see Figure 6). A much smaller proportion (17%) benefit non‐members over members, a number slightly greater than the Canadian average of 15%.
Figure 6: Primary beneficiaries of services or products
9 Among organizations in Ontario that have an individual membership base, 41% restrict membership, while 59% allow anyone to join. Among organizations that have an organizational membership base, 55% restrict membership and 45% allow any organization to join.
0%
10%
20%
30%
40%
50%
60%
% all organizations% Ontario organizations
39% 39%
17%15%
43%46%
Both members & non-members benefit most
Non-members benefit most
Members benefit most

Ontario’s Nonprofit and Voluntary Sector 11
Ontario organizations in Religion (87%), Sports and Recreation (83%) and Environment (78%) are the most likely to have individual memberships, whereas organizations in Law, Advocacy and Politics (19%) and Business and Professional Associations and Unions (18%) are the most likely to have organizational memberships. Over half of Hospitals and Universities and Colleges (56%) and organizations involved in Grant‐making, Fundraising and Voluntarism Promotion (51%) reported that they have no members.

Ontario’s Nonprofit and Voluntary Sector 12
Financial Resources Nonprofit and voluntary organizations command significant resources and represent a sizeable proportion of the Canadian economy. Ontario organizations reported $47.7 billion in annual revenues in 2003. This represents 43% of all revenues generated by all organizations across Canada – a total of $112 billion (see Figure 7). This far exceeds revenues reported by organizations in all other regions. It is interesting to see that the Ontario share of total sector revenues is closer to their population share (38%) than its share of all organizations (28%). Even with Hospitals and Universities and Colleges excluded, Ontario’s total share of sector revenues is 39%.E The significant number of large‐revenue, national organizations – 14% compared with 4% for the rest of the country – is one factor behind Ontario’s relatively large share of total sector revenues.10
Figure 7: Percentage of organizations and percentage of total revenues by region
E use with caution
E use with caution 10 Large revenue is defined here as over $500,000 per year. Cornerstones of Community (2004).
% total revenues% all organizations
13%
10%
12%9%
11% 11%
28%
43%
29%22%
8%
5%
13%
12%
12%
12%
11%9%
28%
39%
29%23%
8%
6%
50% 40% 30% 20% 10% 0% 0% 10% 20% 30% 40% 50%
All organizationsAll organizations, not including Hospitals, Universities & Colleges
Atlantic
Quebec
Ontario
Prairies &Territories
Alberta
BritishColumbia
E

Ontario’s Nonprofit and Voluntary Sector 13
How is revenue distributed across Ontario organizations?
Of the $47.7 billion generated in Ontario in 2003, 38% (approximately $18.3 billion) was generated by one per cent of organizations that identify themselves as Hospitals, Universities or Colleges, compared to 33% nationally. It is also of interest to examine how revenues are distributed among the other sub‐sectors. Specifically, there are two other areas where the proportion of revenues is greater than their organizational share. In Ontario, 11% of Social Service organizations generated 12% of total revenues while 5% of Business and Professional Associations and Unions generated 11% of total revenues (see Figure 8). By contrast, the revenue share of Sports and Recreation and Religion is much smaller than their organizational share; while making up 39% of all organizations, they generated just 11% E of all revenues.
E use with caution

Ontario’s Nonprofit and Voluntary Sector 14
Figure 8: Percentage of organizations and percentage of total revenues by primary activity area
E use with caution
The revenue portrait of Ontario organizations is highly skewed, as is the case elsewhere in Canada. One per cent of organizations in Ontario have annual revenues of $10 million or more whereas 34% of all Ontario nonprofit and voluntary organizations have revenues of less than $30,000.11 Looking at the distribution of total revenues, the top one
11 About two percent of Ontario organizations report zero revenues.
% total revenues% organizations
Hospitals, Universities & Colleges
International
Other
Law, Advocacy & Politics
Environment
Health
Business, Professional Associations,
Unions
Education & Research
Arts & Culture
Development & Housing
Social Services
Grantmaking,Fundraising, & Voluntarism Promotion
Sports & Recreation
Religion
0% 10% 20% 30% 40%40% 30% 20% 10% 0%
19%6%
21%
5%
10%
7%
12%
10%
8%
6%
9%3%
5% 6%
5%10%
3% 8%
3%1%
2 %1%
2%2%
1%1%
33%
1%
23%6%
16%
5%
12%
6%
11%
12%
9%
4%
8%
3%
5%3%
5%
11%
3%
5%
2%
1%
2%2%
2%
2%
1%
2%
1%38%
Canada Ontario
E E
E
Ontario’s Nonprofit and Voluntary Sector 15
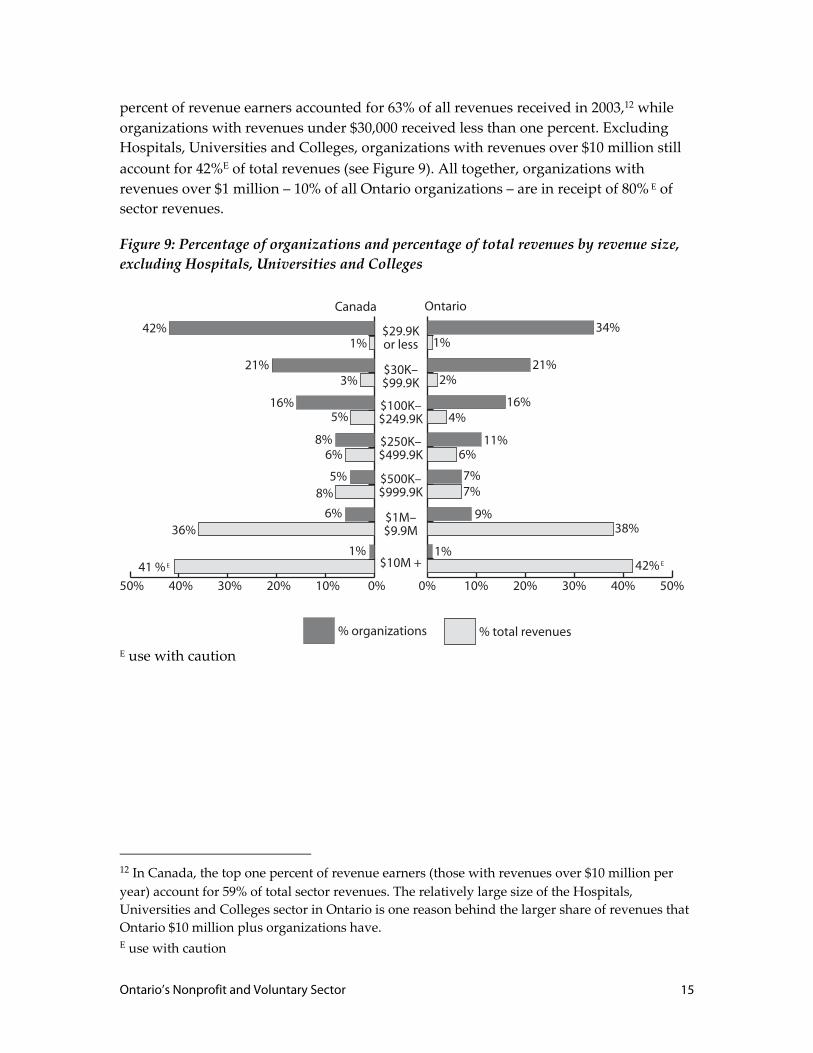
percent of revenue earners accounted for 63% of all revenues received in 2003,12 while organizations with revenues under $30,000 received less than one percent. Excluding Hospitals, Universities and Colleges, organizations with revenues over $10 million still account for 42%E of total revenues (see Figure 9). All together, organizations with revenues over $1 million – 10% of all Ontario organizations – are in receipt of 80% E of sector revenues.
Figure 9: Percentage of organizations and percentage of total revenues by revenue size, excluding Hospitals, Universities and Colleges
E use with caution
12 In Canada, the top one percent of revenue earners (those with revenues over $10 million per year) account for 59% of total sector revenues. The relatively large size of the Hospitals, Universities and Colleges sector in Ontario is one reason behind the larger share of revenues that Ontario $10 million plus organizations have. E use with caution
0% 10% 20% 30% 40% 50%
% total revenues% organizations
$10M +
$1M– $9.9M
$500K– $999.9K
$250K– $499.9K
$100K– $249.9K
$30K– $99.9K
$29.9K or less
50% 40% 30% 20% 10% 0%
Canada Ontario
34%1%
21%2%
16%4%
11%6%
7%7%
9%38%
1%42%
42%1%
21%3%
16%5%
8%6%
5%8%
6%36%
1%41 % E E

Ontario’s Nonprofit and Voluntary Sector 16
How do Ontario organizations generate revenue?
Nonprofit and voluntary organizations generate revenue from a variety of sources, with the particular mix of funding sources varying across the sector. Historically, governments in Canada have been a major funder, as still seems to be the case in 2003, with governments as the largest single source of revenues (49%) for Canadian nonprofit and voluntary organizations (see Figure 10). One‐third (35%) of revenues were earned from non‐government sources such as memberships and the sales of goods and services and 13% was received through gifts and donations from individuals, corporation and other organizations.
As seen in Figure 10, Ontario organizations are somewhat less likely to rely on governments for revenue compared to the national average (45% compared to 49%) and slightly more likely to rely on earned income (36%) and gifts and donations (15%).
Figure 10: Sources of revenue
E use with caution
Excluding Hospitals and Universities and Colleges, 29%E of revenues in Ontario come from governments, 45% from earned income; 22% E from donations and gifts; and the remaining 4% from “other” sources (see Figure 11). Reliance on government sources drops by 16% once Hospitals, Universities and Colleges are factored out.
E use with caution
0%
25%
50%
75%
% total revenues, all organizations
% total revenues, all Ontario organizations
Other incomeGifts & donationsEarned incomeGovernment
45%49%
36% 35%
15%13%
4% 3%
E

Ontario’s Nonprofit and Voluntary Sector 17
Figure 11: Sources of revenue, excluding Hospitals, Universities and Colleges
E use with caution
This same pattern is also evident across Canada as well where earned income is the largest single source of revenues (43%) once Hospitals and Universities and Colleges are excluded from the totals.
What is the mix of funding among sub-sector organizations?
The funding mix of nonprofit and voluntary organizations in Ontario varies according to their primary activity. Health organizations, Social Services and Hospitals, Universities and Colleges rely primarily on government sources; with 61% to 70% of their revenues coming from government sources (see Figure 12). Business and Professional Associations and Unions, Education and Research, Arts and Culture and Sports and Recreation, alternatively, rely primarily on earned income. Gifts and donations play a particularly important role for Religion (70%E) and Grant‐making, Fundraising and Voluntarism Promotion organizations (53%).
Organizations working in Development and Housing, Environment and Law, Advocacy and Politics have a diversified funding base, drawing primarily on a mix of government E use with caution
0%
25%
50%
75%
% total revenues, all organizations except Hospitals, Universities & Colleges
% total revenues, Ontario organizations except Hospitals, Universities &Colleges
Other IncomeGifts & donationsEarned IncomeGovernment
36%
29%
43% 45%
17%22%
4% 4%
E
E
E

Ontario’s Nonprofit and Voluntary Sector 18
revenues and earned income. International organizations also have diverse funding sources; gifts and donations, however, are a much larger source of funds for these groups.
Figure 12: Sources of revenue by primary activity area
E use with caution
In Ontario, 45% of all revenues received by nonprofit and voluntary organizations come from government (see Table 1). However, it is the provincial government that provides most of government funding (84%). Only Business, Professional Associations and Unions (67%), International organizations (95% E), and organizations in Law, Advocacy and Politics (69%) rely primarily on the federal government for their government funding (see Figure 13).
Hospitals, Universities & Colleges
Other
Business, Professional Associations,
Unions
Religion
International
Grantmaking, Fundraising & Voluntarism Promotion
Law, Advocacy & Politics
Development & Housing
Environment
Social Services
Health
Education & Research
Sports & Recreation
Arts & Culture
0% 20% 40% 60% 80% 100%
21% 54% 19% 6%
7% 56% 36% 1%
17% 66% 15%3%
61% 20% 17%1%
68% 21% 8% 2%
34% 47% 18% 2%
41% 46% 2% 11%
42% 47% 9%2%
8% 34% 53% 5%
49% 6% 35% 9%
11% 17% 70% 2%
4% 89% 3% 4%
18% 78% 2% 1%
70% 22% 4% 4%
Ontario
100% 80% 60% 40% 20% 0%
28%50%17%5%
12%65%20%3%
46%40%9%4%
70%18%9%2%
66%20%111%3%
27%44%23%6%
44%50%2%4%
47%41%9%3%
30%35%32%3%
42%13%39%7%
8%24%64%5%
7%85%2%5%
24%69%4%3%
73%20%4%3%
Canada
Gifts & donations Other incomeGovernment Earned income
E E E E E E
E
E
E E
E
E

Ontario’s Nonprofit and Voluntary Sector 19
Table 1: Detailed sources of revenue Ontario organizations All organizations
Revenues % total revenues Revenues % total
revenues
Revenues from government
Government payments for goods and services
Payments from the federal government $828,624,326 2% $1,629,494,890 1%
Payments from provincial government $8,389,654,925 18% $17,202,528,730 15%
Payments from municipal government $779,047,373 2% $1,035,070,183 1%
Government payments from other $60,038,972E 0% $85,258,416E 0%
Total government payments for goods and services $10,057,310,715 21% $19,952,383,088 18%
Government grants and contributions
Grants from the federal government $1,012,314,751 2% $6,039,958,845 5%
Grants from provincial government $9,788,107,676E 21% $26,944,104,382 24%
Grants from municipal government $624,954,018E 1% $1,068,108,183E 1%
Government grants from other $77,410,928 0% $155,583,730 0%
Total government grants and contributions $11,502,695,348E 24% $34,207,876,777 31%
Total revenues from government $21,560,006,062 45% $54,160,259,865 49%
Earned income from non-governmental sources
Charitable gaming $411,976,444 1% $1,242,885,015 1%
Membership fees $6,428,373,933 13% $12,033,551,619 11%
Fees for goods or services (non-government) $8,948,332,860 19% $21,844,521,113 20%
Investment income (including interest) $1,480,905,205 3% $4,173,428,911 4%
Total revenues from earned income $17,269,588,442 36% $39,294,386,657 35%
Gifts and donations
Individual donations $4,299,673,243E 9% $8,369,669,565E 8%
Fundraising organizations/family community foundations $535,370,236 1% $1,137,834,369 1%
Disbursements from nonprofits $825,897,666 2% $1,935,468,417 2%
Corporate sponsorships, donations or grants $1,533,078,209 3% $2,815,372,908 3%
Total revenues from gifts and donations $7,194,019,353E 15% $14,258,345,259 13%
Other income $1,695,893,378 4% $3,882,569,114 3%
Total revenues $47,719,507,235 100% $111,595,560,896 100%
E use with caution

Ontario’s Nonprofit and Voluntary Sector 20
Figure 13: Sources of government revenue by primary activity area
E use with caution
By contrast, municipal government provides a small proportion of the overall revenues (7% of total government revenues in Ontario, see Figure 13). A few organizations, however, do rely on municipal government: of the 27% of revenues that Environment groups receive from the government, 79%E is obtained from municipal sources. Other organizations whose government funding comes primarily from municipalities include Development and Housing and Religion organizations (where 37% and 35% respectively
E use with caution

Ontario’s Nonprofit and Voluntary Sector 21
of government revenues come from municipal sources) and the Arts and Culture sector (where 34%E of government revenues come from municipal sources).
There are also notable regional differences in the funding mix among sub‐sectors like Health and Education and Research (see Figure 12). For instance, Grant‐making, Fundraising and Volunteerism Promotion organizations derive roughly 8% of their revenues from government sources in Ontario and 53% from gifts and donations. At the national level, however, similar organizations rely on government for 30% of their revenues but receive only 32% from gifts and donations. Ontario Education and Research organizations receive only 17% of revenues from government sources while their Canadian counterparts receive 46%. Overall, earned income (at 66%) is a much more important source of income in Ontario than elsewhere. Further, Ontario Sports and Recreation groups raise over one‐third of revenues through gifts and donations relative to the national average of 20%. These types of differences in the ways in which organizations generate revenues highlight the diversity of Canada’s nonprofit and voluntary sector – both between sub‐sectors and across regions.
How do sources of revenues vary by size of organization?
Larger revenue organizations tend to rely more heavily on government funding than do smaller organizations. Excluding Hospitals, Universities and Colleges, which rely disproportionately on government sources, 27% E of revenues for organizations with revenues over $10 million and 37% for organizations with revenues between $1 million and $9,999,999, come from government. Interestingly, Canadian organizations (excluding Hospitals, Universities and Colleges) with revenues over $10 million rely to even a greater extent on government revenue (41% E).
By contrast, gifts and donations make up a greater proportion of the revenues of smaller organizations.13 Both large and small organizations in Ontario, with a few notable exceptions, derive the bulk of their revenues from earned income.
E use with caution 13 There is a greater reliance on gifts and donations among Ontario organizations (excluding Hospitals, Universities and Colleges) with annual revenues over $10 million (22%) compared to the national average (12%).

Ontario’s Nonprofit and Voluntary Sector 22
Figure 14: Sources of government revenue by revenue size, excluding Hospitals, Universities and Colleges
E use with caution
How much revenue is transferred to other organizations?14 Thirty per cent of Ontario nonprofit and voluntary organizations transfer or disburse funds to other organizations, slightly higher than the national average at 27%. These transfers make up to 6% of the total revenues of nonprofit and voluntary organizations in Ontario. The vast majority of these transfers, 88%, are made to nonprofit and voluntary organizations within Canada, while some 10% of the transfers are made to organizations outside of Canada. A small proportion, 1% is transferred to the Canadian government.
How much do organizations rely on in-kind donations of goods and services?
Twenty‐eight per cent of organizations in Canada reported receiving in‐kind donations of goods and services. Across Canada, British Columbia and Alberta receive the largest proportion of in‐kind donations at 36%, eight percentage points above the national average. In Ontario, 26% of organizations received in‐kind donations, for a total value of $1.15 billion, representing two percent of total revenues received by Ontario organizations (see Figure 15).
14 These figures are based on reports of organizations that transfer funds to other organizations.
$10M +
$1M- $9.9M
$500K- $999.9K
$250K- $499.9K
$100K- $249.9K
$30K- $99.9K
$29.9K or less
100% 80% 60% 40% 20% 0%
11%51%31%6%
16%44%34%6%
21%43%32%4%
27%43%26%4%
35%43%18%4%
38%40%17%5%
41%45%12%2%
Government Earned income
Gifts & donations
Other income
0% 20% 40% 60% 80% 100%
10% 51% 34% 6%
6% 48% 38% 8%
14% 43% 40% 3%
17% 49% 31% 3%
31% 47% 19% 3%
37% 39% 19% 5%
27% 49% 22% 2%
Canada Ontario
E E E E E
E

Ontario’s Nonprofit and Voluntary Sector 23
Figure 15: Percentage of organizations receiving in‐kind donations by region
Table 2: Percentage of organizations that receive in‐kind donations
Ontario Canada
Receive in-kind donations of goods or materials
20% 21%
Receive in-kind donations of business services
15% 15%
Table 3: Approximate value of in‐kind donations received by organizations
Ontario Canada
Dollar value Percentage of total revenues
Dollar value Percentage of total revenues
Approximate value of in-kind donations of goods or materials
$845,353,548 2% $1,822,095,032 2%
Approximate value of in-kind donations of business services
$301,935,153 1% $527,142,627 0.5%
Total revenues $47,719,507,235 100% $111,595,560,896 100%
0%
5%
10%
15%
20%
25%
30%
35%
40%36% 36%
29%
26%24%
27%
AtlanticQuebecOntarioPrairies &Territories
AlbertaBritishColumbia
Ontario’s Nonprofit and Voluntary Sector 24
What is the pattern of financial resource dependency among Ontario organizations?15 Overall, organizations in Ontario have a very diversified pattern of revenue sources. However, within given sectors, there is also considerable variation in the extent of dependency on particular sources. A large group of organizations in Ontario (46%) are primarily dependent on earned income, in that they derive more than 50% of their income from earned income sources (see Figure 16). One‐third (32%) is dependent upon gifts and donations while only 12 % of nonprofit and voluntary organizations are dependent on government sources. Ten percent rely on a diverse mix of funding sources.16
There is significant regional variation when it comes to revenue dependency. When compared to other regions, Ontario, British Columbia and Alberta have the smallest proportion of organizations dependent on government revenues. Quebec has the largest proportion of organizations (25%) that depend on government sources for more than 50% of annual revenues. The proportion of organizations dependent on earned income — with the exception of the Atlantic region — ranges from 40% to 51%. The proportion of organizations dependent on gifts and donations — with the exception of Quebec — is roughly one‐third of organizations.
15 Organizations that receive more than 50% of or their revenues from a specific source – for example, government or earned income – are considered to be dependent on that source of income. 16 Organizations with a diverse mix of funding do not rely on any one source of funding for more than 50% of their revenues.

Ontario’s Nonprofit and Voluntary Sector 25
Figure 16: Revenue dependency by region
0%
10%
20%
30%
40%
50%
60%
70%
80%
90%
100%12%
51%
28%
9%
11%
50%
30%
9%
17%
40%
31%
11%
12%
46%
32%
10%
25%
48%
14%
13%
19%
37%
34%
11%
Government Earnedincome
Gifts &donations Diverse
AtlanticQuebecOntarioPrairies &Territories
AlbertaBritishColumbia
How did revenues levels vary between 2000 and 2003?
Economically, the period between 2000 and 2003 was fairly strong in Ontario, continuing the period of recovery after the recession of the early 1990’s .17 Employment levels were also stable, edging up slightly in 2003,18 and average incomes grew. Both the federal and Ontario governments began reinvesting in selected areas such as health, following significant cutbacks to nonprofit and voluntary organizations after the 1995 federal budget and the election of the Conservative government.
During this period of relative stability, 39% of nonprofit and voluntary organizations in Ontario experienced an increase in their revenues compared to 36% for Canada as a whole; a slightly larger proportion of organizations in Ontario (40%) and Canada (42%)
17 See Ontario, Ministry of Finance, Budget 2004, Annex 1: Ontario Economic Outlook and Fiscal Review, http://www.fin.gov.on.ca/english/budget/bud03/papera.html, Ontario Ministry of Finance, Ontario Budget 2003, Annex 2: Ontario Economic Outlook and Fiscal Review, http://www.fin.gov.on.ca/english/economy/ecoutlook/statement03/03fs‐paperb.html, and Statistics Canada, “Year‐end Review”, Canadian Economic Observer, April 2004, Catalogue 11‐010‐XPB 18 However, over this period, there was a slight increase in the rate of part‐time and temporary employment.

Ontario’s Nonprofit and Voluntary Sector 26
remained about the same whereas 21% of Ontario organizations and 22% of Canadian organizations experienced a decrease in revenues (see Figure 17).19
Figure 17: Reported change in revenues over the past three years by region
In Ontario, sectors most likely to report revenue increases included Education and Research; Health, Universities and Colleges, International organizations, Social Services, Health, Development and Housing; and Arts and Culture. Those most likely to report stable revenues were Business or Professional Associations and Unions, Environment, Religion, Sports and Recreation, Grant‐making, Fundraising and Voluntarism Promotion, and Law, Advocacy and Politics. One‐third of International groups reported a decrease in revenues, while roughly one‐quarter of organizations in Sports and Recreation, Grant‐making, Fundraising and Voluntarism Promotion, Arts and Culture, Social Services, and Law, Advocacy and Politics did so.20
Ontario organizations that relied on government sources for more than half of their revenues were more likely to report revenue increases over the 2000 to 2003 period (48%, see Figure 18) compared to organizations that were dependent on earned income (38%), gifts and donations (36%), or a diverse mix of funding sources (43%). Comparable figures for Canada are 43%, 35%, 35% and 33%, respectively. In Ontario, the relatively small group of organizations dependent on government funding for more than 50% of
19 These figures refer to the 77% of organizations that were incorporated and were in operation for at least three years at the time of the survey. 20 Note that half of International groups reported increases.
0%
10%
20%
30%
40%
50%
60%
70%
80%
90%
100%
35%
37%
29%
38%
41%
21%
35%
41%
23%
39%
40%
21%
35%
47%
19%
33%
43%
24%
Revenues increased
Revenues stayed about the same
Revenues decreased
AtlanticQuebecOntarioPrairies &Territories
AlbertaBritishColumbia

Ontario’s Nonprofit and Voluntary Sector 27
their funding (12% of all such organizations) were the most likely to experience revenues gains.
Figure 18: Reported change in revenues over the past three years by revenue dependency
0% 20% 40% 60% 80% 100%
48% 38% 14%
38% 39% 23%
36% 43% 21%
43% 35% 21%Other
income
Gifts &Donations
Earned income
Government
100% 80% 60% 40% 20% 0%
43%39%18%
35%43%23%
35%42%23%
33%46%22%
Revenues increased
Revenues stayed about the same
Revenues decreased
Canada Ontario

Ontario’s Nonprofit and Voluntary Sector 28
Human Resources In Ontario, organizations that rely exclusively on volunteers to pursue their goals exist alongside very large organizations with staff complements numbering in the thousands. In this section of the report we turn our attention to the significant contribution of volunteers and paid staff in Ontario nonprofit and voluntary organizations.
Even though Ontario has the second highest proportion of voluntary and nonprofit organizations in Canada at 28%, it enjoys the highest proportion of both paid staff and volunteers when compared to other regions (see Figure 19). Organizations in Ontario employ 47%E of all paid staff in Canada, more than twice as many as the next largest region, Quebec (23%). Similarly, 40% of all volunteers are engaged in Ontario organizations, compared to 23% E in Quebec. It is apparent that there are many large organizations in Ontario, defined both in terms of revenue and paid staff and volunteers.
Figure 19: Percentage of organizations, percentage of volunteers, and percentage of paid staff by region
E use with caution
E use with caution
0%
5%
10%
15%
20%
25%
30%
35%
40%
45%
50%
10%
13%
8%7%
12%13%
9%11%
9%
28%
40%
47%
29%
23% 23%
8%
5% 5%
% organizations % total volunteers % total paid staff
AtlanticQuebecOntarioPrairies &Territories
AlbertaBritishColumbia
E
E

Ontario’s Nonprofit and Voluntary Sector 29
Volunteers
How many volunteers work in Ontario organizations?
Board and non‐board volunteers play key roles in governance, programs and service delivery, communications, fundraising and outreach. In Ontario, the overall number of volunteers is 7.8 million, comprising roughly 400,000 board volunteers and 7.4 million non‐board volunteers.21 Together, Ontario volunteers represent 40% of all volunteers in Canada, many likely volunteering for more than one organization at a time
The proportion of non‐board volunteers in Ontario (41% of the national total) is in keeping with the relative size of Ontario’s population. Annually, non‐board volunteers in Ontario devote a considerable amount of time to their work. In total, non‐board volunteers contributed over 730 million hours in 2003,22 representing 34% of all hours volunteered in Canada. On average, each non‐board volunteer in Ontario contributed 99 hours in 2003 to nonprofit and voluntary organizations, a figure that is somewhat lower than the Canadian average of 119 hours. Board volunteers in Ontario, on the other hand, contributed an average of 156 hours in 2003, a number slightly higher than the national average of (155 hours).
Where do volunteers contribute their time?
A small number of organizations account for the bulk of volunteers and volunteer time. This is true across Canada, and certainly in Ontario. Seven per cent of organizations in Ontario have 200 or more non‐board volunteers, one percentage point higher than the overall Canadian proportion (6%), while 9% of Ontario organizations have complements of between 100 and 199 (see Figure 20). These two groups of Ontario organizations account for 89% of all non‐board volunteers. Thus, the majority of nonprofit and voluntary organizations have relatively small volunteer complements. In fact, one‐fifth (20%) of all nonprofit and voluntary organizations in Ontario do not have any non‐board volunteers at all.
21 It is important to note that volunteers tend to volunteer for more than one organization, and this is evident here. According to the National Survey of Giving, Volunteering and Participating, 2,378,000 of Ontarians volunteered for a charitable or nonprofit organization in 2000. 22 This estimate is based on the total number of volunteer hours reported by organizations. The NSGVP estimates that Ontarians volunteered a total of 393,500,000 hours (the equivalent of 205,000 full‐time jobs) in 2000, an average of 165 hours per year.

Ontario’s Nonprofit and Voluntary Sector 30
Figure 20: Percentage of organizations by number of volunteers
Larger organizations in Ontario, as measured by annual revenues, also tend to have the largest volunteer complements despite the fact that one might well argue that smaller organizations have a greater need for the assistance of volunteers. Organizations with revenues of $10 million or more accounted for 37% of all volunteers in Ontario compared to 20% of all Canadian volunteers in these high‐revenue organizations (see Figure 21).
A further 17% of volunteers in Ontario were engaged in organizations with revenues between $1 million and $9,999,999 (versus 14% of Canadian volunteers). The marked concentration of volunteers in large organizations is a notable feature of the Ontario nonprofit and voluntary sector. Across the rest of Canada, the majority of volunteers work in organizations with revenues under $1 million; the largest single concentration is in organizations with revenues between $100,000 and $249,999.
Volunteers working in smaller Ontario organizations make a sizable impact despite their relatively small numbers. While there were considerably fewer volunteers working in Ontario organizations with revenues under $30,000 (10% of total volunteers), they contributed, on average, the highest number of hours per year (179 hours).
0%
5%
10%
15%
20%
25%
30%
35%
40%
21%20%
16%15%
23%
20%
26%29%
8%9%
6%
No volunteers 1 - 9volunteers
10 - 24volunteers
25 - 99volunteers
100 - 199 volunteers
200 volunteersor more
% all organizations% Ontarioorganizations
7%

Ontario’s Nonprofit and Voluntary Sector 31
Figure 21: Percentage of organizations and percentage of volunteers by revenue size
E use with caution
Which areas of the nonprofit and voluntary sector draw the greatest numbers of volunteers?
The make up of the Ontario nonprofit and voluntary sector is quite similar to the composition of the Canadian sector as a whole (see Figure 22). The same cannot be said of the distribution of volunteers. The share of volunteers varies widely among different areas. Organizations in Arts and Culture, Social Services, Development and Housing, Grant‐making, Fundraising and Voluntarism Promotion, Religion, and Environment all have volunteer complements that are proportionally smaller than their organizational share, in some instances, considerably smaller.
$10M +
$1M- $9.9M
$500K- $999.9K
$250K- $499.9K
$100K- $249.9K
$30K- $99.9K
$29.9K or less
50% 40% 30% 20% 10% 0%
42%12%
21%10%
16%26%
8%11%
5%6%
6%14%
1%20%
% organizations % volunteers
0% 10% 20% 30% 40%
34%10%
21%5%
16%8%
11%15%
7%7%
9%17%
Canada Ontario
1%37%
E
E
E

Ontario’s Nonprofit and Voluntary Sector 32
Figure 22: Percentage of organizations and percentage of volunteers by primary activity area
E use with caution
These differences tend to be more pronounced in Ontario than for Canada as a whole. For example, 9% of all nonprofit and voluntary organizations in Ontario work in the Development and Housing sector, yet these organizations account for only 1% of all volunteers. The comparable figures for Canada are 8% and 2% respectively. Religion organizations make up the largest single activity area, yet this area accounts for only 9% of Ontario volunteers. Similarly, Canadian Social Service organizations (12% of the total)
40% 30% 20% 10% 0%
19%11%
21%28%
10%9%
12%19%
8%2%
9%5%
8%
5%5%
3%4%
3%4%
2%2%
2%2%
1%1%
1%2%
0% 10% 20% 30% 40%
23%9%
16%39%
12%6%
11%7%
9%1%
8%3%
5%14%
5%10%
3%4%
2%1%
2%2%
2%0.3%
1%1%
1%3%
% organizations % volunteers
Hospitals, Universities & Colleges
International
Other
Law, Advocacy & Politics
Environment
Health
Business, Professional Associations,
Unions
Education& Research
Arts & Culture
Development & Housing
Social Services
Grantmaking, Fundraising & Voluntarism Promotion
Sports & Recreation
Religion
Canada Ontario
5%
E
E
EE

Ontario’s Nonprofit and Voluntary Sector 33
account for 19%E of all volunteers while in Ontario, such organizations (11% of the total) account for only 7% of volunteers
By contrast, Sport and Recreation (16% of all organizations), Education and Research (5% of all organizations), Business and Professional Associations and Unions (5% of all organizations) and Hospitals, Universities and Colleges (1% of all organizations) have larger proportional volunteer complements than their organizational share (see Figure 22). Again, the differences are larger than those evident for Canada as a whole. Sports and Recreation groups in Ontario, for instance, account for 39% of all volunteers, compared to 28% of all Canadian volunteers.
Another interesting point of variation is the average contribution of volunteers in each area. In Ontario, volunteers with International organizations – just 1% of all volunteers – donated the most time: an average of 713 hours per year. A relatively small core of volunteers with Health organizations (4% of total volunteers) contributed 200 hours per year. Volunteers involved with the many Religion organizations in Ontario made the third highest average contribution with 188 hours per year. Sports and Recreation groups accounting for the largest complement of volunteers (39% of the total) donated 76 hours on average per year.23
How have volunteer numbers changed between 2000 and 2003?
According to the NSNVO, the volunteer complements of Ontario organizations have been relatively stable: over half of organizations (54%) reported that their numbers did not change appreciably between 2000 and 2003.24 One‐third all organizations in Ontario (31%) enjoyed an increase in numbers while 14% experienced a decrease (see Figure 23). Relative stability in volunteer levels was also evident across most activity groups in the sector with the exception of International organizations, where (54%) reported an increase in volunteers and Sports and Recreation groups with 22% experiencing declining levels.
Compared to other regions in Canada, nonprofit and voluntary organizations in Ontario were most likely to have experienced an increase in their number of volunteers and the least likely to have experienced a decrease. Moreover, organizations in Ontario already E use with caution 23 Despite the relatively low average contribution by volunteers in Sports and Recreation, this sector still accounted for 29% of total volunteer hours. Religion accounted for 17% and Education and Research for 10%. The small cadre of volunteers working for International organizations accounted for 6% of total hours volunteered. 24 These figures apply to the 63% of organizations that were incorporated, that had been in operation for at least three years, and that had volunteers (excluding those involved in governance).

Ontario’s Nonprofit and Voluntary Sector 34
having a large number of volunteers were most likely to report an increase in the number of volunteers. At the same time, the size of the existing volunteer complement did not seem affect the likelihood of a decrease.
Figure 23: Reported change in volunteers over the past three years by region
Are changes in revenues linked to changes in volunteer levels?
Ontario organizations experiencing an increase in revenues between 2000 and 2003 were also the most likely to have experienced an increase in volunteers (see Figure 24). Those organizations experiencing declining revenues were more likely than organizations with stable or increased revenues to reduce their number of volunteers (44% compared to 12% and 8% respectively).25 It is apparent that well‐resourced organizations – as measured by revenues – are often in the best position to attract and retain volunteers.
25 It is important to note that these figures refer only to 63% of Ontario organizations that were incorporated, that had been in operation for at least three years and that had volunteers.
0%
10%
20%
30%
40%
50%
60%
70%
80%
90%
100%
52%
19%
49%
21%
54%
21%
54%
14%
58%
18%
56%
20%
Volunteers increased
Volunteers remained about the same
Volunteers decreased
AtlanticQuebecOntarioPrairies &Territories
AlbertaBritishColumbia
29% 30% 25%31%
24% 24%

Ontario’s Nonprofit and Voluntary Sector 35
Figure 24: Reported change in volunteers over the past three years by reported change in revenues
Paid Staff
How many people are employed in the nonprofit and voluntary sector in Ontario?
The nonprofit and voluntary sector is a significant employer in Ontario and across Canada. In Ontario, just under one million people (958,678) were employed in nonprofit and voluntary organizations in 2003, representing about one‐sixth of all employed Ontarians. 26 Almost half (47%) of all paid employees in nonprofit and voluntary organizations are employed in Ontario.27
The distribution of Employees, however, like the distribution of revenues, is highly skewed. Many nonprofit and voluntary organizations operate and function with no paid staff at all. In fact, over half of all nonprofit and voluntary organizations in Ontario (53%) and Canada (54%) have no paid staff.
26 In 2003, there were 6.7 million people in the Ontario labour force, 6.2 million of whom were employed. Leaving aside the self‐employed, there were 5.3 million employees. (Statistics Canada, Labour Force Survey Historical Review, 2003. CD‐Rom Catalogue No. 71F0004X CB) 27 Paid employees are defined as those who receive T4 slip for income tax purposes.
0%20%40%60%80%100%
Volunteersincreased
Volunteers stayed about the same
Volunteers decreased
Revenues decreased
Revenues remained about the
same
Revenuesincreased
Canada Ontario
0% 20% 40% 60% 80% 100%
43%46%10%
20%64%16%
15%50%35%
46% 46% 8%
23% 66% 12%
24% 32% 44%

Ontario’s Nonprofit and Voluntary Sector 36
Moreover, the distribution of paid staff among the 47% of Ontario organizations that employ staff is also uneven. Over half of this group (57%) has less than five employees, while 15% has between five and nine employees. Only 6% of Ontario organizations with paid staff have a staff compliment of 100 or more and a sizeable proportion of these organizations are Hospitals, Universities and Colleges. Over half (55%) of Ontario Hospitals, Universities and Colleges that employ staff have staff complements of 100 or more compared to just 6% of other organizations in Ontario.
Are paid staff more likely to work full-time or part-time, or on a permanent or temporary basis?
Another important dimension of employment is full‐time and part‐time status.28 In Ontario, 55% of employees in the nonprofit and voluntary sector were employed on a full‐time basis (see Table 4). The prevalence of part‐time employment was highest in the Hospitals, Universities and Colleges sector (57%) compared to other organizations in Ontario, and also six percent above the national average for this sub‐sector (38%). Overall, the rate of part‐time employment among nonprofit and voluntary organizations is much higher than the average for Ontario (18.3%) and Canada (18.8%) generally. 29
In the nonprofit and voluntary sector, the majority of paid employees were permanent staff in both Ontario (69%) and Canada (65%).30 The Ontario group with the highest proportion of permanent paid staff was the Hospitals and Universities and Colleges sector, where 74% of all staff were permanent, compared to 66% of employees in other nonprofit and voluntary organizations. Hospitals and Universities and Colleges organizations in Ontario were somewhat less likely to employ paid staff on a temporary basis (26%) compared to other nonprofit and voluntary organizations (34%), although more likely to employ people on a part‐time basis. Nonprofit and voluntary organizations in Ontario fill a greater proportion of their staff positions with temporary employees (31%), than employers in Ontario (10.9%) or Canada (12.5%) in general.31
28 Part‐time staff work less than 30 hours per week while full‐time work 30 or more hours per week. 29 These estimates are for all sectors of the economy: nonprofit, for‐profit and public sector. Statistics Canada, Labour Force Historical Review, 2003. CD‐Rom Catalogue no. 71F0004X CB 30 Permanent employees are defined as those with no set termination date. Conversely, temporary employees are those with a set termination date. 31 Statistics Canada, Labour Force Historical Review, 2003. CD‐Rom Catalogue no. 71F0004X CB

Ontario’s Nonprofit and Voluntary Sector 37
Table 4: Number of paid staff
Number of paid
employees (T4)
Number of permanent employees
(T4)
Number of non-
permanent employees
Number of full-time
employees (T4)
Number of part-time
employees
All organizations Ontario 361,812 266,657 95,155 157,552 204,260
Canada 2,031,744 1,320,763 710,980 1,147,615 884,129
All organizations excluding Hospitals, Universities, & Colleges
Ontario 361,812 266,657 95,155 157,552 204,260
Canada 1,335,988 827,171E 508,817 806,953E 529,035
Hospitals, Universities & Colleges
Ontario 361,812 266,657 95,155 157,552 204,260
Canada 695,755 493,592 202,163 340,662 355,094
E Use with caution
Which areas of the nonprofit and voluntary sector employ the greatest numbers of paid staff?
Hospitals, Universities and Colleges are the largest employers in the nonprofit and voluntary sector by a considerable margin (38% of all paid employees in Ontario and 34% in Canada, see Figure 25). The next largest group of employers in Ontario is Development and Housing organizations with 15%E of all paid employees compared to 9% for Canada as a whole. Social Services employ 13% of all paid staff in Ontario nonprofit organizations, compared to 15% nationally. Eleven percentE of employees working in the nonprofit and voluntary sector is employed by Business and Professional Associations and Unions compared to only 7%E nationally. International organizations and those in Environment groups represent the smallest share of all paid staff in Ontario.
E use with caution

Ontario’s Nonprofit and Voluntary Sector 38
Figure 25: Percentage of organizations and paid staff by primary activity area
E use with caution
Where are paid staff concentrated?
Predictably, paid staff are concentrated in the largest revenue nonprofit and voluntary organizations. Looking at the whole Ontario nonprofit and voluntary sector, we see that the one percent of organizations with revenues of $10 million or more in 2003 employed 53%E of all sector employees (for Canada, the share of employees employed by the largest organizations was 46%E). Indeed, three‐quarters of all paid staff in Ontario (76%E) E use with caution
0% 10% 20% 30% 40%
5%
23%5%
16%
12%1%
11%13%
9%15%
8%3%
5%2%
5%11%
3%5%
2%0.3%
2%1%
2%1%
1%0.3%
1%38%
Hospitals, Universities & Colleges
International
Other
Law, Advocacy & Politics
Environment
Health
Business, Professional Associations,
Unions
Education & Research
Arts & Culture
Development & Housing
Social Services
Grantmaking, Fundraising & Voluntarism Promotion
Sports & Recreation
Religion
40% 30% 20% 10% 0%
19%5%
21%6%
10%1%
12%15%
8%9%
9%4%
5%5%
5%7%
3%9%
3%1%
2%1%
2%2%
1%0.2%
1%34%
% organizations % paid staff
Canada Ontario
E
E
E
E
E
E
E

Ontario’s Nonprofit and Voluntary Sector 39
worked for nonprofit and voluntary organizations with revenues over $1 million. By contrast, the one‐third of organizations with revenues under $30,000 employed just one percent of employees. It is interesting to note, however, that Ontario organizations with revenues between $30,000 and $99,999 – 21% of the total number – employed a larger proportion of people (14%E) than the one‐third of organizations with revenues between $100,000 and $999,999, a group that employed only 9% of all paid employees (see Figure 26).
Figure 26: Percentage of organizations and paid staff by revenue size
E use with caution
Even when Hospitals and Universities and colleges are excluded, large revenue Ontario organizations still dominate (see Figure 27). The share of employment increases for both large organizations ($1 million to $9,999,999) and relatively the small organizations ($30,000 to $99,999) which tend to be overrepresented by Development and Housing and Social Services.
E use with caution
$10M +
$1M- $9.9M
$500K- $999.9K
$250K- $499.9K
$100K- $249.9K
$30K- $99.9K
$29.9K or less
% organizations % total paid stafff
0% 10% 20% 30% 40% 50% 60%
34%1%
21%14%
16%3%
11%2%
7%4%
9%23%
1%53%
Ontario
42%1%
21%9%
16%5%
8%5%
5%7%
6%28%
1%46%
Canada
60% 50% 40% 30% 20% 10% 0%
E
E
E
E

Ontario’s Nonprofit and Voluntary Sector 40
Figure 27: Percentage of organizations and paid staff by revenue size, excluding Hospitals, Universities and Colleges
E use with caution
How have employment levels changed between 2000 and 2003?
Most Ontario organizations experienced stable staff levels between 2000 and 2003 (see Figure 28).32 Sixty percent of nonprofit or voluntary organizations in Ontario and Canada had approximately the same number of paid staff over the previous three years.33 Among those reporting change, three‐quarters (30% of all Ontario organizations) increased the number of staff in their employ while one‐quarter experienced a decrease
32 These figures apply to the 47% of organizations in Ontario and 39% of organizations across Canada that were incorporated, that had been in operation for at least three years, and that had employees. 33 It is important to note that stable staffing levels can mask a good deal of change. The NSNVO does not provide information on staff turnover.
$10M +
$1M- $9.9M
$500K- $999.9K
$250K- $499.9K
$100K- $249.9K
$30K- $99.9K
$29.9K or less
0% 10% 20% 30% 40% 50% 60%
9%
30%
21%
16%3%
11%
7%
4%
23%
1%
Ontario
50% 40% 30% 20% 10% 0%
42%2%
21%
16%7%
8%8%
5%10%
6%36%
1%25%
Canada
6%
33%
34%1%
13%E E
E
% organizations % total paid stafff

Ontario’s Nonprofit and Voluntary Sector 41
Figure 28: Reported change in paid staff over the past three years by region
Nonprofit or voluntary organizations that already had large numbers of paid staff were much more likely to have increased their staff complement in both Ontario and Canada (see Figure 29). Sixty‐one percent of organizations in Ontario with 100 or more paid staff (56% in Canada) increased their paid staff numbers between 2000 and 2003. In contrast, only 17% of organizations with four or fewer paid staff in Ontario (19% in Canada) increased their number of paid staff over the same period.
Paid staff increased
Paid staff remained about the same
Paid staff decreased
0%
10%
20%
30%
40%
50%
60%
70%
80%
90%
100%
AtlanticQuebecOntarioPrairies &Territories
AlbertaBritishColumbia
30%24% 28%
30% 26% 35%
63% 65% 55%60% 63% 55%
7% 11%18% 10% 10% 10%

Ontario’s Nonprofit and Voluntary Sector 42
Figure 29: Reported change in paid staff over the past three years by number of paid staff
While the majority (60%) of organizations maintained their staffing levels those in Education and Research, and in Health were the most likely to report increases (33% and 26%, respectively). One‐third of Law, Advocacy and Politics organizations (34%) cut paid staff, the highest percentage of any sub‐sector.
Are changes in revenues linked to changes in employment levels?
Of the 39% of Ontario organizations that experienced an increase in revenues, just under half (47%) increased their paid staff numbers (see Figure 30). The majority (77%) of organizations experiencing no change in revenues over the three years experienced little change in their numbers of paid staff. Organizations in Ontario showing a decrease in their revenues between 2000 and 2003 were much more likely than organizations in better financial circumstances to have decreased their employment levels (30%).
100 or more paid staff
25 - 99 paid staff
10 - 24 paid staff
5 - 9 paid staff
1 - 4 paid staff
No paid staff
100% 80% 60% 40% 20% 0%
2%92%7%
19%70%11%
39%50%11%
45%44%11%
45%48%7%
56%33%11%
0% 20% 40% 60% 80% 100%
2% 92% 5%
17% 71% 11%
39% 52% 9%
40% 47% 13%
45% 53% 2%
61% 36% 3%
Canada Ontario
Paid staffincreased
Paid staff remained about the same
Paid staff decreased

Ontario’s Nonprofit and Voluntary Sector 43
Figure 30: Reported change in paid staff over the past three years by reported change in revenues
What is the connection between staff and volunteer numbers?
Ontario organizations where the number of paid staff increased between 2000 and 2003 were the most likely to have experienced an increase in volunteers as well (53% of all who experienced staffing increases, see Figure 31). By comparison, organizations that experienced a decline in paid staff were not as successful in attracting more volunteers (17%). Indeed, organizations in this group were more likely to have sustained their existing complement of volunteers or experienced a decline (61% and 22%, respectively).34 This suggests that well‐resourced organizations have a greater ability to mobilize and engage volunteers, irrespective of which organizations might benefit most from more volunteer support.
34 These figures apply to the 47% of organizations in Ontario that were incorporated, that had been in operation for at least three years, and that had employees.
47%%
48%5%
18%73%9%
13%62%25%
0% 20% 40% 60% 80% 100%
47% 49% 4%
15% 77% 9%
8% 62% 30%
Revenuesdecreased
Revenues stayed about
the same
Revenuesincreased
Canada Ontario
0%20%40%60%80%100%
Paid staff increased
Paid staff remainedabout the same
Paid staff decreased

Ontario’s Nonprofit and Voluntary Sector 44
Figure 31: Reported change in volunteers over the past three years by reported change in paid staff
0% 20% 40% 60% 80% 100%0%20%40%60%80%100%
Paid staff decreased
Paid staffremained about the
same
Paid staff increased
Canada Ontario
48%38%14%
26%56%18%
21%54%25%
13%34%53%
12%56%33%
22%61%17%
Volunteersincreased
Volunteers remained about the same
Volunteersdecreased

Ontario’s Nonprofit and Voluntary Sector 45
Organizational Capacity The capacity of organizations to generate and sustain the resources necessary to pursue their mandates varies considerably across the nonprofit and voluntary sector. Despite the size and importance of nonprofit and voluntary activity in Ontario, many groups are struggling with a range of problems related to human resources, financing, planning and development, outreach, and infrastructure. The NSNVO provides an opportunity to explore these challenges and to ascertain which problems organizations consider to be most serious.35
In Ontario, the most commonly reported capacity problems are ‘difficulty planning for the future’, ‘difficulty recruiting type of volunteers’ and ‘difficulty obtaining board members’. The three problems most commonly reported as ‘serious’ by organizations in Ontario are ‘difficulty obtaining funding from other organizations’, ‘difficulty planning for the future’ and ‘increasing demand for services or products’. Among organizations that receive external funding36 the three problems most commonly reported as ‘serious’ are ‘reductions in government funding’, ‘unwillingness to fund core operations’ and ‘over‐reliance on project funding’ (see Table 5).
‘Difficulty planning for the future’ was identified by six in ten (60%) organizations in Ontario. Inability to plan is particularly troubling given the stresses that organizations face today. Concern about declining rates of volunteering is evident in the high number of Ontario organizations identifying problems with volunteer recruitment and retention: Organizations reported particular difficulties in ‘recruiting the right type of volunteers’, ‘obtaining board members’, and ‘retaining volunteers’ (57%, 49% and 48% respectively).
Financial capacity problems are also commonly reported by organizations in Ontario. Almost half (47%) of organizations reported ‘difficulty obtaining funding from individuals’, 44% reported ‘difficulty competing with other organizations’ and 42% reported ‘difficulty obtaining funding from other organizations’.
Two‐thirds of Ontario organizations in receipt of external funding reported that ‘reductions in government funding’ was a problem (68%); four in ten (40%) claimed that it was ‘a serious problem’. British Columbia was the only region where more
35 Each organization was asked whether a particular capacity issue was ‘not a problem,’ ‘a small problem’, ‘a moderate problem’ or a ‘serious problem.’ Organizations reporting no problem with a given issue may include those for which the issue is not applicable. Unless otherwise stated, the presence of a problem refers to the number reporting all levels of difficulty combined (i.e., the sum of responses of ‘a small problem’, ‘a moderate problem’, and ‘a serious problem.’ The “not a problem” category includes organizations for whom the particular issue may be “not applicable”. 36 These problems were identified by the 31% of organizations that were incorporated, that had been active for at least three years and that had received funding from governments, foundations or corporations over that period.

Ontario’s Nonprofit and Voluntary Sector 46
organizations than in Ontario claimed that ‘reductions in government funding’ was a serious problem. ‘Unwillingness to fund core operations’ was identified as another significant capacity challenge by 65% of Ontario organizations receiving external funding, the highest proportion in the country; 53% identified ‘over‐reliance on project funding’ as a problem as well.
Table 5: Top three ‘serious’ problems for Ontario organizations
Most Serious Problems All Organizations
Most Serious Problems
Organizations in Receipt of External Funding
• ‘Difficulty obtaining funding from other
organizations including government’ • ‘Difficulty in planning for the future’ • ‘Increasing demand for services or
products’
• ‘Reductions in government funding’ • ‘Unwillingness to fund core operations’ • ‘Over-reliance on project funding’
Do all organizations share the same capacity problems?
Does the level of revenues make a difference to the type of challenges that nonprofit and voluntary organizations experience? The NSNVO suggests that Ontario organizations in receipt of external funding, regardless of size, struggle with external funding issues.
‘Reductions in government funding’ was identified as the top problem by organizations receiving external funding with revenues under $30,000, those with revenues between $100,000 and $249,999, and those with revenues over $1 million (see Table 7). In fact, 85% of organizations receiving external funding with revenues over $10 million claimed that ‘reductions in government funding’ was a problem.

Ontario’s Nonprofit and Voluntary Sector 47
Table 6: Financial issues by revenue size
Difficulty earning
revenues
Difficulty obtaining funding from other
organizations
Difficulty obtaining funding from individuals
Difficulty competing with other
organizations
$29.9K or less Ontario 36% 35% 43% 38%
Canada 42% 41% 43% 38%
$30K–$99.9K Ontario 40% 38% 50% 39%
Canada 40% 46% 51% 41%
$100K–$249.9K Ontario 32% 39% 54% 46%
Canada 44% 53% 54% 47%
$250K–$499.9K Ontario 39% 45% 45% 44%
Canada 43% 56% 51% 51%
$500K–$999.9K Ontario 47% 57% 46% 53%
Canada 43% 60% 48% 49%
$1M–$9.9M Ontario 41% 66% 52% 63%
Canada 40% 60% 47% 55%
$10M + Ontario 25% 67% 45% 57%
Canada 22% 61% 40% 53%
All organizations Ontario 38% 42% 47% 44%
Canada 42% 48% 48% 43%
Ontario organizations receiving external funding with revenues between $30,000 and $99,999 and those with revenues between $500,000 and $9,999,999, identified ‘unwillingness to fund core operations’ as their top issue (see Table 7). The top problem for organizations in the $250,000 to $499,999 bracket was ‘difficulty in planning for the future.’

Ontario’s Nonprofit and Voluntary Sector 48
Table 7: External funding issues by revenue size37
Over-reliance on
project funding
Unwillingness to fund core operations
Need to modify
programs
Reporting requirements of
funders
Reductions in government
funding
$29.9K or less Ontario 45% 55% 34% 30% 57%
Canada 54% 50% 38% 29% 54%
$30K–$99.9K Ontario 55% 68% 54% 55% 66%
Canada 61% 61% 46% 44% 61%
$100K–$249.9K Ontario 57% 63% 48% 50% 72%
Canada 69% 66% 52% 50% 72%
$250K–$499.9K Ontario 55% 54% 39% 45% 65%
Canada 64% 65% 50% 52% 73%
$500K–$999.9K Ontario 47% 73% 48% 37% 68%
Canada 61% 67% 48% 44% 67%
$1M–$9.9M Ontario 59% 77% 61% 61% 77%
Canada 60% 68% 55% 51% 74%
$10M + Ontario 45% 63% 53% 43% 85%
Canada 52% 60% 51% 45% 81%
All organizations Ontario 53% 65% 47% 46% 68%
Canada 61% 61% 47% 43% 65%
While all Ontario organizations identified external funding as a capacity challenge, it was a particular problem for groups in the $30,000 to $99,999 revenue bracket (see Table 7). More than half of these (in receipt of external funding) reported that all five external funding issues were challenges for them, including ‘over‐reliance on project funding’, ‘reporting requirements’ and ‘pressures to modify programming.’
Human resource challenges are very important for organizations with revenues under $500,000 per year (see Tables 8 and 9). While problems related to external funding were the dominant preoccupation for the subset of groups within each revenue bracket that had received external funding between 2000 and 2003, overall, difficulty recruiting and retaining volunteers and obtaining board members was an important ongoing challenge.
37 These figures apply only to the 31% of organizations that were incorporated, that had been active for at least three years, and that had received funding from governments, foundations, or corporations over that period.

Ontario’s Nonprofit and Voluntary Sector 49
Table 8: Paid staff issues by revenue size
Difficulty obtaining type
of paid staff Difficulty retaining paid staff
Difficulty providing staff training and development
$29.9K or less Ontario 12% 25% 14%
Canada 13% 23% 14%
$30K–$99.9K Ontario 22% 13% 17%
Canada 28% 16% 26%
$100K–$249.9K Ontario 38% 16% 41%
Canada 40% 17% 38%
$250K–$499.9K Ontario 32% 17% 36%
Canada 45% 17% 42%
$500K–$999.9K Ontario 39% 22% 45%
Canada 49% 23% 46%
$1M–$9.9M Ontario 58% 20% 53%
Canada 55% 20% 49%
$10M + Ontario 61% 23% 55%
Canada 66% 24% 50%
All organizations Ontario 27% 18% 28%
Canada 28% 19% 27%

Ontario’s Nonprofit and Voluntary Sector 50
Table 9: Volunteer issues by revenue size38
Difficulty obtaining
board members
Difficulty training board
members
Difficulty recruiting
type of volunteers
Difficulty retaining
volunteers
Lack of paid staff to
recruit or manage
volunteers
Difficulty providing
training for volunteers
$29.9K or less Ontario 45% 25% 48% 42% 20% 29%
Canada 53% 26% 51% 45% 22% 28%
$30K–$99.9K Ontario 49% 32% 54% 44% 30% 35%
Canada 61% 36% 61% 52% 36% 37%
$100K–$249.9K Ontario 57% 48% 72% 63% 42% 54%
Canada 60% 43% 68% 57% 45% 46%
$250K–$499.9K Ontario 57% 39% 65% 57% 50% 57%
Canada 59% 42% 65% 57% 52% 54%
$500K–$999.9K Ontario 49% 41% 59% 44% 44% 44%
Canada 51% 44% 55% 42% 51% 47%
$1M–$9.9M Ontario 45% 43% 55% 47% 53% 50%
Canada 50% 43% 53% 46% 49% 47%
$10M + Ontario 38% 37% 65% 62% 45% 45%
Canada 42% 33% 54% 51% 45% 48%
All organizations Ontario 49% 34% 57% 48% 34% 41%
Canada 56% 34% 57% 49% 35% 38%
Organizations with revenues over $500,000 were concerned with a mix of issues. In addition to significant problems with external funding, organizations noted concerns with issues like strategic planning, adapting to change and increasing demand for products and services (see Table 10). Overall, a larger proportion of groups in these top revenue brackets reported problems than groups in lower revenue brackets. For instance, 60% of organizations with revenues over $1 million reported that they had ‘difficulty participating in public policy development,’ compared to 29% of organizations with revenues between $30,000 and $99,999. Even on an issue like ‘retaining volunteers,’ 62% of organizations in the top revenue category indicated that this was a challenge compared to 44% of organizations in the $30,000 to $99,999 bracket.
38 Only organizations with non‐board volunteers (80%) were asked about ‘difficulty in providing training for volunteers’ and ‘lack of paid staff to recruit or manage volunteers.’ Only organizations with directors (96%) were asked about ‘difficulty training board members.’

Ontario’s Nonprofit and Voluntary Sector 51
Table 10: Structural issues by revenue size
Difficulty collaborating
with other organizations
Difficulty planning for
the future
Difficulty participating
in policy development
Lack of internal capacity
Increasing demands
for services
or products
Difficulty adapting to
change
$29.9K or less Ontario 20% 50% 26% 24% 29% 31%
Canada 21% 53% 31% 28% 33% 33%
$30K–$99.9K Ontario 25% 62% 29% 37% 36% 33%
Canada 24% 61% 37% 41% 42% 42%
$100K–$249.9K
Ontario 25% 62% 46% 57% 51% 54%
Canada 25% 62% 47% 50% 52% 49%
$250K–$499.9K
Ontario 31% 72% 42% 51% 54% 47%
Canada 30% 68% 47% 50% 57% 47%
$500K–$999.9K
Ontario 25% 61% 41% 50% 46% 43%
Canada 26% 59% 50% 54% 52% 45%
$1M–$9.9M Ontario 28% 68% 60% 61% 62% 52%
Canada 27% 64% 58% 54% 61% 52%
$10M + Ontario 31% 72% 60% 53% 67% 78%
Canada 27% 64% 55% 57% 64% 69%
All organizations
Ontario 24% 60% 36% 41% 41% 40%
Canada 24% 58% 39% 39% 43% 41%
Does the source of funding affect organizational capacity?
There is clearly a link between the types of capacity challenges organizations experience and their funding mix (see Tables 11 to 14). With regard to external funding, organizations that were dependent on government sources for more than half of their revenues and those with a diversified funding base were more likely than earned income‐dependent or donation‐dependent groups to report problems.
The most pressing problems identified by Ontario organizations in receipt of external funding, regardless of their primary source of funding, are ‘reductions in government funding’ and ‘unwillingness by funders to fund core operations’. These two issues were among the top five problems facing government‐dependent organizations, earned income‐dependent organizations, donations‐dependent organizations, and diversified funding organizations.

Ontario’s Nonprofit and Voluntary Sector 52
Table 11: Financial capacity issues by revenue dependency
Difficulty earning
revenues
Difficulty obtaining funding
from other organizations
Difficulty obtaining funding from individuals
Difficulty competing with other
organizations
Government dependent
Ontario 44% 75% 61% 67%
Canada 48% 74% 58% 57%
Earned revenues dependent
Ontario 43% 40% 40% 42%
Canada 45% 46% 42% 41%
Grants and donations dependent
Ontario 24% 27% 50% 34%
Canada 28% 32% 48% 34%
Diverse Ontario 50% 56% 58% 57%
Canada 49% 53% 52% 49%
All organizations Ontario 38% 42% 47% 44%
Canada 42% 48% 48% 43%
Table 12: Paid staff issues by revenue dependency
Difficulty obtaining type of
paid staff Difficulty retaining paid
staff Difficulty providing staff
training and development
Government dependent
Ontario 52% 74% 55%
Canada 52% 23% 50%
Earned revenues dependent
Ontario 22% 85% 24%
Canada 22% 18% 21%
Grants and donations dependent
Ontario 24% 84% 23%
Canada 24% 14% 22%
Diverse Ontario 30% 79% 26%
Canada 27% 18% 25%
All organizations Ontario 27% 82% 28%
Canada 28% 19% 27%

Ontario’s Nonprofit and Voluntary Sector 53
Table 13: Volunteer issues by revenue dependency
Difficulty obtaining
board members
Difficulty training board
members
Difficulty recruiting
type of volunteers
Difficulty retaining
volunteers
Lack of paid staff to
recruit or manage
volunteers
Difficulty providing
training for volunteers
Government dependent
Ontario 63% 55% 67% 58% 59% 54%
Canada 67% 52% 65% 55% 59% 54%
Earned revenues dependent
Ontario 53% 31% 56% 48% 30% 40%
Canada 58% 31% 57% 49% 29% 34%
Grants and donations dependent
Ontario 37% 31% 53% 45% 28% 38%
Canada 44% 29% 54% 47% 29% 35%
Diverse Ontario 52% 34% 56% 45% 40% 35%
Canada 56% 34% 57% 47% 38% 36%
All organizations Ontario 49% 34% 57% 48% 34% 41%
Canada 56% 34% 57% 49% 35% 38%
Table 14: Structural issues by revenue dependency
Difficulty collaborating
with other organizations
Difficulty planning for
the future
Difficulty participating
in policy development
Lack of internal capacity
Increasing demands for services or products
Difficulty adapting to
change
Government dependent
Ontario 31% 75% 58% 65% 66% 49%
Canada 31% 70% 61% 60% 63% 50%
Earned revenues dependent
Ontario 23% 58% 36% 34% 38% 39%
Canada 22% 56% 36% 34% 38% 39%
Grants and donations dependent
Ontario 19% 55% 29% 40% 37% 40%
Canada 20% 55% 31% 35% 38% 41%
Diverse Ontario 36% 63% 37% 43% 40% 32%
Canada 27% 58% 39% 39% 41% 37%
All organizations
Ontario 24% 60% 36% 41% 41% 40%
Canada 24% 58% 39% 39% 43% 41%
Overall, organizations reliant on government sources for more than 50% of their funding were much more likely than other organizations to report problems with a range of

Ontario’s Nonprofit and Voluntary Sector 54
issues (see Table 15). Predictably, their most pronounced problems were with external funding:39 ‘Reductions in government funding’ was described by 81% of organizations as a problem, while ‘unwillingness to fund core operations’ was noted as a problem 78% of the time.
Table 15: External funding issues by revenue dependency
Over-reliance
on project funding
Unwillingness to fund core operations
Need to modify
programs
Reporting requirements of
funders
Reductions in government
funding
Government dependent
Ontario 59% 78% 60% 58% 81%
Canada 71% 72% 58% 55% 78%
Earned revenues dependent
Ontario 47% 54% 35% 37% 63%
Canada 54% 52% 40% 36% 59%
Grants and donations dependent
Ontario 47% 51% 42% 34% 45%
Canada 53% 53% 39% 29% 48%
Diverse Ontario 62% 82% 61% 59% 79%
Canada 60% 64% 47% 45% 68%
All organizations Ontario 53% 65% 47% 46% 68%
Canada 61% 61% 47% 43% 65%
It is interesting to note that this group of organizations was also most likely to have experienced increased revenues between 2000 and 2003. ‘Increased demand for services and products’ is clearly an important factor; with two‐thirds of government‐dependent organizations reported a problem, and 30% reporting a serious problem.
Even those organizations with a diversified revenue base reported considerable problems with external funding. ‘Difficulty obtaining funding from individuals’ (58%), ‘difficulty competing with other organizations’ (57%), and difficulty obtaining funding from other organizations’ (56%) were among the top issues for this group. Diversified organizations were also the most likely to report problems with ‘generating earned income’ (50%) compared to the organizations with other funding mixes.
Among all organizations dependent on earned income, difficulty planning for the future was the most pressing issue (58%). Earned income‐dependent groups were also much more likely to identify human resources challenges, including ‘difficulty recruiting the types of volunteers needed’, ‘difficulty obtaining board members’, and difficulty retaining volunteers.’
39 By definition, the whole of this group receives external funding.

Ontario’s Nonprofit and Voluntary Sector 55
‘Planning for the future’ (55%), ‘difficulty recruiting the types of volunteers needed’ (53%) and ‘difficulty obtaining funding from individuals’ (50%) were the top three concerns of all organizations dependent upon gifts and donations.
How does primary area of activity affect capacity?
Problems relating to funding were of concern across every area of the nonprofit and voluntary sector. Table 16 shows the top capacity concerns of organizations by activity area.
External funding is the greatest challenge for over three‐quarters of organizations receiving such funding and operating in the areas of Hospitals, Universities and Colleges, International, Health, Social Services, Arts and Culture, Environment, and Development and Housing (see Table 17).
Among all organizations surveyed, financing is a key concern for organizations in Arts and Culture, Education and Research; Social Services; International and Hospitals, Universities and Colleges. A majority of organizations in these areas expressed problems with obtaining funding from individuals and other organizations (see Table 18).

Ontario’s Nonprofit and Voluntary Sector 56
Table 16: External funding issues by primary activity area
Over-reliance on
Project Funding
Unwillingness to Fund Core Operations
Need to Modify
Programs
Reporting Requirements of
Funders
Reductions in Government
Funding
Arts and Culture
Ontario 70% 80% 57% 56% 77%
Canada 71% 70% 57% 45% 74%
Sports and Recreation
Ontario 39% 54% 37% 35% 63%
Canada 55% 54% 39% 37% 61%
Education and Research
Ontario 49% 68% 50% 47% 52%
Canada 64% 64% 52% 48% 69%
Health Ontario 79% 88% 65% 65% 85%
Canada 78% 85% 55% 61% 79%
Social Services
Ontario 67% 78% 55% 54% 81%
Canada 70% 71% 56% 53% 73%
Environment Ontario 28% 76% 62% 65% 76%
Canada 64% 71% 57% 49% 75%
Development and Housing
Ontario 47% 60% 31% 46% 72%
Canada 55% 49% 38% 39% 67%
Law, Advocacy and Politics
Ontario 50% 86% 66% 49% 72%
Canada 62% 72% 52% 49% 63%
Grantmaking, Fundraising and Promoting Volunteerism
Ontario 30% 34% 27% 33% 46%
Canada 48% 46% 36% 30% 49%
International Ontario 68% 59% 66% 63% 89%
Canada 60% 65% 53% 63% 70%
Religion Ontario 46% 24% 13% 7% 13%
Canada 40% 36% 25% 11% 26%
Business or Professional Associations or Unions
Ontario 29% 37% 41% 27% 60%
Canada 42% 44% 43% 30% 57%
Hospitals, Universities and Colleges
Ontario 77% 83% 77% 73% 90%
Canada 68% 66% 59% 55% 82% Other Ontario 3% 3% 44% 1% 45% Canada 52% 38% 44% 39% 51% All Organizations Ontario 53% 65% 47% 46% 68% Canada 61% 61% 47% 43% 65%

Ontario’s Nonprofit and Voluntary Sector 57
Table 17: Financial issues by primary activity area
Difficulty earning revenues
Difficulty obtaining funding from other
organizations
Difficulty obtaining funding from individuals
Difficulty competing with
other organizations
Arts and Culture Ontario 54% 63% 60% 65%
Canada 60% 70% 63% 59%
Sports and Recreation Ontario 56% 51% 53% 52%
Canada 51% 53% 47% 49%
Education and Research Ontario 49% 54% 60% 59%
Canada 52% 59% 55% 55%
Health Ontario 38% 68% 55% 58%
Canada 52% 73% 63% 61%
Social Services Ontario 49% 65% 69% 68%
Canada 43% 67% 60% 57%
Environment Ontario 45% 56% 58% 55%
Canada 50% 60% 53% 44%
Development and Housing Ontario 18% 30% 17% 21%
Canada 27% 38% 22% 26%
Law, Advocacy and Politics Ontario 69% 73% 66% 81%
Canada 53% 66% 57% 55%
Grantmaking, Fundraising and Promoting Volunteerism
Ontario 27% 31% 45% 44%
Canada 32% 38% 47% 47%
International Ontario 23% 66% 60% 62%
Canada 38% 64% 60% 58%
Religion Ontario 21% 17% 42% 21%
Canada 26% 20% 44% 20%
Business or Professional Associations or Unions
Ontario 45% 38% 20% 31%
Canada 43% 36% 24% 30%
Hospitals, Universities and Colleges
Ontario 25% 67% 85% 74%
Canada 26% 63% 63% 58%
Other Ontario 37% 39% 19% 29%
Canada 49% 51% 34% 39%
All Organizations Ontario 38% 42% 47% 44%
Canada 42% 48% 48% 43%

Ontario’s Nonprofit and Voluntary Sector 58
Table 18: Paid staff issues by primary activity area
Difficulty Obtaining Type of Paid Staff
Difficulty Retaining Paid Staff Difficulty Providing Staff
Training and Development Arts And Culture
Ontario 40% 23% 39%
Canada 38% 23% 35%
Sports and Recreation
Ontario 19% 25% 22%
Canada 19% 25% 19%
Education and Research
Ontario 26% 28% 33%
Canada 39% 27% 33%
Health Ontario 66% 39% 56%
Canada 54% 35% 46%
Social Services
Ontario 48% 21% 51%
Canada 49% 24% 47%
Environment Ontario 25% 11% 24%
Canada 24% 25% 23%
Development and Housing
Ontario 18% 8% 21%
Canada 21% 7% 23%
Law, Advocacy and Politics
Ontario 47% 6% 48%
Canada 32% 7% 37%
Grant-making, Fundraising and Promoting Volunteerism
Ontario 12% 20% 11%
Canada 14% 17% 13%
International Ontario 36% 55%
Canada 32% 2% 37%
Religion Ontario 24% 13% 22%
Canada 25% 12% 22%
Business or Professional Associations or Unions
Ontario 23% 11% 30%
Canada 25% 13% 27%
Hospitals, Universities and Colleges
Ontario 53% 55% 45%
Canada 50% 39% 41% Other Ontario 31% 5% 9% Canada 32% 3% 27% All Organizations Ontario 27% 18% 28% Canada 28% 19% 27%

Ontario’s Nonprofit and Voluntary Sector 59
Table 19: Volunteer issues by primary activity area
Difficulty obtaining
board members
Difficulty training board
members
Difficulty recruiting
type of volunteers
Difficulty retaining
volunteers
Lack of Paid Staff to
Recruit or Manage
Volunteers
Difficulty Providing
Training for Volunteers
Arts And Culture
Ontario 50% 44% 65% 55% 47% 44%
Canada 59% 42% 64% 54% 46% 43%
Sports and Recreation
Ontario 60% 36% 66% 60% 26% 40%
Canada 64% 32% 65% 58% 26% 33%
Education and Research
Ontario 52% 41% 60% 54% 29% 35%
Canada 58% 37% 59% 53% 38% 36%
Health Ontario 64% 39% 76% 55% 66% 43%
Canada 67% 52% 71% 53% 56% 54%
Social Services
Ontario 62% 47% 62% 51% 54% 51%
Canada 64% 47% 62% 52% 50% 47%
Environment Ontario 55% 44% 51% 56% 29% 51%
Canada 59% 35% 52% 48% 34% 42%
Development and Housing
Ontario 56% 24% 46% 35% 26% 33%
Canada 58% 27% 42% 36% 31% 32%
Law, Advocacy and Politics
Ontario 82% 49% 87% 73% 67% 60%
Canada 70% 51% 74% 61% 55% 52%
Grant-making, Fundraising and Promoting Volunteerism
Ontario 37% 25% 42% 33% 21% 35%
Canada 44% 25% 45% 37% 24% 30%
International Ontario 39% 44% 49% 51% 53% 59%
Canada 46% 44% 53% 46% 54% 51%
Religion Ontario 33% 29% 53% 45% 25% 37%
Canada 42% 27% 55% 48% 26% 33%
Business or Professional Associations or Unions
Ontario 44% 29% 54% 45% 55% 52%
Canada 56% 34% 54% 44% 43% 41%
Hospitals, Universities and Colleges
Ontario 66% 43% 59% 52% 42% 45%
Canada 60% 40% 52% 45% 42% 39% Other Ontario 37% 28% 44% 39% 12% 14% Canada 49% 31% 43% 37% 38% 44% All Organizations Ontario 49% 34% 57% 48% 34% 41%
Canada 56% 34% 57% 49% 35% 38%

Ontario’s Nonprofit and Voluntary Sector 60
Table 20: Structural issues by primary activity area
Difficulty collaborating
with other organizations
Difficulty planning for the future
Difficulty participating
in policy development
Lack of internal capacity
Increasing demands for services or products
Difficulty adapting to
change
Arts and Culture
Ontario 27% 68% 36% 49% 41% 47%
Canada 28% 67% 41% 51% 41% 45%
Sports and Recreation
Ontario 28% 63% 35% 35% 43% 42%
Canada 27% 58% 36% 32% 40% 40%
Education and Research
Ontario 23% 52% 40% 41% 51% 27%
Canada 29% 57% 46% 47% 51% 36%
Health Ontario 37% 82% 72% 68% 61% 56%
Canada 32% 68% 62% 63% 70% 51%
Social Services
Ontario 42% 73% 53% 65% 67% 47%
Canada 30% 67% 54% 54% 65% 45%
Environment Ontario 37% 66% 56% 57% 28% 53%
Canada 27% 65% 56% 49% 40% 47%
Development and Housing
Ontario 8% 48% 26% 27% 26% 26%
Canada 14% 47% 33% 28% 31% 28%
Law, Advocacy and Politics
Ontario 50% 87% 57% 68% 69% 40%
Canada 35% 68% 57% 59% 57% 41%
Grantmaking, Fundraising and Promoting Volunteerism
Ontario 26% 54% 23% 26% 36% 30%
Canada 23% 54% 29% 28% 42% 33%
International Ontario 51% 77% 39% 62% 53% 54%
Canada 40% 72% 38% 60% 52% 48%
Religion Ontario 13% 52% 29% 36% 32% 42%
Canada 14% 54% 27% 31% 32% 45%
Business or Professional Associations or Unions
Ontario 22% 55% 44% 42% 33% 42%
Canada 23% 54% 47% 45% 38% 42%
Hospitals, Universities and Colleges
Ontario 33% 87% 65% 72% 63% 67%
Canada 30% 72% 55% 59% 58% 63%
Other Ontario 12% 45% 33% 16% 28% 37%
Canada 19% 53% 42% 37% 38% 34%
All Organizations Ontario 24% 60% 36% 41% 41% 40%
Canada 24% 58% 39% 39% 43% 41%

Ontario’s Nonprofit and Voluntary Sector 61
Human resources concerns were among the top five for all organizations in Sports and Recreation, Business and Professional Associations and Unions, and Development and Housing. ‘Difficulty recruiting the type of volunteers needed’ was the top human resources problem, noted by nine of the fourteen groups in their top five (see Tables 19 and 20).
The severity of problems reported varied across activity areas as well. In some instances, the percentage of groups reporting a problem with a particular issue was consistently higher than the Ontario average. Below, are the different areas by the intensity of problems across the different capacity areas. Sub‐sectors where an above‐average proportion of organizations reported problems on 17 to 24 capacity issues were identified as sectors with ‘high’ levels of capacity problems. Those sub‐sectors with above‐average proportions of organizations reporting problems on between 9 and 16 issues were labeled as having ‘moderate’ capacity problems and those reporting significant problems on 1 to 8 issues were identified as having ‘low’ levels of capacity problems.
Table 21: Severity of capacity problems by activity area Areas Experiencing “Low” Capacity Problems: Above-average proportion of organizations reporting problems on 1 to 8 issues
Areas Experiencing “Moderate” Capacity Problems: Above-average proportion of organizations reporting problems on 9 to 16 issues
Areas Experiencing “High” Capacity Problems: Above-average proportion of organizations reporting problems on 17 to 24 issues
- Business, Professional Associations and Unions - Grant-making, Fundraising and Voluntarism Promotion - Religion
- Sports and Recreation - Education and Research - Development and Housing
- Health - Social Services - Hospitals, Universities and Colleges - Law, Advocacy and Politics - Arts and Culture - Environment - International
Overall, the areas with high capacity problems were: Health; Social Services; Hospitals, Universities and Colleges; Law, Advocacy and Politics; Arts and Culture; Environment; and International.40 Sectors reporting ‘moderate’ capacity problems were: Sports and Recreation; Education and Research; and Development and Housing. Those with
40 Organizations were grouped as having ‘high’, ‘moderate’ or ‘low’ capacity concerns by determining the number of issues where the percentage of organizations expressing a problem was higher than the Ontario average.

Ontario’s Nonprofit and Voluntary Sector 62
relatively ‘low’ levels of capacity problems were: Business and professional association and unions; Grant‐making, fundraising and voluntarism promotion; and Religion.
Ontario organizations surveyed expressed considerable concern about their capacity to pursue and sustain their goals and activities within the context of a changing social, political and economic environment. Both the level and structure of funding and support available to the nonprofit and voluntary sector have been highlighted as key issues. As well, there are significant human resources concerns notably with the ability to retain paid staff and to recruit the type of volunteers needed. Large organizations dependant on government funding, those in the Hospital, University and Colleges, Health, or Social Services activity areas are more likely to report problems across a range of capacity areas. While these groups were also more likely to experienced positive revenue growth and increases in both volunteers and paid staff, they clearly continue to struggle to meet the demand for their services.

Ontario’s Nonprofit and Voluntary Sector 63
Conclusions The NSNVO provides a rich portrait of the voluntary and nonprofit sector in Ontario. This report has provided some of the first key features of this picture.
Ontario has a comparatively small nonprofit and voluntary sector – as measured by organizations per capita – than elsewhere in Canada. While the majority of groups serve their local communities, there is a notable presence of national and international organizations in Ontario.
Total sector revenues in Ontario are highly skewed. Hospitals, Universities and Colleges account for less than 1% of all organizations but receive 38% of total sector revenues. Ontario has a comparatively large number of organizations in the top revenue brackets – including many in the Hospitals, Universities and Colleges sector – compared to other regions.
With the notable exception of, Hospitals, Universities and Colleges, Health organizations and Social Services, the largest single source of funds for nonprofit and voluntary organizations is earned income (46%). Another third are dependent on gifts and donations while only 12 % are dependent on government sources. One in ten rely on a diverse mix of funding sources.
Although having comparatively fewer organizations than elsewhere in Canada, Ontario engages the largest number and share of volunteers and paid staff in Canada. As with revenues, the distribution of volunteers and staff is highly skewed. Larger organizations – as measured by revenues – tend to have larger staff and volunteer complements than smaller ones. For instance, over half of the voluntary and nonprofit organizations (53%) have no paid staff and are wholly voluntary.
Most employment in the nonprofit and voluntary sector in Ontario is permanent and full‐time, but the rates of temporary employment and part‐time work are much higher than the national average for Ontario and Canada.
Overall, there was relative stability in revenues, volunteer and staffing levels between 2000 and 2003. However, large organizations appear to have benefited most from the positive economic climate between 2000 and 2003. They were most likely to have experienced increasing volunteer and staff numbers compared to smaller groups. This was particularly true in the Ontario nonprofit and voluntary sector with its comparatively larger share of large organizations (as measured by revenues, staff and volunteers) than nonprofit sectors in other provinces. Despite these resource advantages, large organizations dependent on government funding, and especially those working in Health, Universities, and Colleges and Health are most likely to report problems across a range of areas.

Ontario’s Nonprofit and Voluntary Sector 64
There appears to be two distinct realities in the nonprofit and voluntary sector in Ontario, as elsewhere in Canada. At one pole, are organizations operating exclusively with the assistance of volunteers and with very low revenues in areas such as Sport and Recreation and Religion; at the other end, there are a relatively small number of very large organizations with significant revenues, staff and volunteers. Although the particular capacity challenges facing each group are distinct to some extent, the majority clearly report problems with the pursuit of resources – both human and financial.
The nonprofit and voluntary sector is a vital piece of our social and economic life in Ontario. These organizations deliver many critical services in communities across the province and play a key role in bringing people together to enhance the quality of life for all community members. This report has provided a first glimpse of the composition, financial and human strengths, demands and challenges faced by this important set of institutions. This is a timely opportunity to address capacity challenges that impede their ability to serve Ontarians and to build on the strengths of the sector.

Ontario’s Nonprofit and Voluntary Sector 65

Ontario’s Nonprofit and Voluntary Sector 66

Ontario’s Nonprofit and Voluntary Sector 67
Imagine Canada Canadian Council on Social Development 425 University Avenue, Suite 900 190 O’Connor Street, Suite 100 Toronto, Ontario Ottawa, Ontario Canada M5G 1T6 Canada, K2P 2R3 Tel: 416.597.2293 / 1.800.263.1178 Tel: 613.236.8977 Fax: 416.597.2294 Fax: 613.236.2750 [email protected] www.ccsd.ca