the new corruption rankings: implications for analysis...
TRANSCRIPT
The New Corruption Rankings:
Implications for Analysis and Reform
Michael Johnston Department of Political Science
Colgate University Hamilton, New York 13346 USA
Tel: (+1) 315-228-7756 Fax: (+1) 315-228-7883
[email protected] [email protected]
Prepared for Research Committee 24 International Political Science Association
World Congress Quebec City, Canada
August 2, 2000
Abstract This paper evaluates the quantitative corruption indices that have emerged during the past decade. While they have spurred valuable new research, they also reflect the worldviews of the business and development interests that have dominated recent debate. Transparency International’s Corruption Perceptions Index is the most important “first-generation” measure, and diverse statistical techniques are leading to second-generation indices. Perception-based measures have significant validity and precision problems; newer indices have methodological advantages, but some are difficult to interpret without elaborate models and others are expensive. Most effectively redefine “corruption” as bribery, and give little feedback on the effects of reforms; studies using them may impose a common model upon diverse cases. I conclude with suggestions for improved statistical measures, and for broadly comparative research linking older scholarly traditions to the new quantitative research.
- 1 -
I. Introduction Other than the question of definitions, few issues have so thoroughly stymied the
comparative study of corruption as that of measurement. Types and amounts of
corruption vary among, and within, societies. Theory tells us that these contrasts reflect
political and economic influences, history, and culture, and in turn affect societies and
their development in important ways. But the difficulty of measuring corruption has
long made it difficult to make such comparisons, to test hypotheses, and to build sound,
comprehensive theories.
For many years, this problem was of concern mostly to academic analysts. But
recently a variety of forces have put corruption back on the international policy agenda.
These include, inter alia, the globalization and growing competitiveness of the world
economy, and a resulting awareness within international aid and lending agencies, and
on the part of private business, of the costs of corruption. Other influences include
movements to ban international bribery by domestic legislation (the US Foreign
Corrupt Practices Act) or by international agreements (the OECD Anti-Bribery Treaty,
and the OAS Anti-Corruption Convention); concern about the cost and efficacy of
international development programs, and over the role corruption might play in
perpetuating poverty; and the end of the Cold War, which reduced tolerance for
corruption among ideological allies.
- 2 -
This long-overdue revival of interest has spurred innovative attempts at
measurement. But many of these reflect the worldviews of the business and
development interests that have brought them about, and while the resulting research
has deepened our empirical knowledge of corruption it has also narrowed our
understanding of it. "Corruption" as an operational concept is becoming synonymous
with bribery, its impact judged increasingly in terms of economic development. Few
would dispute the importance of those concerns, but they have fashioned a new
orthodoxy about corruption mirroring the broader "Washington consensus" over trade,
aid, and development. With that has come a tendency for rich comparative concepts
and findings to be overridden by a narrower vision treating corruption primarily as a
problem of political and economic liberalization. Not only does this vision disregard
important variations, in the course of "explaining" corruption; as the momentum behind
reform builds, there is a growing risk that scarce opportunities will be wasted because
of policies that are insufficiently adapted to local realities, and to the complexity of
corruption itself.
In this discussion I will consider the measurement issue on several levels. One
concern will be the quality of the indices themselves -- strengths as well as
shortcomings. Another emphasis will be their impact upon the policy and analytical
debates, with an emphasis upon definitions as well as upon analysis and reform.
"Second-generation" measures, and ideas for further improvements, will also come in
for discussion. Finally, I will survey the prospects for, and the needed connections
- 3 -
between, better comparative research and a richer policy debate. The purpose of my
critique is not to suggest that the new corruption scales are radically wrong; indeed,
there is little reason to think they are. Nor is it to criticize the motives behind the
various statistical indices. Rather, it is to emphasize the continuing need for a richly
comparative and historical view of corruption built upon diverse kinds of evidence and
theory.
II. What Makes Corruption So Difficult to Measure?
In principle, social scientists ought to be able to measure anything (Babbie, 1995:
110). But this is more easily said than done, and it is a long way from essential concepts
and nominal definitions to the events or artifacts included in operational measures.
Many concepts are categorizations of, or inferences from, phenomena that may
themselves be difficult to identify and observe. Consider "democracy" (Collier and
Levitsky, 1997): we know it when we see it, but the concept remains essentially
contested (Gallie, 1965). Over time the concept has a way of "creeping" away from its
starting point, necessitating a re-think of what it means (Collier and Levitsky, 1997).
Reaching consensus over definitions, much measurement, would be difficult. One result
is that at times we study things mostly because they are easily counted. A more subtle
danger is reification (Babbie, 1995: 116-118) -- thinking about operational measures as
though they were the concept itself.
- 4 -
Measurement becomes all the more difficult when that which concerns us is
hidden. We know corruption exists, but direct witnesses are few; often, those with
direct knowledge have an interest in keeping it secret. Where corruption is most serious
the officials charged with control are themselves compromised; in such settings
reporting corruption becomes an exercise in risk and futility. Violence or intimidation
may be used to see off investigators and keep others quiet. Statistics on conventional
crimes are notoriously inaccurate; how can we measure an activity that is usually
clandestine?
The problem is even more complex because of an old problem -- that of
definitions. If we study corruption at a general level -- particularly, if our concern is
commonly repeated syndromes -- it may make sense to examine the core cases and not
worry much about cases the margins. But when it comes to counting and measurement
the margins become critical -- and there is much disagreement as to where those
boundaries fall. Add to this the complex relationship between corruption and scandal
(Moodie, 1980; Markovits and Silverstein, 1988): public reports and controversies may
tell us more about the appearance of corruption -- and thus, about political conflicts, or
about journalistic practices -- than about its actual extent.
Validity, Reliability, and Precision
Three attributes by which we judge any measurement are validity, reliability,
and precision (this discussion draws heavily upon Babbie, 1995: 121-129).
- 5 -
Validity raises the question of whether our data actually measure what we claim
they do. Concepts themselves do not exist in the real world, or have "real definitions"
(Babbie, 1995: 116; see also Hempel, 1952). They are, rather, constructs useful for
categorizing objects or events, and for drawing out attributes we think they share. Thus
our empirical measures can never be better than approximations, and the literature
abounds with "measurements" that draw on something in addition to, or other than,
that which they claim to measure -- or that are grounded in nothing at all. As Babbie
(1995: 127-128) explains, we can assess the validity of a measure in several ways. Does it
possess face validity -- that is, does it have anything to do with the concept we have
nominally defined? An index that excludes extortion while counting street crimes might
return higher values for places we think are more corrupt, but it does not measure what
we mean by "corruption". Does it possess criterion-related or predictive validity, in the
sense of predicting changes in other variables that theory tells us should be linked to
our concept? For example, corruption measures should statistically "predict" the credit
ratings lenders give to various governments. Or, a measure might be related to other
variables in ways that are consistent with what we know about those factors, even if it
does not "predict" them -- an attribute called construct validity. We might, for example,
expect extensive corruption where institutions are of poor quality (Knack and Keefer,
1995) and ethno-linguistic fragmentation is severe (Easterly and Levine, 1996). A
measure possessing content validity works well across diverse manifestations of a
concept: corruption ratings ought to reflect the incidence of all the major varieties of
corruption, not just one or a few. Finally, a concept might have reference-group validity --
- 6 -
that is, be judged sound by people with extensive knowledge of whatever we wish to
measure. This is of particular relevance to corruption measures, many of which draw
upon the judgments of experts or international business people.
Reliability refers to the question of whether a particular measure returns
consistent results. A corruption scale that rates Zimbabwe (say) as an 8 on a scale of ten
one year, 2 the next, and 5 the year after that, is of little use: we have good theoretical
reasons to expect that such wide variations are unlikely. No social-science measure will
be completely reliable, but we can improve our results through careful construction of
indices using good data, and by repeated testing.
Finally, precision refers to the fineness of the units in which our measure is
expressed. In general, the more precision the better: we would have little use for a
"yes/no" corruption variable. High-, medium-, and low-corruption categories would be
better, and numerical rankings more precise yet. A related issue is level of
measurement: some measures are nominal, grouping cases into categories among which
there is no particular relationship (individuals’ ethnicity, or the continent where a
country is located, are examples). Others are ordinal, grouping cases into categories that
can be ranked higher or lower in terms of some shared attribute. We might, for
example, place countries into high, middle, and low GDP-per-capita groups; all in the
"high" category would be more affluent than those in the "middle" group, but there
would be considerable variation within groups and no assurance that the differences
- 7 -
among groups are the same. Interval- level measurements array cases along some
common dimension demarcated by units of identical size, but without a point
indicating the complete absence of the attribute. The Fahrenheit scale is an example: its
zero point is arbitrary, so that while a one-degree difference is identical across all
values, a reading of forty degrees is not twice as warm as a reading of twenty. We might
survey residents of several countries asking whether officials are venal or public-
spirited, and express the results on an interval-level scale (say, +5 to - 5). Such a
measure could not, however, tell us a particular country has a total absence of public
spirit or that it is twice as venal as some other. Finally, ratio-level data also array cases
along a dimension marked off in units of identical size, but one possessing a true "zero
point". Here, expressions of proportion are appropriate: a country with 50 million
residents is twice as populous as its neighbor with 25 million.
Other things being equal, higher levels of precision and measurement are
desirable. But there is such a thing as false precision: while it is more useful to know
that a country's population density is 255 people per square mile than to say that it is
moderate, it is neither useful nor statistically appropriate to express that measure as
255.348906346 people/mi2. Paradoxically, one measurement can be more precise, but
less accurate, than another: data telling us Country X's population density is 255
people/mi2 may be less accurate than an ordinal ranking of "moderate" if the true figure
is 75 people/mi2. Level of measurement is an important statistical issue: it is tempting
to treat ordinal data as interval-level, for example, but the results can be misleading.
- 8 -
III. The Indices: Notable Strengths, Continuing Weaknesses
First-Generation Measures
A variety of corruption measures, differing in breadth, methodology, and
quality, are now available; still others are under development. Some of the longest-
running efforts at measurement have been mounted by firms providing risk
assessments to international business. These, some available on a proprietary basis only,
include surveys by Political and Economic Risk Consultancy1, the Institute for
Management Development2, Political Risk Services3, The Economist Intelligence Unit4,
and Business International (now a part of The Economist group). Others are produced by
advocacy groups such as the World Economic Forum5 and Freedom House6, survey
organizations such as Gallup,7 publications such as The Wall Street Journal, and groups
of analysts, sometimes working in affiliation with international organizations. Some
rely upon sample surveys of the public at large, or of international business executives;
others depend upon expert assessments. Not surprisingly, sample sizes vary widely.
Some ask respondents to rate overall levels of corruption on a scale; others ask about
bribes, extortion, or other irregularities in specific governmental functions; others tap
respondents' own experiences of corruption. All are aspects of a particular country's
corruption situation, broadly defined; what is less clear is whether different kinds of
1 http://www.asiarisk.com 2 http://www.imd.ch 3 http://www.prsgroup.com 4 http://www.eiu.com 5 http://www.weforum.org 6 http://www.freedomhouse.org
- 9 -
questions about a variety of countries, reported in different units, produce results that
are broadly comparable.
Other sorts of data have also been used in the comparative study of corruption.
In the United States, for example, the Public Integrity Section of the US Department of
Justice regularly publishes data on corruption convictions in federal courts (Schlesinger
and Meier, 2000). Economists have used measures of economic problems that, while not
offered as corruption scales per se, tap into closely-related problems, such as data on
"black-market premiums" or the quality of countries' institutions (Knack and Keefer,
1995). A different approach is the international compilation of criminal justice data by
the United Nations Crime Prevention and Criminal Justice Division.8 These data
encompass many countries and a long time span; on the negative side, reliance on
official statistics raises questions of comparability across countries' definitions of
corruption, court systems, and investigatory efforts.
Corruption versus Perceptions of Corruption. Most first-generation indices measure
perceptions of corruption -- comparisons among specific countries, or ratings on an
absolute scale -- and many depend upon the views of businesspeople. Given the lack of
harder indicators, the fact that much corruption arises in the context of business deals,
and the extent to which these people move about the global economy, this approach is a
7 http://www.gallup-international.com 8 See http://www.uncjin.org/Statistics/WCTS/wcts.html#globalreport and the agency's Global Report on Crime and Justice (Oxford: Oxford University Press, 1999).
- 10 -
natural one. Moreover, perceptions of corruptness are significant in their own right,
influencing foreign policy, aid, investment, and lending decisions. They also factor into
political interactions, particularly as regards democratization issues. In other ways,
however, appearances can be deceiving.
I focus here primarily upon Transparency International's Corruption Perceptions
Index (CPI)9 -- the most widely-used and, in many respects, the most ambitious effort to
measure and compare perceived levels of corruption. The CPI -- a kind of "poll of polls"
-- has won worldwide attention10 and aided a variety of analytical studies (for a useful
survey see Lambsdorff, 1999b). Coverage has expanded from 41 countries in 1995 to 99
in the 1999 version. Seventeen surveys are now used to calculate the CPI; databases for
individual countries range from the minimum of three required for inclusion (11
countries) to thirteen for Hong Kong, Hungary, South Korea, and Russia, and fourteen
for India. (By contrast, in the first CPI (1995) there were no more than seven data
sources for any country, and two -- Colombia and Argentina -- had but two ratings.)
CPI methodology has become increasingly sophisticated, and TI publishes a
comprehensive "framework document" (Lambsdorff, 1999a) and list of data sources11 on
its website.
9 http://www.transparency.org/documents/cpi; see also the very useful Internet Center for Corruption Research (http://www.gwdg.de/~uwvw/) established at the University of Gõttingen by Prof. Johann Graf Lambsdorff, the CPI's author. 10 See, for the 1998 CPI, http://www.gwdg.de/~uwvw/PRESS98/Press98.html 11 http://www.transparency.org/documents/cpi/cpi_framework.html
- 11 -
These ratings, and the scholarship and public debate they have spawned, have
seemed to confirm much of what we had long suspected. Corruption rankings are worst
for poor, undemocratic, and unstable countries. Multivariate analysis employing CPI
data (and others) has produced solid evidence that corruption significantly slows and
distorts economic development (Mauro, 2000) and reduces foreign direct investment
(Wei, 1997). It is also linked to inflation (worse where inflation is high and variable --
see Braun and DiTella, 2000) and weak political and administrative institutions (Knack
and Keefer, 1995), and is marginally worse where political competition is weak (Braun
and DiTella, 2000; Johnston, 2000). Corruption is worse, again, where ethnolinguistic
divisions are severe (Easterly and Levine, 1996).
Like any social-science measure, the CPI has strengths and weaknesses. Its value
in sparking new research and public debate is beyond dispute. So are the occasional
misuses of the data, though that fault lies with users than with those devising the scales:
Transparency International has been careful to emphasize the CPI's limitations. The
CPI's reliability has been commendable, as we shall see. Its precision and validity are
more problematical; while difficulties in these areas are inevitable, they also identify
challenges for improving our measures. A validity issue common to nearly all first-
generation indices -- a tendency to equate corruption with bribery, and to focus more
upon high-level corruption than the so-called "petty" varieties -- will come in for
discussion later on.
- 12 -
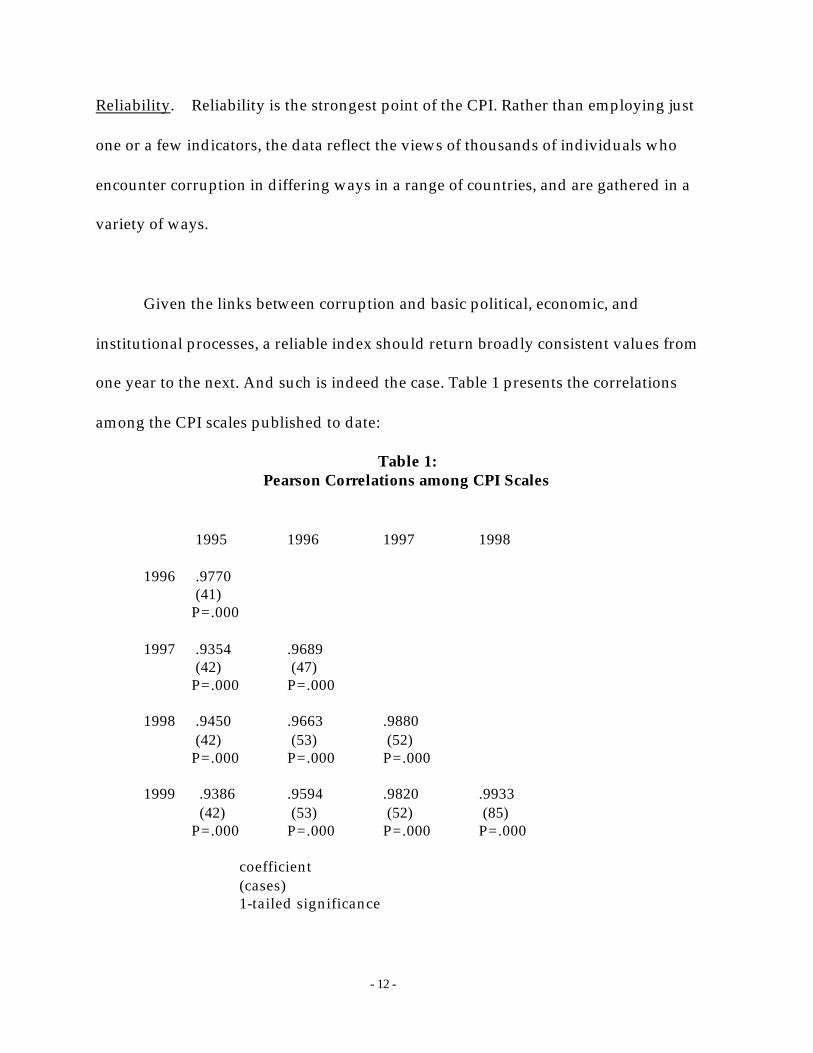
Reliability. Reliability is the strongest point of the CPI. Rather than employing just
one or a few indicators, the data reflect the views of thousands of individuals who
encounter corruption in differing ways in a range of countries, and are gathered in a
variety of ways.
Given the links between corruption and basic political, economic, and
institutional processes, a reliable index should return broadly consistent values from
one year to the next. And such is indeed the case. Table 1 presents the correlations
among the CPI scales published to date:
Table 1: Pearson Correlations among CPI Scales
1995 1996 1997 1998 1996 .9770 (41) P=.000 1997 .9354 .9689 (42) (47) P=.000 P=.000 1998 .9450 .9663 .9880 (42) (53) (52) P=.000 P=.000 P=.000 1999 .9386 .9594 .9820 .9933 (42) (53) (52) (85) P=.000 P=.000 P=.000 P=.000 coefficient (cases) 1-tailed significance
- 13 -
If these correlations were weak or inconsistent we would have reason to doubt
the CPI's reliability, but the consistency across time is striking.
A few qualifications are in order, however. Coefficients could also be too strong:
levels of corruption are likely to change, even if gradually, and to change in differing
ways from one country to the next. A reliable scale should reflect these changes, too.
Thus, is the coefficient of almost .94 between 1995 and 1999 scores, for example, too
strong? There is no real way of knowing. Moreover, nine of the seventeen component
measures in the 1999 CPI are actually three surveys taken in the same, or very similar,
ways three years running (1997, 1998, and 1999). While this broadens the number of
respondents, and does insulate the scores from short-term fluctuations caused by
sensational scandals, this method might also magnify the errors and biases in particular
surveys, thus undermining the CPI's responsiveness to real changes. Comparability is
an issue too: scores for countries with thirteen or fourteen surveys must include most or
all of the repeated measures -- meaning that their scores reflect perceptions over several
years -- while those based on just a handful of surveys will not.
The correlations above cannot tell us whether year-on-year differences reflect
changes in "real" levels of corruption, the addition of new data that improve the scale,
or other methodological difficulties that weaken it. They give little immediate reason to
doubt the CPI's reliability, but do raise the question of whether an annual index that, in
early versions, extended ratings to two decimal places -- as opposed, say, to a more
- 14 -
general ranking published every three to five years -- exaggerates the apparent
significance of small variations of unknown origins.
Precision: The precision of the CPI and similar scales is difficult to evaluate. It is not
obvious what units of measurement any corruption scale ought to use, or how we might
expect observations to be distributed. While the many measures folded into the CPI
contribute to its reliability, they yield results expressed in significantly different ways.
Some produce perceptions of how corrupt a whole society is, while others deal with
particular agencies or functions of the state. Various surveys ask about perceptions of
the "problem", or of its "pervasiveness", "level", "number of cases"; CPI architects defend
these as comparable assessments of the "degree" of corruption (Lambsdorff, 1999a: 7),
but others might question this, particularly in differing linguistic settings. Some ratings
are anchored on absolute scales, while others are ordinal comparisons only (judgments
that Country X is more corrupt than others, or that there are "a lot", "a few", or "no"
cases of corruption among particular officials). One -- the Freedom House ranking --
was not even expressed numerically in its original form. Sample sizes, ranges, and
distributions vary considerably, and thus sampling distributions and standard errors
are likely to differ as well. Rendering these data comparable -- and specifically,
averaging ordinal-level comparisons into an interval- or ratio-level overall ranking --
inevitably produces results shaped by the assumptions of the statistician as well as by
- 15 -
actual perceptions or events. One specific result of these difficulties is that while we12
often treat CPI data as ratio- or interval-level, variations across all values -- say, the
difference between 5.0 and 6.0, versus 8.4 and 9.4 -- may not be consistent. The problem
may be most difficult at the extremes -- the high- and low-corruption cases that interest
us most, and whose rankings draw most attention.
Closely related to this are the differing lists of countries to which various
component measures apply. Ideally we would have the same large number of
corruption measures for every country, but we do not. The architects of the CPI have, in
recent years, required a minimum of three corruption surveys before a country can be
included -- an approach minimizing the error that might result from relying on just one
or two ratings. But the missing data are not randomly distributed; countries with poor
institutions and governance also tend to have the fewest scales available. Thus, those
with the worst corruption might well have the least data, while others slightly better off,
where at least some surveys have been conducted, may be wrongly viewed as the
world's most corrupt societies (Kaufmann, Kraay, and Zoido-Lobatón, 1999a: 22-23). TI
regularly warns against interpreting CPI results in that way, but variations in amounts
and quality of data among countries raise validity and reliability issues -- possibly
reducing the former while artificially inflating the latter to some degree.
12 I include myself in the term "we" here: see Johnston, 2000.
- 16 -
A different precision problem has to do with reporting results. CPI scores are
reported on a zero-to-ten scale (with low scores referring to high levels of corruption,
and vice versa) in tenths of points -- and, for the 1995 through 1997 CPIs, in hundredths of
points. It seems unlikely that this sort of implied precision is justified; at the very least,
reporting only one decimal place beginning in 1998 was an appropriate change. What
would be an appropriate level of precision? Since the CPI does not have a true zero
point, and if we are not certain that variations are consistent across all values, an
argument can be made that it is essentially ordinal-level, and ought to be reported in
broad bands (perhaps "low", "low-medium", "medium", and so forth) rather than in
numerical points.
Another precision issue, but one with validity and reliability implications as
well, is the "single-number problem". Actual corruption varies in many ways: there are
many forms -- a validity issue discussed below -- and contrasts within most societies.
How much nepotism or patronage is equivalent to a certain level of bribery in road
construction? Is that bribery comparable in significance to similar practices in arms
contracting? No single national score can accurately reflect variations between Northern
and Southern Italy, across Russia, or among Minnesota, Alabama, and New Jersey.
Some countries have high-level corruption, others find it lower down the political or
bureaucratic hierarchies, and still others see most abuses in electoral politics and
patronage. It may be seen as a major concern even where absolute levels are likely
moderate to low (as in New South Wales); elsewhere, corruption enjoys official
- 17 -
protection. In some countries the problem centers around international trade, while in
others it is home-grown. Obviously any account of corruption, be it a case study or a
data point, will be a simplification, and the CPI's architects have no control over the
interpretations that result. But we might still ask how much variation -- quantitative
and qualitative -- within countries is obscured by assigning each a single number.
Validity. The CPI, and many of the measures upon which it is based, represent a clear
advance over the anecdotal evidence and hypothetical cases that dominated earlier
phases of research, and over the diffuse and emotional claims often marking public
discussions. Its results are plausible: it is difficult to dispute the notion that Canada is
less corrupt than Poland, and that Poland is less corrupt than Kenya. In addition, the
CPI and similar scales relate statistically to others in ways that make theoretical sense --
evidence for construct and predictive validity.
Problems arise, however, with the basic approach of using perceptions as our
operational measure. Setting aside the difficulties inherent in measuring perceptions of
anything, we must remember that perceptions are not the same thing as corruption
itself. They may reflect the openness of corruption, rather than its actual extent. The two
may differ considerably: indeed, Rose-Ackerman (1996) has observed that as corruption
problems worsen in a country, the major dealings tend to become fewer in number, to
involve higher stakes, and to take place closer to the top. We can easily imagine one
country in which corruption takes place openly, in small-to-moderate transactions, and
- 18 -
another with less frequent, but large, well-concealed deals at the top of the state
structure -- perhaps under the protection of the very officials and agencies nominally
charged with bringing it to light. Where corrupt officials and their clients operate with
impunity, informants and prying journalists might be silenced by intimidation. The few
visiting businesspeople who do gain access to such dealings might quickly acquire a
stake in keeping their true perceptions to themselves. Corruption might distort politics,
the economy, and development, and yet this country might score better on the CPI that
its neighbor, where less serious corruption is practiced more openly.
Other subtleties complicate the rankings. What is being perceived as more or less
serious? Does extensive corruption reform to the number of cases, the sums changing
hands, impact upon politics or the economy, or cases involving particularly important
officials or programs (Rose-Ackerman, 1999: 4; Lambsdorff, 1999a: 7-8)? Perceptions
could reflect general impressions, or ethical expectations, of whole societies -- of
inefficiency or official impunity, poverty, or a weak civil society -- rather than
knowledge of corruption as such. What appears to be corruption might actually be
scandal stirred up by feuding factions. Some judgments might reflect culture shock
(particularly if one's basis for comparison is a low-corruption society), language
limitations,13 or sheer dislike of a country or its regime. The perceptions of outsiders --
even if they rest upon a shared definition -- might tell us little about the significance of
corruption: what it means in its context. A seemingly minor case might be freighted with
- 19 -
significance lost upon outsiders or ordinary citizens unfamiliar with elite conflicts. Do
we trust the honesty of visitors' reports? Some might be less than candid because of
their firms' or agencies' -- or their own -- involvement in corrupt activities. Others who
have not done well in business might exaggerate corruption to explain away their
failures.
Another validity problem is similar to the "single-number" issue. League-table
rankings effectively treat corruption as a single generic process or problem, inviting
statistical analyses that impose a common model upon (and within) widely-varying
societies and cases.14 Qualitative differences are reduced to matters of degree. Consider,
for example, the changing calculus of daily life -- and of reform -- implied when
corruption is the rule rather than the exception, is facilitated by well-organized groups
holding political or economic monopolies (Johnston, 1998), or is backed up by force.
Then, corrupt figures face few meaningful limits, and can practice extortion or outright
theft more easily, rather than making quid pro quo deals. The losers from such corruption
are more likely to respond in evasive or illicit ways (Alam, 1995), rather than directly
confronting it as they might where corruption is the exception and the rule of law is
secure. Different models may be required to analyze such situations.
A "Bribery Bias"? If corruption indices tend to impose a single model upon
corruption, what is it? To a significant degree it is that of bribery. Several of the
13 On the subtleties of the language of corruption, see Genaux, 2000; Moroff and Blechinger, 2000.
- 20 -
components of the CPI specifically ask respondents to judge the extent of bribery, or of
demands for bribes. Others implicitly emphasize bribery by sampling business people
instead of, say, poor farmers. (In that connection, three component measures ask
recipients the extent to which corruption harms the business environment -- confusing
measurement with the question of consequences and inviting connections between
corruption and broader economic problems.) Nepotism, official theft and fraud, political
corruption such as patronage, so-called "petty corruption" such as police shakedowns of
upon stall holders at local markets, and election fraud may not fit the bribery model (or
the daily experiences of business people) so neatly, and may thus be underestimated.
Again, qualitative differences are collapsed into matters of degree. Bribery may
be the main form of corruption in international business, and may be what springs to
most minds when "corruption" is mentioned, but in some respects it is a special case. In
a strict sense, bribery is a quid-pro-quo on comparatively free and equal (if illicit) terms. It
differs from extortion, where officials force deals that may be anything but free and are
rarely equal. Bribery seems most likely to dominate where corruption is moderate to
moderately high, illicit deals are a matter of course, and participants are not frequently
punished. Where the risk of punishment is high, or (by contrast) where powerful
officials act with impunity, things may be different: in the former, bribe payers may
have to add a "risk premium", while in the latter they are at the mercy of officials. In
some corruption exchanges, such as patronage and nepotism, considerable time may
14 I am particularly indebted to Mushtaq Khan for his comments on this point.
- 21 -
elapse between receiving the quid and repaying the quo, and the two may be difficult to
link or compare to each other. And other forms of corruption -- electoral fraud,
embezzlement, or using official resources to operate an under-the-table business -- are
not exchanges at all. Respondents to the CPI's component surveys may be well aware of
these variations, but their knowledge cannot be conveyed in any single rating.
Why Do These Problems Matter?
First-generation corruption measures have helped move the debate forward, and
have framed new hypotheses for further work. None has been proposed as the final
word on measuring corruption; and, to discuss their weaknesses is ultimately to return
to the inherent difficulties of measuring corruption.
Still, the difficulties outlined above do matter. Existing indices likely help us least
in the countries we care about most -- those with the worst corruption problems. Even if
country rankings make sense, causes, effects, and corrupt processes exist at several
different levels of aggregation. Thus developing careful, nuanced accounts of corrupt
processes remains a central task for comparative analysts. Without such foundations,
the significance of any ranking is open to debate. A 1999 re-analysis of CPI data by TI
representatives in Latin America and the Caribbean (TILAC, 1999), for example,
emphasized the range of variation in ranking across the Americas, and compared scores
for the region to those of other parts of the world -- with results that made Latin
American corruption appear not quite as exceptional, and the worst cases less typical of
- 22 -
the region, than we might have assumed. Perhaps it makes most sense to say that
corruption indices have definite uses, but are just one form of evidence among many
others and may be more useful for framing hypotheses than for providing conclusive
answers.
As noted at the outset, many of the current scales reflect the outlooks of
international business, and of the aid and lending institutions that have put corruption
back on the policy agenda. There is nothing wrong with this, and the field is richer
today for the efforts of such groups. But theirs are partial visions nonetheless; knowing
how corruption -- conceptualized as bribery -- affects development -- expressed in GDP
figures or in terms of governance indicators -- is valuable knowledge, but there is much
more to be said. Years ago, for example, Huntington (1968) proposed that corruption
might be a preferable alternative to violence -- in the process, making the important
point that in judging its effects we must make comparisons to its real alternatives, not
just to ideal processes and outcomes. Statistical indices cannot settle that sort of
question by themselves; we will also need historical, linguistic, political, and cultural
evidence, and knowledge of forms of corruption beyond the bribery paradigm.
Classical concerns of theory -- the nature of accountability and justice, the sources and
benefits of good politics, the dynamics behind cooperation, the emergence of normative
frameworks, and strong civil societies -- are parts of that picture too. No index could be
expected to reveal these subtleties, but they are no less important for being less easily
quantified.
- 23 -
These, again, are more than methodological niceties. Perceptions of corruption
do shape important decisions, but the danger is that they will lead to an "echo chamber"
problem in which officials and investors repeat what they hear from each other, in
effect, and in which anecdotes and perceptions acquire false authority through
repetition. Analysts can make good use of perceptions of corruption, but there must
also be ways to anchor perceptions in less subjective information about societies.
IV. Back to Basics: Richer Comparisons and Policy Debate
It is unlikely that we will ever have valid, reliable, precise, subtle, and broadly
comparable data on corruption -- much less on all of its various forms. But even if we
had, they would be only one aspect of the broader and richer comparisons that are
needed both for analysis and reform. Understanding the varying forms of corruption,
their links to deeply-embedded causes, and their consequences requires many kinds of
evidence, and theoretical approaches sensitive to a range of variations among societies.
Reforms and more general development efforts need similar foundations. A number of
attempts have been made to improve our measurements of corruption, and I will note a
few of those below. But the real challenge for the next stage of corruption research is not
just to improve our measurements, but rather to build a richer understanding of the
phenomenon, and to show why such an understanding is essential.
Second-Generation Measures
- 24 -
The first-generation indices elicited strong reactions. Journalists pounced upon
the CPI as a rating of the world's most corrupt countries, even though TI explicitly
warned against that interpretation. International agencies and many scholars quickly
put the data to work, while others were more critical. Governments joined the fray,
some crying foul as negative ratings threatened their countries' images and economic
prospects.
The result was a new set of initiatives that could loosely be termed "second-
generation" measures. A variety of sample surveys, for example, have focused upon
businesses, households, and individuals, and their experiences of corruption (bribes
paid, bureaucratic harassment, and the speed and quality of public services). Surveys
are subject to many of the same validity, reliability, and precision problems discussed
above, but provide a level of detail that first-generation scales cannot (and were not
intended to) offer. A variety of organizations, including the US Agency for International
Development, have sponsored such surveys. The most elaborate is the World Bank
Institute's 1999 Business Environment and Enterprise Performance Survey (BEEPS)
carried out in twenty transitional states in the former USSR and Eastern and Central
Europe (Hellman, Jones, Kaufmann, and Schankerman, 2000). The data, based on a
seventy-item survey of business firms, and on some supplementary questions, were
gathered in 1999 (for a description of methods, see Ibid., pp. 1-8). The survey approach
allows considerable control of data gathering, and in particular it allows researchers to
consider different varieties of corruption. Cross-national surveys involve obvious
- 25 -
linguistic problems; other difficulties of comparison, such as a tendency for respondents
in various countries systematically to under- or overestimate the corruption with which
they deal, must be taken into account too. On the latter point, however, the BEEPS
survey asks respondents' views on verifiable aspects of the business environment, such
as exchange-rate fluctuations, as well as about corruption. For the former, perceptions
can be checked against valid indicators, allowing an intelligent guess as to whether
respondents systematically over- or understate the latter. BEEPS-style projects are
formidably expensive, and while including a wider variety of corrupt practices and
situations than most other indices, still approach the problem from the standpoint of
businesses and lenders. Nonetheless, they are an extremely promising addition to the
growing number of corruption measures, and the 1999 data have already begun to
produce intriguing comparative studies of some of the countries where corruption
problems are of most concern (see, for example, Hellman, Jones, and Kaufmann, 2000).
In 1999 Transparency International, responding in part to the criticisms of
countries rated negatively in the CPI, and in part to the growing realization, as the
OECD anti-bribery treaty took shape, that the sources of bribes needed to be studied as
well, devised a "Bribe Payers' Index" (BPI).15 The BPI (see Appendix B), based on Gallup
survey data gathered in fourteen "emerging market" countries, ranked nineteen leading
exporting countries in terms of their own firms' propensity to pay bribes to "senior
public officials". The results were quite different from those of the CPI: countries such
- 26 -
as Sweden, Australia, Canada, the United Kingdom, and the United States came off
much less favorably in this index. The BPI has made its share of headlines, but here
again questions are being raised. The new index does not appear to control for the size
of the "home economies" of bribe-payers, or for their countries' prominence (or lack of
it) in trade, either overall or within particular regions. There is no distinction made as to
the gravity of cases in which a country's firms might be involved. It is not clear which
country would be blamed for bribes paid by (say) an Indonesian employee of a Thai
subsidiary of an Anglo-Dutch corporation that is part of a multi-national consortium
bidding on a major arms contract. Again we have the problem of the differences
between perceptions and corruption itself: are respondents basing their judgments on
actual knowledge of corruption, upon hearsay, or upon their general opinions of
particular countries? The BPI is a new measure; it does raise an important issue, and
again Transparency International has provided an extensive "framework" document.16
It seems likely that this and other measures focusing on the sources of bribes will be the
focus of continued work over the years to come.
Kaufmann, Kraay, and Zoido-Lobatón (1999a) have constructed a sophisticated
index of "graft" as a part of a broader measure of the quality of governance (Ibid., 2 et
passim.). They use 31 component measures that allow the inclusion of 166, 156, and 155
countries, respectively, in aggregate indices of the rule of law, government
effectiveness, and graft (Ibid., 2; data are described in Kaufmann, Kraay, and Zoido-
15 http://www.transparency.org/documents/cpi/bps.html
- 27 -
Lobatón, 1999b). The statistical approach is an "unobserved components" model
(Kaufmann, Kraay, and Zoido-Lobatón, 1999a, 1-2, 8-14; see also Greene, 1990: Ch. 17),
treating country data as a linear function of governance -- which remains unobserved,
but is assumed to be normally distributed across countries -- plus a "disturbance term"
reflecting both error resulting from the different samples of countries available for the
various indicators, and error in the indicators themselves. This approach allows
estimates of standard errors, and (under certain assumptions) of confidence intervals,
for the three governance indices.
Unlike the CPI, which excludes countries with fewer than three corruption
surveys, this approach is more inclusive. The rationale is that data are likely to be more
plentiful for countries with better governance, and that excluding those for which data
are scarce has the effect of omitting many of the worst-governance cases, as discussed
above. Supporting this view is a comparison made by Kaufmann et al. (1999c, 23-24 and
Fig. 8, p. 46) between preliminary estimates of "probity" (calculated using the same
unobserved-components approach on a somewhat smaller database) and 1998 CPI
scores. The CPI produced systematically lower estimates of probity -- likely the result of
excluding countries with fewer than three surveys.
Kaufman et. al. found that even given some strong assumptions, standard errors
for their governance indicators (including graft) were very large. It was possible to
identify a handful of countries at the good- and bad-governance extremes, but results
16 http://www.transparency.org/documents/cpi/bpi_framework.html
- 28 -
for the vast majority did not differ statistically from the global means. For most
countries, the data did not support confident judgments that probity, bureaucratic
quality, and rule of law were particularly high or low -- much less allow fine
comparisons using a single-number index (Kaufmann, Kraay, and Zoido-Lobatón,
1999a: 2, 15-19). Moreover, averaging "noisy" individual measures together, by any of
several methods, means that statistical models including aggregate governance
indicators are likely to understate their relationships with other variables by ten to
fifteen percent (Kaufmann, Kraay, and Zoido-Lobatón, 1999c: 21-26). Finally, the
assumption of a linear relationship between governance itself and the component
measures may not be sustainable (Kaufmann, Kraay, and Zoido-Lobatón, 1999a: 22-24).
As with the CPI, we are thus not sure that "real" variations are equal across all identical
intervals of the indices. In the end, probably the most a realistic corruption measure can
do is to identify bands of cases likely to have broadly comparable levels of corruption
(for a critical evaluation of the methods used by Kaufmann et. al., see Lambsdorff,
1999a: 18-20).
A different approach (Hall and Yago, 2000) gets at corruption by way of its
correlates and consequences. It focuses upon the concept of "opacity" -- the opposite of
transparency or, in this context, restrictions upon the open flow of information essential
to orderly, efficient markets. Opacity has many forms in practice, ranging from false
accounting to intimidation, and serves "to ensure the secrecy of corrupt of questionable
practices" (Ibid.: 1). A statistical model is developed that incorporates corruption in
- 29 -
several different ways: CPI figures are included as an estimate of corruption, along with
macroeconomic data and various measures of institutional quality. The data are used to
account for the varying interest rates paid by governments as they float bonds on the
international market. Those with poorer institutions and higher levels of opacity pay
higher costs -- a "premium" -- to borrow money. Estimating the size and sources of these
costs is, in effect, a way to compare the seriousness of these countries' corruption
problems. The authors calculate an "institutions premium", a "corruption premium",
and a "graft premium" -- the latter based on the graft index calculated by Kaufmann et.
al. -- for each of 35 countries. These estimate "the shortfall each country had from the
perfect transparency score" (Ibid.: 5). The results are strong and consistent: poor-quality
institutions, corruption, and graft are linked to significantly higher costs of borrowing --
estimated at over $130 billion per year for the sample of 35 economies. These are
indirect measures of corruption, to be sure, but they have the virtue of incorporating
perceptual scales into a range of harder indicators. But while the corruption and graft
premia are both consistent with the perceptions tapped by CPI -- and, in practical terms,
are likely influenced by such perceptions, as noted earlier -- construct validity,
reliability, and precision are augmented by the ways lenders continually evaluate
countries' economic performance and debt-service prospects. Corruption itself remains
difficult to measure, but the notion of building indices on more reliable measures of
other variables closely related to it is a very promising one.
Better Research, Better Policy
- 30 -
Two major issues remain. One is a shortcoming with all of the measures now
available. The other reflects the range of forces shaping the past decade's work.
As for the first: how much guidance do corruption indices give reformers? Can
those fighting corruption in a society look to CPI scores for evidence of progress, and
for guidance in shaping their strategies? In all likelihood they cannot. CPI data do
exhibit impressive reliability, but as noted above we still do not know how well they
track changes in levels of corruption. Perceptions may outrun, or lag behind, actual
trends. Any comprehensive anti-corruption strategy will likely work better with some
varieties of the problem than with others, and yet a single-number index will not be
able to tell us much about those contrasts -- and thus, much about which aspects of the
strategy are working and which are not.
What is likely to happen to perception scores for a country that has begun to
make meaningful progress against corruption? There are several possibilities: at the
very least, progress will be uneven, and thus recognized more quickly by some
observers than by others. In that event, the uncertainty (variance, or standard deviation
in some versions) of CPI scores might widen considerably while the scores themselves
change in ways that would be difficult to interpret. More likely, a successful anti-
corruption campaign would produce revelations of wrongdoing, convictions, and new
allegations. This is all the more likely in a democratizing country with citizens,
journalists, and opposition figures feeling more free to speak out, and contending
- 31 -
factions using corruption allegations to settle old scores. In that setting, effective anti-
corruption efforts would likely cause perceptions to worsen markedly, at least in the
short run. Finally, a campaign that begins to break up corrupt networks may well lead
to a short-term surge of overt, smash-and-grab corruption as elites, uncertain about
their hold on power, take as much as they can, as fast as they can take it (Scott, 1972;
Knack and Keefer, 1995). Once again, CPI ratings may worsen. Surveys, whether on the
BEEPS scale or smaller, are probably the best way to gauge anti-corruption progress.
But they are expensive, and may not reveal much about progress against the deeper
causes of corruption, or why observed trends are occurring.
Can we devise relatively inexpensive measures that are still sensitive to changing
levels of corruption, and can give useful guidance to anti-corruption efforts? One way
might be to focus less on measuring corruption itself and more upon scaling its
correlates. We have good reasons to think that a variety of conditions and phenomena
are closely linked to corruption. Many of these have been measured at a considerable
level of validity, reliability, and precision, and in ways that do not reify perceptions and
anecdotes as broader trends. Serious corruption is deeply embedded, and causality can
be difficult to disentangle; still, we might construct a pair of indices approximating
causes and effects. Loayza (1996) has employed a similar approach in studying informal
economies, a measurement challenge resembling corruption in many respects. On one
side we could incorporate measures of major problems giving rise to, and sustaining
corruption -- poor-quality institutions, lack of political competition, a lack of openness
- 32 -
in the economy, inflation, and weak guarantees of civil liberties and property rights, for
example -- as well as those that make corruption easier to conceal (such as Hall and
Yago's measurements of "opacity"). A parallel index of consequences might include
factors such as capital-to-labor ratios in key aspects of the economy, budget-
composition indicators (Mauro, 2000), statistics on the efficiency of tax collection,
"black-market premiums" in foreign exchange, trends in aggregate development, and so
on. Both indices could be based upon an unobserved-components model; both could be
tailored to include likely correlates of different forms of corruption. A focus upon
specific countries or regions over time would reduce the risk of distortions caused by
the differing data available in various countries. The result could be indices
complementary to those now available yet sensitive to changes and to the deeper causes
and effects of corruption.
There are some obvious problems here. Endogeneity and simultaneity make
causes and effects of corruption difficult to separate: is ineffective tax collection or a
"black-market premium" a result of corruption, or does it create incentives that cause it?
This approach, while it might reveal distinctive aspects of corruption in particular
societies or regions, would not produce "headline numbers" for broad cross-national
comparisons, though as the discussion above makes clear, such comparisons face major
difficulties to begin with. The statistical risks inherent in merging disparate indicators
would remain. So would problems of reliability and precision: how, for example,
should the components of such indices be weighted? Should we use a regression model
- 33 -
that predicts CPI or other scores for some initial point in time and weight measures by
their statistical power (along with control variables) to predict our "effects index", or
changes in it? If so, how should we weight the components of the effects scale?
As with the CPI and other measures, there would also be questions as to how to
report the results. Are annual results extended to decimal places appropriate? Would
they raise expectations that cannot be met or, because of the long-term nature of basic
reform, lead to disillusionment? Would reporting results in broader "bands" create the
illusion that nothing is changing? On the other hand, if reforms really are likely to
produce the appearance of increased corruption in the short-run, solid evidence that
underlying changes are more gradual might be very valuable to anti-corruption
agencies facing press and political scrutiny.
The second problem is a needless, and ultimately false, bifurcation in the
corruption debate, generally expressed as a gap between "theory" and "practical"
research. This too is linked to reform, but has deeper roots, reflecting the outlooks and
interests that have shaped many first-generation measures and their uses. Usually the
implication is that broadly comparative work -- particularly that aimed at developing
conceptual frameworks and broad-based explanations -- falls into the former category,
while the statistical approaches and reform orientation defining the "new consensus"
embody the latter. Research and reform are indeed distinct enterprises, but the most
- 34 -
troubling aspect of this bifurcation is the frequent implication that comparative research
is irrelevant -- or a positive hindrance -- to "practical" insights about corruption.
This distinction, of course, quickly breaks down under critical examination:
sound theory will always have to be tested against the best evidence available, and
reforms or empirical research not guided by theory are pointless, and may do more
harm than good. But it may damage both the analytical and the reform agendas. The
scholarly tradition is distorted by an overemphasis upon the narrow range of factors
included in the so-called "practical" arena -- perhaps most clearly illustrated by the
ways corruption indices reduce complex cases to single numbers and encourage cross-
sectional statistical approaches that impose a single model upon widely divergent cases.
Policymakers may lose sight of the historical origins of corruption, and thus of some of
the forces and conflicts sustaining it; of the cultural and linguistic factors shaping the
social significance of corruption as well as responses to reforms; and of the many
opportunities -- indeed, the necessity -- to carefully choose policies and judge their
effects in the context of local realities. In such a setting scholars -- seeking "relevance" --
may produce work that is atheoretical, ahistorical, and devoid of comparative insight --
a collection of case studies without richness or context -- and that policymakers,
rejecting the need for a subtle and contingent analytical framework, will support one-
size-fits-all remedies or "toolkit" reforms that do not reflect the kinds of things
comparativists have long known about the societies in question.
- 35 -
There is no valid reason why the theoretical/practical bifurcation should exist.
Indeed, as emphasis shifts away from putting corruption back on the international
policy agenda -- a task for which indices such as the PCI have proven very well-suited --
toward action against it, the need for theory, comparisons, and subtle, often qualitative
sorts of evidence becomes greater, not less. Broad-based comparative frameworks
merging quantitative evidence with qualitative knowledge, and with linguistic, cultural,
and historical evidence, would serve both traditions well. Reform and analysis will
always remain distinct enterprises, but as Hall and Yago's work on "opacity" suggests,
the shortcomings of perceptual measures become less critical the more they are
augmented with other evidence. Comparative frameworks may generate more precise
hypotheses to the extent that they draw upon quantitative evidence. Here, in a way, the
second-generation corruption measures help show the way forward: as they become
more elaborate they are more and more dependent for their meaning upon complex
models, and become increasingly distant from "corruption rankings". There is no reason
why that trend cannot be carried further, with statistical analysis of corruption
questions becoming one component in broader comparative frameworks that have
linguistic and cultural subtlety, and qualitative and historical depth, along with the
kind of breadth that cross-sectional statistical data can provide.
There is no doubt that the effort to measure corruption has been worthwhile. It
has helped set to rest a variety of questions that had long kept the scholarly debate
going around in circles, and has framed others in more precise and comparative terms.
- 36 -
Even to devise a critique of the existing measures, and of the corruption-as-bribery
paradigm underlying much of the recent empirical work, is to identify fresh
comparative challenges. The potential of any research to produce rich and useful
insights depends fundamentally upon careful design and honest application, not upon
the apparent simplicity of its methods or results. The task now is to bring evidence of
many sorts together into discussions of corruption that can match the comparative
reach of most statistical indices with the complexity of corruption itself, and of the
societies it affects most.
References
Alam, M. Shahid. 1995. “A Theory of Limits on Corruption and Some Applications.” Kyklos 48(3): 419–35. Babbie, Earl. 1995. The Practice of Social Research. Belmont, CA: Wadsworth, 7th ed. Braun, Miguel, and Rafael Di Tella. 2000. "Inflation and Corruption.: Cambridge, Mass.: Harvard Business School, Division of Research, Working Paper 00-053. Collier, David, and S. Levitsky, “Democracy with Adjectives: Conceptual Innovation in Comparative Research”, World Politics 49 (April, 1997), pp. 430-451. Easterly, William, and Ross Levine. 1996. “Africa's Growth Tragedy: Policies and Ethnic Divisions.” World Bank, Policy Research Department, Macroeconomics and Growth Division, Washington, D.C. Gallie, W. B. 1965. "Essentially Contested Concepts." Proceedings of the Aristotelian Society 56. Génaux, Maryvonne. 2000. "Early Modern Corruption in English and French Fields of Vision". In Heidenheimer and Johnston, op. cit., forthcoming. Greene, William. 1990. Econometric Analysis. New York: Macmillan.
- 37 -
Hall, Thomas, and Glenn Yago. 2000. "Estimating the Cost of Opacity Using Sovereign Bond Spreads". Working Paper, Capital Studies Group, The Milken Insitute, Santa Monica, CA 90401. Heidenheimer, Arnold J., and Michael Johnston. 2000. Political Corruption. New Brunswick, N.J.: Transaction Press, forthcoming). Hellman, Joel S.; Geraint Jones, and Daniel Kaufmann. 2000. "Seize the State, Seize the Day: An Empirical Analysis of State Capture and Corruption in Transition." Draft of paper prepared for the Annual Bank Conference on Development Economics. Washington, D.C.: The World Bank (April); http://www.worldbank.org/wbi/governance/working_papers.htm Hellman, Joel S.; Geraint Jones, Daniel Kaufmann, and Mark Schankermann. 2000. "Measuring Governance, Corruption, and State Capture." Washington, DC: The World Bank (April); http://www.worldbank.org/wbi/governance/working_papers.htm Hempel, Carl G. 1952. "Fundamentals of Concept Formation in Empirical Science." International Encyclopedia of Social Science II (7). Huntington, Samuel P. 1968. Political Order in Changing Societies. New Haven: Yale University Press. Johnston, Michael. 1998. "What Can Be Done About Entrenched Corruption?", pp. 149-180 in Boris Pleskovic (ed.), Annual World Bank Conference on Development Economics 1997. Washington, DC: The World Bank. Johnston, Michael. 2000. "Party Systems, Competition, and Political Checks against Corruption". In Heidenheimer and Johnston, op. cit., forthcoming. Kaufmann, Daniel, Aart Kraay, and Pablo Zoido-Lobatón. 1999a. "Aggregating Governance Indicators". Washington: The World Bank; August; http://www.worldbank.org/wbi/governance/working_papers.htm Kaufmann, D., A. Kraay and P. Zoido- Lobaton (1999b), "Governance Matters." World Bank Policy Research Working Paper No. 2196, October (Washington D.C.: The World Bank); August version at http://www.worldbank.org/wbi/governance/working_papers.htm Kaufmann, D. Aart Kraay, and Pablo Zoido-Lobatón. 1999c. "Aggregating Governance Indicators". Washington: The World Bank; unpublished (August).
- 38 -
Knack, Stephen, and Philip Keefer. 1995. “Institutions and Economic Performance: Cross-Country Tests Using Alternative Institutional Measures.” Economics and Politics 7(3): 207–27. Lambsdorff, Johann Graf. 1999a. "The Transparency International Corruption Perceptions Index 1999: Framework Document". Berlin: Transparency International (October); http://www.transparency.org/documents/cpi/cpi_framework.html Lambsdorff, Johann Graf. 1999b. "Corruption in Empirical Research: A Review". http://www.gwdg.de/~uwvw/ Loayza, Norman. 1996. "The Economics of the Informal Sector: A Simple Model and Some Empirical Evidence from Latin America." Carnegie Rochester Conference Series on Public Policy 45, pp. 129-162. Markovits, Andrei S., and Mark Silverstein. 1988. The Politics of Scandal: Power and Process in Liberal Democracies. New York: Holmes and Meier. Mauro, Paolo. 2000. "The Effects of Corruption on Growth, Investment, and Government Expenditure". In Heidenheimer and Johnston, op. cit., forthcoming. Moodie, Graeme C. 1980. "On Political Scandals and Corruption." Government and Opposition 15(2): 208-222. Moroff, Holger, and Verena Blechinger. 2000. "Corruption Terms in the World Press: How Languages Differ". In Johnston and Heidenheimer, op. cit., forthcoming. Rose-Ackerman, Susan. 1996. “When is Corruption Harmful?” World Bank, Washington, D.C. Rose-Ackerman, Susan. 1999. Corruption and Government: Causes, Consequences, and Reform. Cambridge: Cambridge University Press. Schlesinger, Thomas J., and Kenneth J. Meier. 2000. "Variations in Corruption among the American States". In Heidenheimer and Johnston, op. cit., forthcoming. Scott, J. C. 1972. Comparative Political Corruption. Englewood Cliffs, NJ: Prentice-Hall. TILAC (Transparency International for Latin America and the Caribbean). 1999. "Another Form to Look at the TI Index: Latin America as an Example." Unpublished. Wei, Shang-Jin. 1997. "How Taxing Is Corruption on International Investors?", National Bureau of Economic Research Working Paper 6030, Cambridge, Mass.