the nestlé milk district model - schweizer agrarjournalisten · the nestlé milk district model...
TRANSCRIPT
1
The Nestlé Milk District Model-from a Swiss idea to a global concept-
Stefan CanzNestlé Corporate Agriculture
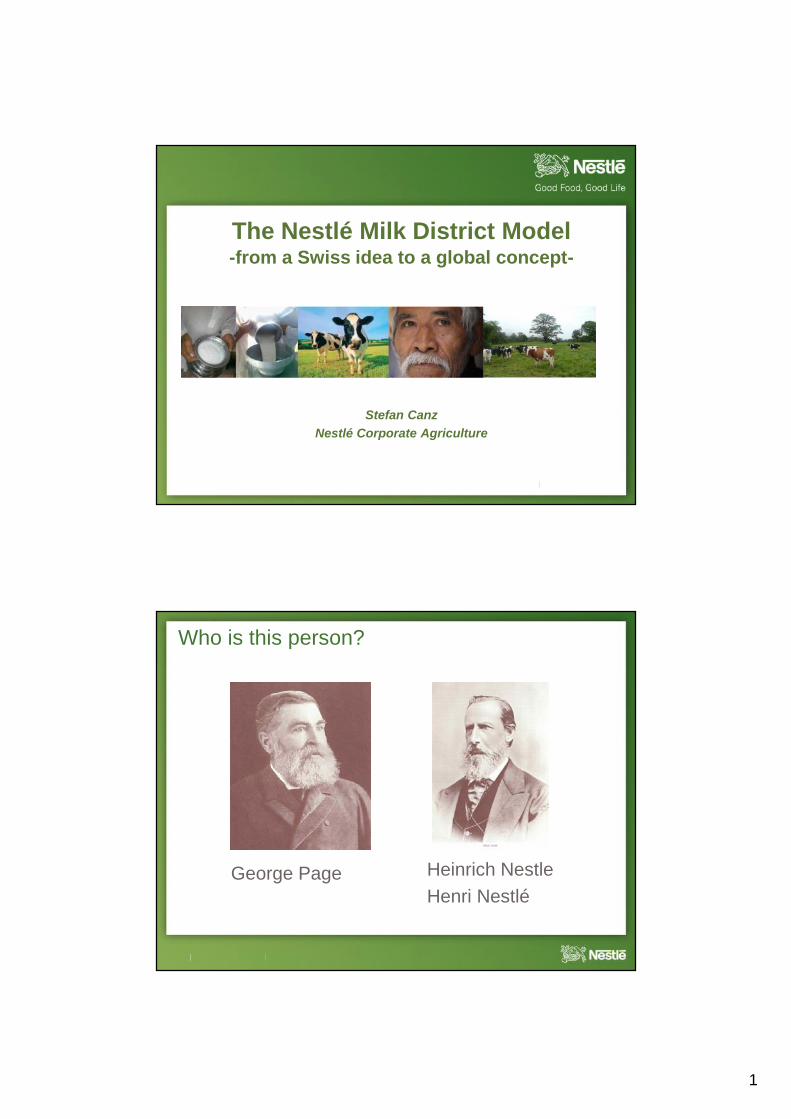
George Page
Who is this person?
Heinrich NestleHenri Nestlé
2
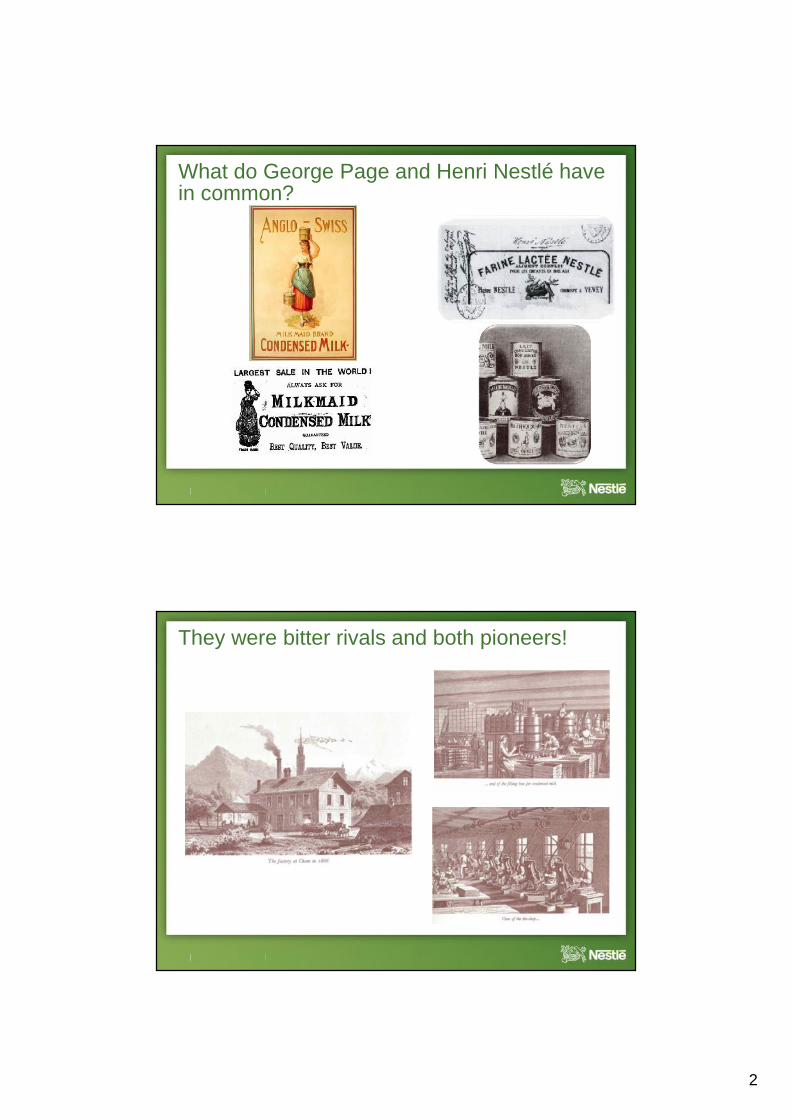
What do George Page and Henri Nestlé havein common?
They were bitter rivals and both pioneers!
3
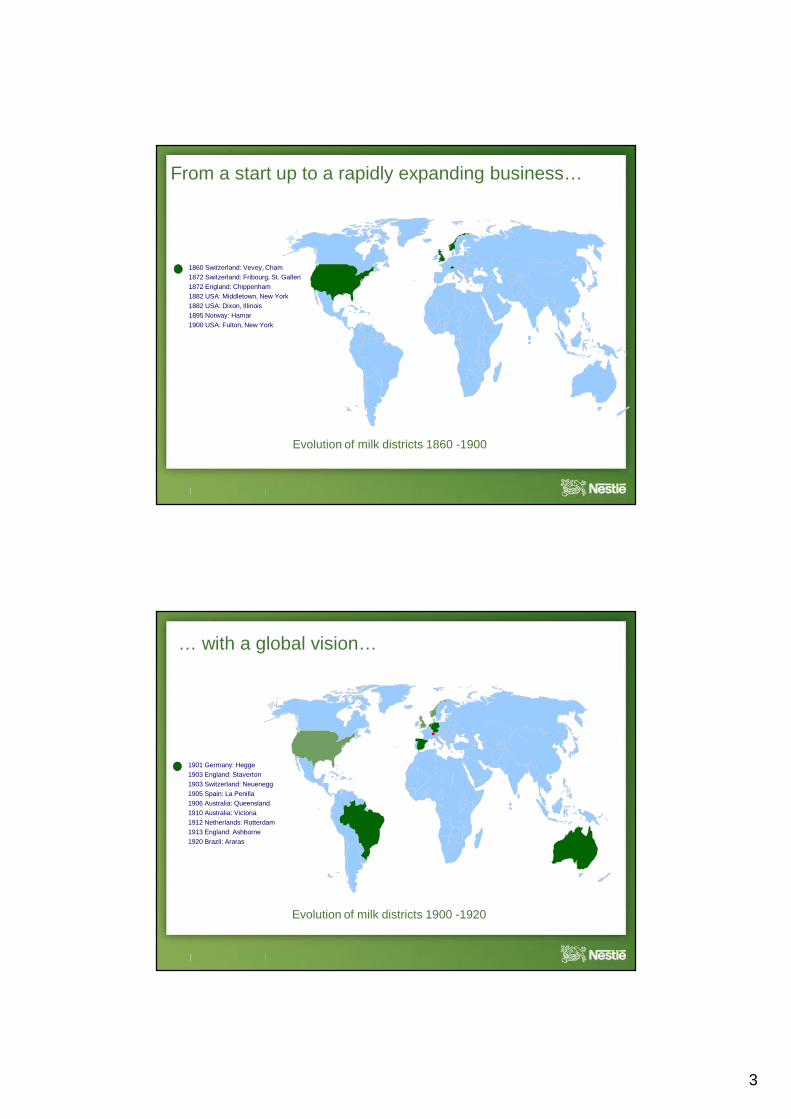
From a start up to a rapidly expanding business…
1860 Switzerland: Vevey, Cham1872 Switzerland: Fribourg, St. Gallen1872 England: Chippenham1882 USA: Middletown, New York1882 USA: Dixon, Illinois1895 Norway: Hamar1900 USA: Fulton, New York
Evolution of milk districts 1860 -1900
… with a global vision…
1901 Germany: Hegge1903 England: Staverton1903 Switzerland: Neuenegg1905 Spain: La Penilla1906 Australia: Queensland1910 Australia: Victoria1912 Netherlands: Rotterdam1913 England: Ashborne1920 Brazil: Araras
Evolution of milk districts 1900 -1920

4
The Anglo-Swiss Condensed Milk Company, founded by AmericansCharles and George Page, merged with Nestlé after a couple ofdecades as fierce competitors to form the Nestlé and Anglo-Swiss MilkCompany.
… to finally merge both companies in 1905!
The 1920s:
• Economic crisis: Nestlé suffered severedifficulties along with much of the world
• Operations were partially streamlined• Acquisition of Peter, Cailler, Kohler
Swiss Chocolate Company,
Chocolate became an integral part of ourbusiness. This sparked further variety inthe products we offered – including maltedmilk and a powdered drink called Milo.
Grasping opportunities also in difficult times through M&A…
5
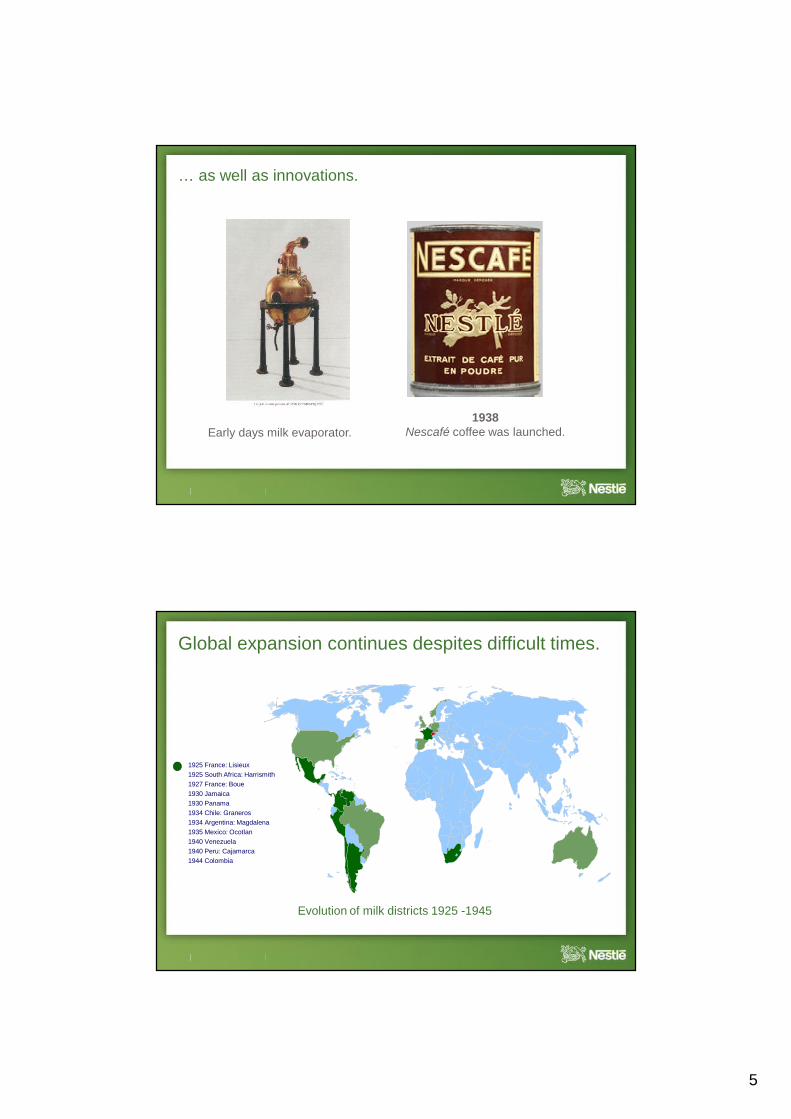
1938Nescafé coffee was launched.
… as well as innovations.
Early days milk evaporator.
Global expansion continues despites difficult times.
1925 France: Lisieux1925 South Africa: Harrismith1927 France: Boue1930 Jamaica1930 Panama1934 Chile: Graneros1934 Argentina: Magdalena1935 Mexico: Ocotlan1940 Venezuela1940 Peru: Cajamarca1944 Colombia
Evolution of milk districts 1925 -1945
6
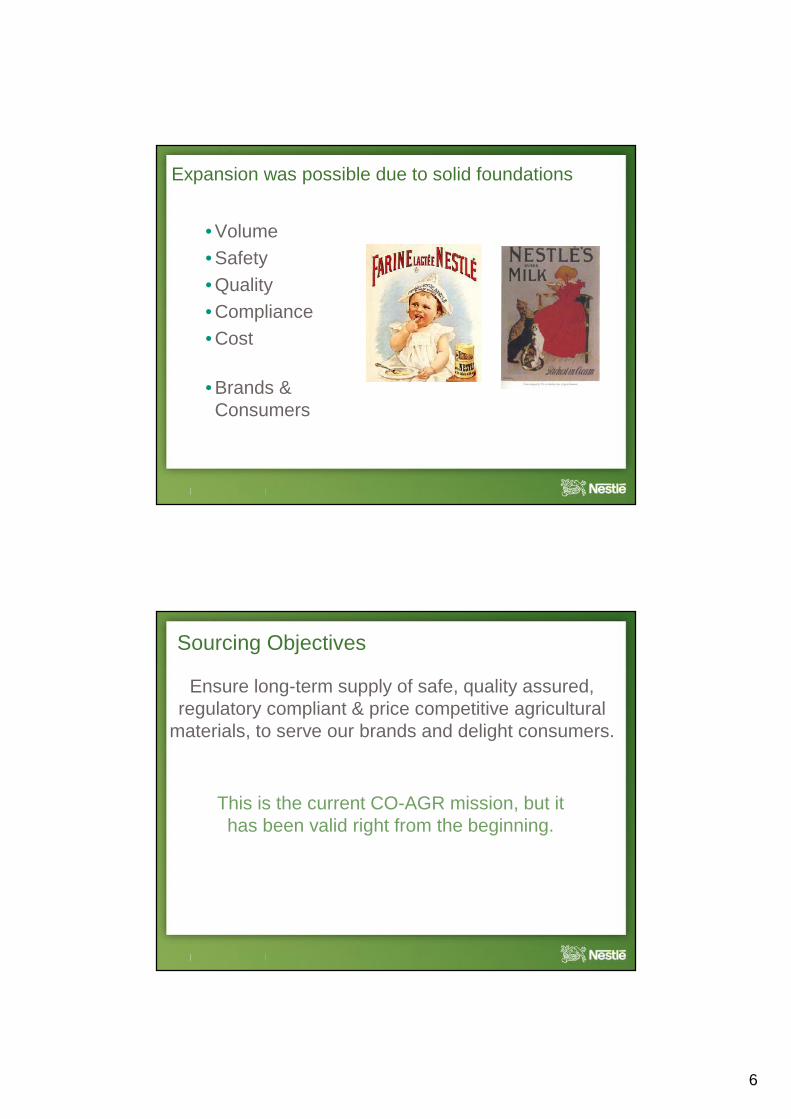
• Volume• Safety• Quality• Compliance• Cost.
• Brands &Consumers
Expansion was possible due to solid foundations
Ensure long-term supply of safe, quality assured,regulatory compliant & price competitive agricultural
materials, to serve our brands and delight consumers.
Sourcing Objectives
This is the current CO-AGR mission, but ithas been valid right from the beginning.
7
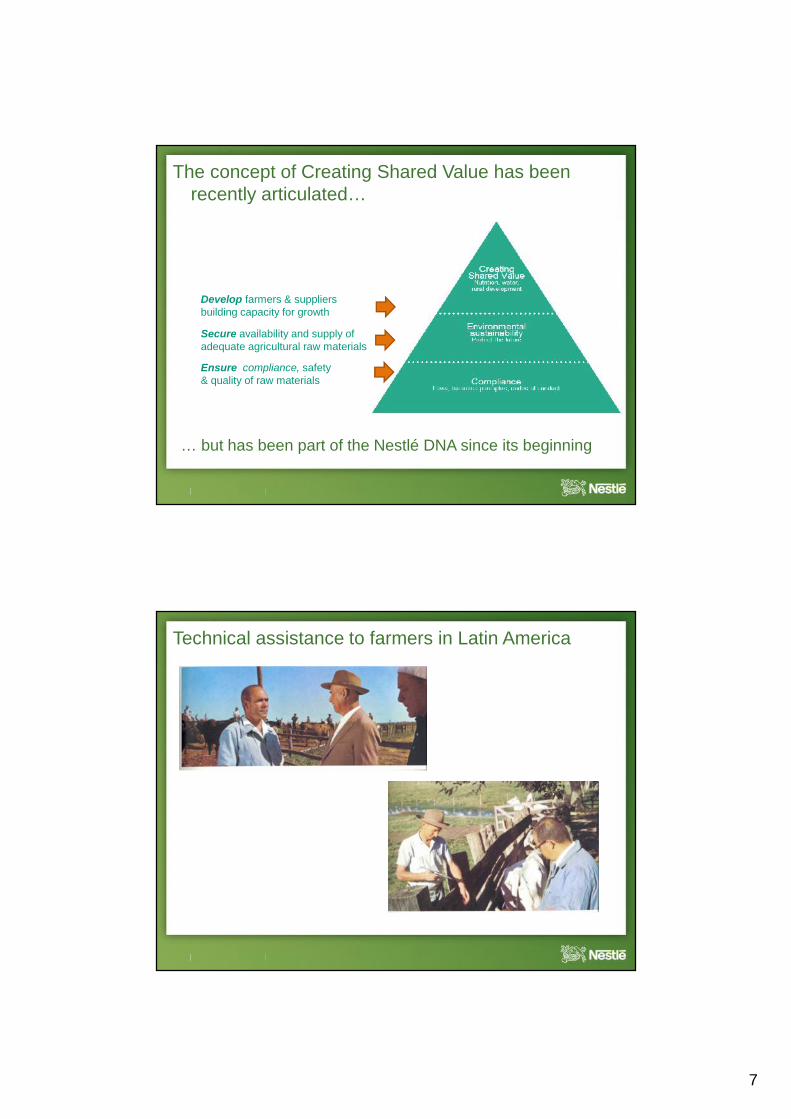
Secure availability and supply ofadequate agricultural raw materials
Ensure compliance, safety& quality of raw materials
The concept of Creating Shared Value has beenrecently articulated…
Develop farmers & suppliersbuilding capacity for growth
… but has been part of the Nestlé DNA since its beginning
Technical assistance to farmers in Latin America
8
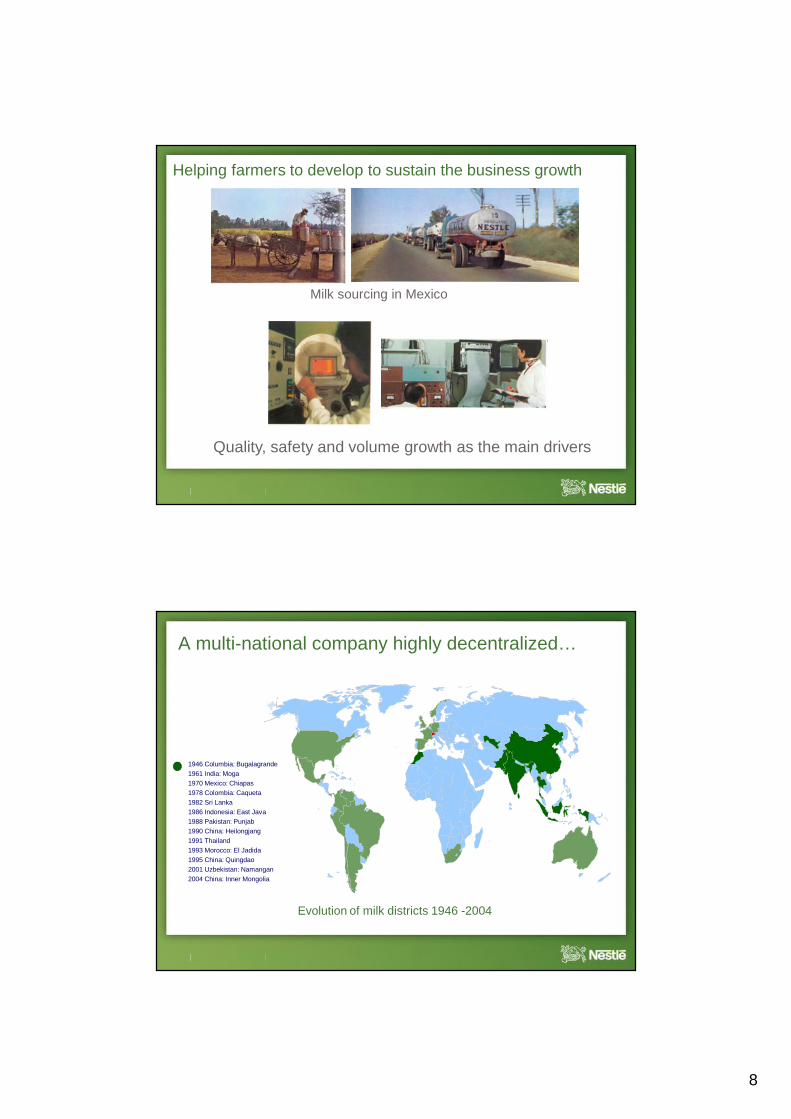
Helping farmers to develop to sustain the business growth
Quality, safety and volume growth as the main drivers
Milk sourcing in Mexico
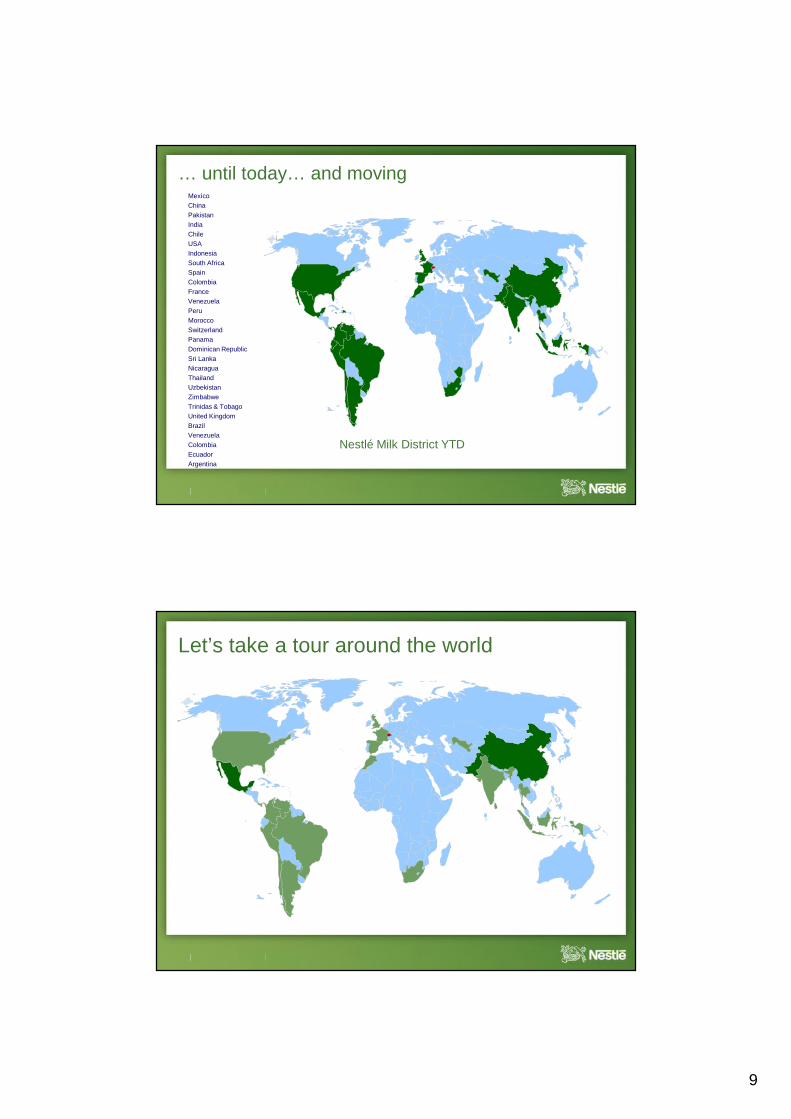
A multi-national company highly decentralized…
1946 Columbia: Bugalagrande1961 India: Moga1970 Mexico: Chiapas1978 Colombia: Caqueta1982 Sri Lanka1986 Indonesia: East Java1988 Pakistan: Punjab1990 China: Heilongjang1991 Thailand1993 Morocco: El Jadida1995 China: Quingdao2001 Uzbekistan: Namangan2004 China: Inner Mongolia
Evolution of milk districts 1946 -2004
9
… until today… and movingMexicoChinaPakistanIndiaChileUSAIndonesiaSouth AfricaSpainColombiaFranceVenezuelaPeruMoroccoSwitzerlandPanamaDominican RepublicSri LankaNicaraguaThailandUzbekistanZimbabweTrinidas & TobagoUnited KingdomBrazilVenezuelaColombiaEcuadorArgentina
Nestlé Milk District YTD
Let’s take a tour around the world
10
Pakistan
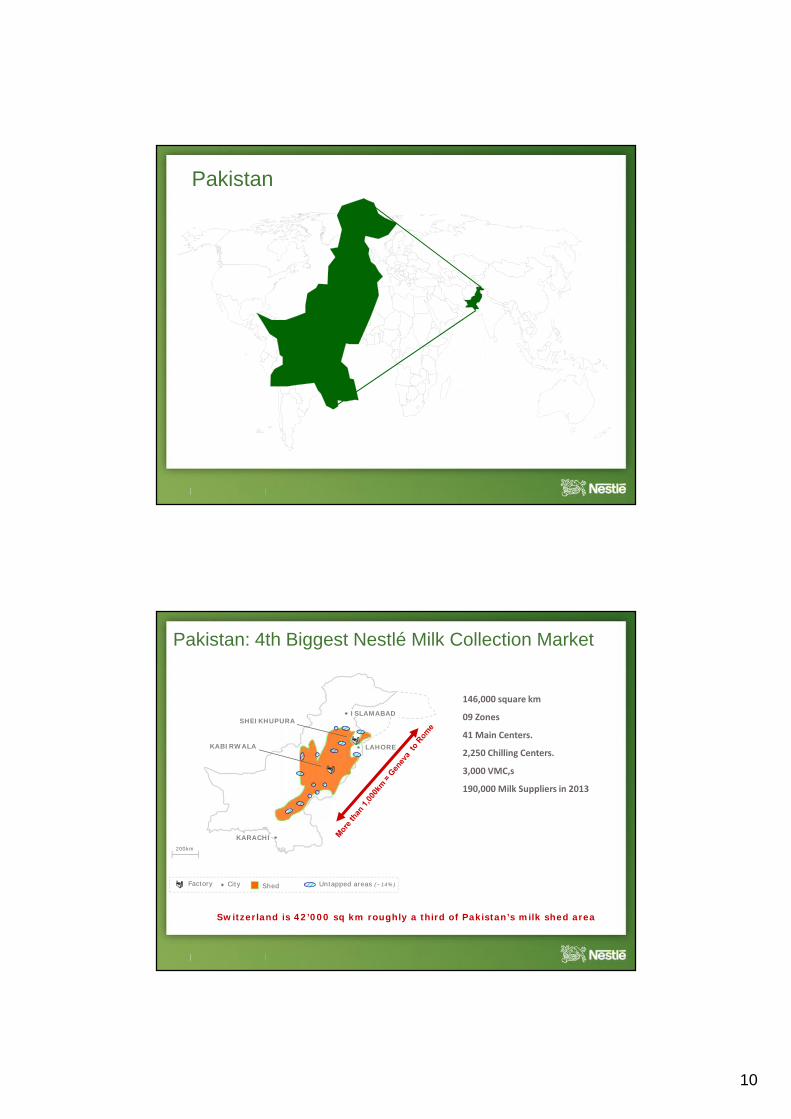
Pakistan: 4th Biggest Nestlé Milk Collection Market
LAHORE
KARACHI
ISLAMABADSHEIKHUPURA
KABIRWALA
Factory Shed
Switzerland is 42’000 sq km roughly a third of Pakistan’s milk shed area
200km
City Untapped areas (~14%)
146,000 square km
09 Zones
41 Main Centers.
2,250 Chilling Centers.
3,000 VMC,s
190,000 Milk Suppliers in 2013
11
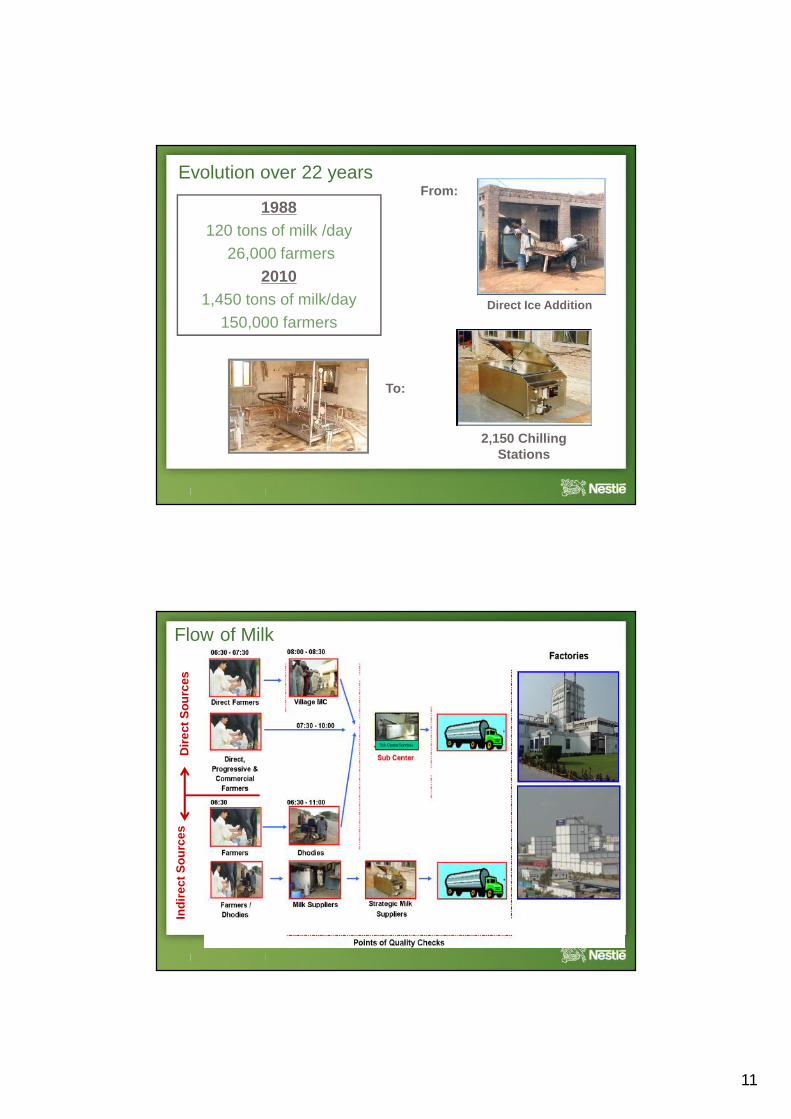
1988120 tons of milk /day
26,000 farmers2010
1,450 tons of milk/day150,000 farmers
Direct Ice Addition
2,150 ChillingStations
Evolution over 22 yearsFrom:
To:
Flow of Milk
Dire
ct S
ourc
esIn
dire
ct S
ourc
es
12
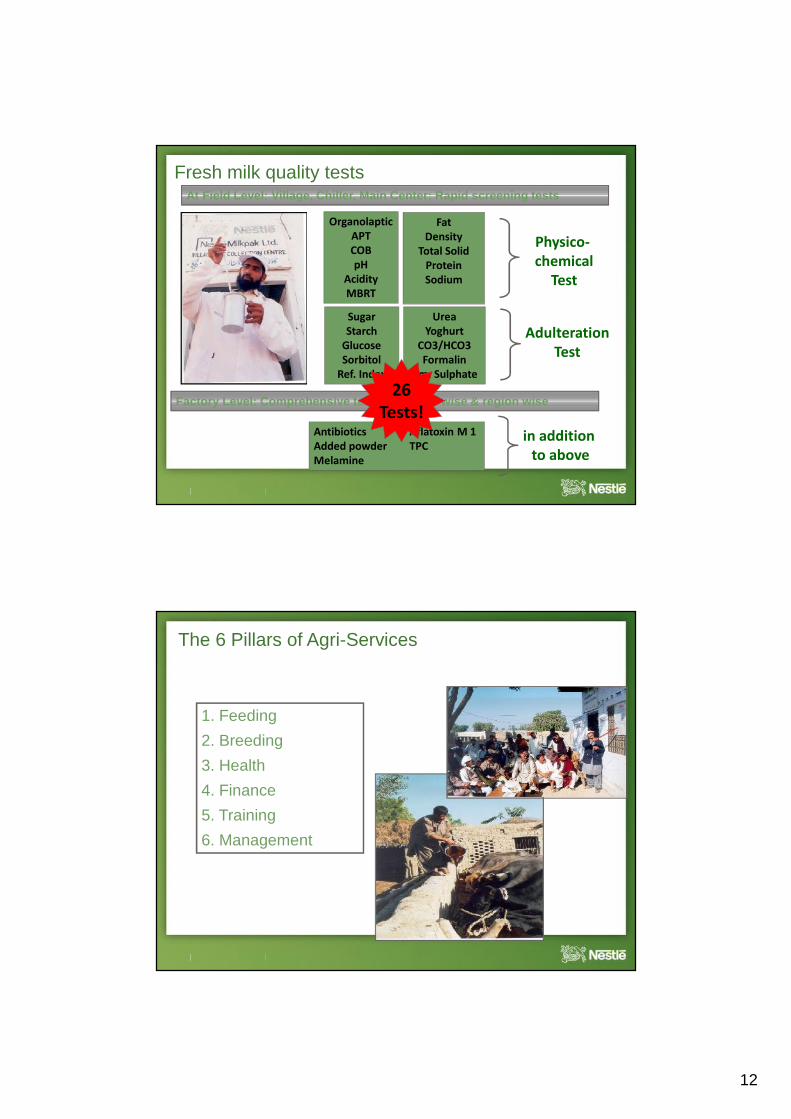
At Field Level: Village, Chiller, Main Center; Rapid screening testsAt Field Level: Village, Chiller, Main Center; Rapid screening tests
Factory Level: Comprehensive testing; Tanker wise & region wiseFactory Level: Comprehensive testing; Tanker wise & region wise
OrganolapticAPTCOBpH
AcidityMBRT
FatDensity
Total SolidProteinSodium
Physico-chemical
Test
AdulterationTest
SugarStarch
GlucoseSorbitol
Ref. Index
UreaYoghurt
CO3/HCO3Formalin
Am. Sulphate
Antibiotics Aflatoxin M 1Added powder TPCMelamine
in additionto above
Fresh milk quality tests
26Tests!
The 6 Pillars of Agri-Services
1. Feeding2. Breeding3. Health4. Finance5. Training6. Management
13
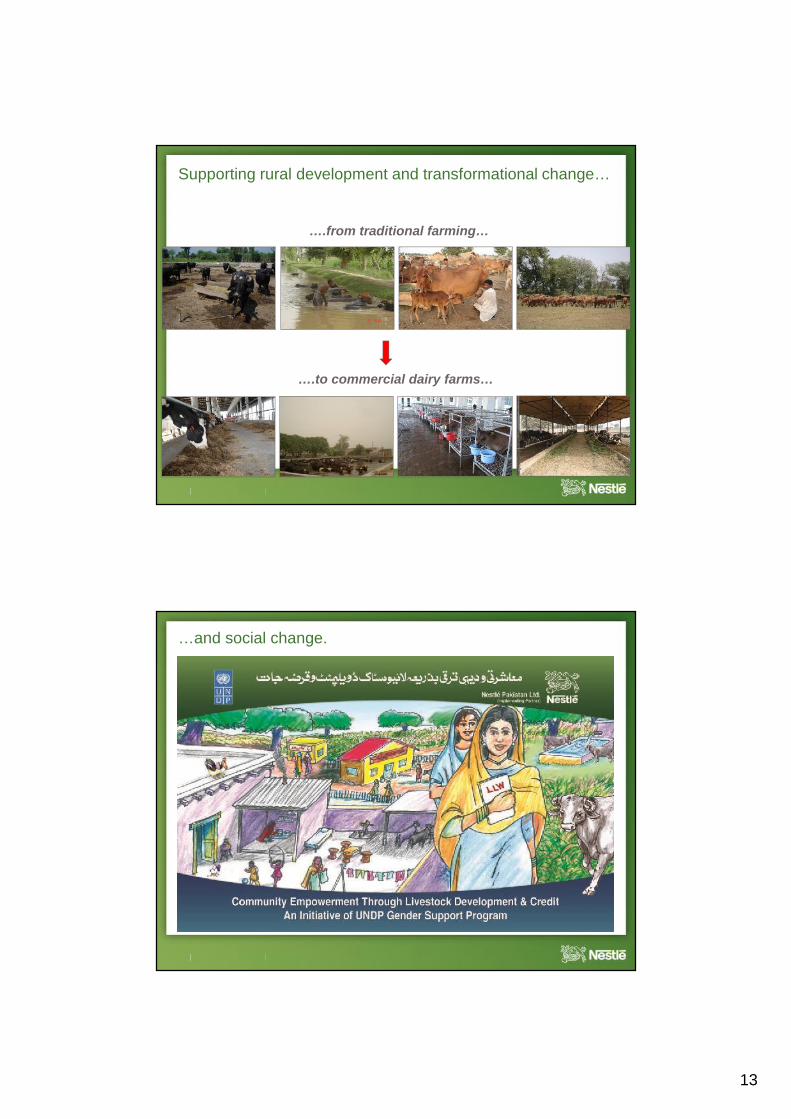
….from traditional farming…
….to commercial dairy farms…
Supporting rural development and transformational change…
UNDP Project…and social change.
14
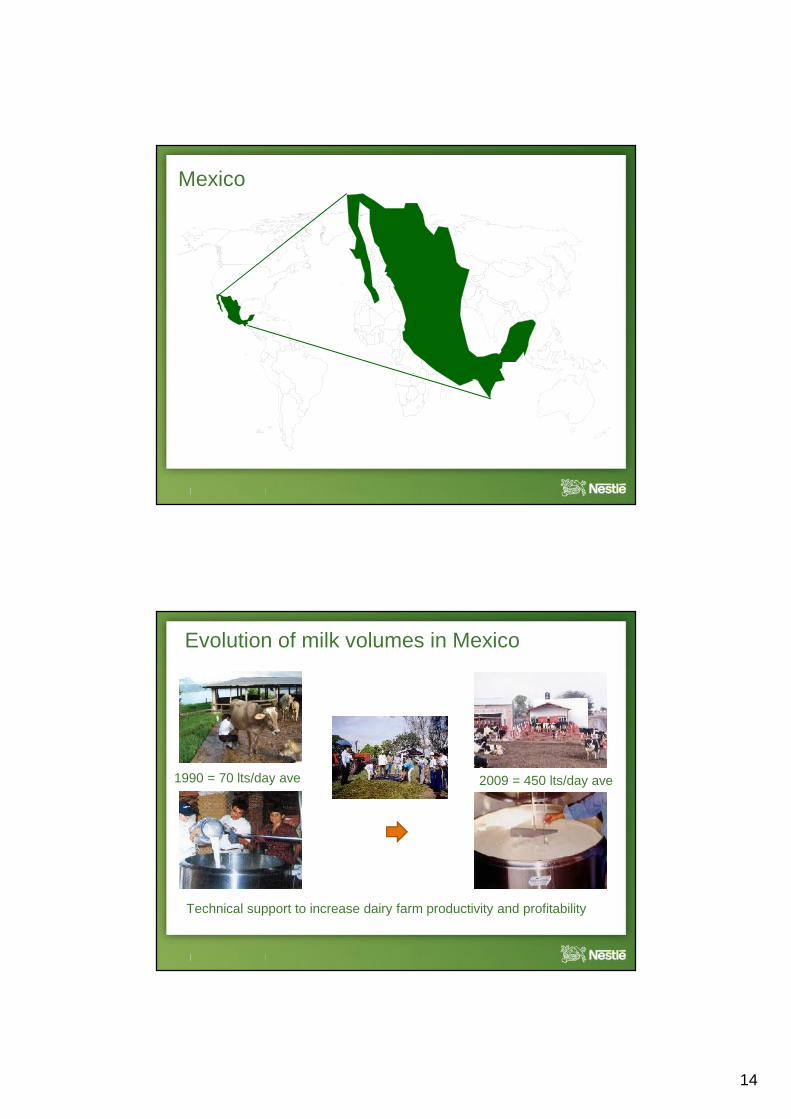
Mexico
Evolution of milk volumes in Mexico
Technical support to increase dairy farm productivity and profitability
1990 = 70 lts/day ave 2009 = 450 lts/day ave
15
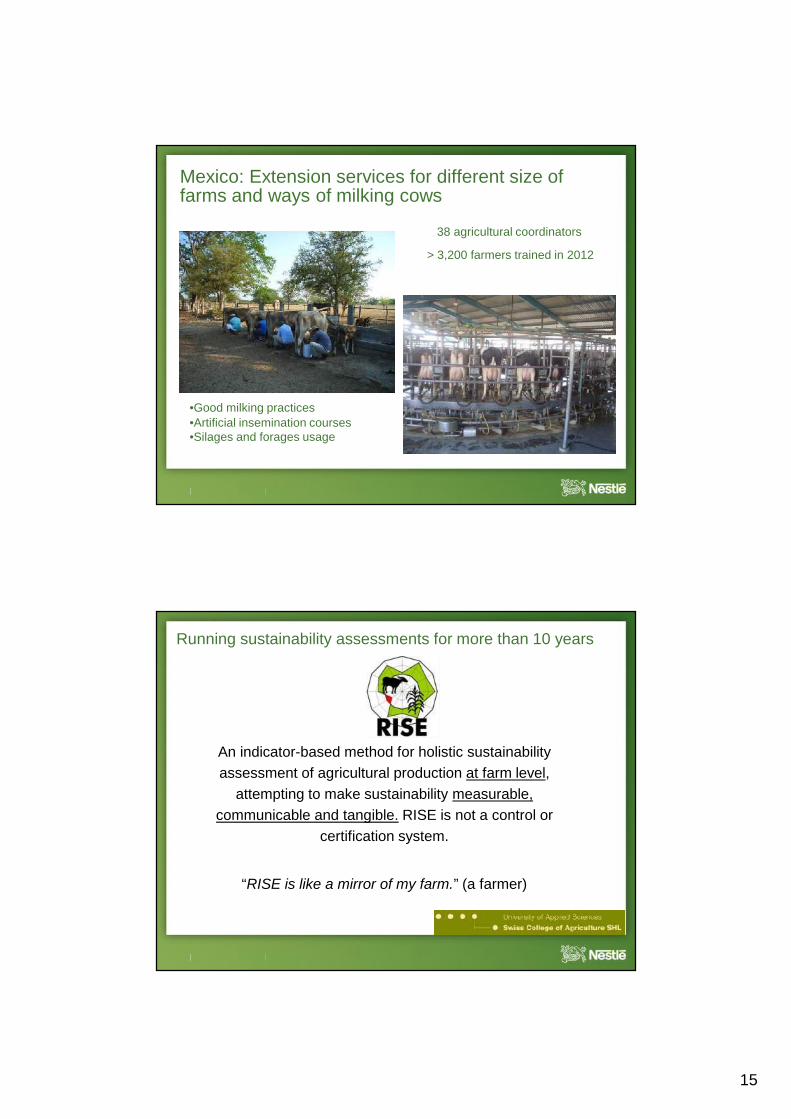
Mexico: Extension services for different size offarms and ways of milking cows
•Good milking practices•Artificial insemination courses•Silages and forages usage
38 agricultural coordinators
> 3,200 farmers trained in 2012
An indicator-based method for holistic sustainabilityassessment of agricultural production at farm level,
attempting to make sustainability measurable,communicable and tangible. RISE is not a control or
certification system.
“RISE is like a mirror of my farm.” (a farmer)
Running sustainability assessments for more than 10 years
16
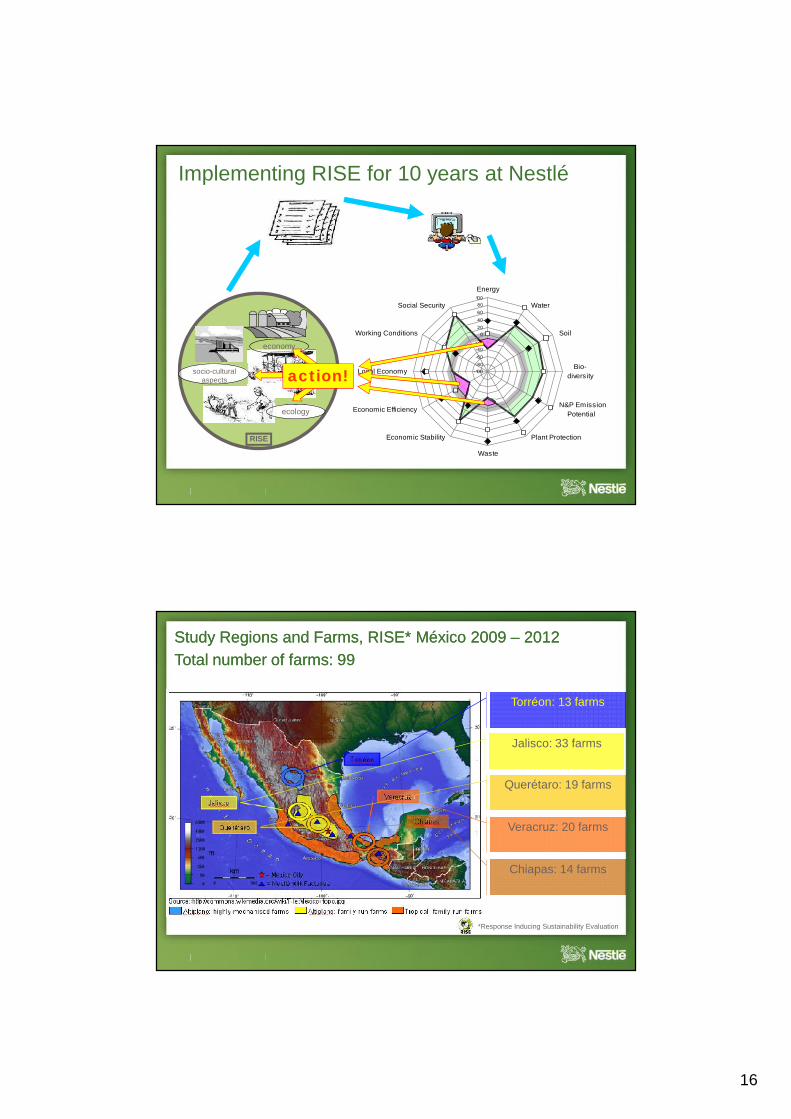
Implementing RISE for 10 years at Nestlé
Energy
Water
Soil
Bio- diversity
N&P EmissionPotential
Plant Protection
Waste
Economic Stability
Economic Efficiency
Local Economy
Working Conditions
Social Security
-100-80-60-40-20020406080100
economy
ecology
RISE
socio-culturalaspects action!
Study Regions and Farms, RISE* México 2009 – 2012Study Regions and Farms, RISE* México 2009 – 2012
Torréon: 13 farms
Jalisco: 33 farms
Querétaro: 19 farms
Veracruz: 20 farms
Chiapas: 14 farms
*Response Inducing Sustainability Evaluation
Total number of farms: 99Total number of farms: 99
17
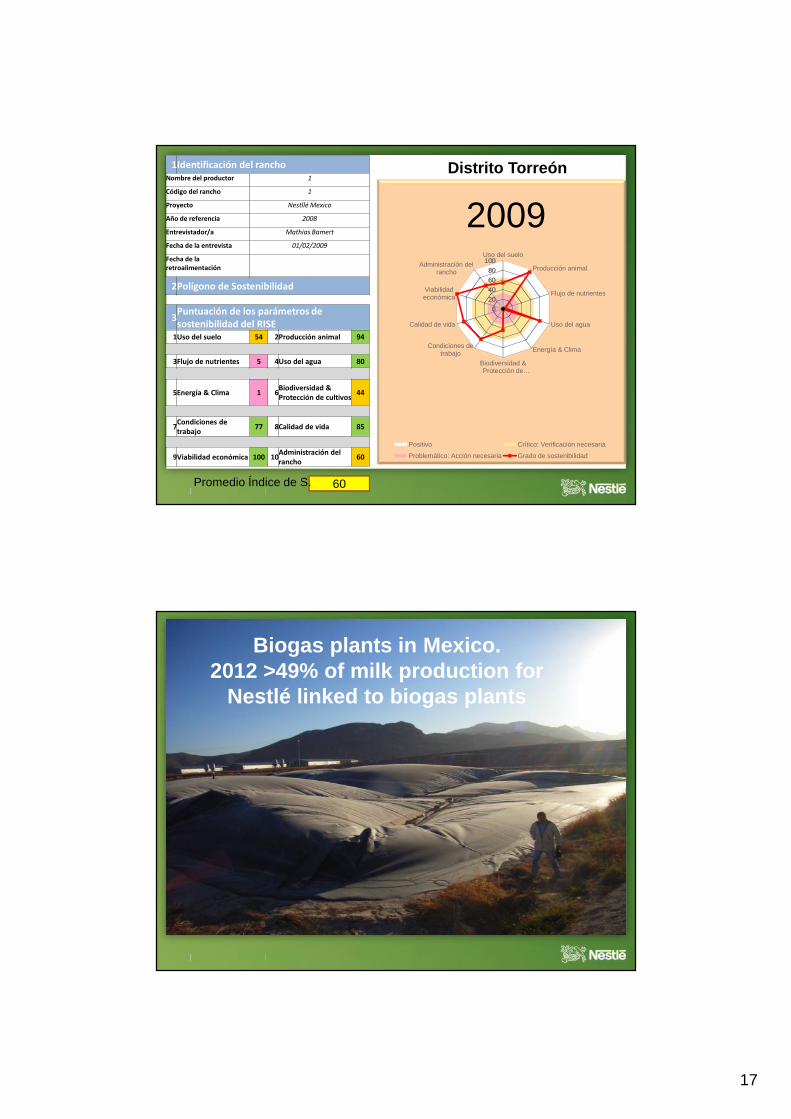
1Identificación del ranchoNombre del productor 1
Código del rancho 1
Proyecto Nestllé Mexico
Año de referencia 2008
Entrevistador/a Mathias Bamert
Fecha de la entrevista 01/02/2009
Fecha de laretroalimentación
2Polígono de Sostenibilidad
020406080
100
020406080
100Uso del suelo
Producción animal
Flujo de nutrientes
Uso del agua
Energía & Clima
Biodiversidad &Protección de…
Condiciones detrabajo
Calidad de vida
Viabilidadeconómica
Administración delrancho
Positivo Crítico: Verificación necesaria
Problemático: Acción necesaria Grado de sostenibilidad
3Puntuación de los parámetros desostenibilidad del RISE
1Uso del suelo 54 2Producción animal 94
3Flujo de nutrientes 5 4Uso del agua 80
5Energía & Clima 1 6Biodiversidad &Protección de cultivos 44
7Condiciones detrabajo 77 8Calidad de vida 85
9Viabilidad económica 100 10Administración delrancho 60
60Promedio Índice de S.
Distrito Torreón
2009
Biogas plants in Mexico.2012 >49% of milk production for
Nestlé linked to biogas plants
18
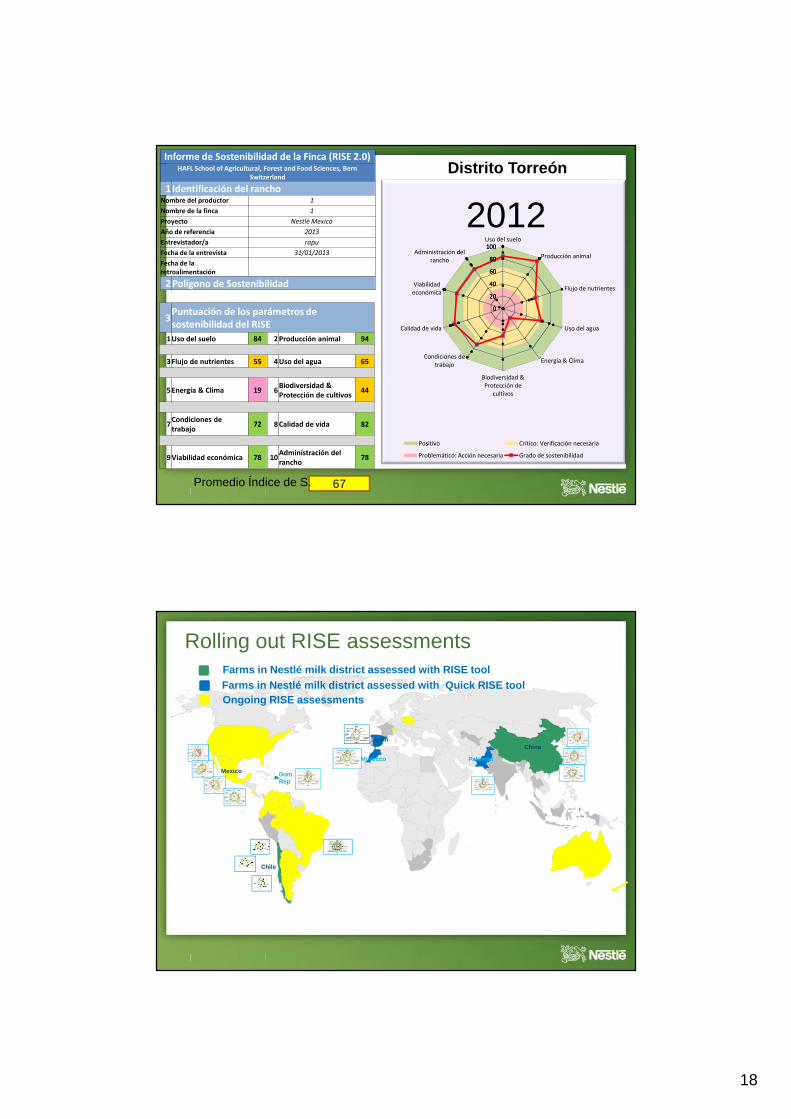
Informe de Sostenibilidad de la Finca (RISE 2.0)HAFL School of Agricultural, Forest and Food Sciences, Bern
Switzerland
1Identificación del ranchoNombre del productor 1Nombre de la finca 1Proyecto Nestlé MexicoAño de referencia 2013Entrevistador/a rapuFecha de la entrevista 31/01/2013Fecha de laretroalimentación
2Polígono de Sostenibilidad
3Puntuación de los parámetros desostenibilidad del RISE
1 Uso del suelo 84 2 Producción animal 94
3 Flujo de nutrientes 55 4 Uso del agua 65
5 Energía & Clima 19 6 Biodiversidad &Protección de cultivos 44
7 Condiciones detrabajo 72 8 Calidad de vida 82
9 Viabilidad económica 78 10 Administración delrancho 78
67Promedio Índice de S.
Distrito Torreón
0
20
40
60
80
100
0
20
40
60
80
100Uso del suelo
Producción animal
Flujo de nutrientes
Uso del agua
Energía & Clima
Biodiversidad &Protección de
cultivos
Condiciones detrabajo
Calidad de vida
Viabilidadeconómica
Administración delrancho
Positivo Crítico: Verificación necesaria
Problemático: Acción necesaria Grado de sostenibilidad
2012
Farms in Nestlé milk district assessed with RISE tool
Mexicoo Dom.
Rep
Morocco Pakistan
Chile
ChinaSpain
00 Farms in Nestlé milk district assessed with Quick RISE toolOngoing RISE assessments
Rolling out RISE assessments
19
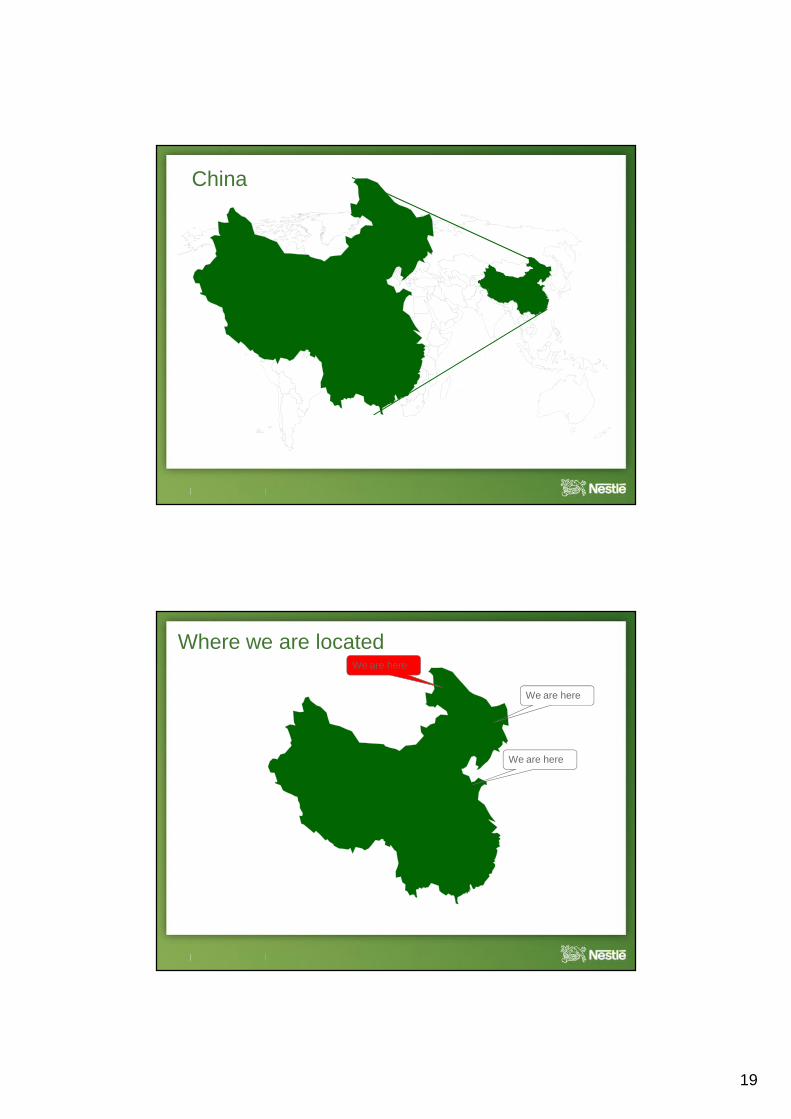
China
Where we are locatedWe are here
We are here
We are here
20
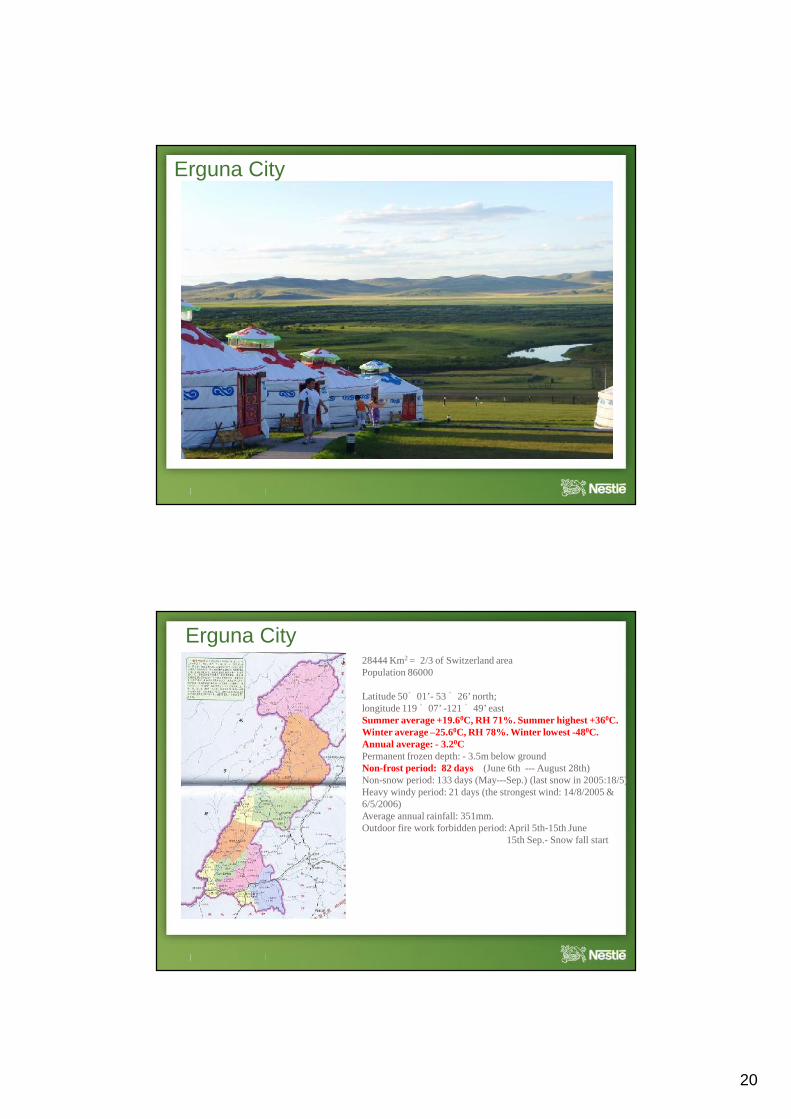
Erguna City
28444 Km2 = 2/3 of Switzerland areaPopulation 86000
Latitude 50。 01’- 53
。 26’ north;longitude 119
。 07’ -121。 49’ east
Summer average +19.60C, RH 71%. Summer highest +360C.Winter average –25.60C, RH 78%. Winter lowest -480C.Annual average: - 3.20CPermanent frozen depth: - 3.5m below groundNon-frost period: 82 days (June 6th --- August 28th)Non-snow period: 133 days (May---Sep.) (last snow in 2005:18/5)Heavy windy period: 21 days (the strongest wind: 14/8/2005 &6/5/2006)Average annual rainfall: 351mm.Outdoor fire work forbidden period: April 5th-15th June
15th Sep.- Snow fall start
Erguna City
21
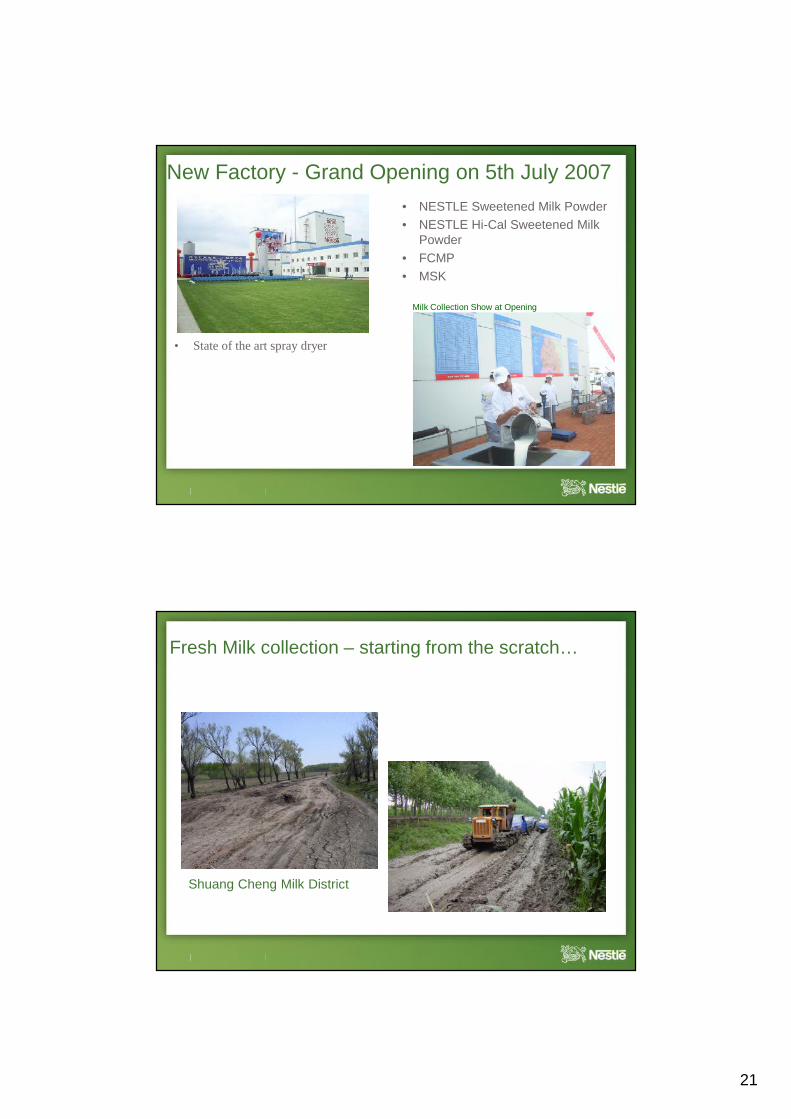
• State of the art spray dryer
• NESTLE Sweetened Milk Powder• NESTLE Hi-Cal Sweetened Milk
Powder• FCMP• MSK
New Factory - Grand Opening on 5th July 2007
Milk Collection Show at Opening
Fresh Milk collection – starting from the scratch…
Shuang Cheng Milk District
22
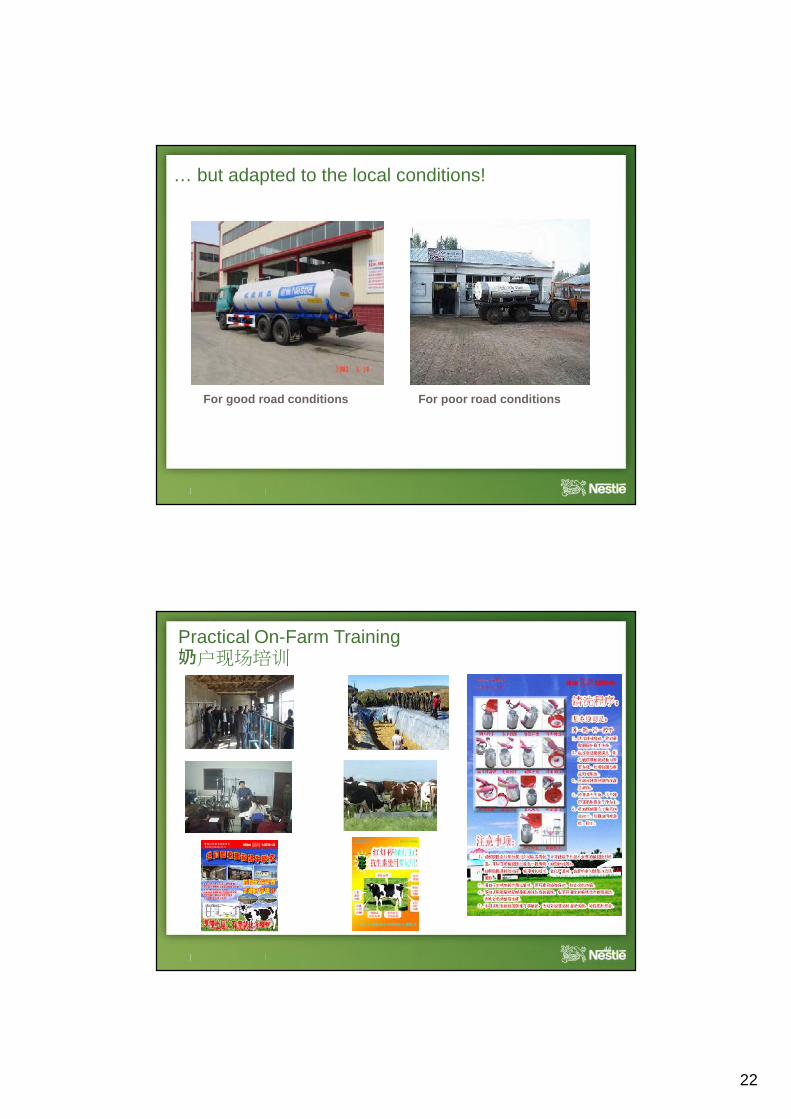
… but adapted to the local conditions!
For good road conditions For poor road conditions
44
Practical On-Farm Training奶户现场培训
23
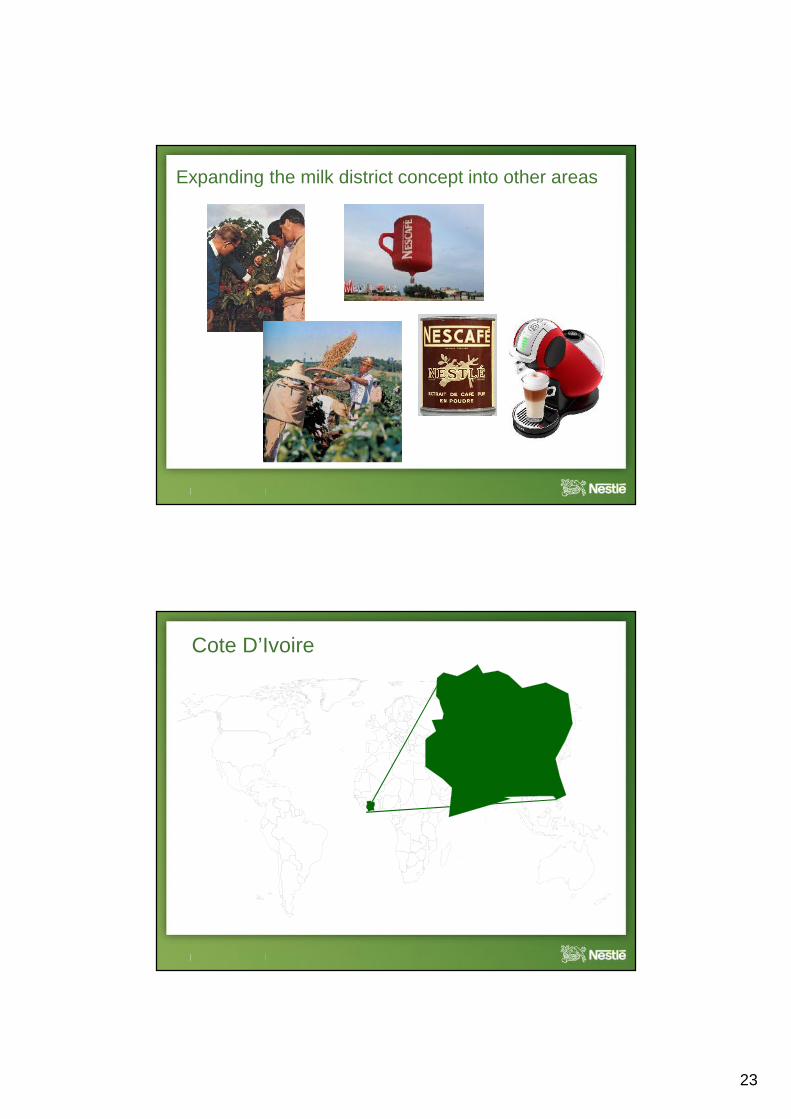
Expanding the milk district concept into other areas
Cote D’Ivoire
24
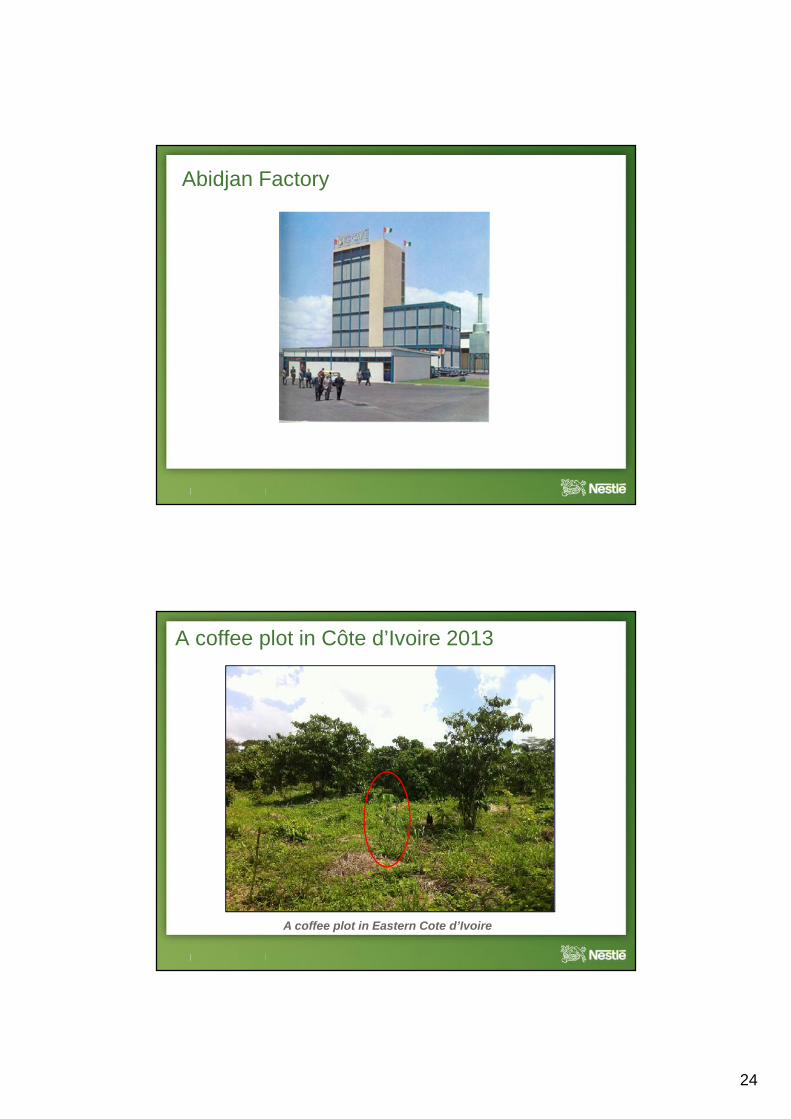
Abidjan Factory
A coffee plot in Côte d’Ivoire 2013
A coffee plot in Eastern Cote d’Ivoire
25
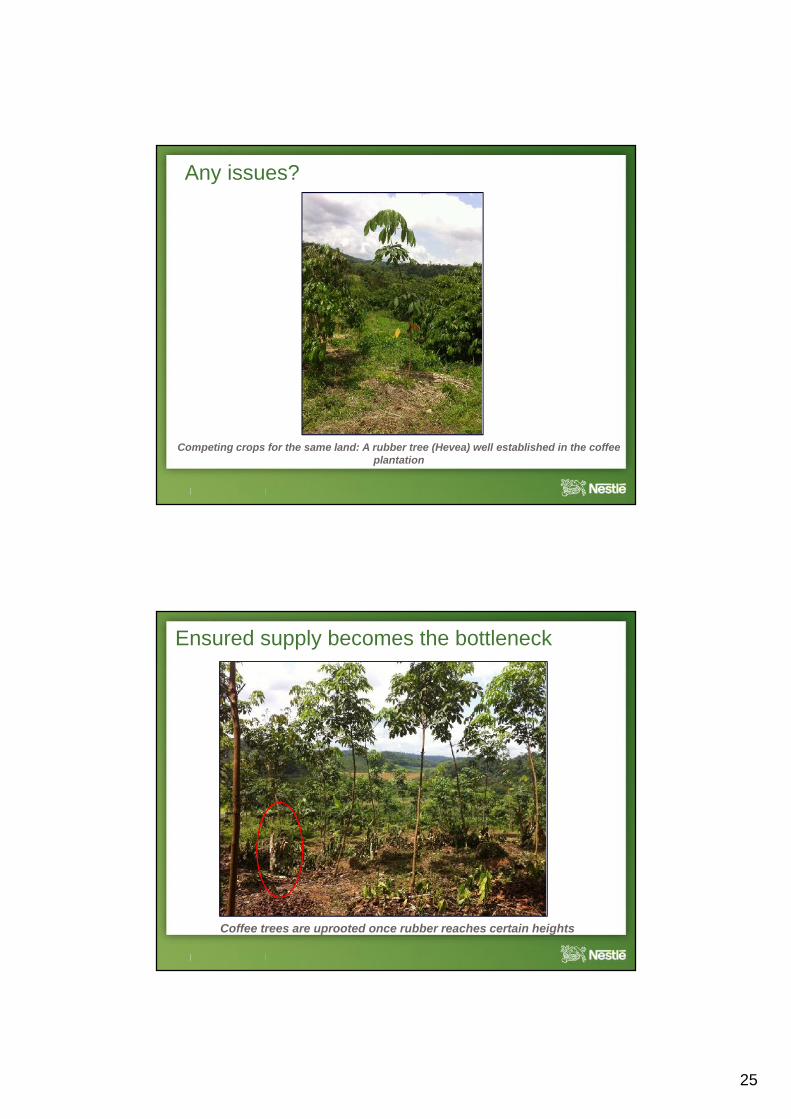
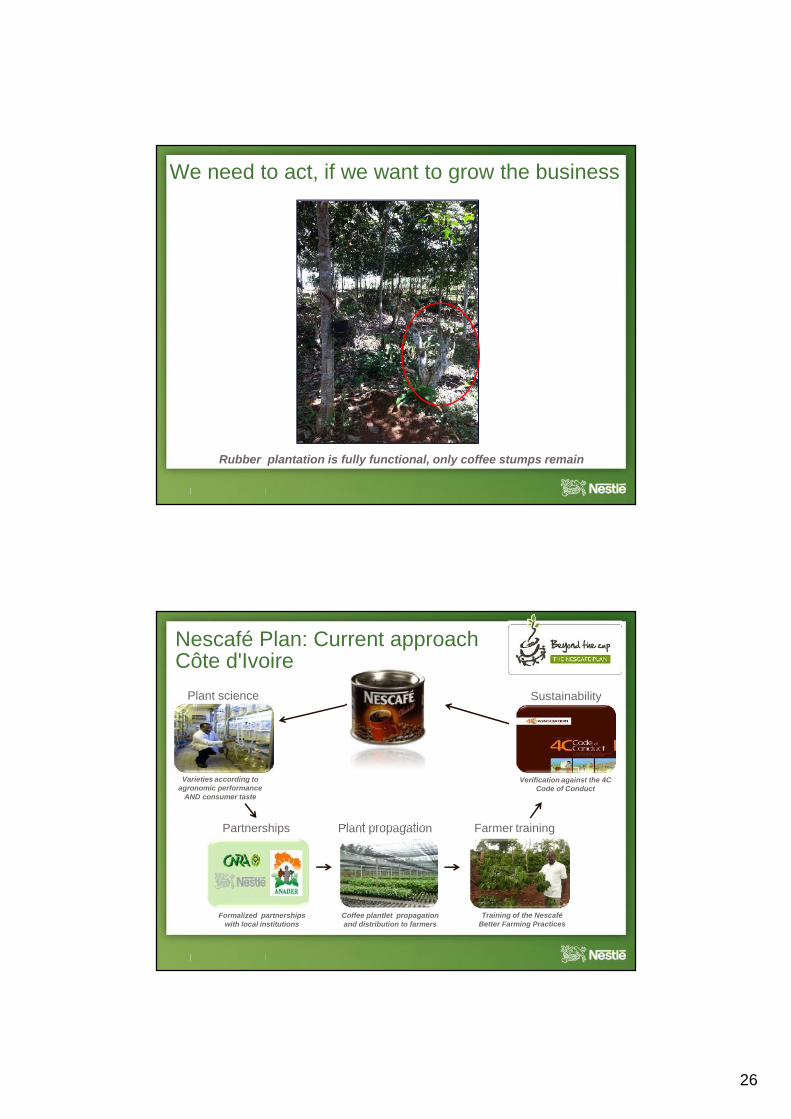
Competing crops for the same land: A rubber tree (Hevea) well established in the coffeeplantation
Any issues?
Ensured supply becomes the bottleneck
Coffee trees are uprooted once rubber reaches certain heights
26
We need to act, if we want to grow the business
Rubber plantation is fully functional, only coffee stumps remain
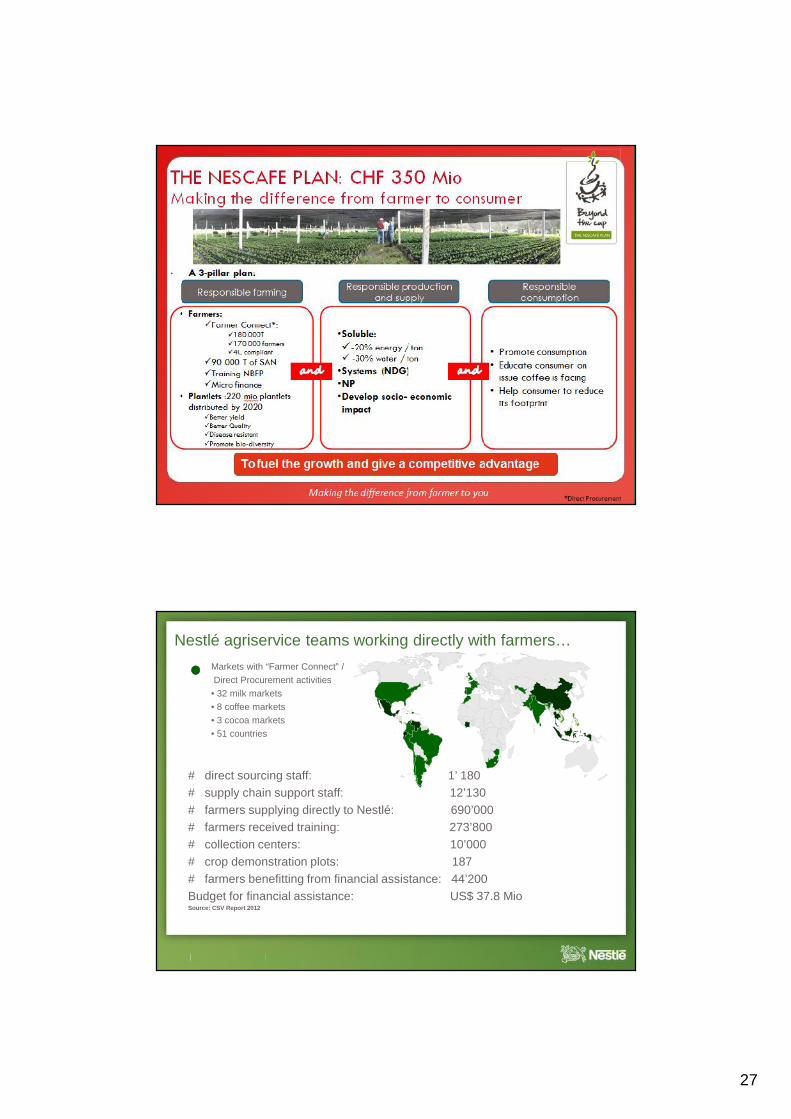
Nescafé Plan: Current approachCôte d'Ivoire
Sustainability
Verification against the 4CCode of Conduct
Plant science
Varieties according toagronomic performance
AND consumer taste
Formalized partnershipswith local institutions
Partnerships Plant propagation
Coffee plantlet propagationand distribution to farmers
Farmer training
Training of the NescaféBetter Farming Practices
27
Nestlé agriservice teams working directly with farmers…
# direct sourcing staff: 1’ 180# supply chain support staff: 12’130# farmers supplying directly to Nestlé: 690’000# farmers received training: 273’800# collection centers: 10’000# crop demonstration plots: 187# farmers benefitting from financial assistance: 44’200Budget for financial assistance: US$ 37.8 MioSource: CSV Report 2012
Markets with “Farmer Connect” /Direct Procurement activities• 32 milk markets• 8 coffee markets• 3 cocoa markets• 51 countries
28
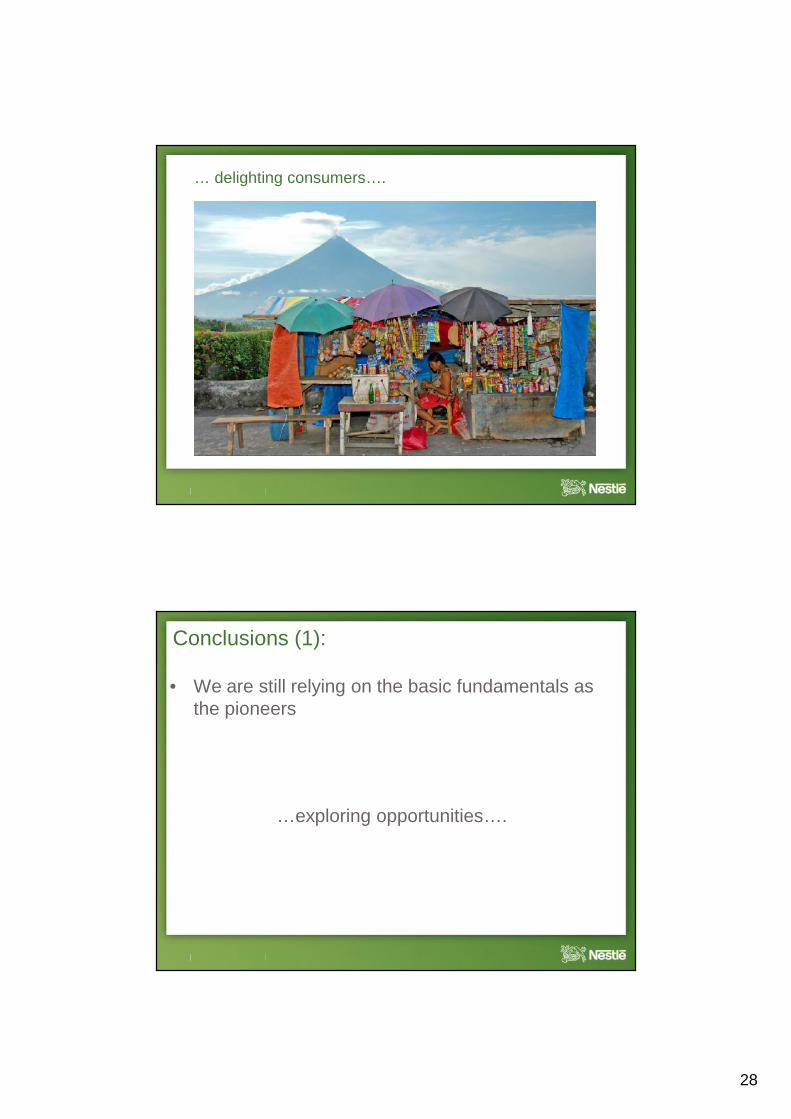
… delighting consumers….
Conclusions (1):
• We are still relying on the basic fundamentals asthe pioneers
…exploring opportunities….
29
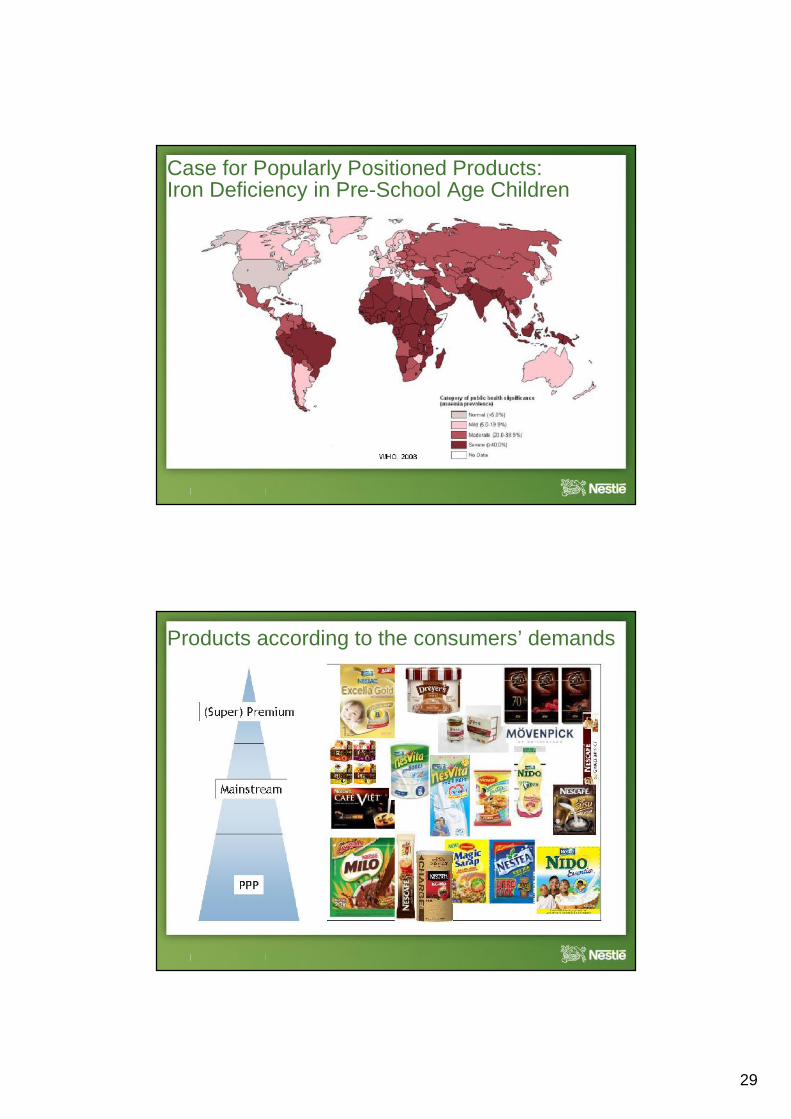
Case for Popularly Positioned Products:Iron Deficiency in Pre-School Age Children
Products according to the consumers’ demands
30
Conclusions (2):
• The pioneers were facing the same problems aswe are facing (quality, safety, loyalty, volumegrowth, etc.)
• Maybe things got a bit more complex… e.g.analytical tools going into ppb (= parts per billion!),
• On the other side complexity was always there…
…I guess we were just able to adapt fast to newrealities without loosing our basic values…
… and we need to go on…
Thank you!