the national down syndrome cytogenetic register · 0 the national down syndrome cytogenetic...
TRANSCRIPT
0
The National Down Syndrome Cytogenetic Register
for England and Wales:
2012 Annual Report
Joan K Morris
Anna Springett
January 2014
National Down Syndrome Cytogenetic Register
Queen Mary University of London
Barts and The London School of Medicine and Dentistry
Wolfson Institute of Preventive Medicine
Charterhouse Square
London
EC1M 6BQ
Phone: +44 (0) 20 7882 6274 / 6220 Fax: +44 (0) 20 7882 6221 Email: [email protected] Website: www.wolfson.qmul.ac.uk/ndscr
1
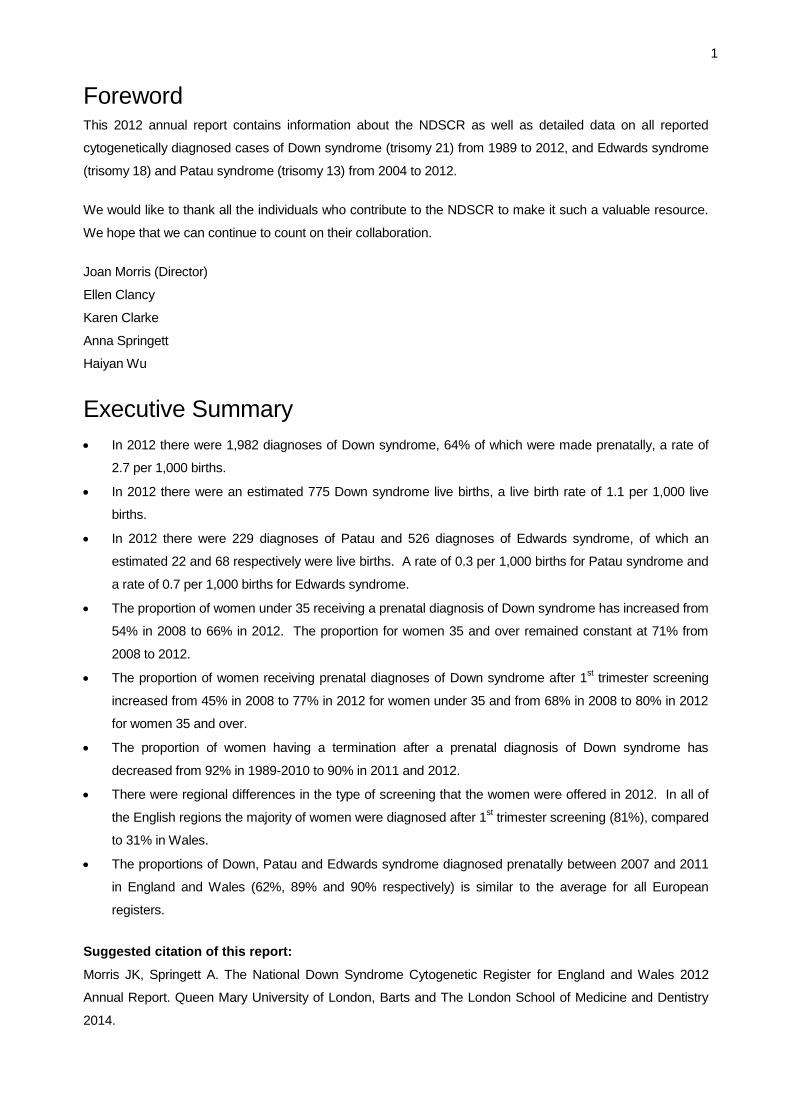
Foreword This 2012 annual report contains information about the NDSCR as well as detailed data on all reported
cytogenetically diagnosed cases of Down syndrome (trisomy 21) from 1989 to 2012, and Edwards syndrome
(trisomy 18) and Patau syndrome (trisomy 13) from 2004 to 2012.
We would like to thank all the individuals who contribute to the NDSCR to make it such a valuable resource.
We hope that we can continue to count on their collaboration.
Joan Morris (Director)
Ellen Clancy
Karen Clarke
Anna Springett
Haiyan Wu
Executive Summary
In 2012 there were 1,982 diagnoses of Down syndrome, 64% of which were made prenatally, a rate of
2.7 per 1,000 births.
In 2012 there were an estimated 775 Down syndrome live births, a live birth rate of 1.1 per 1,000 live
births.
In 2012 there were 229 diagnoses of Patau and 526 diagnoses of Edwards syndrome, of which an
estimated 22 and 68 respectively were live births. A rate of 0.3 per 1,000 births for Patau syndrome and
a rate of 0.7 per 1,000 births for Edwards syndrome.
The proportion of women under 35 receiving a prenatal diagnosis of Down syndrome has increased from
54% in 2008 to 66% in 2012. The proportion for women 35 and over remained constant at 71% from
2008 to 2012.
The proportion of women receiving prenatal diagnoses of Down syndrome after 1st trimester screening
increased from 45% in 2008 to 77% in 2012 for women under 35 and from 68% in 2008 to 80% in 2012
for women 35 and over.
The proportion of women having a termination after a prenatal diagnosis of Down syndrome has
decreased from 92% in 1989-2010 to 90% in 2011 and 2012.
There were regional differences in the type of screening that the women were offered in 2012. In all of
the English regions the majority of women were diagnosed after 1st trimester screening (81%), compared
to 31% in Wales.
The proportions of Down, Patau and Edwards syndrome diagnosed prenatally between 2007 and 2011
in England and Wales (62%, 89% and 90% respectively) is similar to the average for all European
registers.
Suggested citation of this report:
Morris JK, Springett A. The National Down Syndrome Cytogenetic Register for England and Wales 2012
Annual Report. Queen Mary University of London, Barts and The London School of Medicine and Dentistry
2014.
2
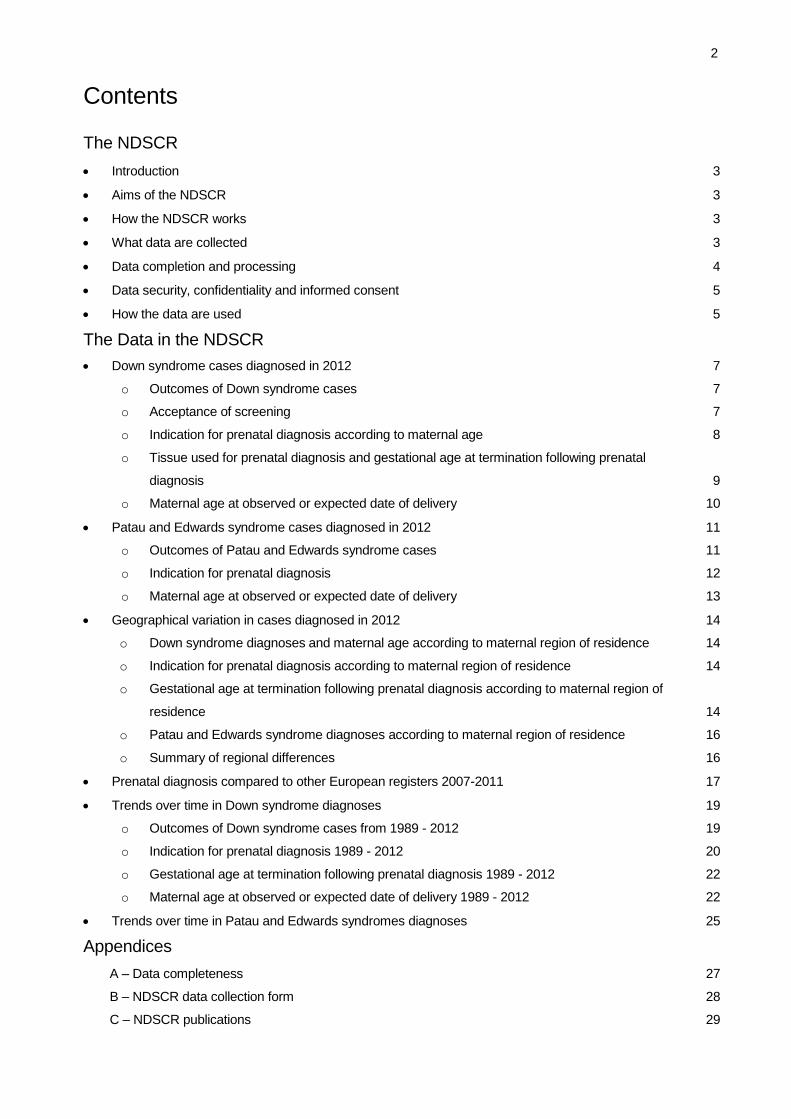
Contents
The NDSCR
Introduction 3
Aims of the NDSCR 3
How the NDSCR works 3
What data are collected 3
Data completion and processing 4
Data security, confidentiality and informed consent 5
How the data are used 5
The Data in the NDSCR
Down syndrome cases diagnosed in 2012 7
o Outcomes of Down syndrome cases 7
o Acceptance of screening 7
o Indication for prenatal diagnosis according to maternal age 8
o Tissue used for prenatal diagnosis and gestational age at termination following prenatal
diagnosis 9
o Maternal age at observed or expected date of delivery 10
Patau and Edwards syndrome cases diagnosed in 2012 11
o Outcomes of Patau and Edwards syndrome cases 11
o Indication for prenatal diagnosis 12
o Maternal age at observed or expected date of delivery 13
Geographical variation in cases diagnosed in 2012 14
o Down syndrome diagnoses and maternal age according to maternal region of residence 14
o Indication for prenatal diagnosis according to maternal region of residence 14
o Gestational age at termination following prenatal diagnosis according to maternal region of
residence 14
o Patau and Edwards syndrome diagnoses according to maternal region of residence 16
o Summary of regional differences 16
Prenatal diagnosis compared to other European registers 2007-2011 17
Trends over time in Down syndrome diagnoses 19
o Outcomes of Down syndrome cases from 1989 - 2012 19
o Indication for prenatal diagnosis 1989 - 2012 20
o Gestational age at termination following prenatal diagnosis 1989 - 2012 22
o Maternal age at observed or expected date of delivery 1989 - 2012 22
Trends over time in Patau and Edwards syndromes diagnoses 25
Appendices
A – Data completeness 27
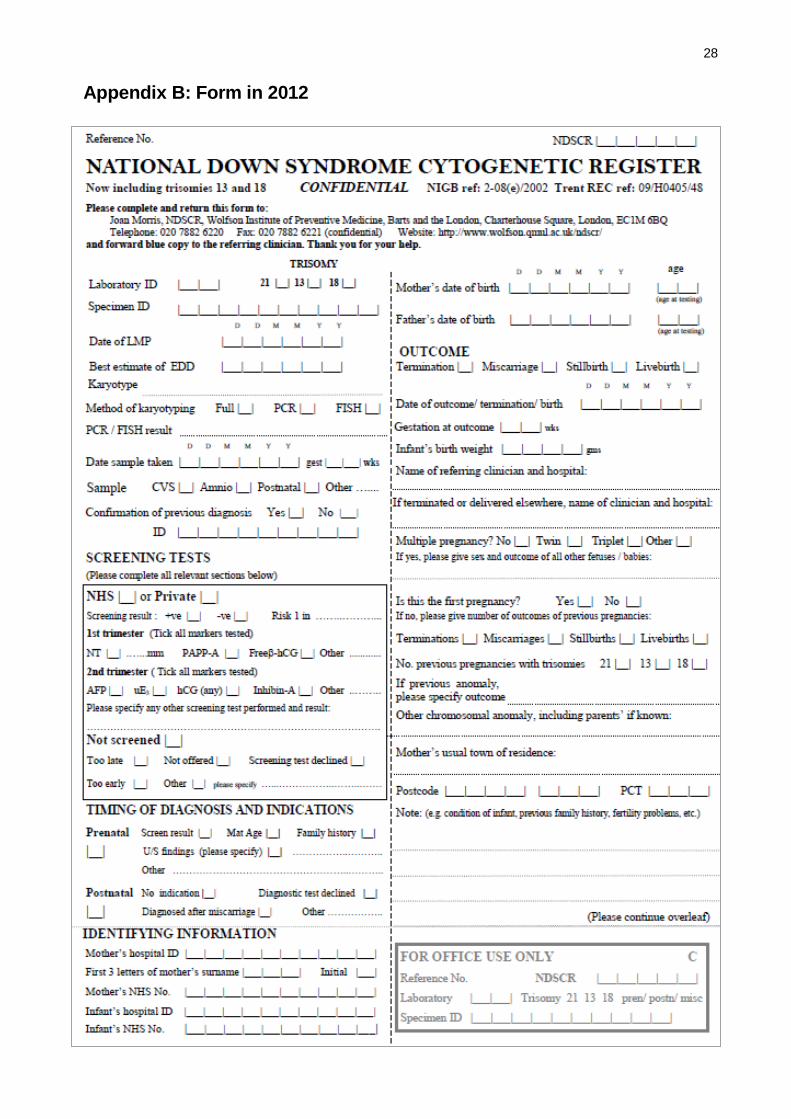
B – NDSCR data collection form 28
C – NDSCR publications 29
3
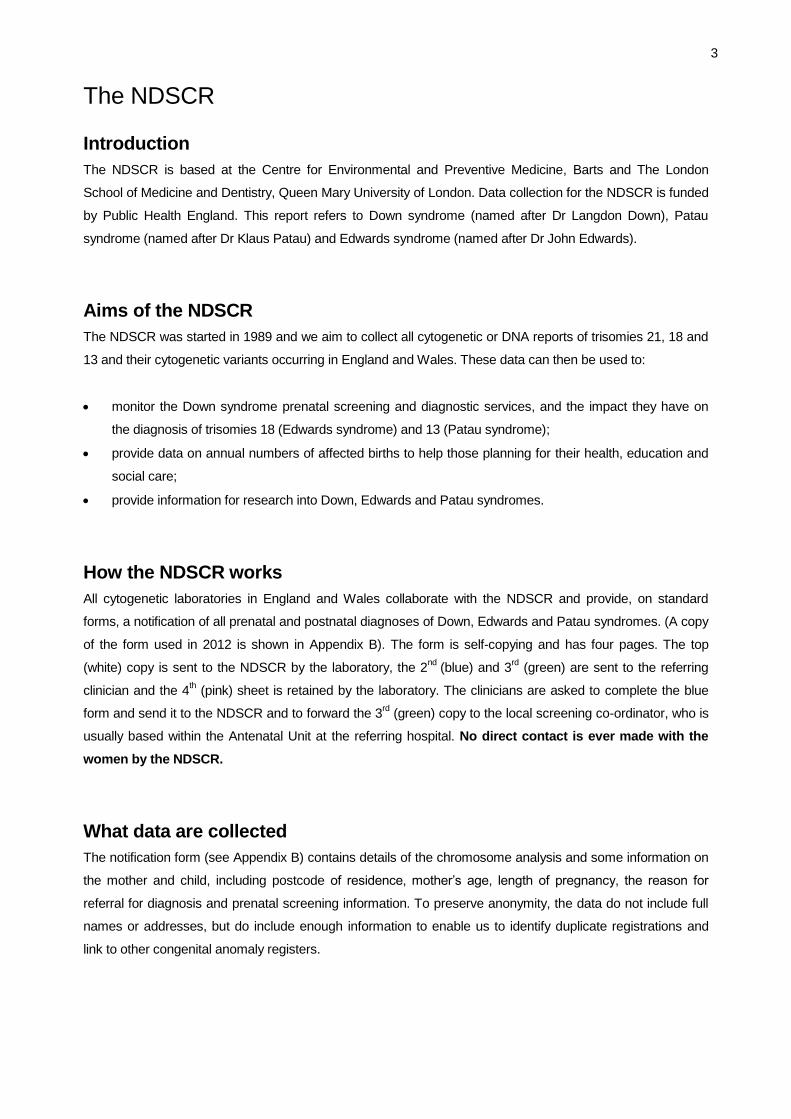
The NDSCR
Introduction
The NDSCR is based at the Centre for Environmental and Preventive Medicine, Barts and The London
School of Medicine and Dentistry, Queen Mary University of London. Data collection for the NDSCR is funded
by Public Health England. This report refers to Down syndrome (named after Dr Langdon Down), Patau
syndrome (named after Dr Klaus Patau) and Edwards syndrome (named after Dr John Edwards).
Aims of the NDSCR
The NDSCR was started in 1989 and we aim to collect all cytogenetic or DNA reports of trisomies 21, 18 and
13 and their cytogenetic variants occurring in England and Wales. These data can then be used to:
monitor the Down syndrome prenatal screening and diagnostic services, and the impact they have on
the diagnosis of trisomies 18 (Edwards syndrome) and 13 (Patau syndrome);
provide data on annual numbers of affected births to help those planning for their health, education and
social care;
provide information for research into Down, Edwards and Patau syndromes.
How the NDSCR works
All cytogenetic laboratories in England and Wales collaborate with the NDSCR and provide, on standard
forms, a notification of all prenatal and postnatal diagnoses of Down, Edwards and Patau syndromes. (A copy
of the form used in 2012 is shown in Appendix B). The form is self-copying and has four pages. The top
(white) copy is sent to the NDSCR by the laboratory, the 2nd
(blue) and 3rd (green) are sent to the referring
clinician and the 4th (pink) sheet is retained by the laboratory. The clinicians are asked to complete the blue
form and send it to the NDSCR and to forward the 3rd (green) copy to the local screening co-ordinator, who is
usually based within the Antenatal Unit at the referring hospital. No direct contact is ever made with the
women by the NDSCR.
What data are collected
The notification form (see Appendix B) contains details of the chromosome analysis and some information on
the mother and child, including postcode of residence, mother’s age, length of pregnancy, the reason for
referral for diagnosis and prenatal screening information. To preserve anonymity, the data do not include full
names or addresses, but do include enough information to enable us to identify duplicate registrations and
link to other congenital anomaly registers.
4
Data completion and processing
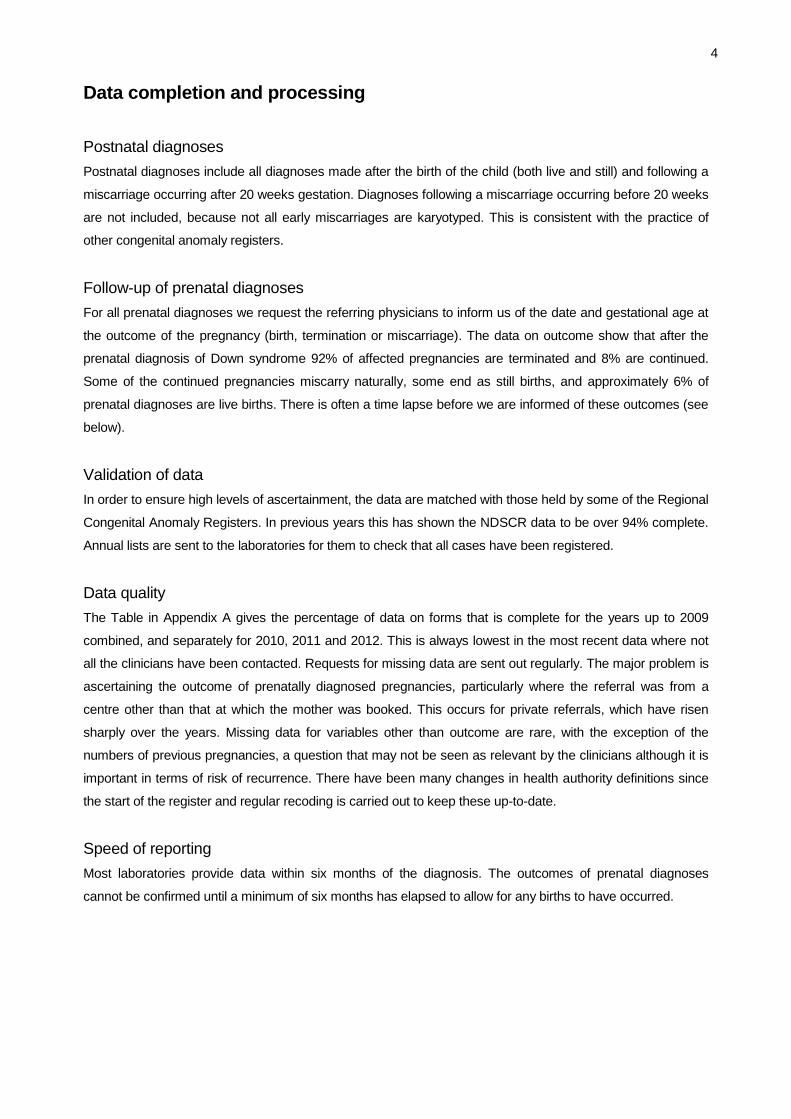
Postnatal diagnoses
Postnatal diagnoses include all diagnoses made after the birth of the child (both live and still) and following a
miscarriage occurring after 20 weeks gestation. Diagnoses following a miscarriage occurring before 20 weeks
are not included, because not all early miscarriages are karyotyped. This is consistent with the practice of
other congenital anomaly registers.
Follow-up of prenatal diagnoses
For all prenatal diagnoses we request the referring physicians to inform us of the date and gestational age at
the outcome of the pregnancy (birth, termination or miscarriage). The data on outcome show that after the
prenatal diagnosis of Down syndrome 92% of affected pregnancies are terminated and 8% are continued.
Some of the continued pregnancies miscarry naturally, some end as still births, and approximately 6% of
prenatal diagnoses are live births. There is often a time lapse before we are informed of these outcomes (see
below).
Validation of data
In order to ensure high levels of ascertainment, the data are matched with those held by some of the Regional
Congenital Anomaly Registers. In previous years this has shown the NDSCR data to be over 94% complete.
Annual lists are sent to the laboratories for them to check that all cases have been registered.
Data quality
The Table in Appendix A gives the percentage of data on forms that is complete for the years up to 2009
combined, and separately for 2010, 2011 and 2012. This is always lowest in the most recent data where not
all the clinicians have been contacted. Requests for missing data are sent out regularly. The major problem is
ascertaining the outcome of prenatally diagnosed pregnancies, particularly where the referral was from a
centre other than that at which the mother was booked. This occurs for private referrals, which have risen
sharply over the years. Missing data for variables other than outcome are rare, with the exception of the
numbers of previous pregnancies, a question that may not be seen as relevant by the clinicians although it is
important in terms of risk of recurrence. There have been many changes in health authority definitions since
the start of the register and regular recoding is carried out to keep these up-to-date.
Speed of reporting
Most laboratories provide data within six months of the diagnosis. The outcomes of prenatal diagnoses
cannot be confirmed until a minimum of six months has elapsed to allow for any births to have occurred.
5
Data security, confidentiality and informed consent
Personal information held on a computer system is safeguarded by the Data Protection Act 1998 and the
NDSCR is registered under this Act. Paper forms are kept in locked filing cabinets and electronic data are
entered onto password-protected computers kept in locked offices. The full data are accessible only to the
research team. The Government has made it clear that informed consent is a fundamental principle governing
the use of patient identifiable information. However it also recognises that situations arise where informed
consent cannot practicably be obtained. Section 251 of the NHS Act 2006 (originally enacted under Section
60 of the Health and Social Care Act 2001) provides a power to ensure that patient identifiable information
needed to support essential NHS activity can be used without the consent of patients. The Act requires that
the Confientiality Advisory Group (CAG) consider applications to use patient identifiable information without
full informed consent. Since 2003, the NDSCR as a part of the British Isles Network of Congenital Anomaly
Registers (BINOCAR) has been given permission to operate without informed consent (2-08(e)/2002). In
2006 the application of the NDSCR for ethics approval from the Trent multi-centre research ethics committee
(MREC), as part of BINOCAR, was also approved (09/H0405/48). In 2011 this approval was renewed.
In line with the Code of Practice for Official Statistics, all statistics in this report have been risk assessed for
disclosure-control to protect confidentiality. The BINOCAR Management Committee have agreed that in data
for the whole population no suppression of small numbers is required.
How the data are used
Audit of Down Syndrome Screening
The NDSCR is the only national source of the numbers of pre- and postnatal diagnoses of Down, Patau
and Edwards syndrome cases in England and Wales. The National Congenital Anomaly System (NCAS)
which previously also estimated these numbers no longer collects this data.
Annual reports are produced describing numbers of prenatal and postnatal diagnoses, and the methods
of prenatal screening which led to prenatal diagnoses.
More detailed information is regularly published in medical journals (see appendix C).
All local screening co-ordinators should receive the green copy of the NDSCR form to assist them in their
audit requirements.
Data on prenatal diagnosis of Down, Patau and Edwards syndrome are provided to EUROCAT for use in
their interactive website tables (www.eurocat-network.eu/prenatalscreeninganddiagnosis/prenatal
detection(pd)rates).
Feedback
NDSCR leaflets giving information on the trends in Down syndrome diagnosis are produced annually
and distributed to cytogenetic laboratories, local screening co-ordinators and clinicians.
The NDSCR website (www.wolfson.qmul.ac.uk/ndscr) is regularly updated.
Information is provided on request to medical professionals, researchers, journalists, charities and other
interested parties.
6
NDSCR leaflets are provided to the Down Syndrome Association and to SOFT (Support Organisation for
trisomy 13/18 and related disorders).
Recent collaborative studies
Children with Down’s Syndrome Study (St James' University Hospital in Leeds and the Epidemiology &
Genetics Unit at the University of York).
The treatment received and the outcomes for babies with Down syndrome compared with babies without
Down syndrome who are admitted to a neonatal unit; a case-control study analysing data from the
National Neonatal Research Database.
The treatment received and the outcomes for babies with Patau and Edwards syndrome who are
admitted to a neonatal unit: Analysing data from the National Neonatal Research Database.
Data on all amniocentesis and chorionic villus sampling procedures on all women in England and Wales
will be obtained annually from 2012 onwards from cytogenetic laboratories in England and Wales in
order to investigate how many women are having these invasive diagnostic tests and the reasons why.
Publications
A list of selected publications based on or using NDSCR data is provided in Appendix C.
Copies of this report and previous NDSCR reports can be found on the NDSCR website
(www.wolfson.qmul.ac.uk/ndscr).
There is a chapter using the data from the NDSCR within the BINOCAR annual report which can be
found on the BINOCAR website (www.binocar.org/publications/reports).
Data from the NDSCR are included in some interactive graphs and tables on prenatal diagnosis of
selected congenital anomalies (including Down, Edwards and Patau syndrome) on the EUROCAT
website (www.eurocat-network.eu/prenatalscreeninganddiagnosis/prenataldetection(pd)rates).
7
The Data in the NDSCR
Down syndrome cases diagnosed in 2012
Outcomes of Down syndrome cases
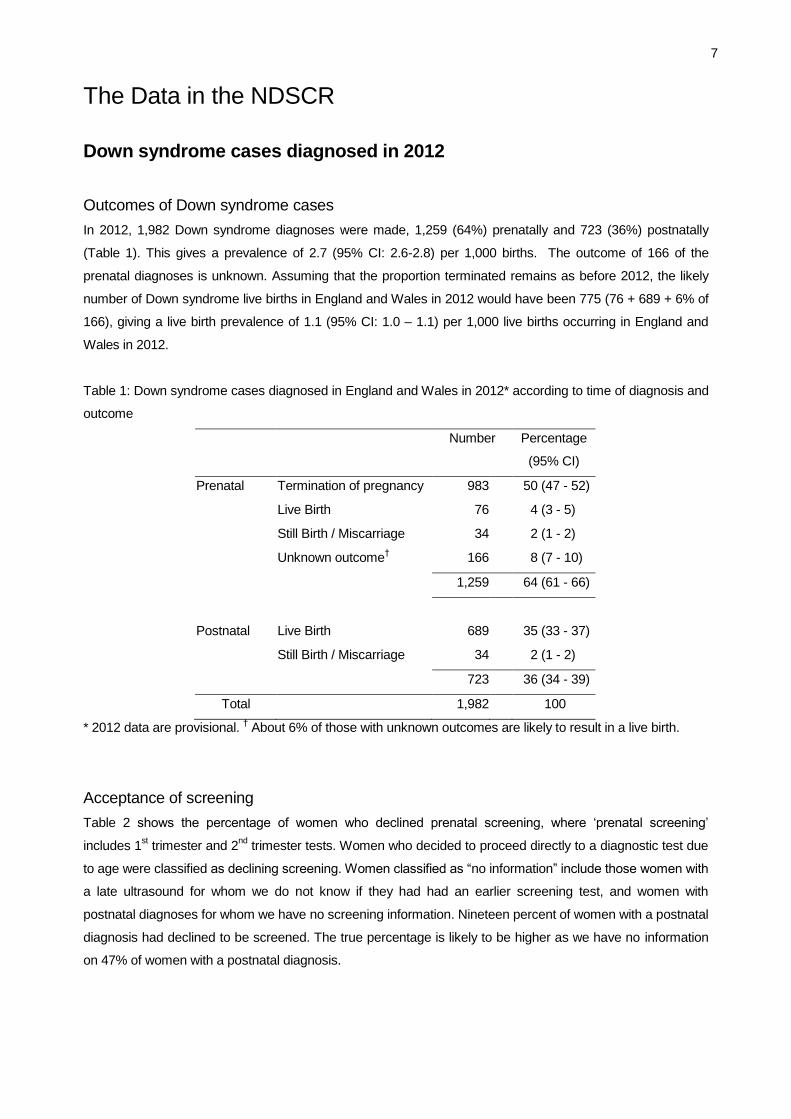
In 2012, 1,982 Down syndrome diagnoses were made, 1,259 (64%) prenatally and 723 (36%) postnatally
(Table 1). This gives a prevalence of 2.7 (95% CI: 2.6-2.8) per 1,000 births. The outcome of 166 of the
prenatal diagnoses is unknown. Assuming that the proportion terminated remains as before 2012, the likely
number of Down syndrome live births in England and Wales in 2012 would have been 775 (76 + 689 + 6% of
166), giving a live birth prevalence of 1.1 (95% CI: 1.0 – 1.1) per 1,000 live births occurring in England and
Wales in 2012.
Table 1: Down syndrome cases diagnosed in England and Wales in 2012* according to time of diagnosis and
outcome
Number Percentage
(95% CI)
Prenatal Termination of pregnancy 983 50 (47 - 52)
Live Birth 76 4 (3 - 5)
Still Birth / Miscarriage 34 2 (1 - 2)
Unknown outcome† 166 8 (7 - 10)
1,259 64 (61 - 66)
Postnatal Live Birth 689 35 (33 - 37)
Still Birth / Miscarriage 34 2 (1 - 2)
723 36 (34 - 39)
Total 1,982 100
* 2012 data are provisional. † About 6% of those with unknown outcomes are likely to result in a live birth.
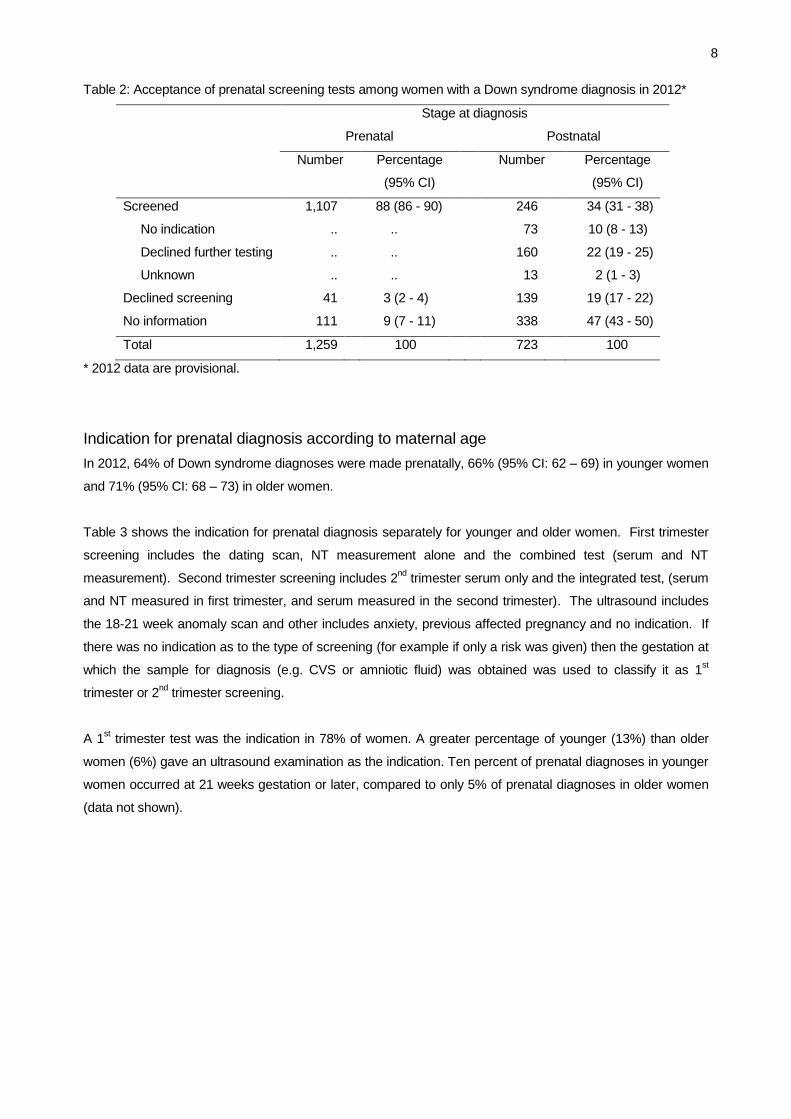
Acceptance of screening
Table 2 shows the percentage of women who declined prenatal screening, where ‘prenatal screening’
includes 1st trimester and 2
nd trimester tests. Women who decided to proceed directly to a diagnostic test due
to age were classified as declining screening. Women classified as “no information” include those women with
a late ultrasound for whom we do not know if they had had an earlier screening test, and women with
postnatal diagnoses for whom we have no screening information. Nineteen percent of women with a postnatal
diagnosis had declined to be screened. The true percentage is likely to be higher as we have no information
on 47% of women with a postnatal diagnosis.
8
Table 2: Acceptance of prenatal screening tests among women with a Down syndrome diagnosis in 2012*
Stage at diagnosis
Prenatal Postnatal
Number Percentage
(95% CI)
Number Percentage
(95% CI)
Screened 1,107 88 (86 - 90) 246 34 (31 - 38)
No indication .. .. 73 10 (8 - 13)
Declined further testing .. .. 160 22 (19 - 25)
Unknown .. .. 13 2 (1 - 3)
Declined screening 41 3 (2 - 4) 139 19 (17 - 22)
No information 111 9 (7 - 11) 338 47 (43 - 50)
Total 1,259 100 723 100
* 2012 data are provisional.
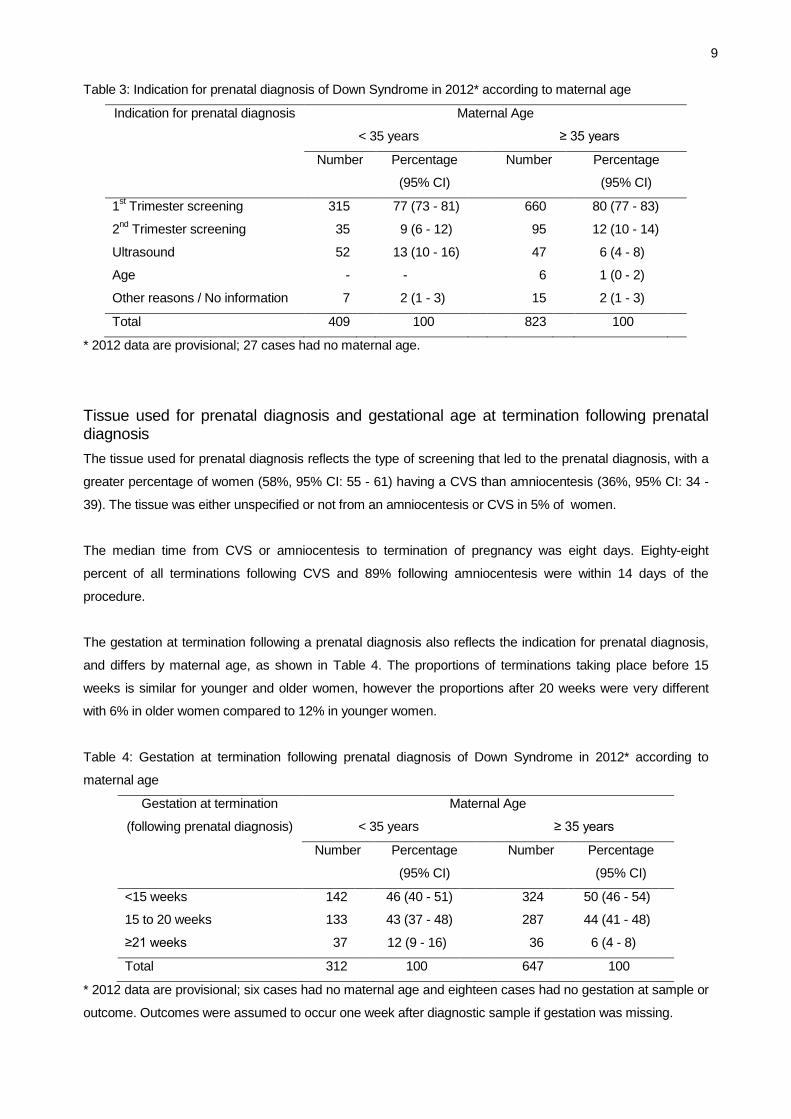
Indication for prenatal diagnosis according to maternal age
In 2012, 64% of Down syndrome diagnoses were made prenatally, 66% (95% CI: 62 – 69) in younger women
and 71% (95% CI: 68 – 73) in older women.
Table 3 shows the indication for prenatal diagnosis separately for younger and older women. First trimester
screening includes the dating scan, NT measurement alone and the combined test (serum and NT
measurement). Second trimester screening includes 2nd
trimester serum only and the integrated test, (serum
and NT measured in first trimester, and serum measured in the second trimester). The ultrasound includes
the 18-21 week anomaly scan and other includes anxiety, previous affected pregnancy and no indication. If
there was no indication as to the type of screening (for example if only a risk was given) then the gestation at
which the sample for diagnosis (e.g. CVS or amniotic fluid) was obtained was used to classify it as 1st
trimester or 2nd
trimester screening.
A 1st trimester test was the indication in 78% of women. A greater percentage of younger (13%) than older
women (6%) gave an ultrasound examination as the indication. Ten percent of prenatal diagnoses in younger
women occurred at 21 weeks gestation or later, compared to only 5% of prenatal diagnoses in older women
(data not shown).
9
Table 3: Indication for prenatal diagnosis of Down Syndrome in 2012* according to maternal age
Indication for prenatal diagnosis Maternal Age
< 35 years ≥ 35 years
Number Percentage
(95% CI)
Number Percentage
(95% CI)
1st Trimester screening 315 77 (73 - 81) 660 80 (77 - 83)
2nd
Trimester screening 35 9 (6 - 12) 95 12 (10 - 14)
Ultrasound 52 13 (10 - 16) 47 6 (4 - 8)
Age - - 6 1 (0 - 2)
Other reasons / No information 7 2 (1 - 3) 15 2 (1 - 3)
Total 409 100 823 100
* 2012 data are provisional; 27 cases had no maternal age.
Tissue used for prenatal diagnosis and gestational age at termination following prenatal diagnosis
The tissue used for prenatal diagnosis reflects the type of screening that led to the prenatal diagnosis, with a
greater percentage of women (58%, 95% CI: 55 - 61) having a CVS than amniocentesis (36%, 95% CI: 34 -
39). The tissue was either unspecified or not from an amniocentesis or CVS in 5% of women.
The median time from CVS or amniocentesis to termination of pregnancy was eight days. Eighty-eight
percent of all terminations following CVS and 89% following amniocentesis were within 14 days of the
procedure.
The gestation at termination following a prenatal diagnosis also reflects the indication for prenatal diagnosis,
and differs by maternal age, as shown in Table 4. The proportions of terminations taking place before 15
weeks is similar for younger and older women, however the proportions after 20 weeks were very different
with 6% in older women compared to 12% in younger women.
Table 4: Gestation at termination following prenatal diagnosis of Down Syndrome in 2012* according to
maternal age
Gestation at termination
(following prenatal diagnosis)
Maternal Age
< 35 years ≥ 35 years
Number Percentage
(95% CI)
Number Percentage
(95% CI)
<15 weeks 142 46 (40 - 51) 324 50 (46 - 54)
15 to 20 weeks 133 43 (37 - 48) 287 44 (41 - 48)
≥21 weeks 37 12 (9 - 16) 36 6 (4 - 8)
Total 312 100 647 100
* 2012 data are provisional; six cases had no maternal age and eighteen cases had no gestation at sample or
outcome. Outcomes were assumed to occur one week after diagnostic sample if gestation was missing.
10
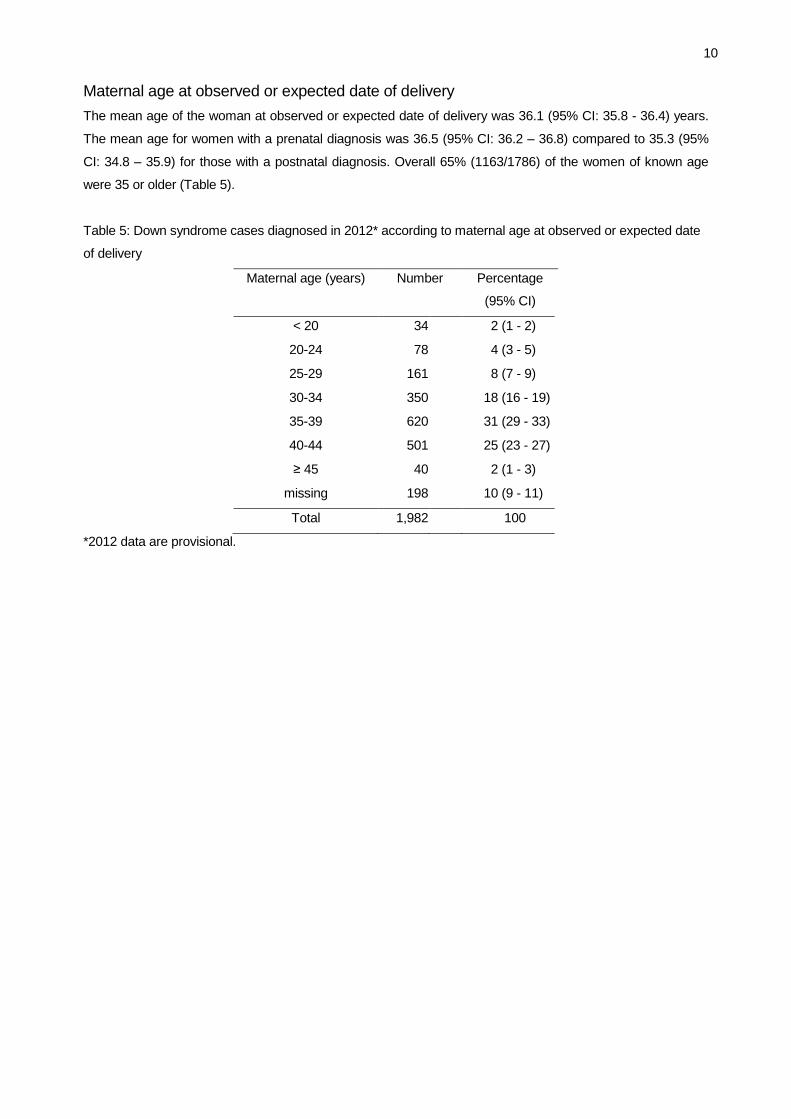
Maternal age at observed or expected date of delivery
The mean age of the woman at observed or expected date of delivery was 36.1 (95% CI: 35.8 - 36.4) years.
The mean age for women with a prenatal diagnosis was 36.5 (95% CI: 36.2 – 36.8) compared to 35.3 (95%
CI: 34.8 – 35.9) for those with a postnatal diagnosis. Overall 65% (1163/1786) of the women of known age
were 35 or older (Table 5).
Table 5: Down syndrome cases diagnosed in 2012* according to maternal age at observed or expected date
of delivery
Maternal age (years) Number Percentage
(95% CI)
< 20 34 2 (1 - 2)
20-24 78 4 (3 - 5)
25-29 161 8 (7 - 9)
30-34 350 18 (16 - 19)
35-39 620 31 (29 - 33)
40-44 501 25 (23 - 27)
≥ 45 40 2 (1 - 3)
missing 198 10 (9 - 11)
Total 1,982 100
*2012 data are provisional.
11
Patau and Edwards syndrome cases diagnosed in 2012
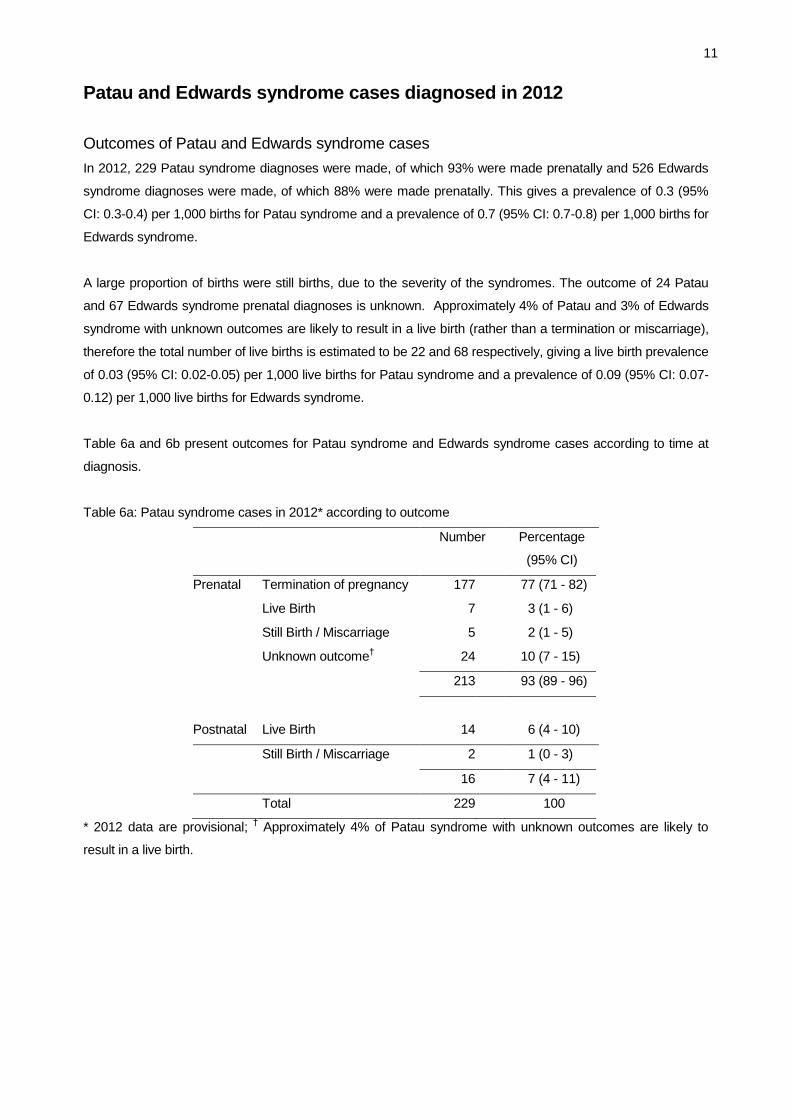
Outcomes of Patau and Edwards syndrome cases
In 2012, 229 Patau syndrome diagnoses were made, of which 93% were made prenatally and 526 Edwards
syndrome diagnoses were made, of which 88% were made prenatally. This gives a prevalence of 0.3 (95%
CI: 0.3-0.4) per 1,000 births for Patau syndrome and a prevalence of 0.7 (95% CI: 0.7-0.8) per 1,000 births for
Edwards syndrome.
A large proportion of births were still births, due to the severity of the syndromes. The outcome of 24 Patau
and 67 Edwards syndrome prenatal diagnoses is unknown. Approximately 4% of Patau and 3% of Edwards
syndrome with unknown outcomes are likely to result in a live birth (rather than a termination or miscarriage),
therefore the total number of live births is estimated to be 22 and 68 respectively, giving a live birth prevalence
of 0.03 (95% CI: 0.02-0.05) per 1,000 live births for Patau syndrome and a prevalence of 0.09 (95% CI: 0.07-
0.12) per 1,000 live births for Edwards syndrome.
Table 6a and 6b present outcomes for Patau syndrome and Edwards syndrome cases according to time at
diagnosis.
Table 6a: Patau syndrome cases in 2012* according to outcome
Number Percentage
(95% CI)
Prenatal Termination of pregnancy 177 77 (71 - 82)
Live Birth 7 3 (1 - 6)
Still Birth / Miscarriage 5 2 (1 - 5)
Unknown outcome† 24 10 (7 - 15)
213 93 (89 - 96)
Postnatal Live Birth 14 6 (4 - 10)
Still Birth / Miscarriage 2 1 (0 - 3)
16 7 (4 - 11)
Total 229 100
* 2012 data are provisional; † Approximately 4% of Patau syndrome with unknown outcomes are likely to
result in a live birth.
12
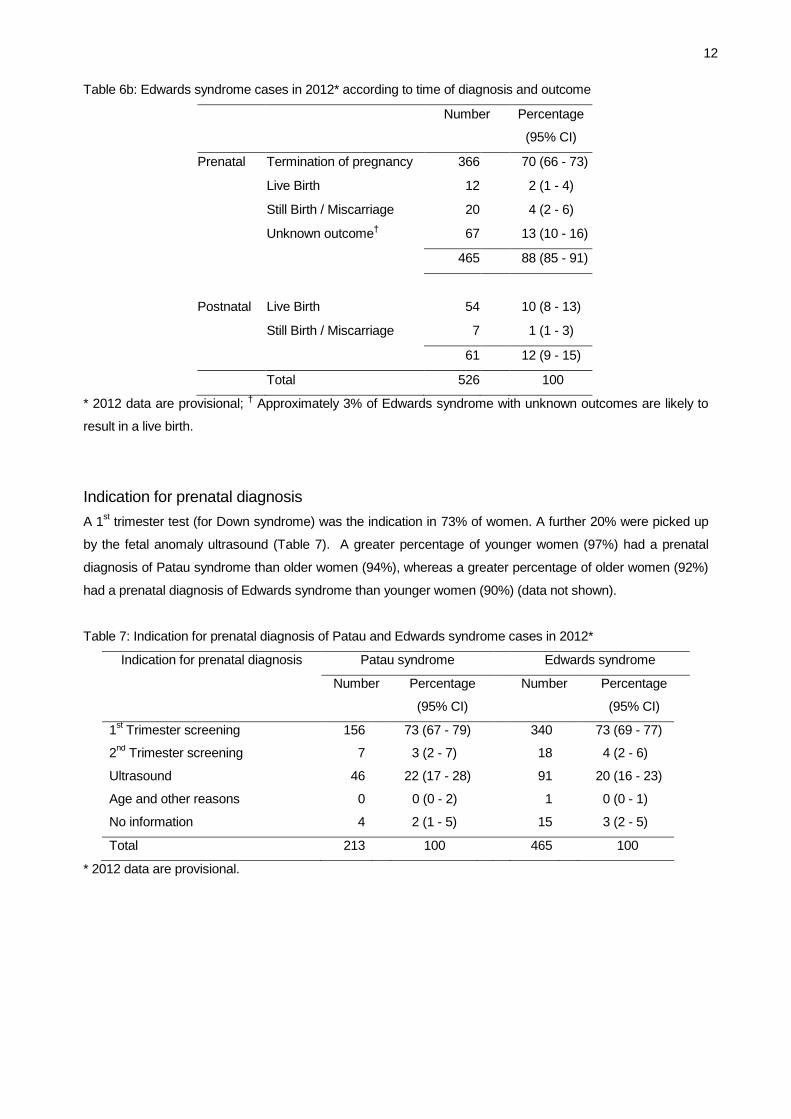
Table 6b: Edwards syndrome cases in 2012* according to time of diagnosis and outcome
Number Percentage
(95% CI)
Prenatal Termination of pregnancy 366 70 (66 - 73)
Live Birth 12 2 (1 - 4)
Still Birth / Miscarriage 20 4 (2 - 6)
Unknown outcome† 67 13 (10 - 16)
465 88 (85 - 91)
Postnatal Live Birth 54 10 (8 - 13)
Still Birth / Miscarriage 7 1 (1 - 3)
61 12 (9 - 15)
Total 526 100
* 2012 data are provisional; † Approximately 3% of Edwards syndrome with unknown outcomes are likely to
result in a live birth.
Indication for prenatal diagnosis
A 1st trimester test (for Down syndrome) was the indication in 73% of women. A further 20% were picked up
by the fetal anomaly ultrasound (Table 7). A greater percentage of younger women (97%) had a prenatal
diagnosis of Patau syndrome than older women (94%), whereas a greater percentage of older women (92%)
had a prenatal diagnosis of Edwards syndrome than younger women (90%) (data not shown).
Table 7: Indication for prenatal diagnosis of Patau and Edwards syndrome cases in 2012*
Indication for prenatal diagnosis Patau syndrome Edwards syndrome
Number Percentage
(95% CI)
Number Percentage
(95% CI)
1st Trimester screening 156 73 (67 - 79) 340 73 (69 - 77)
2nd
Trimester screening 7 3 (2 - 7) 18 4 (2 - 6)
Ultrasound 46 22 (17 - 28) 91 20 (16 - 23)
Age and other reasons 0 0 (0 - 2) 1 0 (0 - 1)
No information 4 2 (1 - 5) 15 3 (2 - 5)
Total 213 100 465 100
* 2012 data are provisional.
13
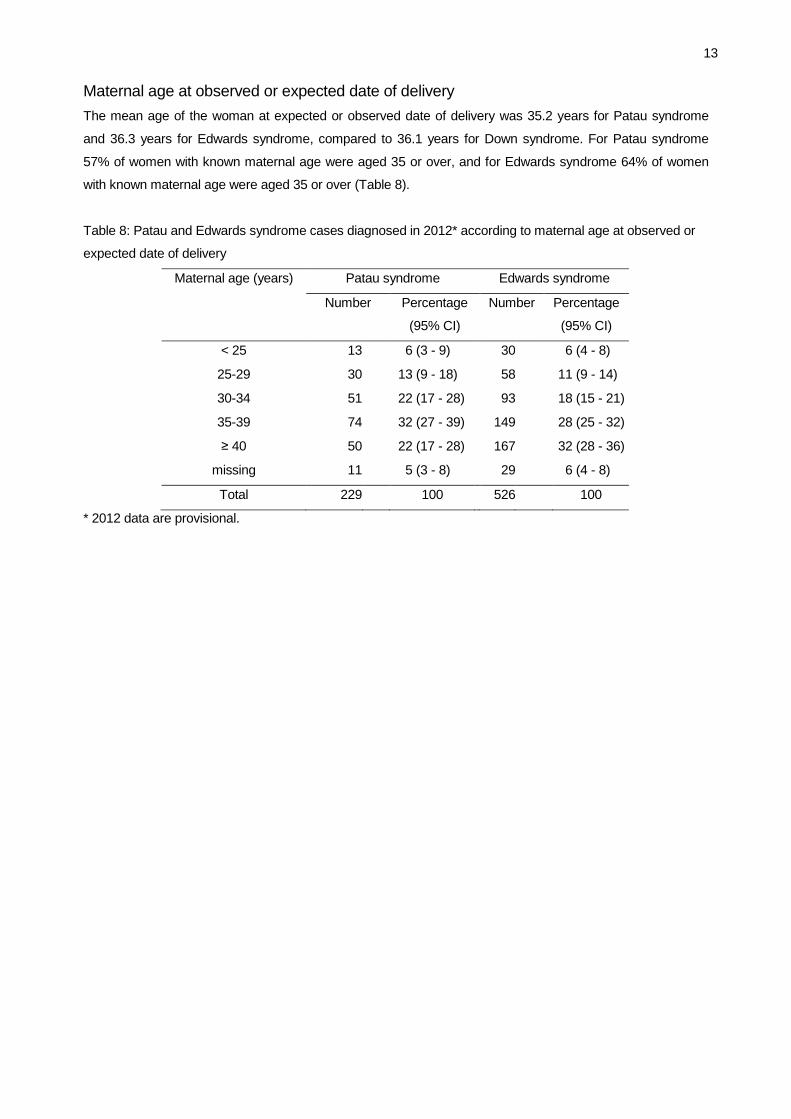
Maternal age at observed or expected date of delivery
The mean age of the woman at expected or observed date of delivery was 35.2 years for Patau syndrome
and 36.3 years for Edwards syndrome, compared to 36.1 years for Down syndrome. For Patau syndrome
57% of women with known maternal age were aged 35 or over, and for Edwards syndrome 64% of women
with known maternal age were aged 35 or over (Table 8).
Table 8: Patau and Edwards syndrome cases diagnosed in 2012* according to maternal age at observed or
expected date of delivery
Maternal age (years) Patau syndrome Edwards syndrome
Number Percentage
(95% CI)
Number Percentage
(95% CI)
< 25 13 6 (3 - 9) 30 6 (4 - 8)
25-29 30 13 (9 - 18) 58 11 (9 - 14)
30-34 51 22 (17 - 28) 93 18 (15 - 21)
35-39 74 32 (27 - 39) 149 28 (25 - 32)
≥ 40 50 22 (17 - 28) 167 32 (28 - 36)
missing 11 5 (3 - 8) 29 6 (4 - 8)
Total 229 100 526 100
* 2012 data are provisional.
14
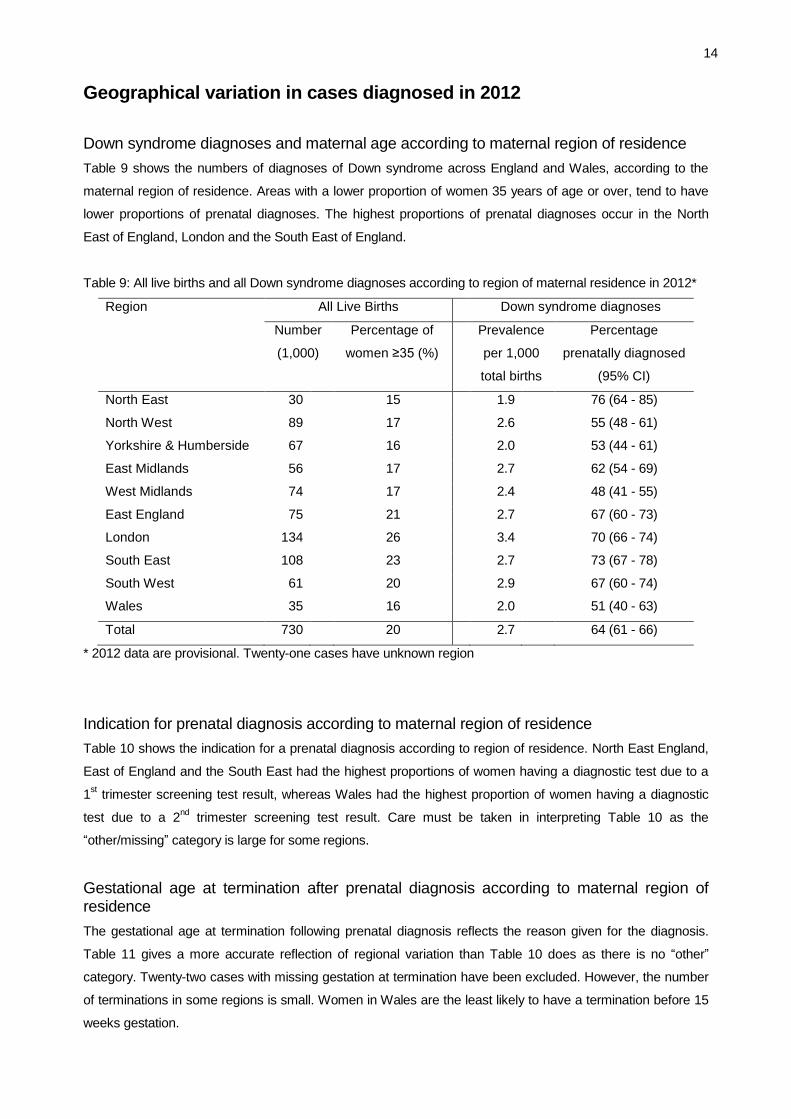
Geographical variation in cases diagnosed in 2012
Down syndrome diagnoses and maternal age according to maternal region of residence
Table 9 shows the numbers of diagnoses of Down syndrome across England and Wales, according to the
maternal region of residence. Areas with a lower proportion of women 35 years of age or over, tend to have
lower proportions of prenatal diagnoses. The highest proportions of prenatal diagnoses occur in the North
East of England, London and the South East of England.
Table 9: All live births and all Down syndrome diagnoses according to region of maternal residence in 2012*
Region All Live Births Down syndrome diagnoses
Number
(1,000)
Percentage of
women ≥35 (%)
Prevalence
per 1,000
total births
Percentage
prenatally diagnosed
(95% CI)
North East 30 15 1.9 76 (64 - 85)
North West 89 17 2.6 55 (48 - 61)
Yorkshire & Humberside 67 16 2.0 53 (44 - 61)
East Midlands 56 17 2.7 62 (54 - 69)
West Midlands 74 17 2.4 48 (41 - 55)
East England 75 21 2.7 67 (60 - 73)
London 134 26 3.4 70 (66 - 74)
South East 108 23 2.7 73 (67 - 78)
South West 61 20 2.9 67 (60 - 74)
Wales 35 16 2.0 51 (40 - 63)
Total 730 20 2.7 64 (61 - 66)
* 2012 data are provisional. Twenty-one cases have unknown region
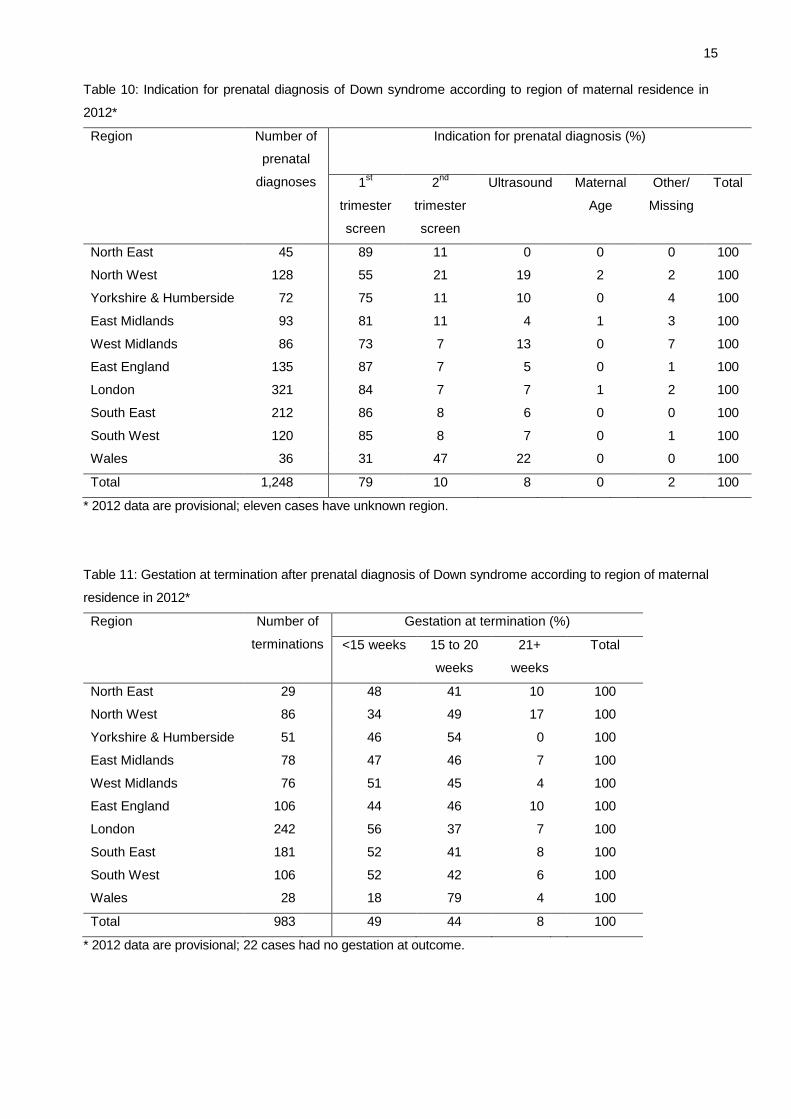
Indication for prenatal diagnosis according to maternal region of residence
Table 10 shows the indication for a prenatal diagnosis according to region of residence. North East England,
East of England and the South East had the highest proportions of women having a diagnostic test due to a
1st trimester screening test result, whereas Wales had the highest proportion of women having a diagnostic
test due to a 2nd
trimester screening test result. Care must be taken in interpreting Table 10 as the
“other/missing” category is large for some regions.
Gestational age at termination after prenatal diagnosis according to maternal region of residence
The gestational age at termination following prenatal diagnosis reflects the reason given for the diagnosis.
Table 11 gives a more accurate reflection of regional variation than Table 10 does as there is no “other”
category. Twenty-two cases with missing gestation at termination have been excluded. However, the number
of terminations in some regions is small. Women in Wales are the least likely to have a termination before 15
weeks gestation.
15
Table 10: Indication for prenatal diagnosis of Down syndrome according to region of maternal residence in
2012*
Region Number of
prenatal
diagnoses
Indication for prenatal diagnosis (%)
1st
trimester
screen
2nd
trimester
screen
Ultrasound Maternal
Age
Other/
Missing
Total
North East 45 89 11 0 0 0 100
North West 128 55 21 19 2 2 100
Yorkshire & Humberside 72 75 11 10 0 4 100
East Midlands 93 81 11 4 1 3 100
West Midlands 86 73 7 13 0 7 100
East England 135 87 7 5 0 1 100
London 321 84 7 7 1 2 100
South East 212 86 8 6 0 0 100
South West 120 85 8 7 0 1 100
Wales 36 31 47 22 0 0 100
Total 1,248 79 10 8 0 2 100
* 2012 data are provisional; eleven cases have unknown region.
Table 11: Gestation at termination after prenatal diagnosis of Down syndrome according to region of maternal
residence in 2012*
Region Number of
terminations
Gestation at termination (%)
<15 weeks 15 to 20
weeks
21+
weeks
Total
North East 29 48 41 10 100
North West 86 34 49 17 100
Yorkshire & Humberside 51 46 54 0 100
East Midlands 78 47 46 7 100
West Midlands 76 51 45 4 100
East England 106 44 46 10 100
London 242 56 37 7 100
South East 181 52 41 8 100
South West 106 52 42 6 100
Wales 28 18 79 4 100
Total 983 49 44 8 100
* 2012 data are provisional; 22 cases had no gestation at outcome.
16
Patau and Edwards syndrome diagnoses according to maternal region of residence
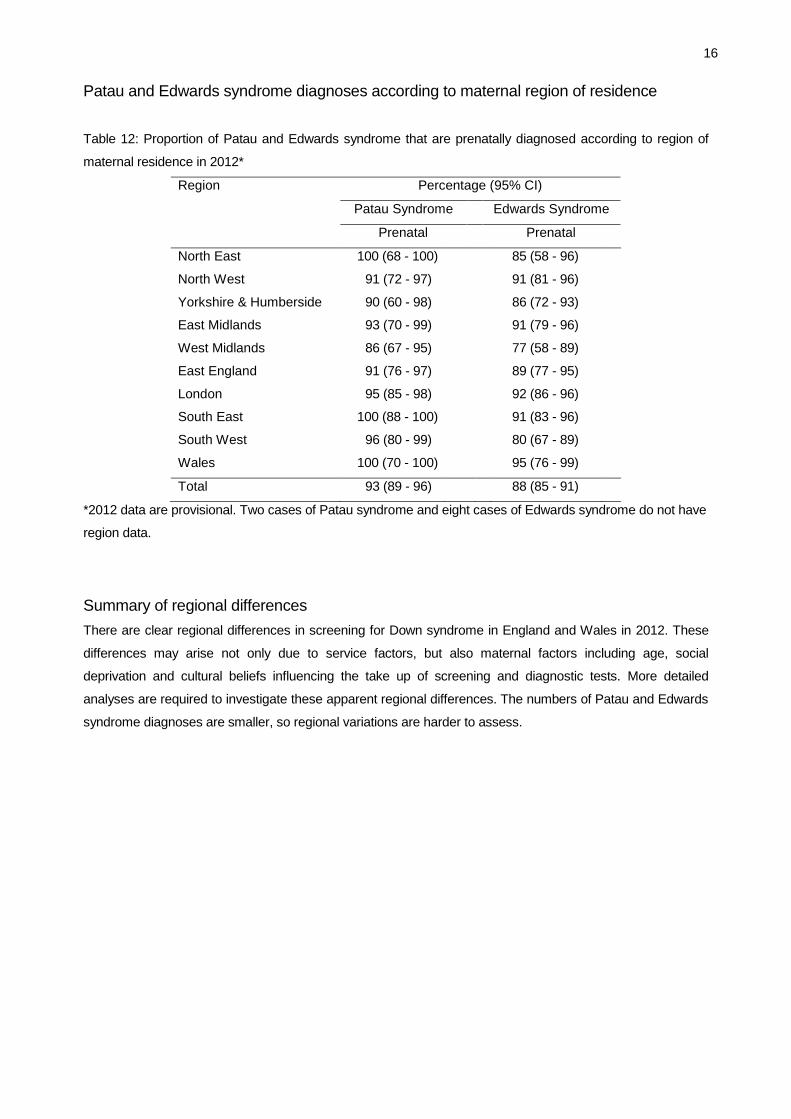
Table 12: Proportion of Patau and Edwards syndrome that are prenatally diagnosed according to region of
maternal residence in 2012*
Region Percentage (95% CI)
Patau Syndrome Edwards Syndrome
Prenatal Prenatal
North East 100 (68 - 100) 85 (58 - 96)
North West 91 (72 - 97) 91 (81 - 96)
Yorkshire & Humberside 90 (60 - 98) 86 (72 - 93)
East Midlands 93 (70 - 99) 91 (79 - 96)
West Midlands 86 (67 - 95) 77 (58 - 89)
East England 91 (76 - 97) 89 (77 - 95)
London 95 (85 - 98) 92 (86 - 96)
South East 100 (88 - 100) 91 (83 - 96)
South West 96 (80 - 99) 80 (67 - 89)
Wales 100 (70 - 100) 95 (76 - 99)
Total 93 (89 - 96) 88 (85 - 91)
*2012 data are provisional. Two cases of Patau syndrome and eight cases of Edwards syndrome do not have
region data.
Summary of regional differences
There are clear regional differences in screening for Down syndrome in England and Wales in 2012. These
differences may arise not only due to service factors, but also maternal factors including age, social
deprivation and cultural beliefs influencing the take up of screening and diagnostic tests. More detailed
analyses are required to investigate these apparent regional differences. The numbers of Patau and Edwards
syndrome diagnoses are smaller, so regional variations are harder to assess.
17
Prenatal diagnosis compared to other European registers 2007-2011
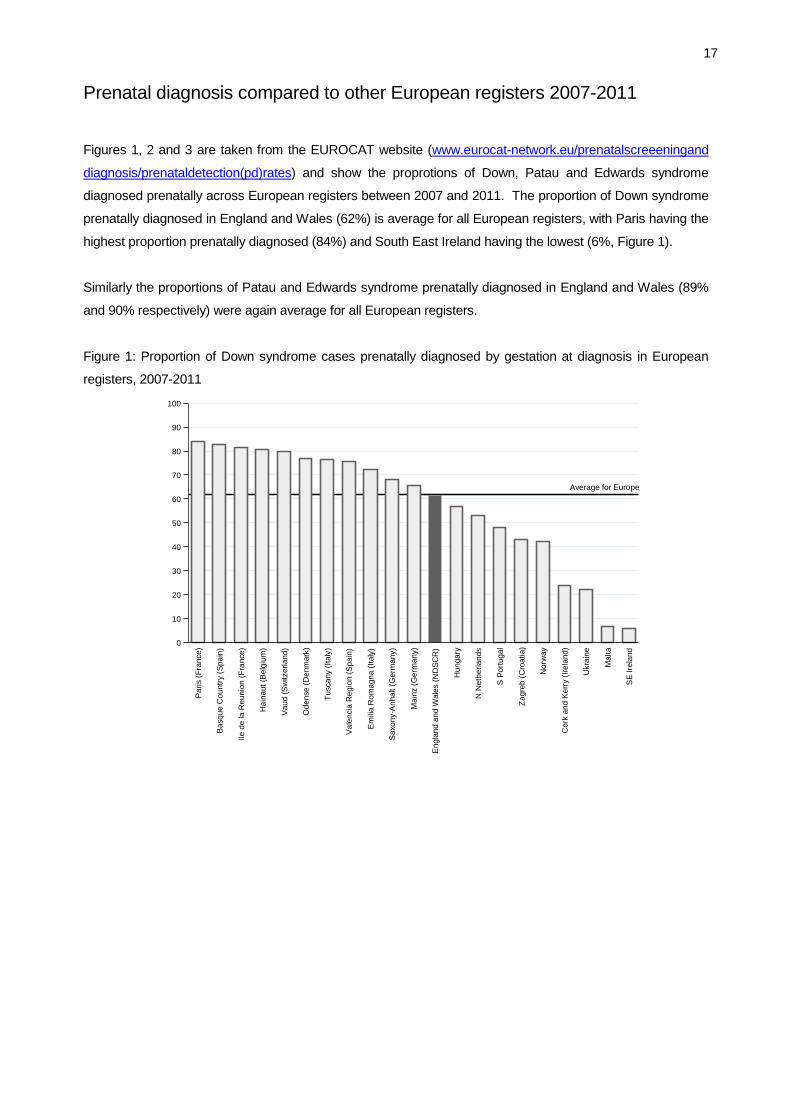
Figures 1, 2 and 3 are taken from the EUROCAT website (www.eurocat-network.eu/prenatalscreeeningand
diagnosis/prenataldetection(pd)rates) and show the proprotions of Down, Patau and Edwards syndrome
diagnosed prenatally across European registers between 2007 and 2011. The proportion of Down syndrome
prenatally diagnosed in England and Wales (62%) is average for all European registers, with Paris having the
highest proportion prenatally diagnosed (84%) and South East Ireland having the lowest (6%, Figure 1).
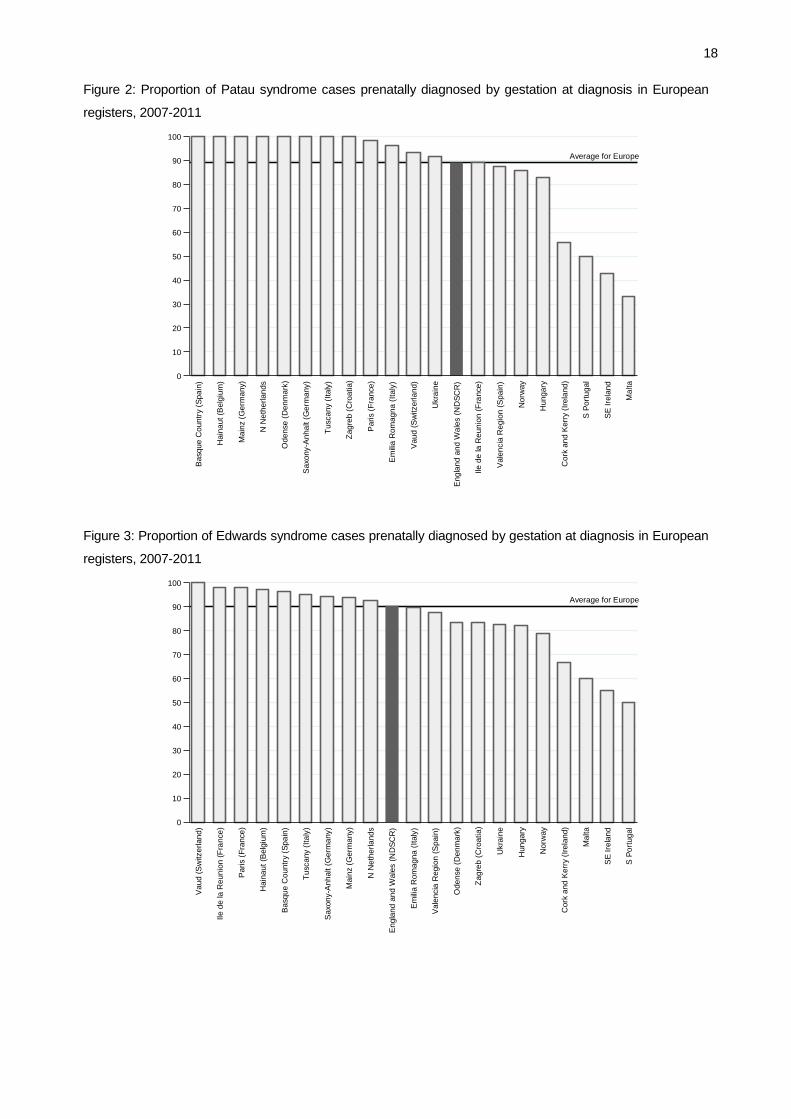
Similarly the proportions of Patau and Edwards syndrome prenatally diagnosed in England and Wales (89%
and 90% respectively) were again average for all European registers.
Figure 1: Proportion of Down syndrome cases prenatally diagnosed by gestation at diagnosis in European
registers, 2007-2011
Average for Europe
0
10
20
30
40
50
60
70
80
90
100
Pro
po
rtio
n p
ren
ata
lly d
iag
no
se
d
Paris (
Fra
nce)
Basque C
ountr
y (
Spa
in)
Ile d
e la R
eunio
n (
Fra
nce)
Hain
aut
(Belg
ium
)
Vaud (
Sw
itzerland)
Odense (
Denm
ark
)
Tuscany (
Italy
)
Vale
ncia
Regio
n (
Spain
)
Em
ilia R
om
agna (
Italy
)
Saxony-A
nhalt (
Germ
any)
Ma
inz (
Germ
any)
Engla
nd a
nd W
ale
s (
ND
SC
R)
Hungary
N N
eth
erl
ands
S P
ort
ugal
Zagre
b (
Cro
atia)
Norw
ay
Cork
and K
err
y (
Irela
nd)
Ukra
ine
Ma
lta
SE
Ire
land
18
Figure 2: Proportion of Patau syndrome cases prenatally diagnosed by gestation at diagnosis in European
registers, 2007-2011
Average for Europe
0
10
20
30
40
50
60
70
80
90
100
Pro
po
rtio
n p
ren
ata
lly d
iag
no
se
d
Basque C
ountr
y (
Spa
in)
Hain
aut
(Belg
ium
)
Ma
inz (
Germ
any)
N N
eth
erl
ands
Odense (
Denm
ark
)
Saxony-A
nhalt (
Germ
any)
Tuscany (
Italy
)
Zagre
b (
Cro
atia)
Paris (
Fra
nce)
Em
ilia R
om
agna (
Italy
)
Vaud (
Sw
itzerland)
Ukra
ine
Engla
nd a
nd W
ale
s (
ND
SC
R)
Ile d
e la R
eunio
n (
Fra
nce)
Vale
ncia
Regio
n (
Spain
)
Norw
ay
Hungary
Cork
and K
err
y (
Irela
nd)
S P
ort
ugal
SE
Ire
land
Ma
lta
Figure 3: Proportion of Edwards syndrome cases prenatally diagnosed by gestation at diagnosis in European
registers, 2007-2011
Average for Europe
0
10
20
30
40
50
60
70
80
90
100
Pro
po
rtio
n p
ren
ata
lly d
iag
no
se
d
Vaud (
Sw
itzerland)
Ile d
e la R
eunio
n (
Fra
nce)
Paris (
Fra
nce)
Hain
aut
(Belg
ium
)
Basque C
ountr
y (
Spa
in)
Tuscany (
Italy
)
Saxony-A
nhalt (
Germ
any)
Ma
inz (
Germ
any)
N N
eth
erl
ands
Engla
nd a
nd W
ale
s (
ND
SC
R)
Em
ilia R
om
agna (
Italy
)
Vale
ncia
Regio
n (
Spain
)
Odense (
Denm
ark
)
Zagre
b (
Cro
atia)
Ukra
ine
Hungary
Norw
ay
Cork
and K
err
y (
Irela
nd)
Ma
lta
SE
Ire
land
S P
ort
ugal
19
Trends over time in Down syndrome diagnoses
Outcomes of Down syndrome cases from 1989-2012
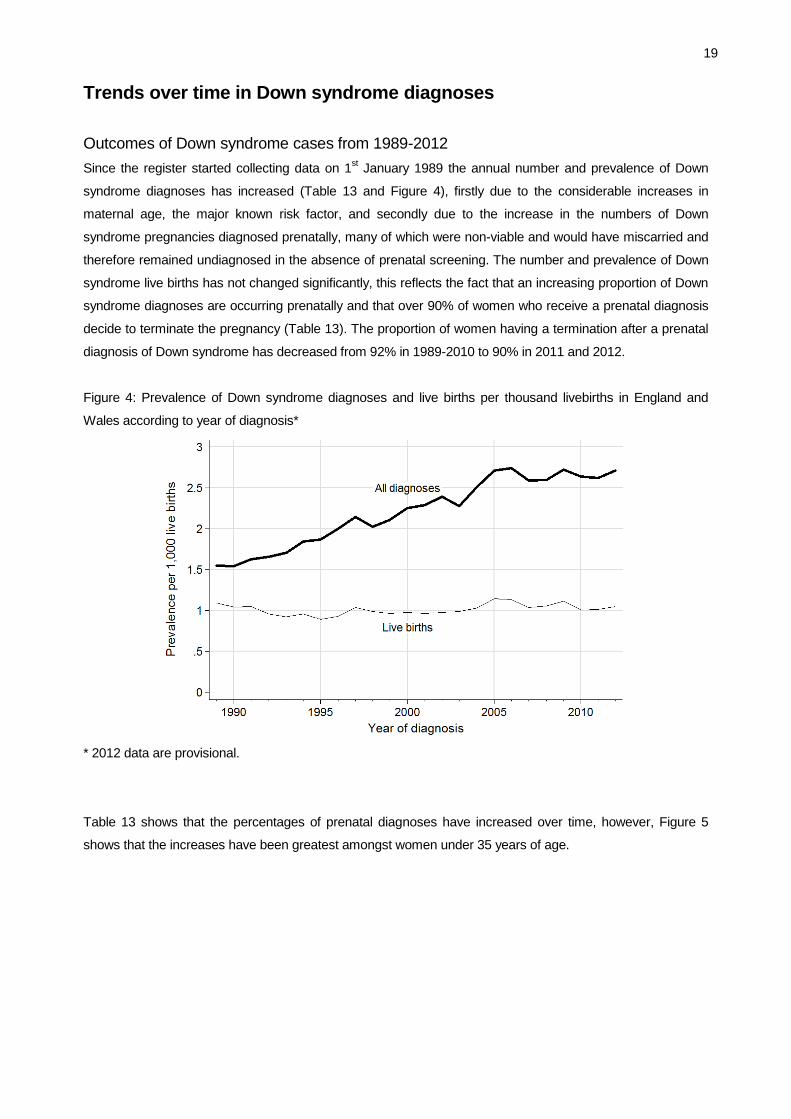
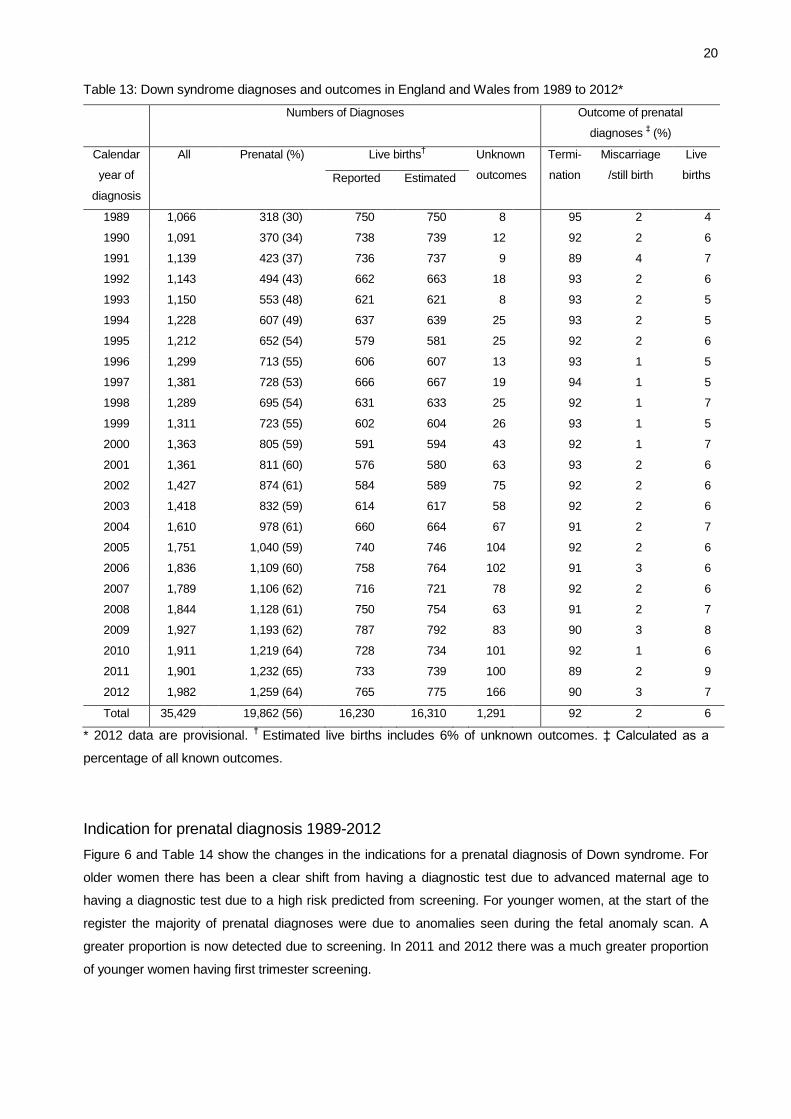
Since the register started collecting data on 1st January 1989 the annual number and prevalence of Down
syndrome diagnoses has increased (Table 13 and Figure 4), firstly due to the considerable increases in
maternal age, the major known risk factor, and secondly due to the increase in the numbers of Down
syndrome pregnancies diagnosed prenatally, many of which were non-viable and would have miscarried and
therefore remained undiagnosed in the absence of prenatal screening. The number and prevalence of Down
syndrome live births has not changed significantly, this reflects the fact that an increasing proportion of Down
syndrome diagnoses are occurring prenatally and that over 90% of women who receive a prenatal diagnosis
decide to terminate the pregnancy (Table 13). The proportion of women having a termination after a prenatal
diagnosis of Down syndrome has decreased from 92% in 1989-2010 to 90% in 2011 and 2012.
Figure 4: Prevalence of Down syndrome diagnoses and live births per thousand livebirths in England and
Wales according to year of diagnosis*
* 2012 data are provisional.
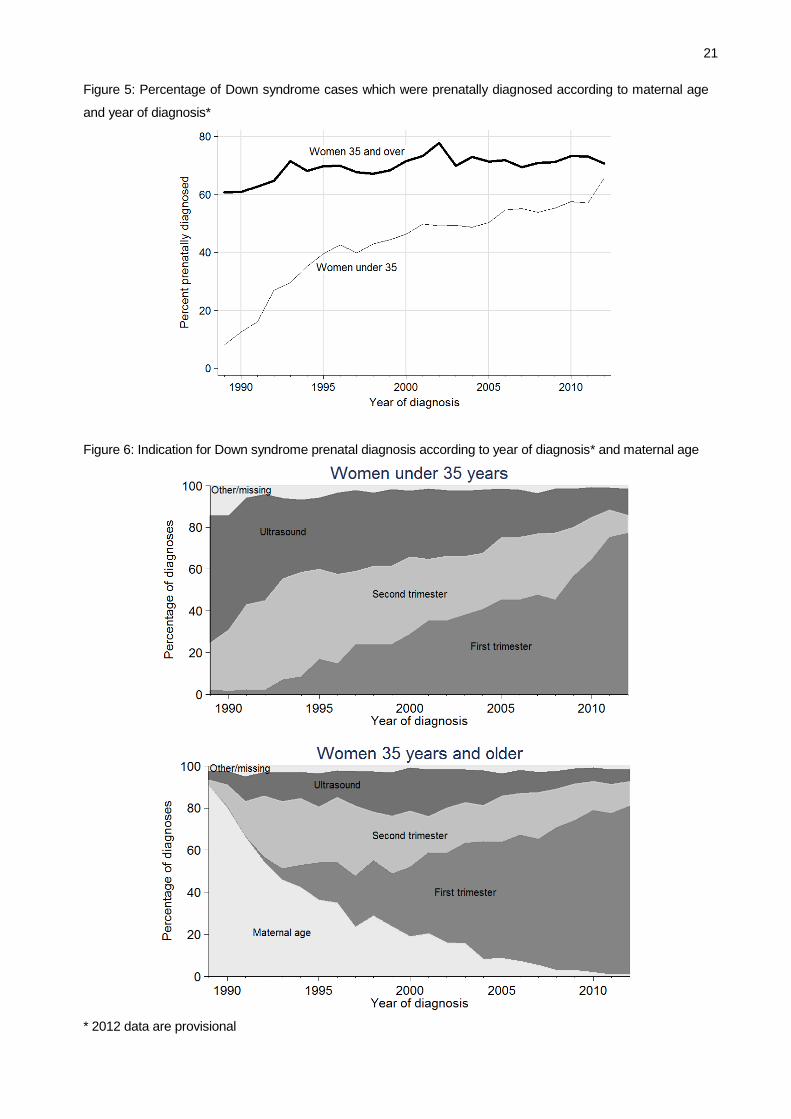
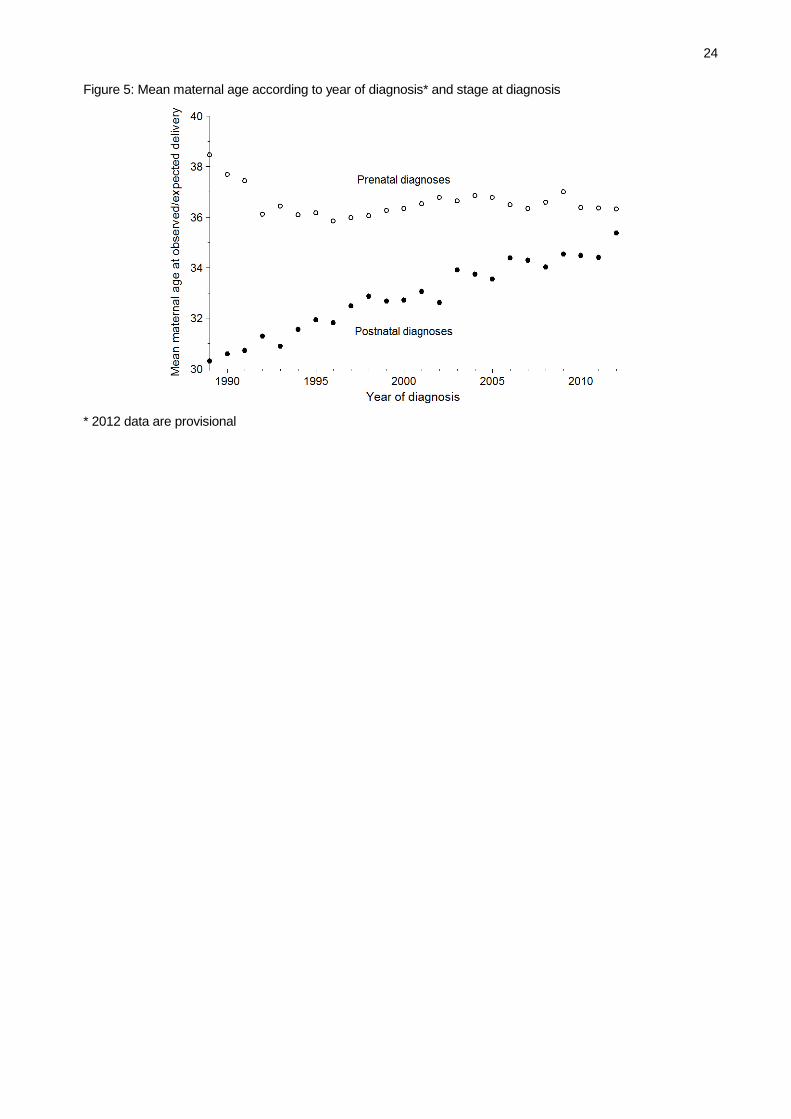
Table 13 shows that the percentages of prenatal diagnoses have increased over time, however, Figure 5
shows that the increases have been greatest amongst women under 35 years of age.
20
Table 13: Down syndrome diagnoses and outcomes in England and Wales from 1989 to 2012*
Numbers of Diagnoses Outcome of prenatal
diagnoses ‡ (%)
Calendar
year of
diagnosis
All Prenatal (%) Live births† Unknown
outcomes
Termi-
nation
Miscarriage
/still birth
Live
births Reported Estimated
1989 1,066 318 (30) 750 750 8 95 2 4
1990 1,091 370 (34) 738 739 12 92 2 6
1991 1,139 423 (37) 736 737 9 89 4 7
1992 1,143 494 (43) 662 663 18 93 2 6
1993 1,150 553 (48) 621 621 8 93 2 5
1994 1,228 607 (49) 637 639 25 93 2 5
1995 1,212 652 (54) 579 581 25 92 2 6
1996 1,299 713 (55) 606 607 13 93 1 5
1997 1,381 728 (53) 666 667 19 94 1 5
1998 1,289 695 (54) 631 633 25 92 1 7
1999 1,311 723 (55) 602 604 26 93 1 5
2000 1,363 805 (59) 591 594 43 92 1 7
2001 1,361 811 (60) 576 580 63 93 2 6
2002 1,427 874 (61) 584 589 75 92 2 6
2003 1,418 832 (59) 614 617 58 92 2 6
2004 1,610 978 (61) 660 664 67 91 2 7
2005 1,751 1,040 (59) 740 746 104 92 2 6
2006 1,836 1,109 (60) 758 764 102 91 3 6
2007 1,789 1,106 (62) 716 721 78 92 2 6
2008 1,844 1,128 (61) 750 754 63 91 2 7
2009 1,927 1,193 (62) 787 792 83 90 3 8
2010 1,911 1,219 (64) 728 734 101 92 1 6
2011 1,901 1,232 (65) 733 739 100 89 2 9
2012 1,982 1,259 (64) 765 775 166 90 3 7
Total 35,429 19,862 (56) 16,230 16,310 1,291 92 2 6
* 2012 data are provisional. †
Estimated live births includes 6% of unknown outcomes. ‡ Calculated as a
percentage of all known outcomes.
Indication for prenatal diagnosis 1989-2012
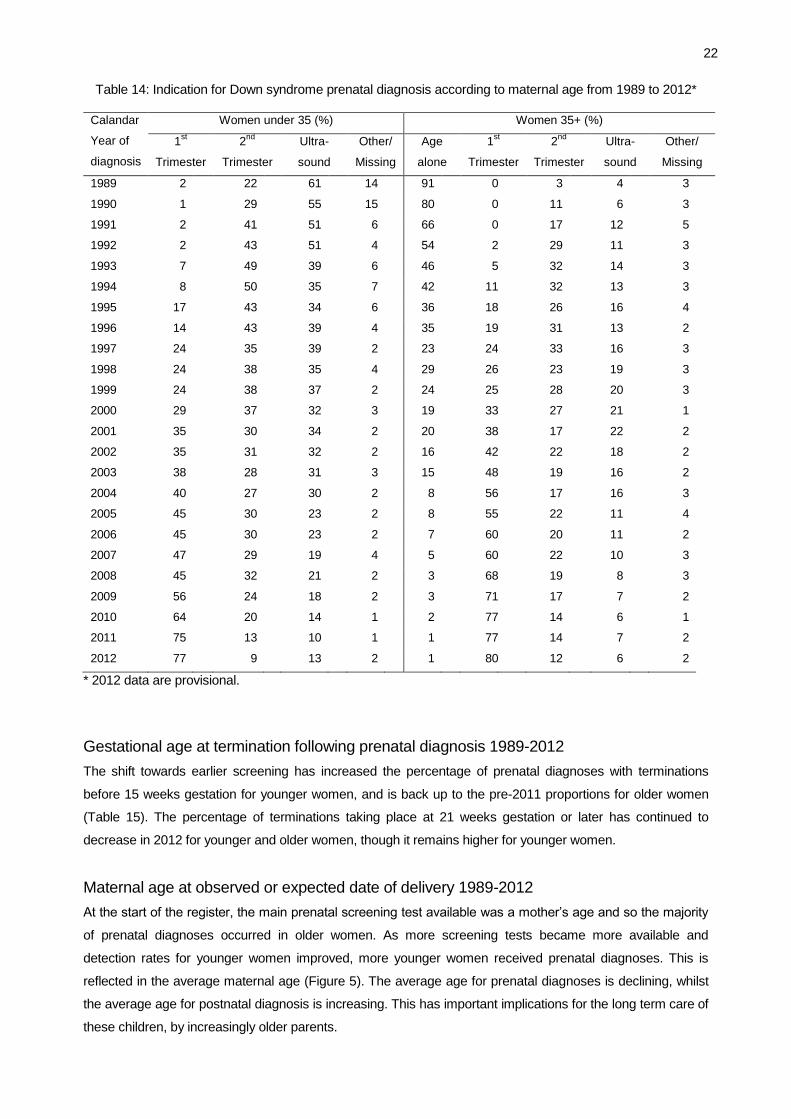
Figure 6 and Table 14 show the changes in the indications for a prenatal diagnosis of Down syndrome. For
older women there has been a clear shift from having a diagnostic test due to advanced maternal age to
having a diagnostic test due to a high risk predicted from screening. For younger women, at the start of the
register the majority of prenatal diagnoses were due to anomalies seen during the fetal anomaly scan. A
greater proportion is now detected due to screening. In 2011 and 2012 there was a much greater proportion
of younger women having first trimester screening.
21
Figure 5: Percentage of Down syndrome cases which were prenatally diagnosed according to maternal age
and year of diagnosis*
Figure 6: Indication for Down syndrome prenatal diagnosis according to year of diagnosis* and maternal age
* 2012 data are provisional
22
Table 14: Indication for Down syndrome prenatal diagnosis according to maternal age from 1989 to 2012*
Calandar
Year of
diagnosis
Women under 35 (%) Women 35+ (%)
1st
Trimester
2nd
Trimester
Ultra-
sound
Other/
Missing
Age
alone
1st
Trimester
2nd
Trimester
Ultra-
sound
Other/
Missing
1989 2 22 61 14 91 0 3 4 3
1990 1 29 55 15 80 0 11 6 3
1991 2 41 51 6 66 0 17 12 5
1992 2 43 51 4 54 2 29 11 3
1993 7 49 39 6 46 5 32 14 3
1994 8 50 35 7 42 11 32 13 3
1995 17 43 34 6 36 18 26 16 4
1996 14 43 39 4 35 19 31 13 2
1997 24 35 39 2 23 24 33 16 3
1998 24 38 35 4 29 26 23 19 3
1999 24 38 37 2 24 25 28 20 3
2000 29 37 32 3 19 33 27 21 1
2001 35 30 34 2 20 38 17 22 2
2002 35 31 32 2 16 42 22 18 2
2003 38 28 31 3 15 48 19 16 2
2004 40 27 30 2 8 56 17 16 3
2005 45 30 23 2 8 55 22 11 4
2006 45 30 23 2 7 60 20 11 2
2007 47 29 19 4 5 60 22 10 3
2008 45 32 21 2 3 68 19 8 3
2009 56 24 18 2 3 71 17 7 2
2010 64 20 14 1 2 77 14 6 1
2011 75 13 10 1 1 77 14 7 2
2012 77 9 13 2 1 80 12 6 2
* 2012 data are provisional.
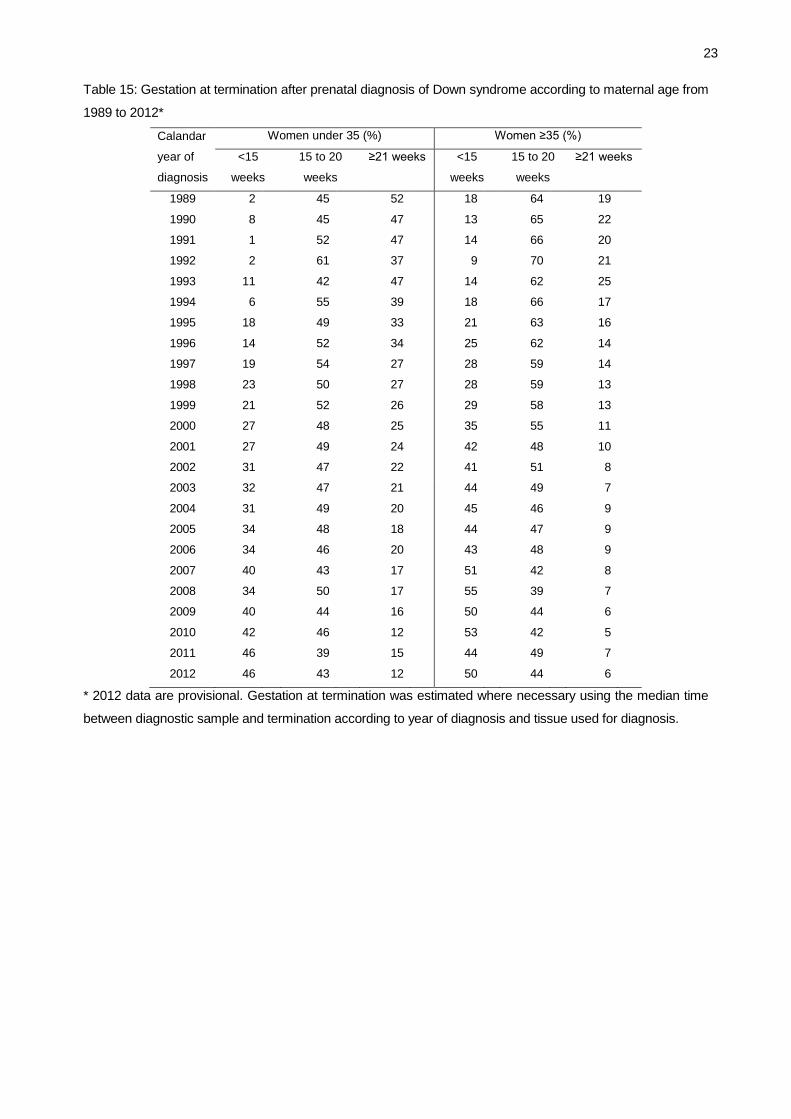
Gestational age at termination following prenatal diagnosis 1989-2012
The shift towards earlier screening has increased the percentage of prenatal diagnoses with terminations
before 15 weeks gestation for younger women, and is back up to the pre-2011 proportions for older women
(Table 15). The percentage of terminations taking place at 21 weeks gestation or later has continued to
decrease in 2012 for younger and older women, though it remains higher for younger women.
Maternal age at observed or expected date of delivery 1989-2012
At the start of the register, the main prenatal screening test available was a mother’s age and so the majority
of prenatal diagnoses occurred in older women. As more screening tests became more available and
detection rates for younger women improved, more younger women received prenatal diagnoses. This is
reflected in the average maternal age (Figure 5). The average age for prenatal diagnoses is declining, whilst
the average age for postnatal diagnosis is increasing. This has important implications for the long term care of
these children, by increasingly older parents.
23
Table 15: Gestation at termination after prenatal diagnosis of Down syndrome according to maternal age from
1989 to 2012*
Calandar
year of
diagnosis
Women under 35 (%) Women ≥35 (%)
<15
weeks
15 to 20
weeks
≥21 weeks
<15
weeks
15 to 20
weeks
≥21 weeks
1989 2 45 52 18 64 19
1990 8 45 47 13 65 22
1991 1 52 47 14 66 20
1992 2 61 37 9 70 21
1993 11 42 47 14 62 25
1994 6 55 39 18 66 17
1995 18 49 33 21 63 16
1996 14 52 34 25 62 14
1997 19 54 27 28 59 14
1998 23 50 27 28 59 13
1999 21 52 26 29 58 13
2000 27 48 25 35 55 11
2001 27 49 24 42 48 10
2002 31 47 22 41 51 8
2003 32 47 21 44 49 7
2004 31 49 20 45 46 9
2005 34 48 18 44 47 9
2006 34 46 20 43 48 9
2007 40 43 17 51 42 8
2008 34 50 17 55 39 7
2009 40 44 16 50 44 6
2010 42 46 12 53 42 5
2011 46 39 15 44 49 7
2012 46 43 12 50 44 6
* 2012 data are provisional. Gestation at termination was estimated where necessary using the median time
between diagnostic sample and termination according to year of diagnosis and tissue used for diagnosis.
24
Figure 5: Mean maternal age according to year of diagnosis* and stage at diagnosis
* 2012 data are provisional
25
Trends over time in Patau and Edwards syndromes diagnoses
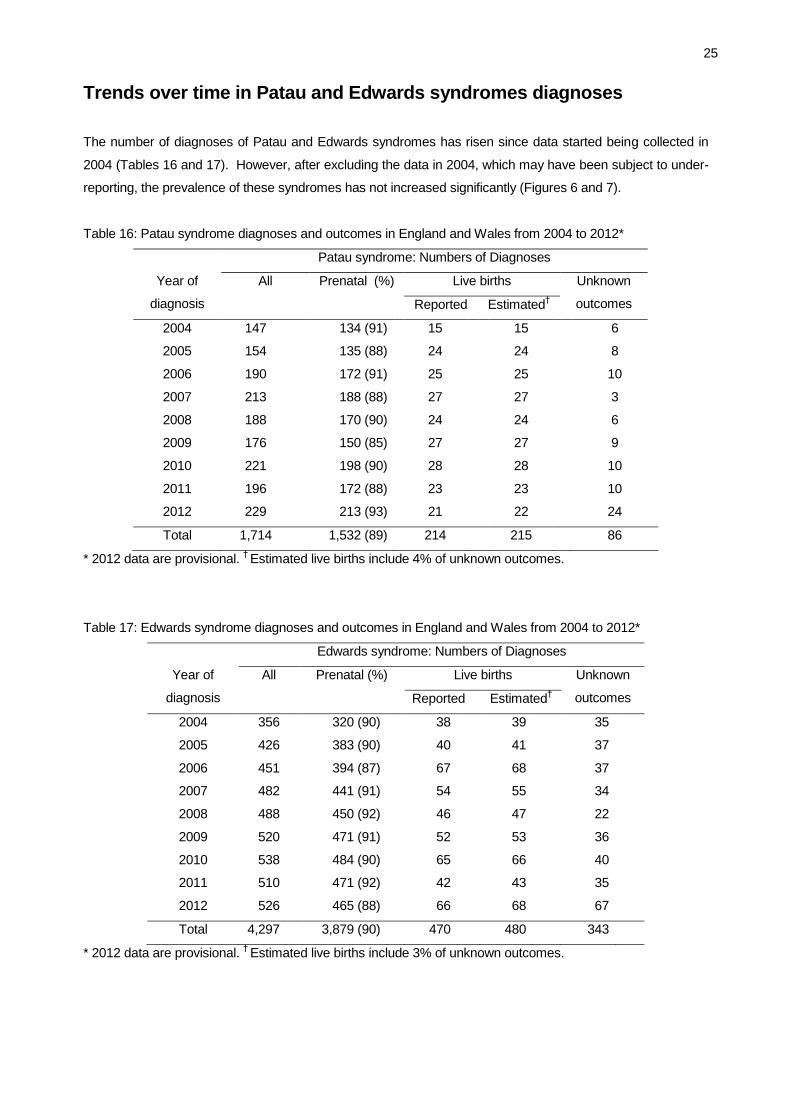
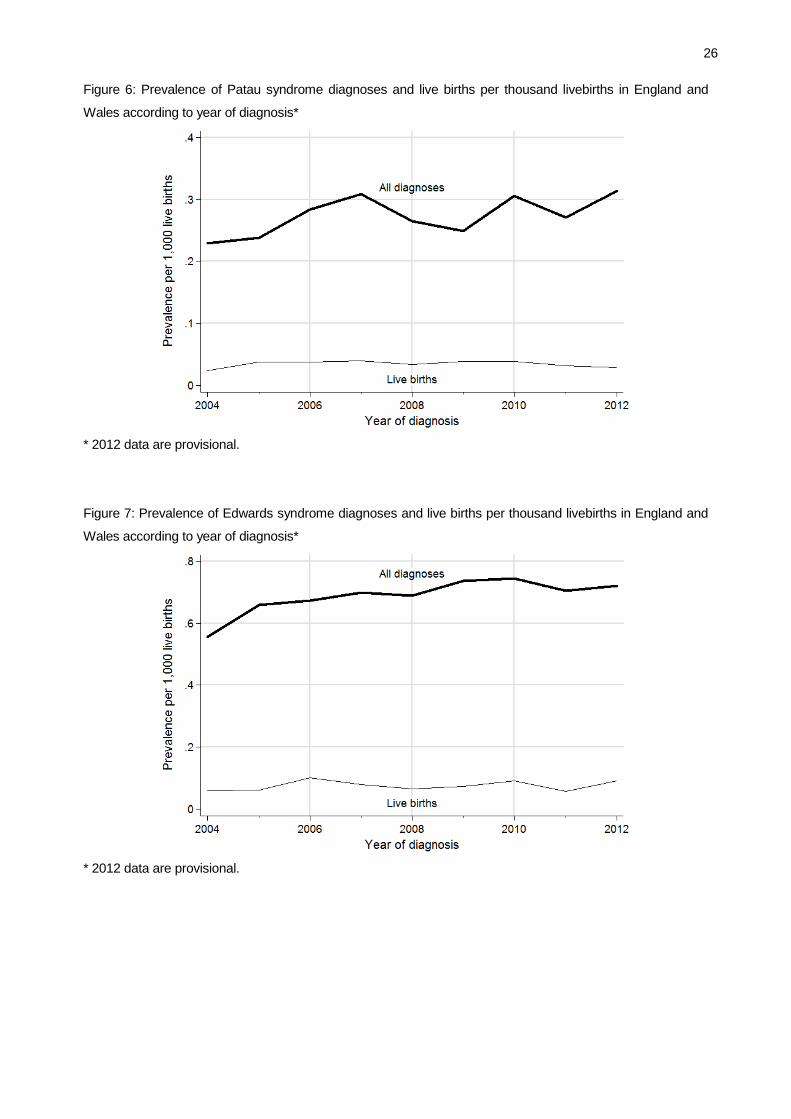
The number of diagnoses of Patau and Edwards syndromes has risen since data started being collected in
2004 (Tables 16 and 17). However, after excluding the data in 2004, which may have been subject to under-
reporting, the prevalence of these syndromes has not increased significantly (Figures 6 and 7).
Table 16: Patau syndrome diagnoses and outcomes in England and Wales from 2004 to 2012*
Patau syndrome: Numbers of Diagnoses
Year of
diagnosis
All Prenatal (%) Live births Unknown
outcomes Reported Estimated†
2004 147 134 (91) 15 15 6
2005 154 135 (88) 24 24 8
2006 190 172 (91) 25 25 10
2007 213 188 (88) 27 27 3
2008 188 170 (90) 24 24 6
2009 176 150 (85) 27 27 9
2010 221 198 (90) 28 28 10
2011 196 172 (88) 23 23 10
2012 229 213 (93) 21 22 24
Total 1,714 1,532 (89) 214 215 86
* 2012 data are provisional. † Estimated live births include 4% of unknown outcomes.
Table 17: Edwards syndrome diagnoses and outcomes in England and Wales from 2004 to 2012*
Edwards syndrome: Numbers of Diagnoses
Year of
diagnosis
All Prenatal (%) Live births Unknown
outcomes Reported Estimated†
2004 356 320 (90) 38 39 35
2005 426 383 (90) 40 41 37
2006 451 394 (87) 67 68 37
2007 482 441 (91) 54 55 34
2008 488 450 (92) 46 47 22
2009 520 471 (91) 52 53 36
2010 538 484 (90) 65 66 40
2011 510 471 (92) 42 43 35
2012 526 465 (88) 66 68 67
Total 4,297 3,879 (90) 470 480 343
* 2012 data are provisional. † Estimated live births include 3% of unknown outcomes.
26
Figure 6: Prevalence of Patau syndrome diagnoses and live births per thousand livebirths in England and
Wales according to year of diagnosis*
* 2012 data are provisional.
Figure 7: Prevalence of Edwards syndrome diagnoses and live births per thousand livebirths in England and
Wales according to year of diagnosis*
* 2012 data are provisional.
27
Appendix A
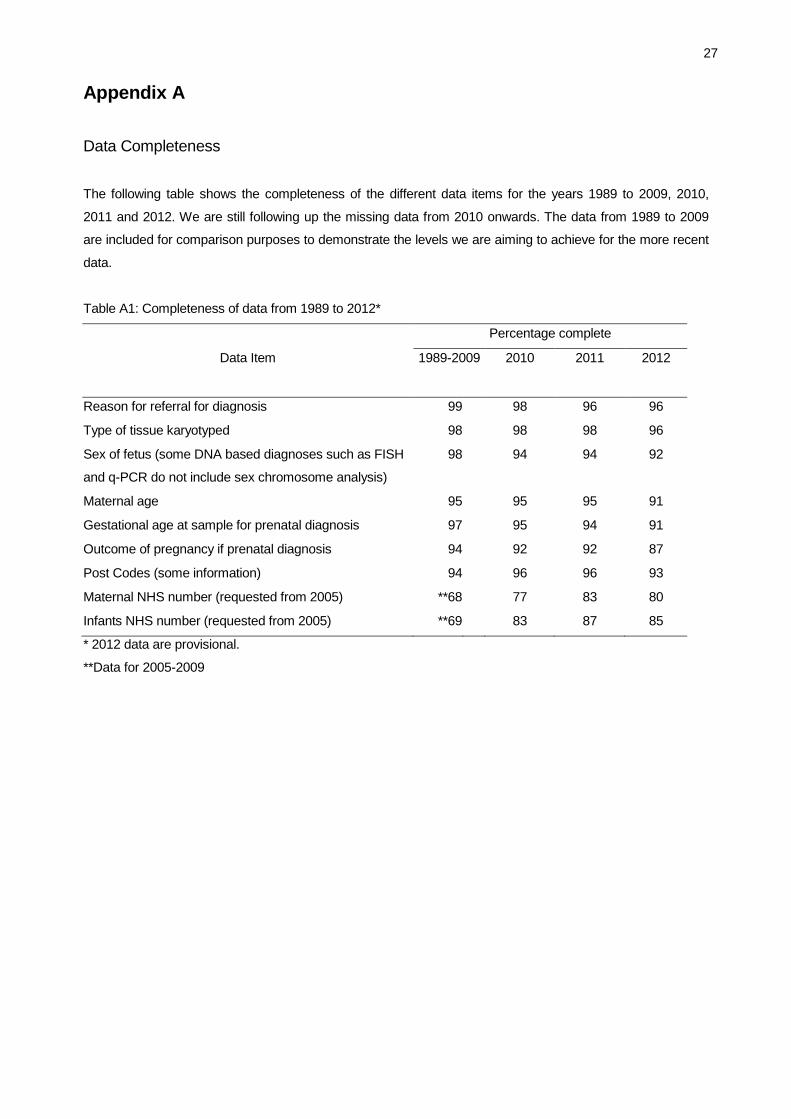
Data Completeness
The following table shows the completeness of the different data items for the years 1989 to 2009, 2010,
2011 and 2012. We are still following up the missing data from 2010 onwards. The data from 1989 to 2009
are included for comparison purposes to demonstrate the levels we are aiming to achieve for the more recent
data.
Table A1: Completeness of data from 1989 to 2012*
Percentage complete
Data Item 1989-2009 2010 2011 2012
Reason for referral for diagnosis 99 98 96 96
Type of tissue karyotyped 98 98 98 96
Sex of fetus (some DNA based diagnoses such as FISH
and q-PCR do not include sex chromosome analysis)
98
94 94 92
Maternal age 95 95 95 91
Gestational age at sample for prenatal diagnosis 97 95 94 91
Outcome of pregnancy if prenatal diagnosis 94 92 92 87
Post Codes (some information) 94 96 96 93
Maternal NHS number (requested from 2005) **68 77 83 80
Infants NHS number (requested from 2005) **69 83 87 85
* 2012 data are provisional.
**Data for 2005-2009
28
Appendix B: Form in 2012
29
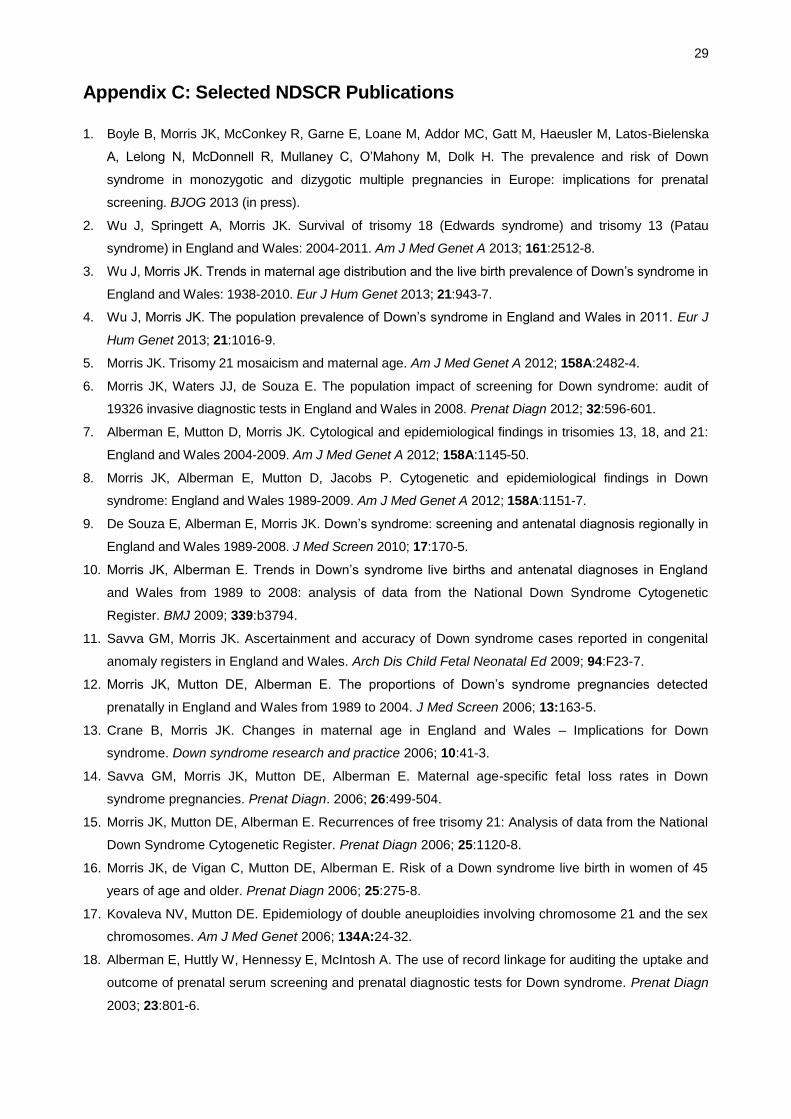
Appendix C: Selected NDSCR Publications
1. Boyle B, Morris JK, McConkey R, Garne E, Loane M, Addor MC, Gatt M, Haeusler M, Latos-Bielenska
A, Lelong N, McDonnell R, Mullaney C, O’Mahony M, Dolk H. The prevalence and risk of Down
syndrome in monozygotic and dizygotic multiple pregnancies in Europe: implications for prenatal
screening. BJOG 2013 (in press).
2. Wu J, Springett A, Morris JK. Survival of trisomy 18 (Edwards syndrome) and trisomy 13 (Patau
syndrome) in England and Wales: 2004-2011. Am J Med Genet A 2013; 161:2512-8.
3. Wu J, Morris JK. Trends in maternal age distribution and the live birth prevalence of Down’s syndrome in
England and Wales: 1938-2010. Eur J Hum Genet 2013; 21:943-7.
4. Wu J, Morris JK. The population prevalence of Down’s syndrome in England and Wales in 2011. Eur J
Hum Genet 2013; 21:1016-9.
5. Morris JK. Trisomy 21 mosaicism and maternal age. Am J Med Genet A 2012; 158A:2482-4.
6. Morris JK, Waters JJ, de Souza E. The population impact of screening for Down syndrome: audit of
19326 invasive diagnostic tests in England and Wales in 2008. Prenat Diagn 2012; 32:596-601.
7. Alberman E, Mutton D, Morris JK. Cytological and epidemiological findings in trisomies 13, 18, and 21:
England and Wales 2004-2009. Am J Med Genet A 2012; 158A:1145-50.
8. Morris JK, Alberman E, Mutton D, Jacobs P. Cytogenetic and epidemiological findings in Down
syndrome: England and Wales 1989-2009. Am J Med Genet A 2012; 158A:1151-7.
9. De Souza E, Alberman E, Morris JK. Down’s syndrome: screening and antenatal diagnosis regionally in
England and Wales 1989-2008. J Med Screen 2010; 17:170-5.
10. Morris JK, Alberman E. Trends in Down’s syndrome live births and antenatal diagnoses in England
and Wales from 1989 to 2008: analysis of data from the National Down Syndrome Cytogenetic
Register. BMJ 2009; 339:b3794.
11. Savva GM, Morris JK. Ascertainment and accuracy of Down syndrome cases reported in congenital
anomaly registers in England and Wales. Arch Dis Child Fetal Neonatal Ed 2009; 94:F23-7.
12. Morris JK, Mutton DE, Alberman E. The proportions of Down’s syndrome pregnancies detected
prenatally in England and Wales from 1989 to 2004. J Med Screen 2006; 13:163-5.
13. Crane B, Morris JK. Changes in maternal age in England and Wales – Implications for Down
syndrome. Down syndrome research and practice 2006; 10:41-3.
14. Savva GM, Morris JK, Mutton DE, Alberman E. Maternal age-specific fetal loss rates in Down
syndrome pregnancies. Prenat Diagn. 2006; 26:499-504.
15. Morris JK, Mutton DE, Alberman E. Recurrences of free trisomy 21: Analysis of data from the National
Down Syndrome Cytogenetic Register. Prenat Diagn 2006; 25:1120-8.
16. Morris JK, de Vigan C, Mutton DE, Alberman E. Risk of a Down syndrome live birth in women of 45
years of age and older. Prenat Diagn 2006; 25:275-8.
17. Kovaleva NV, Mutton DE. Epidemiology of double aneuploidies involving chromosome 21 and the sex
chromosomes. Am J Med Genet 2006; 134A:24-32.
18. Alberman E, Huttly W, Hennessy E, McIntosh A. The use of record linkage for auditing the uptake and
outcome of prenatal serum screening and prenatal diagnostic tests for Down syndrome. Prenat Diagn
2003; 23:801-6.

30
19. Smith-Bindman R, Chu P, Bacchetti P, Waters JJ, Mutton D, Alberman E. Prenatal screening for
Down syndrome in England and Wales and population-based birth outcomes. Am J Obstet Gynecol
2003; 189:980-5.
20. Morris JK, Wald NJ, Mutton DE, Alberman E. Comparison of models of maternal age-specific risk for
Down syndrome live births. Prenat Diagn 2003; 23:252-8.
21. Alberman E. The National Down Syndrome Cytogenetic Register (NDSCR). J Med Screen 2002;
9:97-8.
22. Morris JK, Mutton DE, Alberman E. Revised estimates of the maternal age specific live birth
prevalence of Down’s syndrome. J Med Screen 2002; 9:2-6
23. Vrijheid M, Dolk H, Armstrong B, Abramsky L, Bianchi F, Fazarinc I, Garne E, Ide R, Nelen V, Robert
E, Scott JES, Stone D, Tenconi R. Chromosomal congenital anomalies and residence near hazardous
waste landfill sites. Lancet 2002; 359:320-3.
24. Smith-Bindman R, Waters J, Mutton D, Alberman E. Trends in the effectiveness and efficiency of
prenatal Down syndrome (DS) screening in England and Wales, 1989-1999. J Med Genet 2001:
Supplement 1 SP33.
25. Hook EB, Cross PK, Mutton DE. Female predominance (low sex ratio) in 47, +21 mosaics. Am J Med
Genet 1999; 84:316-9.
26. Morris JK, Wald NJ, Watt HC. Fetal loss in Down's syndrome pregnancies. Prenat Diagn 1999;
19:142-5.
27. Morris JK, Alberman E, Mutton D. Is there evidence of clustering in Down syndrome? Int J Epid 1998;
27:495-8.
28. Mutton D, Bunch K, Draper G, Alberman E. Children’s cancer and Down syndrome. J Med Genet
1997; 34:S65.
29. Huang T, Watts HC, Wald NJ, Morris JK, Mutton D, Alberman E. Reliability of statistics on DS
notifications. J Med Screen 1997; 4:94-7.
30. Mutton DE, Alberman ED, Hook EB. Cytogenetic and epidemiological findings in Down syndrome:
1993. J Med Genet 1996; 33:387-394.
31. Williamson P, Harris R, Church S, Fiddler M, Rhind J. Prenatal genetic services for Down's syndrome:
access and provision. Br J Obstet Gynaecol 1996; 103:676-83.
32. Hook EB, Mutton DE, Ide R, Alberman ED, Bobrow M. The natural history of Down syndrome
conceptuses diagnosed prenatally which are not electively terminated. Am J Hum Genet 1995;
57:875-881.
33. Alberman E, Mutton D, Ide R, Nicholson A, Bobrow M. Down's syndrome births and pregnancy
terminations in 1989 to 1993: preliminary findings. Br J Obstet Gynaecol 1995; 102:445-7.
34. Morris JK, Mutton DE, Ide R, Alberman E, Bobrow M. Monitoring trends in prenatal diagnosis of
Down’s syndrome in England and Wales, 1989-1992. J Med Screen 1994; 1:233-7.
35. Mutton DE, Ide R, Alberman E, Bobrow M. Analysis of National Register of Down's syndrome in
England and Wales: trends in prenatal diagnosis. BMJ 1993; 306:431-2.
36. Mutton DE, Alberman E, Ide R, Bobrow M. Results of first year (1989) of a national register of Down's
syndrome in England and Wales. BMJ 1991; 303:1295-7.
31
Queen Mary University of London
Barts and The London School of Medicine and Dentistry
Wolfson Institute of Preventive Medicine
Charterhouse Square
London
EC1M 6BQ
Web site: www.wolfson.qmul.ac.uk/ndscr
Phone: +44 (0) 20 7882 6274 / 6220
Fax: +44 (0) 20 7882 6221
Email: [email protected]