the motley fool - books.mec.biz · preface i this book distills all of that thinking into 11...
TRANSCRIPT

The Motley Fool
M I L L IONDOLLARPORTFOLIO
HOW TO BUILD AND GROW A PANIC-PROOF
INVESTMENT PORTFOLIO
DAVID AND TOM GARDNER

For our mother
CONTENTS
Preface i
A Note on the Financial Collapse of 2008 iii
1. Getting Started 1
2. Why Great Investors Are Odd 7
3. Your First Stock 14
4. Dividend Dynasty 44
5. Blue- Chip Bargains 73
6. The Trea sures of Small- Cap Investing 93
7. Risk Takers and Rule Breakers 121
8. We Are the World 153
9. CAPS: The Power of
Community Intelligence 177
10. Your Next Million 183
11. What Next? 217
Appendix A: Picking the Right Mutual
Funds 219
Appendix B: Further Reading 241
Index 247About the Authors
Other Books by David Gardner and Tom Gardner
Credits
Cover
Copyright
About the Publisher
v
v
Acknowledgments 243
PR EFACE
The concept for this book draws its origins from a meeting
Tom had in New York with one of the world’s great commer-
cial leaders, Lew Frankfort, the impassioned chief executive of
Coach. With a near 30- year tenure at the business, Frankfort is
widely—and correctly—credited with transforming a troubled
leather goods business into the world’s leading handbag com-
pany. In its eight years in the public markets, Coach stock has
turned a $10,000 investment into $150,000, earning investors 40%
returns per year.
What Lew told Tom at that meeting in February 2007 changed
The Motley Fool forever. Few companies do enough customer re-
search, he said. Instead, they develop new products and ser vices
solely on the experiences, insights, and instincts of their internal
team. “That won’t work indefi nitely,” he cautioned. “You’ve got
to be more obsessed with researching customers than with gen-
erating ideas. To be great for generations, your intuition alone
about what customers want today will not suffice. Talk to them
every day. Listen to them. Make an eternal effort of gathering
and analyzing as much information about them as you can.”
Tom returned to Fool Global Headquarters in Alexandria,
Virginia, and we immediately created our Customer Insights di-
vision, headed by Ginni Bratti. She and her team now spend ev-
ery day meeting with investors in face- to- face focus groups, over
PRE FACE
the phone, through video interviews, at member events, via sur-
veys, and in our online community at fool .com. Today, we’re in-
undated with customer statistics, comment lists, audio and video
fi les, and memories of breaking bread (and uncorking wine) with
our members from Minneapolis to Bermuda, Shanghai to Co-
penhagen, Stockholm to San Francisco, and beyond. Every day
we listen and therefore learn more about what you—our fellow
Fools—need to become better investors.
Just months after forming the Customer Insights team, we
leaned heavily on customer feedback to design the most success-
ful ser vice in The Motley Fool’s 15- year history, Million Dollar
Portfolio, which is the origin of this book. By listening, we heard
that investors like you want to:
1. View our best recommendations across all investment
philosophies
2. Study how we build an active portfolio of stocks
3. See us invest alongside you
4. Get a clear picture of our per for mance against the stock
market
5. Talk to other smart investors online
Million Dollar Portfolio (mdp.fool.com) is our answer to these
and thousands of other requests from people like you. We now
manage, in full view, $1 million of our own hard- earned capital.
That money is allocated into the best investment ideas drawn from
the research of dozens of analysts across our newsletter services
and thousands of investors throughout our community. The port-
folio includes value investments, dividend-payers, and growth stocks,
as well as small-, mid-, and large- cap stocks from domestic and
international markets. We announce all of our investment decisions
before purchasing any stock, giving our members the opportunity
to transact before we do. And we welcome both positive and nega-
tive feedback in the lively, ongoing, unedited interaction among our
members online (which no other investment company in the world
offers). Together, we are thrashing the market’s average return.
v

PRE FACE i
This book distills all of that thinking into 11 chapters that
will teach you how to build your own million- dollar portfolio us-
ing our very best strategies across all stock- investing disciplines.
What you will fi nd in these pages are philosophies that in certain
scenarios stand in direct opposition to one another. The princi-
ples needed to invest effectively in domestic mid- cap growth
stocks do not perfectly replicate those needed to win with inter-
national small- cap turnaround stocks, of the sort that Motley
Fool star investor Bill Mann has uncovered for years. Don’t let
these contradictions throw you. The more you invest, the more
you’ll come to realize just how many roads there are to prosper-
ity for disciplined investors.
As students of the great masters—from Ben Franklin and Ben
Graham to Warren Buffett and Peter Lynch—we’re committed to
teaching the timeless principles of successful investing using
plain language. We want you to enjoy every page of this book and
to leave these pages equipped to lay a permanent foundation for
your fi nancial in de pen dence. It is through the habit of continual
saving, the discipline of regular investment, the deployment of
fi fth- grade mathematics, the use of a collection of superior in-
vestment strategies, and the power of your imagination that you
will meet with enduring success.
What you will fi nd in this book is the unveiling of the core
strategies that have led our newsletter ser vices to beat the mar-
ket substantially. The ambitious aim of this work is to assemble
these competing investment approaches into a single strategy
that will help you take your portfolio to $1 million and beyond.
Here’s a quick peek at the per for mance of some of our invest-
ing newsletters:
R E T U R N S S & P 5 0 0 (O V E R CO M PA R A B L E P E R I O D )
Stock Advisor 53% 11%
Hidden Gems 24% 2%
Income Investor 16% 9%
Rule Breakers 11% −1%
v
i i PRE FACE
As you read, remember that the greatest investors in history
are multifaceted. They’re like the brilliant performer Frank
Miles, who at our company’s annual meeting in 2008 juggled
knives, torches, bowling balls, and stun guns—before twirling
by on a unicycle. If they were baseball hitters, they’d draw walks,
spray the ball to all fi elds, hit for power, and bunt. If they were
composers, they could play all four families of musical instru-
ments in the symphony. You see, the true master investor could
never be categorized solely as a growth or value or income or
even a domestic investor. Because the truly great investor can do
it all. So, too, we believe, can you.
Since the creation of The Motley Fool in 1993, our greatest
pleasures have come when we recognize that our work is an ad-
venture into things we cannot yet see. No one knows what’s next.
We can merely calculate the probabilities. And so, the art and the
mysteries of commerce and investing richly reward the adven-
turing spirit and the prepared mind. One meeting in New York
with the CEO of Coach has changed the fate of The Motley Fool.
We hope this book will change yours.
—David and Tom Gardner
v
A NOTE ON THE FINA NCI A LCOLL A PSE OF 20 08
OCTOBER: This is one of the peculiarly dangerous months to
speculate in stocks in. The other are July, January, September,
April, November, May, March, June, December, August, and Feb-
ruary.
—Mark Twain
O n September 29, 2008, the S&P 500 cratered 9%—the worst
single day for the broad-market index since the crash of
1987. And yet that was merely one in a series of steep declines in
2008 that wiped out more than fi ve years of market gains. In fact,
at its low, the S&P 500 touched prices unseen since May 1997.
That’s 11 years of 0% returns!
Having endured that, you may well be scratching your head
as to why you’d ever read an investment book. Who wants to buy
stocks when the market is fragile and faltering? The answer
might surprise you: Warren Buffett, the world’s greatest inves-
tor. One of our top analysts at The Motley Fool, Anand Chok-
kavelu, discovered something fascinating about Buffett. He had
around $45 billion sitting in cash at the end of 2004. And 2005.
And 2006. And 2007. In fact, at one point, Buffett had 20% of the
asset base of his company, Berkshire Hathaway, in money market
funds. But when the market crumbled, he adapted. In the four
weeks ending with October 13, Buffett put $20 billion to work in
the world of equities.
You see, for long-term investors, now is precisely the time you
should be reading an investment book and determining what to
do with your savings. But the last thing you’ll want to do is to
invest without fully understanding the risks you’re taking. The

x THE FINAN CIAL COLL APSE OF 2 0 0 8
lesson from the Mark Twain quote that leads us in to this chapter
is simple: Do not speculate (the same as the mantra of Hettie
Green, America’s fi rst female mogul investor). And so let’s stay
out of speculation mode by reviewing together exactly what hap-
pened with this market crash, and then we’ll wend our way
through the book, assembling the ideal approach for building
your everlastingly rock-solid stock portfolio.
SO, WHAT HAPPENED?
For answers, we turned to Fool analyst Matthew Argersinger.
What started out as a “subprime” mortgage problem in late 2007
quickly snowballed into a full-blown fi nancial crisis in 2008,
laying waste to multibillion-dollar investment banks like Bear
Stearns and Lehman Brothers. AIG, the largest insurer in the
world and a former Dow component, was forced to take more than
$120 billion in emergency loans from the U.S. government and to
give up 80% of its ownership equity to taxpayers just to keep its
doors open. Fannie Mae and Freddie Mac—the structurally fl awed
backbones of America’s $12 trillion home mortgage market—
imploded under massive losses. Washington Mutual became the
largest U.S. bank failure in history.
By the end of the month, the fi nancial sector was literally fall-
ing to pieces. Within days, the U.S. government abandoned CPR
techniques and reached straight for the defi brillator. When on
October 3 the U.S. Congress committed to spend up to $700 bil-
lion to purchase distressed assets and buy stakes in America’s
largest banks, the total investment by U.S. taxpayers crossed the
$1 trillion mark. That’s the largest bailout of any kind in history!
Yeesh. Just let that sink in for a moment. . . . Now that you have,
the natural question is:
i
THE FINAN CIAL COLL APSE OF 2 0 0 8 x
HOW DID IT ALL HAPPEN?
You can point to three overarching themes: cheap money, lever-
age, and greed. Let’s take ’em one by one.
Cheap Money
In general terms, sharp increases in the availability of money
can often lead to unsustainable booms in the prices of securities,
real estate, and commodities. In the wake of the economic reces-
sion that ensued after the dot-com bust and September 11, the
Federal Reserve, under then-Chairman Alan Greenspan, re-
duced interest rates to 1% and held them there for over a year.
With interest rates at historic lows, the cost of all types of loans—
mortgages, auto loans, credit cards—shrank dramatically. Cheap
money allowed homebuyers to purchase pricier houses than
they could otherwise afford while fl exing more spending muscle
at the shopping mall. At the same time, access to cheap credit
allowed public companies, as well as private equity players, to
borrow money and buy up other companies at extremely high
valuations.
In short, all of this cheap money fed higher asset prices. That
eventually contributed to a speculative boom in real estate, to
massive debt-fueled consumption on the part of consumers, and
to an explosion in leveraged buyouts.
Excess Leverage
But if money and credit were the fl ames that lit the fi res of the
credit ka-boom, excess leverage was the gasoline. As asset prices
rose and money stayed cheap, both consumers and companies
took on enormous amounts of debt. Consumers refi nanced their
houses and borrowed trillions against their homes’ equity to sat-
isfy increased spending habits. At the same time, corporations—
particularly banks and fi nancial institutions—levered up their
xi THE FINAN CIAL COLL APSE OF 2 0 0 8
balance sheets with new types of asset-driven securities and de-
rivatives. Some of these securities, like those tied to subprime
mortgages, offered extremely tantalizing yields. And most of
them—thanks to “sophisticated” fi nancial engineering and the
blessing of myopic credit agencies—came with triple-A credit
ratings. They were simply too good to pass up (and too good to be
true). Besides, the prevailing belief at the time was that housing
prices rise without interruption, always.
Greed
Underpinning all of this excessive leverage and wanton risk-
taking was pure, unadulterated greed. By the late stages of the
housing bubble, mortgage lenders like Countrywide were giving
mortgages to people who had no business buying a home. But
that didn’t matter because—under the new fi nancial securitiza-
tion schemes—new loans were simply packaged into highly rated
securities and sold off to investors. Mortgage lenders weren’t
getting paid to underwrite a good mortgage; they were being re-
warded for writing just any mortgage. On the other side of the
table, Wall Street banks like Bear Stearns and Lehman Brothers
were making a killing writing and selling securities and deriva-
tive instruments based on those dicey mortgages. And banks,
hedge funds, and insurance companies were more than happy to
lever up on these high-yielding securities to boost their returns.
Meanwhile, executives at each of these fi rms were pulling in
hundreds of millions of dollars in salaries, bonuses, and stock
options. Finally, let us not ignore that a subset of consumers
speculated in real estate to a ridiculous extreme, expecting that
they could endlessly fl ip their properties onto eager buyers at
infl ated prices.
It didn’t take long before homebuyers, having bought more
house (or houses) than they could possibly afford, simply stopped
making their monthly mortgage payments and walked away
from their properties. Suddenly, those coveted mortgage securi-
THE FINAN CIAL COLL APSE OF 2 0 0 8 xii
ties that no bank could seem to get enough of were worth a whole
lot less (some bordering on worth-less). Credit froze as banks
curtailed lending and rushed to de-lever their debt-choked bal-
ance sheets. Hedge funds that had borrowed heavily to invest in
these now defunct securities rushed to sell other stocks to meet
margin calls. Prices for all types of assets plunged. Wall Street
and the mortgage industry’s house of cards came tumbling down,
destroying trillions of dollars in stock market wealth in the pro-
cess and leading to the largest government rescue in American
history.
That’s the most succinct way we can explain what happened.
Next question . . .
WHAT IS THE FOOLISH INVESTOR TO DO?
It’s never a good feeling to see the values of 401(k) accounts,
IRAs, and brokerage accounts get thrashed. In times like this, it’s
best to take a deep breath, stop obsessing over the day-to-day
gyrations in the market, and get some perspective on the current
crisis.
Bear markets—commonly labeled as a decline in a market
index of 20% or more—emerge every fi ve years or so. The average
length of a bear market is 15 months, with an average decline of
just over 33%. As this book went to press, the S&P 500 had fallen
more than 40% from its peak back in October 2007, showing that
this bear comes from the grizzlier side of the forest.
That said, it also means—at least from a historical perspec-
tive—that, by now, we are probably most of the way through this
particular bear market. And the average bull market that rum-
bles in afterward usually lasts for fi ve years and yields 166% in
cumulative gains. So avoid the urge to sell your stocks reck-
lessly.
Better still, bear markets have a tendency to create serious
bargain prices in top quality stocks. After all, the business of
xiii THE FINAN CIAL COLL APSE OF 2 0 0 8
most public companies has nothing to do with real estate specu-
lation, and there are loads of companies that have no leverage
whatsoever. Why, we ask, should a company like Netfl ix see its
stock fall 50 percent just because bankers and a small popula-
tion of land speculators ruined their fi nancial lives through
short-term greed?
In our opinion, if you’re making regular contributions to your
brokerage portfolio or retirement account, you’re now picking up
good stocks on the cheap. If retirement is still more than a de-
cade away, and you’ve got extra cash on the sidelines that you
won’t need for the next three years or so, allocate even more
money to stocks during these tough times. Above all else, stick
with a plan and keep investing.
And while you’re at it, stay far away from companies that are
lining up for their piece of the government’s bailout package.
While companies like AIG and Citigroup spend valuable time
soaking up taxpayer money—de-leveraging their tattered bal-
ance sheets and deluding shareholders—good companies can re-
invest in their business, gobble up weakened competitors, and
grow their market share. These are the companies that will de-
liver huge rewards once the market turns and the economy gets
back on its feet.
Finally, Fools looking to make money in both bull and bear
markets should check out our Motley Fool Pro service. Using
long-short strategies and options for protection, Pro is designed
to boost your returns in up, down, fl at, and topsy-turvy markets
like 2008. You can take a look at that entire service by visiting
motleyfoolpro.com.
THE FINAN CIAL COLL APSE OF 2 0 0 8 xi
LOOKING AHEAD: HOW CAN THE FOOLISH INVESTOR AVOID THE NEXT FINANCIAL COLLAPSE?
First, it’s important to acknowledge that there will be more
credit crises and more bear markets in our future. But there are
some important warning signs and crucial steps we can take to
prepare our portfolios for the eventual calamities.
Focus on living within your means. Most of the people who
found themselves in the direst of straits in 2008 are those who
spent themselves silly and ended up with too much credit card
debt and mortgages worth more than the value of their homes.
Setting a reasonable budget and keeping a rainy-day savings ac-
count handy will keep you investing in the market and prevent
you from having to dip into your retirement accounts at the
worst possible times.
Watch out for excessive leverage. Right before its collapse, Le-
hman Brothers’ assets-to-equity ratio (a common measure of le-
verage for fi nancial companies) was 25 to 1. AIG’s was 11 to 1.
Compare that to Berkshire Hathaway’s ratio of 2 to 1. Stick to
companies that have low assets-to-equity and low debt-to-equity
ratios, and high interest-coverage ratios.
Be skeptical of long periods of low volatility. How volatile has
2008 been in the markets? Think back to the most terrifying
roller coaster ride you’ve ever been on. Now multiply that experi-
ence by 10. So far, there have been a total of 37 days when the
market closed up or down by more than 2%—and that doesn’t
count intraday moves of that magnitude. In 2007, there were just
17 such days. In 2006, there were only two such days. Like the
calm before a storm, persistently low volatility markets are strong
signals of complacency among investors and markets. That’s usu-
ally a signal that stormy waters might be just around the bend.
Look out for bubbles. Market bubbles are crystal clear in
hindsight, but difficult to spot when infl ating. Yet you might
v
x THE FINAN CIAL COLL APSE OF 2 0 0 8
have had at least an inkling that things had reached silly propor-
tions when profi tless dot-com companies were awarded billion-
dollar valuations in the late ’90s, or when hundreds of people
camped outside during the real estate boom just to get a shot at
the latest luxury condo offering. When your next door neighbor
or coworker starts boasting about the latest can’t-lose, get-rich-
quick scheme, it’s time to get skeptical. Stick to a steady invest-
ment plan and don’t chase hype.
Stick with great companies with little to no leverage. Great
companies will survive and thrive through any market cycle.
This book will help you fi nd them.
And now, let’s start assembling your portfolio for the future!
v

CH A PTER 1
GETTING STARTED
Americans make three primary investment mistakes.
A startlingly large portion of our populace stands on the
market’s sidelines forever, missing out on the greatest builder
of wealth available to the average (law- abiding) citizen. Many
Americans just never save—or invest—anything. This is the great-
est mistake of all. No matter your age, the best time to start in-
vesting is now.
The second biggest investment mistake is waiting too long to
start. It turns out that fi nancial in de pen dence can’t be achieved
as quickly as everything else in our lives: 90 seconds in the micro-
wave oven, one- click buying on a Web site, or speed dial on our
mobile phone.
The third biggest investment mistake is the subject of this
book. People with this affliction might have money put away and
may have purchased some mutual funds and even a few stocks.
They’ve recognized the value of getting started, allowing the
returns to compound over time. They make us proud. But they
often have one tragic fl aw: They are wildly unsuccessful pickers
of stocks.

2 THE MOTLE Y FOOL MILLION D OLL AR PORTFOLIO
PICKING GOOD STOCKS
Investors often pick the wrong stocks and build the wrong kind
of portfolio. They lack any coherent strategy. When the stocks
they buy inevitably drop—at least temporarily—these folks cash
out their shares and take a loss, running from the market alto-
gether. Or they invest in bad stocks and stay with them for too
long, “just hoping to get back to even.” These strategies combine
the damaging elements of desperation, blind optimism, and greed.
But even the most comically inept investor is in a far better
situation than the non- investor or the late- comer. Because while
the fi rst two groups need to undergo a near- religious conversion
before they see the light, a bad investor just needs a bit of strat-
egy and guidance to accompany an existing practice and pas-
sion. This stuff is eminently teachable. It’s what this book is for.
Think about how hard it is for many of us to get past those
fi rst two mistakes. The odds are stacked against an early start at
successful investing. Most Americans begin their professional
careers saddled with credit card debt and student loans while
trying to pay for all that life entails, often on a relatively small
starting wage. There’s not a lot of cash fl oating around.
And even in the unlikely event that their couch cushions were
overfl owing with $20 bills, most people wouldn’t know how to
properly put the found money to the best possible use. Our high
schools and universities have failed miserably to educate their
students about how or why to invest. For the most part, no one
has stressed the importance of saving and the value of investing,
so they wander relatively blindly (or at least shortsightedly).
These are thorny, sometimes seemingly insurmountable is-
sues and we by no means intend to belittle or gloss over them. In
fact, previous Motley Fool books and countless Fool .com articles
have provided advice and step- by- step guidance on how to work
through them. That’s our mission.
Once you’re ready, we’re here to inspire you to not only invest,
but to invest well. There are two components to investing well:
G E T TING S TARTE D 3
First, you have to choose the right stocks and second, you need a
strategy for putting those stocks together in a smart, balanced
way. This book shows you how to do both.
Before we get to that, though, there’s one principle you must
embrace.
NO ONE’S PERFECT
In order to succeed, you must fi rst accept that you will fail. Great
investors pick stocks that lose to the market at least one time out
of fi ve. It’s a lot like basketball free throws—Michael Jordan, ar-
guably the game’s greatest player of all time, shot just a bit over
80% from the line over his career.
Chances are, you’re not the Michael Jordan of the investing
world, at least not just yet, so it’s essential to set realistic expec-
tations, to know ahead of time that you’re regularly going to
miss—especially at the outset. Expect that even if you get to be
very good, and that’s if you’re very, very good, you’ll still be
wrong 20% of the time. If you’re just starting out, plan on being
wrong half the time as a simple baseline from which to improve.
Yes, that’s right, half the time. But don’t be discouraged. To
mix our sports meta phors, you’ll be batting .500. That would get
you your very own wing in the Hall of Fame!
12 STOCKS
This book is about picking great stocks. We’re writing it in order
to improve your ability to pick winners and avoid losers. But
perhaps even more important, it’s about how to put those stocks
together in a portfolio that will see you through good times and
bad, a portfolio that will grow. And grow and grow. Our goal is
simple—we want to help you to develop your own $1 million
portfolio.
To that end, we’d like to start our journey together with a
4 THE MOTLE Y FOOL MILLION D OLL AR PORTFOLIO
challenge: Buy at least 12 stocks. That’s right. Not just one stock
that your uncle claims can’t miss. Not a couple bets on two num-
bers at Atlantic City. Not three equities for your IRA, four tech
stocks, or fi ve Dow Jones Industrials heavyweights. At least 12.
Why 12?
First, you are diversifying meaningfully. You are condition-
ing yourself from the shock of a few losers. And you will have a
few losers. But you’ll have a few winners, too, and in many cases,
your winners will more than make up for your losers. Why? Be-
cause stocks can only lose 100%, yet there’s no limit to how high
they can climb. As you spread your dollars across a manageable
number of your best ideas, you will plink down your money,
watch your stocks, learn more about them as you monitor their
per for mance, and enjoy a fi rst- year gain or loss comparable to
the market averages. You will probably not double your money
right away. (Sorry.) You will also not lose most or all of what you
invested.
What we guarantee you will do by buying and holding 12
stocks for a minimum of one year is condition yourself to be pa-
tient. And by watching and learning, you will have cleared the
fi rst hurdle that truly bedev ils fi rst- time investors. You will have
actually invested. If you don’t know where to start—how to open
a brokerage account, how to buy a stock, how to get over that
wave of nausea when you are trying to commit to that fi rst pur-
chase—visit us at mdpbook .com, a special area of our site just for
readers of this book. We’ll be happy to answer your questions on
our message boards and do what ever we can to guide you through
the world of investing. Above all, we want you to consider your-
self an investor for life.
THE 12-STOCK ASSIGNMENT
Obviously, it’s not about guesswork, or just buying stock in the
company whose ticker happens to share your initials. Investing
is a sometimes successful, occasionally confounding, continuously
G E T TING S TARTE D 5
fascinating exercise in learning about yourself. By diversifying
and learning from your successes and failures, you will discover
the investing strategy that best suits you. You might fi nd more
than one.
This book is or ga nized around a series of distinct invest-
ment strategies, and some companies that exemplify each ap-
proach. We’ll start by showing you how to choose your fi rst
stock. (If you’re already investing, feel free to skip ahead to
Chapter 4 and dive in to our fi rst strategy.) Then we’ll move on
to how to invest in dividend- paying stocks—companies that
send us a check just for buying shares. Next we’ll turn our at-
tention to the blue- chip companies that reside in the calm wa-
ters of value investing, where we aim to buy great companies on
sale. We’ll devote a chapter to small caps, the little wonders
that hopefully will turn into the monster companies of tomor-
row. We’ll look at Rule Breakers, those businesses that are chal-
lenging the conventional wisdom and changing the way we live.
And we’ll travel the globe to look at the international investing
arena, an incredibly rich and diverse collection of stocks that
includes representatives from each of the strategies.
Each one, practiced well, can and does beat the market. But
each also uniquely attracts and repels different investors with
their varying psychologies, tolerances for risk and loss, time ho-
rizons, and degrees of interest and engagement. As you read
through the chapters, it’s quite possible that one approach will
seem more compelling, and one may just not seem to fi t with your
temperament, time line, or fi nancial goals.
We encourage you to read with an open mind. While you
might think you’re one sort of an investor, as a wise man once
wrote, there’s no better way to fi gure out the color of your para-
chute than by doing lots of skydiving.
For some of you, this book will act as the beginning of your
journey in investing. For those who are already experienced in-
vestors, it will enhance your understanding of investing, and
perhaps open your eyes to new strategies to deploy in your port-
folio.
6 THE MOTLE Y FOOL MILLION D OLL AR PORTFOLIO
BEYOND THESE PAGES
If this isn’t the fi rst investment book you’ve read, you’ve probably
noticed how the subject matter of the books that live on these
shelves in the bookstore (or, more likely, on the same tab of the
online shopping outlet) stays the same. If you happen to pick up
the book two years later, it’s going to focus on the same stock,
provide the same analysis, and reach the same conclusions.
Paper as a medium enjoys a certain permanence and depend-
ability that is not really the friend of the investor. We love Peter
Lynch (a prominent member of the investing world’s Mt. Rush-
more) and his books as much as the next Fool, but even we admit
that his superb stories about his lucrative investment in the Pep
Boys (Manny, Moe, and Jack) get a bit less helpful with each
passing year. We wonder, for instance, what Lynch might have
thought of former CEO Jeff Rachor, who in 2007 was paid more
than $17 million in total compensation before leaving the com-
pany after only a year. As of this writing, the market value of Pep
Boys sits at less than $500 million, which means that Rachor ex-
tracted more than 3% of the company’s total value just in his an-
nual executive take. Would Lynch still like that stock? We’d guess
not. Yet it’s still featured in his great book.
We’ve written a few investment books ourselves, and don’t want
to put readers in this same state of nostalgic confusion anymore.
Thankfully, there’s this thing called the Internet. There’s this
Web site called The Motley Fool at fool .com. And now there’s a
special part of our Web site—mdpbook.com—accessible only to
readers of this book, where we will provide updated information
as well as our favorite stock ideas from each strategy in this book
on an ongoing basis.
This book may look like just a book, but we promise you that
it is far more. No matter how experienced an investor you are, it
represents one giant step down the lifelong, lucrative path of suc-
cessful investing. We plan to walk beside you as you go, in these
pages and online.
CH A PTER 2
WHY GREAT INVESTORS ARE ODD
The temptation at this point is to start talking stocks.
We hunger to ask if you think Netfl ix will become a domi-
nant media company or technology roadkill. Can Apple fl ourish
if Steve Jobs isn’t at its helm? How will Howard Schultz fi x his
beloved Starbucks? What’s the future for alternative energy?
Our homes have been fi lled for de cades with debates over
which industries will fl ourish and falter, which companies will
succeed and fail, which leaders are gods or goats, which stocks
will win or lose. It’s in our nature to get right into it all now, to
initiate the debate. The problem is that if we don’t fi rst offer up a
warning, all that talk won’t lead to great investment results. In
fact, it could lead to despair.
So, here’s the warning, which Motley Fool investment experts
Tim Hanson and Buck Hartzell spend much of their time study-
ing, teaching, and writing about for us.
WARNING: Your brain is likely to make it very difficult for
you to succeed as an investor.
That’s right. The very brain that’s going to help you pro cess
8 THE MOTLE Y FOOL MILLION D OLL AR PORTFOLIO
this book could be the force that undoes your portfolio. The brain
that will be analyzing companies, strategies, management teams,
and fi nancial statements could also lead you to subpar invest-
ment results. Unchecked, your brain will cause you to:
1. Buy and sell stocks at the wrong times
2. Overestimate your ability to beat the market
3. Trade maniacally in search of the big winner
4. Focus on the evidence that supports your conclusions
5. Discard evidence that does not
Each of these faults is hardwired into our intellects, a fact
that has been revealed by recent studies in a fascinating new
fi eld called behavioral fi nance. There are entire books devoted to
the topic (we recommend Jason Zweig’s Your Money & Your
Brain, Nassim Taleb’s Fooled By Randomness, and Gary Bel-
sky’s Why Smart People Make Big Money Mistakes—and How
to Correct Them). But the purpose of this interlude is to help you
work on your investing temperament as much as you do your in-
vesting philosophy and stock selection.
THE LOGIC OF PATIENCE
You may be wondering, if you reliably pick winning stocks, why
it would matter when you buy and sell them or when you add
new money to the market? Maybe you’ve also read ad nauseam
that you should buy to hold, keep the frictional costs of taxes and
trading to a minimum, be willing to buy more (rather than sell)
when your favorite stocks decline in price, and focus on long- term
fundamentals rather than short- term market machinations.
But can you actually do it?
It’s an important question. When master investor Warren Buf-
fett was asked by a group of business school students early in
2008 why so few people have been able to emulate his success—
despite the tomes that have been written dissecting his investing
WHY G RE AT INVES TOR S ARE ODD 9
philosophy—Buffett responded, “The reason gets down to tem-
perament. People want to make money fast, but it doesn’t happen
that way.”
Put simply, there is no way—not one described in this book,
not one you can order from a tele vi sion infomercial, and cer-
tainly not one color- coded in a pre sen ta tion at your local airport
Hilton—to get rich quick in the stock market. When the greatest
investor in American history says, “it doesn’t happen that way,”
it’s smart to listen. Successful investing takes time. Years and
years. Even de cades. That’s why one of the most important les-
sons we can teach you (before we get to any of the strategies that
have helped us beat the market for years) is the lesson of pa-
tience.
THE ECSTASY OF THE AGONY
The problem is that we human beings are not predisposed to be-
ing patient. What’s more, thanks to legacy behaviors from our
cave- dwelling days, we’re also naturally loss- averse and more
inclined to shoot fi rst and ask questions later.
These are not the traits of a world- class investor.
Of course, this all makes sense in context. Early humans
didn’t have long life spans. We were lucky to live from day to day.
And we were rewarded (through survival) for running from
threats rather than sticking around to investigate their intrica-
cies. It didn’t matter how many teeth a tiger had, how sharp they
were, or how deep an incision they might make if you weren’t
around to tell anyone about it. Of course, we no longer live in
that world. And when it comes to stock investing, these primal
tendencies create enormous headwinds against our success.
Consider this. Psychologists Amos Tversky and Daniel Kah-
neman (who later won a Nobel Prize for their groundbreaking
work) proved that monetary losses hurt us emotionally to a far
greater magnitude than monetary gains please us. Now add to
those fi ndings what Jason Zweig wrote in Your Money & Your
10 THE MOTLE Y FOOL MILLION D OLL AR PORTFOLIO
Brain: “Your investing brain comes equipped with a biological
mechanism that is more aroused when you anticipate a profi t
than when you actually get one.”
Put these remarkable truths together and what you’ll discover
about most investors is that we’re predisposed to chasing the
next big thing. We fear losing, so we recklessly trade out of posi-
tions. And yet this suboptimal strategy satisfi es our psyche be-
cause it allows us to both forget about losers (by selling them)
and then to take frequent pleasures in buying new stocks that we
believe will be big winners. Sadly, it doesn’t matter to our brains
if these stocks subsequently rise or fall 50%. Our brain enjoyed a
chemical jolt of happiness simply by buying them. And it will do
so each time we repeat the pro cess.
Market data bears out this conclusion. Berkeley fi nance profes-
sor Terrance Odean found in a study of trading patterns that in-
vestors today have a median holding period of just 113 days. That’s
short—really short. (Remember that Warren Buffett’s preferred
holding period is “forever.”) That 113 days is 90% shorter than the
minimum three- to- fi ve- year holding period you’ll see us recom-
mending over and over again in this book and at Fool .com.
The effect of all that active trading is to meaningfully reduce
the total returns of your portfolio. The only people who will reli-
ably make money here are the trading houses who get paid per
transaction (and who, not coincidentally, will give you all sorts of
rewards to lure you into that active trading!). Tragically, all of
those mistaken actions were supported by the most powerful
muscle in your body: your brain.
ON BEING FOOLISH
The longer that you invest, the more you will come to see that the
most profi table way to buy stocks is to do so with a long view. It
can be tough. It goes against the very chemistry of your brain.
When you actually have money in the market, you will—because
of your noggin—fi nd yourself doubting your research conclu-
WHY G RE AT INVES TOR S ARE ODD 11
sions when your stocks fall. After all, in the stock market as in
the schoolyard, it’s far easier to take the consensus position. And
here comes your second problem. Your brain will feel far better
if it yields to the general consensus. You won’t be called odd, you
won’t be singled out as a failure, and perhaps most importantly,
if you do end up being wrong, you won’t have to exclusively
blame yourself. This can cause real problems.
It’s critical to know that the consensus sentiment surrounding
a stock does not always refl ect the value of the share of the busi-
ness. Our friend, money manager Ron Muhlenkamp, is fond of
pointing out that high- profi le stocks like General Electric will
trade for a hundred or more different prices on any given day.
Did the company’s value really change that often in one day? Of
course not. And it’s by tuning out the noise of those frequent
transactions that you can separate the “game of the stock mar-
ket” from the “business of investing.” It’s the latter where you
fi nd people like Warren Buffett, who has made serious money by
buying great businesses at fair prices for 5–15 years or more.
This, however, ain’t easy. And that’s why history has so few
truly great investors despite the enormous sums of money that
are invested in the stock market. Those who are truly great are
able to go against the tendencies of their brain to conform their
temperaments to the demands of the stock market. These folks
are aberrations. They are, for lack of a better word, odd—or as
we prefer to say, Foolish.
One of those oddballs, Seth Klarman of investment fi rm Baupost
Group, told a room of MIT students in a recent speech that “Inves-
tors unfortunately face enormous pressure—both real pressure
from their anxious clients and their con sul tants as well as imag-
ined pressure emanating from their own adrenaline, ego, and
fear—to deliver strong near- term results. Even though this pres-
sure greatly distracts investors from a long- term orientation and
may, in fact, be anathema to good long- term per for mance, there
is no easy way to reduce it.”
If Mr. Klarman feels these pressures despite his sterling,
de cades- long track record, then there’s little chance individual
12 THE MOTLE Y FOOL MILLION D OLL AR PORTFOLIO
investors will instantly master the temperament needed to han-
dle them. Again, this stuff isn’t easy. It demands deliberate effort.
It demands discipline. It demands that you take the long view.
Teach yourself to rely on reason and logic rather than emotion
and reaction.
LET REALITY SET IN
As we now move toward chapters in which we unveil our entire
investment approach—across multiple strategies, and in pursuit
of superior returns around the world—you must let the reality
settle in that your brain, untrained, can get you into a good deal
of investing trouble.
Don’t misunderstand this. We are fi rm in our belief that the
clearest route to your fi nancial in de pen dence—to a million- dollar
portfolio and beyond!—is through the patient analysis and
repeated purchase of common stocks. But you—and we—must
continually work on the brain, disciplining it against its base
instincts. Because even if you’re an individual investor with only
two clients—you and your spouse—you will face internal and
external pressures similar to those Seth Klarman talked about
with the MIT students. You have the same mental make- up,
which means your brain will constantly want you to cut your
losses, pursue new and bigger opportunities, and let emotion in-
fl uence your research. While that’s normal, remember that you
want to be abnormal. To succeed, you must go contrary to your
nature. To be great, you need to be odd.
These are just a few of the mental challenges you’ll face as an
individual investor. Rest assured, there are many more. So commit
now to working as diligently on managing your temperament as
you do on picking stocks. That means reading articles on the sub-
ject and maybe a few of the books we noted above, as well as those
in our reference section. It means being passionate about being
dispassionate, as well as making good mental notes about your
biases, feelings, and the frequency with which you buy and sell

WHY G RE AT INVES TOR S ARE ODD 13
stocks in real time. That’s because the best counter to your brain,
memory, and emotion is data uncolored by eventual outcomes.
Finally, know that even if you do reliably pick great stocks,
you can undermine all of your hard work by buying and selling
them too often. That’s why we’ve placed this chapter as a speed
bump before we head out onto the highway of investing together.
We now will explore the timeless principles of superior in-
vesting that will lead us toward the greatest companies and
stocks to own for the future. With your temperament in training,
let’s get cracking!
CH A PTER 3
YOUR FIRST STOCK
If you have the time, ability, and interest, individual stock in-
vesting is the single best way to build your own million- dollar
portfolio. You’re the best person to build a portfolio that most ac-
curately refl ects your time line and risk tolerance. What’s more,
stock investing, because it’s active, forces you to track your per-
for mance, mea sure it, and adjust your savings and investing plan
from time to time in order to meet your long- term goals.
The old—yet applicable—saw here is “Out of sight, out of
mind.” If you don’t stay on top of your investments, you will lose
sight of them. You won’t know if you’re saving too much, or not
enough, or if your investment dollars are drastically underper-
forming your expectations.
Now, that does not mean you should be an active stock trader.
Far from it. The best way to earn a fortune in the stock market is
to be a patient long- term own er of high- quality companies. War-
ren Buffett has said that he’d be a richer man today if he’d never
sold a single share of stock—and he started investing at age 11!
That’s not only because the market moves in fi ts and starts and
YOUR FIR S T S TOCK 15
can take years to ascribe to even the highest- quality companies
their fair value, but also because buying to hold reduces the fric-
tional costs of taxes and trading that can severely hamper
long- term returns.
Some basic math here is illustrative. Let’s say you start with
$1,000 and it costs you $10 to invest it all in a single company.
The stock you choose then goes on to earn a mediocre 7% per
year for the next 30 years. When you sell three de cades later,
your $1,000 will have become $7,043, and you’ll pocket $6,137
after paying Uncle Sam your long- term capital gains tax bill,
which for most investors is 15%.
Now let’s say you pay $10 to invest that same $1,000 in a stock
that returns 12% in its fi rst year. But then you decide to sell
(paying another $10 plus higher short- term capital gains taxes)
and buy another stock (paying another $10 to trade). It too earns
12% per year. But then you decide to sell and buy again.
Keep up this activity for the next 30 years, and remarkably,
you will have turned your $1,000 into just $3,073 for an effective
3.8% annual return even though you thought you were outper-
forming that mediocre stock by 5 percentage points annually.
That’s an example of how much taxes and trading costs can
hurt, and it’s one of the main reasons we advise all investors to
buy to hold. Besides, you are much more likely to fi nd one stock
that averages a 7% per year return for 30 years than you are to
fi nd 30 stocks that each return 12% in the year that you own
them.
You’d need to fi nd a stock that does way better than 12% to
make any sort of rapid trading strategy worth your time and
effort. In fact, according to a 2006 research report from Charles
Schwab, an investor who sells a stock and pays short- term cap-
ital gains taxes must fi nd a stock that outperforms the old stock
by 21.2 percentage points just to offset the taxes! In our exam-
ple above, you’d have to earn approximately 48% annually to
match the 30- year returns of our seemingly mediocre—yet tax-
and trading- cost- efficient—7% annual gainer. To put that in
16 THE MOTLE Y FOOL MILLION D OLL AR PORTFOLIO
perspective, if you can keep up 30% annual returns for three
de cades, you will be lauded as the greatest investor who has
ever lived.
Is that you?
If it isn’t—and there’s no shame in not being the greatest in-
vestor who has ever lived—then you should buy to hold for an
average holding period of three to fi ve years.
FINDING YOUR FIRST STOCK
We’ve found that the best advice for someone getting started in-
vesting is Peter Lynch’s famous maxim to “Buy what you know”—
even if it is often misquoted, taken out of context, and altogether
fl awed. Because here’s the thing about your fi rst stock pick: It
doesn’t have to go up in order to have been a success.
Sound crazy? It isn’t.
The primary goal of your fi rst stock is to get you started and
learning about investing. Above all, this fi rst stock must:
1. Be interesting to you
2. Have fi nancials and a business strategy you understand
3. Be a company you’ll enjoy following and talking about
with fellow investors
You’re going to be spending a lot of time getting to know your
fi rst stock pick, so you might as well enjoy it.
So back to “buy what you know.”
If you don’t know Peter Lynch, he’s probably the world’s
second- most famous investor (behind the aforementioned War-
ren Buffett). As the manager of Fidelity’s Magellan fund from
1977 to 1990, he earned 29% annual returns (which is why we
said earlier that if you could keep up 30% for 30 years you’d be
the greatest investor who has ever lived). He’s also written sev-
eral fantastic books on investing, is a nice guy, and continues to
work for Fidelity as a research con sul tant.
YOUR FIR S T S TOCK 17
One of his most famous stock purchases—and one that he writes
about in his book One Up on Wall Street—was Hanes. He found
the company when his wife, Carolyn, raved about its new panty-
hose, L’eggs, which were department- store quality but available
in the supermarket. Thanks to this idea and many others, Lynch
calls Carolyn one of his best sources for investing ideas.
Lynch refers to this “buy what you know” tack as “the power
of common knowledge,” and he believes it’s one of the most sig-
nifi cant advantages individual investors have over Wall Street
investors who spend way too much time at the office and why our
online community is so powerful.
While we agree with that 100%, it’s important to note that
Lynch didn’t just buy Hanes because it had a hot product. After
getting the tip from Carolyn, he did thorough fundamental
research to determine the fi nancial strength, growth potential,
quality of management, and so on of the underlying company.
While many folks remember how Lynch stumbled across
Hanes, they don’t know all of the reasons he decided to buy. It’s for
this reason that he updated One Up on Wall Street with an intro-
duction that warns “Peter Lynch doesn’t advise you to buy stock
in your favorite store just because you like shopping in the store. . . .
Never invest in any company before you’ve done the homework.”
We agree with that, too.
In other words, start with “buy what you know,” but don’t
stop there. With your fi rst stock—with every stock—do what ever
research is necessary to understand what you’re buying, why
you’re buying it, how much you’re paying, and what could cause
you to sell.
That’s getting somewhat ahead of ourselves, so let’s start with
a critical question: What do you know?
Think of the public companies you encounter every day. Make
a mental list. If you’re like most normal people, you’ll immedi-
ately start thinking of retailers, restaurants, and Web sites such
as Wal- Mart, McDonald’s, and Google. If you’re like David, your
list will also include video game makers such as Activision. If
you’re not sure if a company you know is public or not, look up its
18 THE MOTLE Y FOOL MILLION D OLL AR PORTFOLIO
Web site. If it is a public company, it will provide a link to its
stock price and investor relations Web site.
Now, although David’s Activision pick may seem strange to
non- gamers, it’s actually a great example of a company you can
“know” that Wall Street won’t. Unlike the others mentioned,
when David recommended Activision back in September 2002, it
was small and unknown to many investors. But—and this is the
important point—its Tony Hawk, Doom, and Spiderman video
game franchises were known to him.
Activision has since more than tripled and David did even
better (to the tune of 600% returns) by buying more shares of the
stock after the market oversold it six months later.
That’s the real power in buying what you know. So rather
than making a quick list of obvious companies that pop into your
head, consider keeping a pad with you for a few days and record-
ing all of the companies you encounter each time you encounter
them. A day could start something like this:
M O N D A Y M O R N I N G
Woke up. Ate a Nutrigrain bar. My child asked for a glass
of Tropicana orange juice. Brushed my teeth with Colgate
toothpaste. Got dressed in Anthropologie shirt and Hol-
lister jeans. Got in my Toyota Camry and drove to work,
stopping for breakfast at McDonald’s along the way. Got to
work, where I used Microsoft Windows on a Dell computer.
Thought again about getting a BlackBerry because every-
one has them!
That may seem excessive, but if you stick with it, some good
ideas will materialize. In this example, you’ll trace Nutrigrain
back to Kellogg, Tropicana to PepsiCo, Colgate to Colgate-
Palmolive, Hollister to Abercrombie & Fitch, BlackBerry to
Research In Motion, and Toyota, Starbucks, Microsoft, and Dell
to their namesake companies.
What’s more, if you had done this exercise and come up with
YOUR FIR S T S TOCK 19
this list fi ve years ago—a reasonable possibility for any con-
sumer—and decided on BlackBerry- maker Research In Motion
because your fellow employees were all early adopters, you’d
be up roughly 5,000%. That would have turned a $5,000 invest-
ment into roughly $250,000—taking you a long way toward a $1
million portfolio right there. That said, if you’d picked Dell,
you’d be down 40%. In other words, “buy what you know”
won’t necessarily get you anywhere . . . which is why there are
more chapters to this book. But to identify the best ideas, you
need to keep track. And if something keeps popping up again
and again, make a special note of that. You might be on to
something big.
Now, there will be cases where a product or store concept isn’t
public itself, but is owned by a parent company that is. These
lineages can be more difficult to trace, though a quick Google
search will usually point you in the right direction. Many “hip”
brands may shiver at the thought of disclosing to their customers
that they are actually owned by a cadre of wing tip–wearing old
men. Take Anthropologie, for example, which is a favorite re-
tailer of many of the women in our office. Its site doesn’t provide
any clue that it’s owned and operated by publicly traded Urban
Outfi tters. Perhaps unsurprisingly, neither does Urban Outfi t-
ters’s retail site.
You need to fi nd your way to a separate URL, urbanoutfi tters
inc .com, to get shareholder information on the company—which
also owns Free People and Terrain.
There’s also no sign on the Vitamin Water Web site that its
manufacturer, Glacéau, is a subsidiary of Coca- Cola, and Blue
Moon Brewing doesn’t exactly announce that it is owned by con-
glomerate Molson Coors. In fact, the Blue Moon Web site goes out
of its way to give the impression that Blue Moon Brewing is actu-
ally an in de pen dent craft brewer.
Alas, to invest successfully, you must be a detective. Just as
some companies work to hide their own ership of brands designed
to appeal to more in de pen dent- minded consumers, those same
20 THE MOTLE Y FOOL MILLION D OLL AR PORTFOLIO
companies may often work to hide from shareholders their
operational difficulties, the details of their compensation plans,
or their strategies for the future. That’s an unfortunate fact of
investing, but one that rewards the diligent investor.
The good news is that everything you need to know is readily
available online. One simple step is to try plugging the compa-
ny’s name and the term “investor relations” into your Google
search. Check beyond the fi rst page of search results if nothing
good materializes right away.
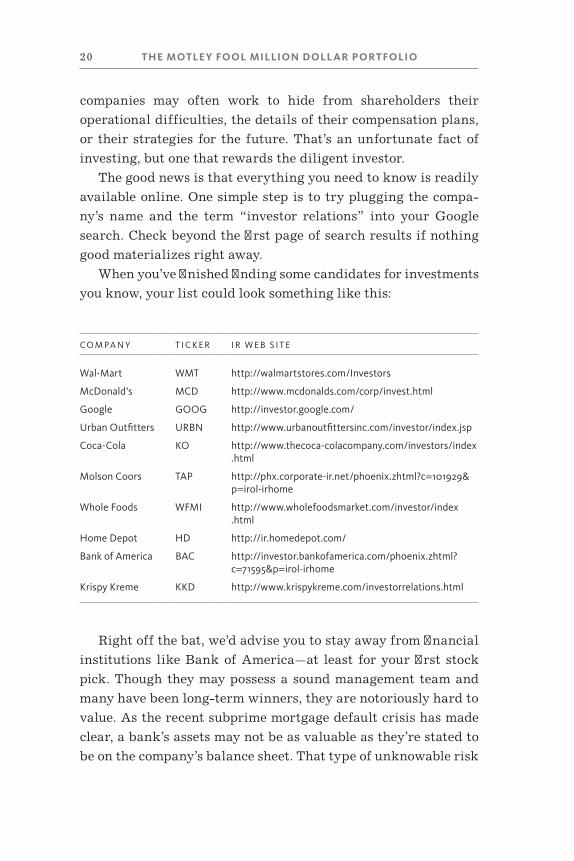
When you’ve fi nished fi nding some candidates for investments
you know, your list could look something like this:
CO M PA N Y T I C K E R I R W E B S I T E
Wal- Mart WMT http:// walmartstores .com/ Investors
McDonald’s MCD http:// www .mcdonalds .com/ corp/ invest .html
Google GOOG http:// investor .google .com/
Urban Outfi tters URBN http:// www .urbanoutfi ttersinc .com/ investor/ index .jsp
Coca- Cola KO http:// www .thecoca -colacompany .com/ investors/ index .html
Molson Coors TAP http:// phx .corporate -ir .net/ phoenix .zhtml ?c=101929 & p=irol -irhome
Whole Foods WFMI http:// www .wholefoodsmarket .com/ investor/ index .html
Home Depot HD http:// ir .homedepot .com/
Bank of America BAC http:// investor .bankofamerica .com/ phoenix .zhtml ?c=71595 & p=irol -irhome
Krispy Kreme KKD http:// www .krispykreme .com/ investorrelations .html
Right off the bat, we’d advise you to stay away from fi nancial
institutions like Bank of America—at least for your fi rst stock
pick. Though they may possess a sound management team and
many have been long- term winners, they are notoriously hard to
value. As the recent subprime mortgage default crisis has made
clear, a bank’s assets may not be as valuable as they’re stated to
be on the company’s balance sheet. That type of unknowable risk
YOUR FIR S T S TOCK 21
can sabotage even the most experienced investors, so stay away
for now.
Lest this sink your ego, know that even the universally admired
Warren Buffett has what he calls a “too hard” pile. Anything he
doesn’t understand, can’t analyze, or can’t trust goes in there, and
he’s said that that’s one of the reasons he didn’t participate in the
Internet stock boom of the late 1990s (or the resulting bust).
After sticking Bank of America or any other fi nancial institu-
tion in our own “too hard” pile, we’re left with nine fairly friendly
and consumer- facing fi rms. Excellent.
PICKING YOUR FIRST STOCK
You are going to read a lot in this book about ways to analyze dif-
ferent types of companies—big ones and small ones, retailers and
banks, money losers and money makers, and foreign and domestic
stocks. When it comes to picking your fi rst stock, the key is to limit
your downside surprises. Hopefully, this section will give you a
few important points of reference and some tools to analyze them.
Our methodology is governed by another pearl of wisdom
from the exceptionally quotable Warren Buffett. He said, “It’s
far better to buy a wonderful company at a fair price than a fair
company at a wonderful price.” In other words, focus on fi nding
a wonderful company for your fi rst stock rather than a ridicu-
lously cheap stock.
Now, in some sense, this dichotomy is false. In the stock market,
you’re occasionally able to buy wonderful companies at wonderful
prices. For example, Apple, a company you most defi nitely “know,”
was selling for $7 per share in December 2002. At that time, the
company had nearly $6 per share in cash. That means you were
buying the business—a business that would go on to enormous suc-
cess with the iPod and iPhone—for just $1 per share. Even if you
don’t know a lick about valuation, you can tell that was a pretty
good price. Today, Apple trades for around $100 per share.
22 THE MOTLE Y FOOL MILLION D OLL AR PORTFOLIO
Given that enormous return potential, we should all be on the
lookout for wonderful companies at wonderful prices. But op-
portunities like those aren’t necessarily available on a daily ba-
sis. And while Ron Muhlenkamp has said you can turn even the
best company into a bad investment by paying the wrong price,
we’re going to start with a few ways to fi nd a wonderful company
regardless of the price. It’s a good place to start and, at the very
least, half the battle of investing.
So what makes for a wonderful company? If we’re going to
borrow from Warren Buffett’s ideology, we might as well start
with his pa ram e ters. Though Buffett is loath to disclose individ-
ual stock picks, he is happy to share his methodologies.
For example, in his 2007 Berkshire Hathaway annual report,
Buffett wrote about the traits he looks for in any acquisition.
They are:
1. At least $75 million in pre- tax earnings
2. Consistent earnings growth
3. Good return on equity
4. Manageable or no debt
5. Quality management that’s committed to the company
6. A simple business model
Let’s break them down one by one. If at any time in this
chapter— or anywhere else in this book—you encounter a term
you don’t recognize, simply visit www.fl ossary.com for our glos-
sary of fi nancial, business, and investing terms.
1. AT LEAST $75 MILLION IN PRE- TAX EARNINGS
Here, Buffett is looking simply for size. Given that Berkshire
Hathaway is an enormous conglomerate, it’s not worth his time
to purchase any fi rm that won’t have a meaningful impact on his
bottom line. As an individual investor, you don’t necessarily need
YOUR FIR S T S TOCK 23
to demand at least $75 million in pre- tax earnings, but we’d
suggest you require at the very least a positive number and, go-
ing a half- step further, earnings that have been positive for some
time.
Like Buffett, you don’t need to waste your time with compa-
nies that “hope” to be successful—particularly since this is your
fi rst stock. Profi tability—even better is consistent profi tability—
means that you’re already dealing with a proven business.
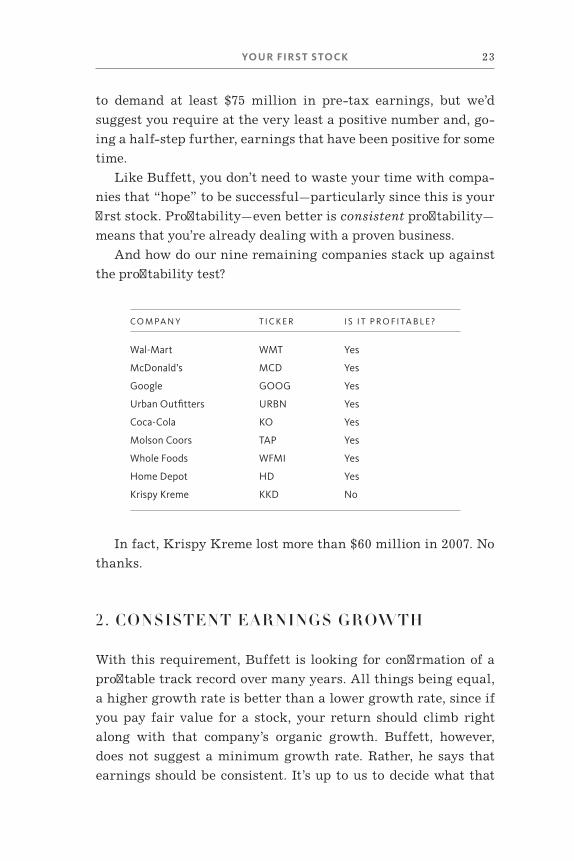
And how do our nine remaining companies stack up against
the profi tability test?
In fact, Krispy Kreme lost more than $60 million in 2007. No
thanks.
2. CONSISTENT EARNINGS GROWTH
With this requirement, Buffett is looking for confi rmation of a
profi table track record over many years. All things being equal,
a higher growth rate is better than a lower growth rate, since if
you pay fair value for a stock, your return should climb right
along with that company’s organic growth. Buffett, however,
does not suggest a minimum growth rate. Rather, he says that
earnings should be consistent. It’s up to us to decide what that
CO M PA N Y T I C K E R I S I T P R O F I TA B L E ?
Wal- Mart WMT Yes
McDonald’s MCD Yes
Google GOOG Yes
Urban Outfi tters URBN Yes
Coca- Cola KO Yes
Molson Coors TAP Yes
Whole Foods WFMI Yes
Home Depot HD Yes
Krispy Kreme KKD No
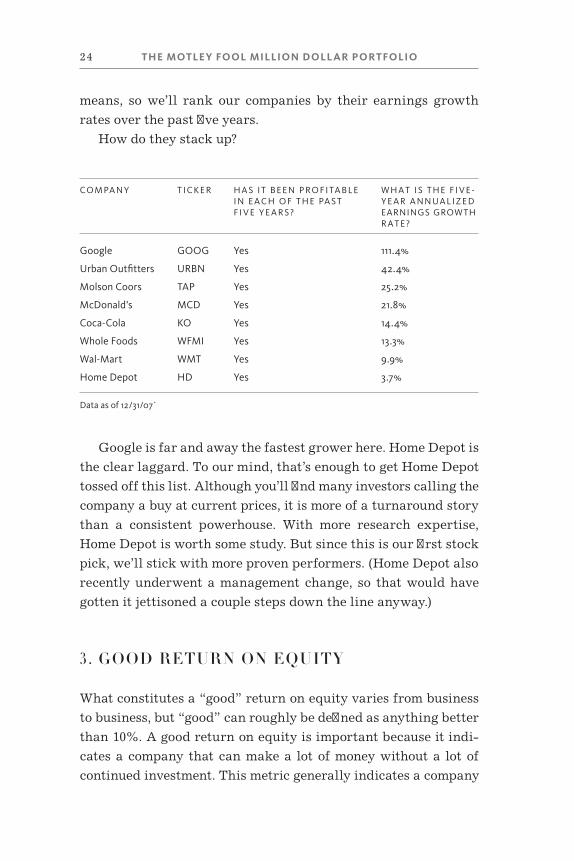
24 THE MOTLE Y FOOL MILLION D OLL AR PORTFOLIO
means, so we’ll rank our companies by their earnings growth
rates over the past fi ve years.
How do they stack up?
CO M PA N Y T I C K E R H A S I T B E E N P RO F I TA B L E I N E A C H O F T H E PA S T F I V E Y E A R S ?
W H A T I S T H E F I V E -Y E A R A N N UA L I Z E D EARNINGS GROWTH R A T E ?
Google GOOG Yes 111.4%
Urban Outfi tters URBN Yes 42.4%
Molson Coors TAP Yes 25.2%
McDonald’s MCD Yes 21.8%
Coca- Cola KO Yes 14.4%
Whole Foods WFMI Yes 13.3%
Wal- Mart WMT Yes 9.9%
Home Depot HD Yes 3.7%
Data as of 12/31/07`
Google is far and away the fastest grower here. Home Depot is
the clear laggard. To our mind, that’s enough to get Home Depot
tossed off this list. Although you’ll fi nd many investors calling the
company a buy at current prices, it is more of a turnaround story
than a consistent power house. With more research expertise,
Home Depot is worth some study. But since this is our fi rst stock
pick, we’ll stick with more proven performers. (Home Depot also
recently underwent a management change, so that would have
gotten it jettisoned a couple steps down the line anyway.)
3. GOOD RETURN ON EQUITY
What constitutes a “good” return on equity varies from business
to business, but “good” can roughly be defi ned as anything better
than 10%. A good return on equity is important because it indi-
cates a company that can make a lot of money without a lot of
continued investment. This metric generally indicates a company
YOUR FIR S T S TOCK 25
with a strong brand or dominance in its market, and it should
mean that the company will hold up well if economic times get
tough.
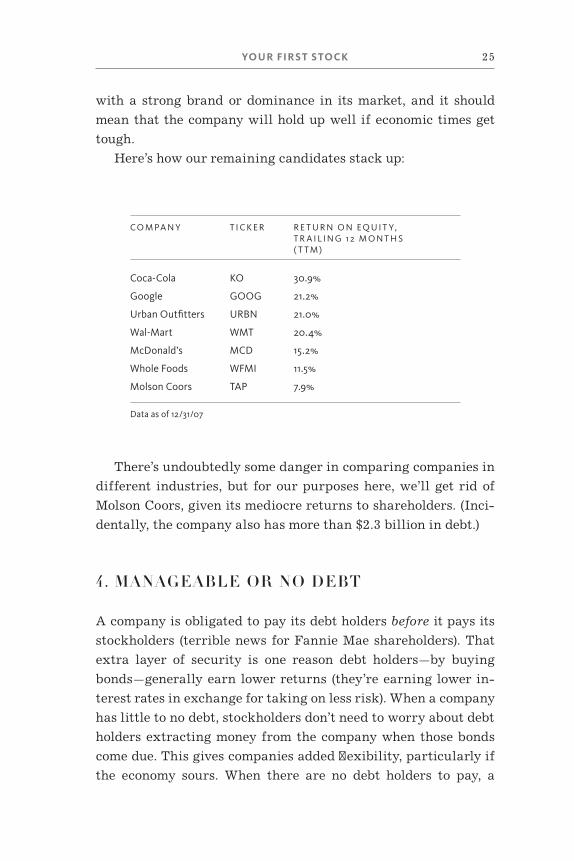
Here’s how our remaining candidates stack up:
CO M PA N Y T I C K E R R E T U R N O N E Q U I T Y, T R A I L I N G 1 2 M O N T H S ( T T M )
Coca- Cola KO 30.9%
Google GOOG 21.2%
Urban Outfi tters URBN 21.0%
Wal- Mart WMT 20.4%
McDonald’s MCD 15.2%
Whole Foods WFMI 11.5%
Molson Coors TAP 7.9%
Data as of 12/31/07
There’s undoubtedly some danger in comparing companies in
different industries, but for our purposes here, we’ll get rid of
Molson Coors, given its mediocre returns to shareholders. (Inci-
dentally, the company also has more than $2.3 billion in debt.)
4. MANAGEABLE OR NO DEBT
A company is obligated to pay its debt holders before it pays its
stockholders (terrible news for Fannie Mae shareholders). That
extra layer of security is one reason debt holders—by buying
bonds—generally earn lower returns (they’re earning lower in-
terest rates in exchange for taking on less risk). When a company
has little to no debt, stockholders don’t need to worry about debt
holders extracting money from the company when those bonds
come due. This gives companies added fl exibility, particularly if
the economy sours. When there are no debt holders to pay, a
26 THE MOTLE Y FOOL MILLION D OLL AR PORTFOLIO
company doesn’t have to worry about going bankrupt. Generally,
a company without debt can fund its own growth from opera-
tions. All of the companies left on our list here have been pretty
solid growers, and their businesses generate lots of cash to fund
all that growth. That’s a very good thing.
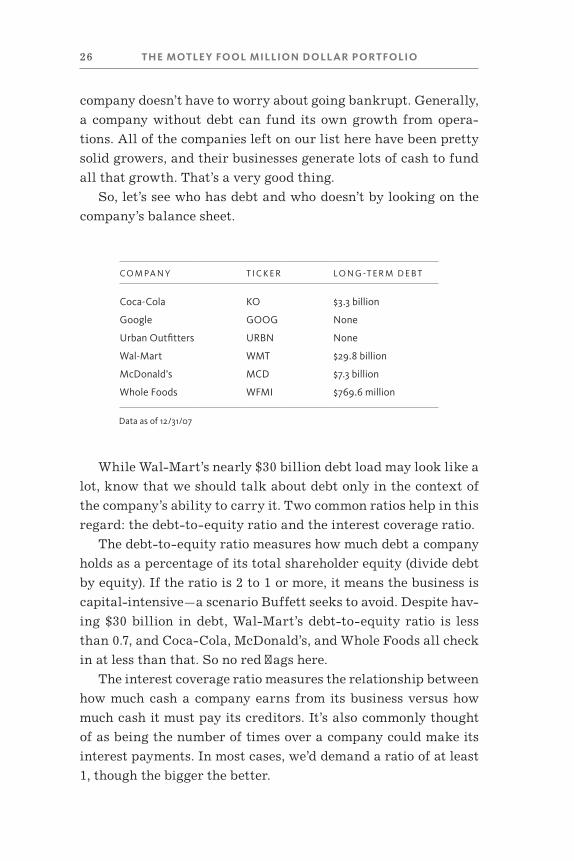
So, let’s see who has debt and who doesn’t by looking on the
company’s balance sheet.
CO M PA N Y T I C K E R LO N G - T E R M D E B T
Coca- Cola KO $3.3 billion
Google GOOG None
Urban Outfi tters URBN None
Wal- Mart WMT $29.8 billion
McDonald’s MCD $7.3 billion
Whole Foods WFMI $769.6 million
Data as of 12/31/07
While Wal- Mart’s nearly $30 billion debt load may look like a
lot, know that we should talk about debt only in the context of
the company’s ability to carry it. Two common ratios help in this
regard: the debt- to- equity ratio and the interest coverage ratio.
The debt- to- equity ratio mea sures how much debt a company
holds as a percentage of its total shareholder equity (divide debt
by equity). If the ratio is 2 to 1 or more, it means the business is
capital- intensive—a scenario Buffett seeks to avoid. Despite hav-
ing $30 billion in debt, Wal- Mart’s debt- to- equity ratio is less
than 0.7, and Coca- Cola, McDonald’s, and Whole Foods all check
in at less than that. So no red fl ags here.
The interest coverage ratio mea sures the relationship between
how much cash a company earns from its business versus how
much cash it must pay its creditors. It’s also commonly thought
of as being the number of times over a company could make its
interest payments. In most cases, we’d demand a ratio of at least
1, though the bigger the better.
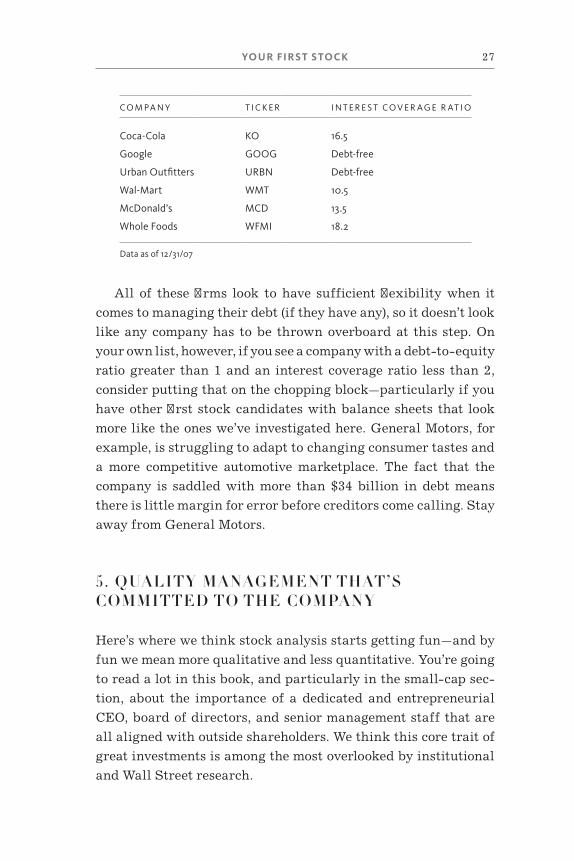
YOUR FIR S T S TOCK 27
CO M PA N Y T I C K E R I N T E R E S T CO V E R A G E R AT I O
Coca- Cola KO 16.5
Google GOOG Debt- free
Urban Outfi tters URBN Debt- free
Wal- Mart WMT 10.5
McDonald’s MCD 13.5
Whole Foods WFMI 18.2
Data as of 12/31/07
All of these fi rms look to have sufficient fl exibility when it
comes to managing their debt (if they have any), so it doesn’t look
like any company has to be thrown overboard at this step. On
your own list, however, if you see a company with a debt- to- equity
ratio greater than 1 and an interest coverage ratio less than 2,
consider putting that on the chopping block—particularly if you
have other fi rst stock candidates with balance sheets that look
more like the ones we’ve investigated here. General Motors, for
example, is struggling to adapt to changing consumer tastes and
a more competitive automotive marketplace. The fact that the
company is saddled with more than $34 billion in debt means
there is little margin for error before creditors come calling. Stay
away from General Motors.
5. QUALITY MANAGEMENT THAT’S COMMITTED TO THE COMPANY
Here’s where we think stock analysis starts getting fun—and by
fun we mean more qualitative and less quantitative. You’re going
to read a lot in this book, and particularly in the small- cap sec-
tion, about the importance of a dedicated and entrepreneurial
CEO, board of directors, and se nior management staff that are
all aligned with outside shareholders. We think this core trait of
great investments is among the most overlooked by institutional
and Wall Street research.
28 THE MOTLE Y FOOL MILLION D OLL AR PORTFOLIO
This se nior leadership is also, according to documentation in
a number of fascinating studies, critical to a company’s per for-
mance. One of the best of these studies—“Where Are the Share-
holders’ Mansions? CEOs’ Home Purchases, Stock Sales, and
Subsequent Company Per for mance” by Professor Crocker Liu of
Arizona State University and Professor David Yermack of New
York University—found that “Future company per for mance de-
teriorates when CEOs acquire extremely large or costly man-
sions and estates.” The same is true of fancy headquarters. The
working explanation for this correlation is that a transaction of
this nature signals entrenchment and distraction—someone
ready to enjoy the fruits of their labors rather than labor for
more fruit.
This circumstance contrasts unfavorably, Liu and Yermack
point out, with someone like Warren Buffett. Buffett, who has
built Berkshire into an empire and was recently worth more than
$60 billion, still lives in the same Omaha, Nebraska, house he
purchased for $31,500 in 1958.
Admittedly, Buffett’s house is no shack, but his behavior is an
anomaly, given the capital available to him and as compared to
the actions of his peers such as former Tyco CEO Dennis Ko-
zlowski—who you may remember threw his wife a $2.1 million
Ancient Rome–themed birthday party in Sardinia a few years ago
complete with an ice sculpture of Michelangelo’s David that
whizzed high- end vodka. That guy’s in jail now.
But while separating Buffett from someone like Kozlowski is
easy in hindsight, how can we identify superior management
teams in real time across thousands of publicly traded compa-
nies? It’s an admittedly squishy subject, and one that we deal
with by putting a leadership team through these fi ve core ques-
tions:
1. Is the found er still active in the company? Is he or she
building a legacy of leadership on sound core values?
2. Do insiders have an own ership stake in the company?
YOUR FIR S T S TOCK 29
How much? Have they been buying or selling shares
recently?
3. What’s their compensation? Is it reasonable? How is it
determined?
4. How long is their tenure, and how good is the track
record?
5. Are they smart?
While that’s just fi ve questions, those are pretty substantial
questions to tackle. If you answer all of them, then you’re going
to know and trust the management team very much at the end of
the day.
Twenty or so years ago, getting after these questions would
have been an enormous undertaking. It would have involved
hours at the library, scores of phone calls, and an avalanche of
careful detective work. Today, it’s a fun way to spend a Sunday
afternoon . . . so long as your Google- fu is strong.
Unless we have met with a company’s CEO, Google is where
we start. And Google is pretty good at its job. Type Whole Foods
CEO John Mackey’s name into your search fi eld and you’ll fi nd
out that he was a star tight end at Syracuse University, played for
the Baltimore Colts with Johnny Unitas, won a Super Bowl, and
was inducted into the Pro Football Hall of Fame in lovely Can-
ton, Ohio.
OK, so that’s the wrong John Mackey.
Type a more precise search string like “John Mackey Whole
Foods” into Google and you’ll discover a lot of interesting stuff
about this found er/CEO. He, for example, is “the Bill Gates of
organic foods,” a vegetarian, a libertarian, and an environmen-
talist who is simultaneously loved and loathed by others in the
green movement, and he “no longer wants to work for money.”
Sounds pretty interesting.
You’ll also discover that Mackey posted anonymously on an
Internet stock discussion board to argue with other posters and
tout the merits of his company . . . a revelation that got him into
30 THE MOTLE Y FOOL MILLION D OLL AR PORTFOLIO
some hot water both with the media and with authorities (though
he was ultimately cleared of legal wrongdoing by the Securities
and Exchange Commission).
That’s a tiny fraction of the raw data that’s out there on this
successful entrepreneur, but as a sample, it gives you an idea of
the qualitative gymnastics that you face as a stock investor.
For example, the Whole Foods brand is predicated on social
and environmental responsibility, support for local and sustain-
able agriculture, and care for its employees. But as critics point
out, through its expansion and attempts to earn mass appeal, the
company has put local businesses out of business and perhaps
compromised its core beliefs by stocking certain “conventional”
products in its stores. It’s also a non- union business—a decision
that draws both admiration and ire.
Then there are Mackey’s Internet message board shenanigans.
Are they evidence of a passionate entrepreneur or someone who
talks integrity but doesn’t act with it?
As a prospective investor, it’s up to you to weigh the facts and
decide. That’s where the framework above comes into play. Of
course, there’s a caveat: While it should help you or ga nize your
thoughts, it won’t make a clear- cut fi nal decision for you. No
leadership team at any company will pass all of the tests with
fl ying colors. But if you can fi nd folks who yield satisfactory an-
swers to most of the questions, you’re off to a fantastic start.
What are the satisfactory answers? You may come up with your
own pa ram e ters now or eventually, but here’s what we think:
1. Is the Found er Still Active in the Company? Is He or She Building a Legacy of Leadership on Sound Core Values?
We love to see found ers who are still active in their companies.
While we obviously wouldn’t penalize a company like Wal- Mart
where found er Sam Walton was active until his death and left a
strong se nior management team to build on his legacy, we be-
YOUR FIR S T S TOCK 31
lieve that the motivating fi re a founding entrepreneur brings to
his or her business is a rare and valuable trait when it comes to
winning in the business world. That’s particularly true at a time
when the tenure of the average public company CEO has dropped
to less than fi ve years. Five years is hardly enough time to get
oriented, study the company, decide on a clear strategic direc-
tion, institute that strategy, and then mea sure and refl ect on the
results.
In the absence of a found er, we at least like to see long- tenured
leaders who have presided over a sustained growth story. We also
like to see a company that has a truly in de pen dent board of di-
rectors.
While it’s hard to know exactly how a board interacts with a
company’s executives, you can make an educated guess by study-
ing the biographies of the board members. The Google board, for
example, includes people such as Intel’s Paul Otellini, Genen-
tech’s Arthur Levinson, and famous venture capitalist John
Doerr, all of whom have been successful in de pen dently of Google.
They don’t need their board seats, and they’re not the types of
people who would be intimidated by found ers Sergey Brin and
Larry Page.
That’s a solid board with technology expertise, leadership
expertise, research expertise, and the credentials to speak truth
to power.
Contrast that with what you fi nd on the board at XM Satellite
Radio—a company that’s done nothing but disappoint investors.
There isn’t one member with immediate name recognition, and
there’s no clearly established or in de pen dent voice with media
expertise. That sort of defi ciency is what we’re looking for when
we try to decide whether a board of directors is adding value to a
company and if it is tasking its CEO with building the right sort
of company for the long term.
Finally, you can learn a lot just by listening to a company’s
conference calls (easily done over the Internet) and applying your
own common sense. When you hear the CEO talk, do you get a
32 THE MOTLE Y FOOL MILLION D OLL AR PORTFOLIO
good or a bad feeling? Is he or she candid or more prone to cover-
ing up bad news and forcing analysts to ask detailed questions in
order to extract information? We prefer leaders who share the
credit and take the blame, rather than vice versa.
As Warren Buffett said, there are no “called strikes” in in-
vesting. So if you sense something wrong or something makes
you uncomfortable, just don’t invest. It’s your money, after all.
As for our fi rst investment fi nalists, Google, Whole Foods, and
Urban Outfi tters are all still run by found ers. Wal- Mart gets a
pass here because Lee Scott has been a lifer at the company and
seems to share found er Sam Walton’s passion.
As for conduct and the quality of the boards, a company the
size of Whole Foods should have a better board than it does.
None of the current members seem to have the credentials to
challenge Mackey. The same seems to be the case at Urban Out-
fi tters, where found ers Scott Belair and Richard Hayne and CEO
Glen Senk share the board with two investment bankers and a
lawyer. Where’s the in de pen dent retail expertise?
That leaves us with Google and Wal- Mart.
2. Do Insiders Have an Own ership Stake in the Company? How Much? Have They Been Buying or Selling Shares Recently?
We like to see managers with an own ership stake in the business
they lead because it indicates vested interest. Of course, we’d
like to believe that anyone who draws a salary from a company
has a vested interest in seeing it succeed, but there have been
too many horror stories over the past two de cades to have us ac-
cept that as fact (plus the bothersome statistic about CEOs
drawing enormous salaries and then jumping ship after a rela-
tively short stay at the helm). If you’re not a shareholder, we
simply can’t assume that you’re looking out for long- term share-
holder interests.
It’s here where John Mackey again falls a little bit short. His
YOUR FIR S T S TOCK 33
$26 million stake in Whole Foods represents just a 0.8% own-
ership stake in the company. And despite his confi dent procla-
mations of the company’s future, he hasn’t bought any additional
shares on the open market recently even as the stock price dropped
55% from January 2006 through April 2008. At some point, we’d
prefer to see him step up to the plate.
We also like to see insiders buying more of their own stock
because we believe that it is a bullish signal. We agree with an
old bit of Wall Street wisdom that reads, “There are thousands of
reasons for insiders to sell stock, but there’s only one reason
they’ll buy: They think the stock is going to go up.”
After all, insiders (we hope) know more about their company
than outside investors ever could. If they’re buying, there’s prob-
ably a pretty good reason for it.
Studies bear this reasoning out. A Morgan Stanley report on
insider buys between 2003 and 2006 showed that these stocks
outperformed the S&P 500 index by more than 13 percentage
points. Another report from Thomson examined insider buying
since 1990 and found that the S&P 500 advanced more than 40%
in the two years following widespread insider buying sprees.
Both are enormous margins of victory over “average” returns
and, in aggregate, show that insider buying is a bullish signal at
both the company- specifi c and macro- market levels.
The good news is that insiders need to report their stock
transactions to the Securities and Exchange Commission via the
publicly fi led Form 4. Those fi lings are available on the SEC Web
site, and there are a number of pay ser vices that will track them
for you. And while insider transactions won’t in and of them-
selves persuade or dissuade us from buying any individual eq-
uity, we do always check to see what the insiders have been
doing.
One caveat here is that it’s much easier to own a large per-
centage of a small company than a large percentage of a large
company. But if you stack up the insider own ership statistics of a
few of our companies, you’ll see some stark differences:

34 THE MOTLE Y FOOL MILLION D OLL AR PORTFOLIO
CO M PA N Y P E R C E N TA G E O F T O TA LI N S I D E R O W N E R S H I P
Coca- Cola 5.1%
Google 22.8%
Urban Outfi tters 28.6%
Wal- Mart 43.4%
McDonald’s 0.1%
Whole Foods 1.1%
Data as of 12/31/07
The insider holding percentages at Coke, Google, Urban Out-
fi tters, and Wal- Mart are much higher than what you’ll generally
fi nd in the stock market. That’s a positive sign that the folks who
own these shares continue to believe in their companies. It’s
worth noting, however, that many of the insider holdings at
Wal- Mart are owned by Sam Walton’s children—who aren’t in-
volved in the day- to- day operations of the company. But they’re
still major holders who could have cashed out their fortunes long
ago—and that says something.
3. What’s Their Compensation? Is It Reasonable? How Is It Determined?
While insider transactions can be easy to judge, judging the dif-
ference between fair and egregious executive compensation can
be difficult. After all, most executive salaries will dwarf the me-
dian U.S. house hold income of roughly $50,000, making it seem
like all CEOs are paid excessively. Then there’s the added com-
pensation CEOs receive such as annual bonuses, stock options,
and use of resources such as company- owned private cars and
jets. It adds up.
According to data from The Corporate Library, the average
total compensation package for an S&P 500 CEO was more than
$14 million in 2007, and the median compensation was $8.8 mil-
lion. That’s eye- popping.
YOUR FIR S T S TOCK 35
Without question, there are CEOs who make far more than
they’re worth. Two that come to mind are former Merrill Lynch
head Stan O’Neal and former Home Depot CEO Bob Nardelli.
During their tenures, both made questionable decisions that ul-
timately undermined the quality of the companies they ran.
These decisions destroyed shareholder value (O’Neal’s by con-
doning aggressive participation in the subprime mortgage mar-
ket, Nardelli’s by reducing Home Depot’s emphasis on superior
customer ser vice). Yet both made serious bank. In addition to the
multimillion- dollar salaries they enjoyed as CEO, O’Neal walked
away with a $161 million severance package and Nardelli re-
ceived a $210 million parting gift. This is a problem, and one that
corporate America has to solve in order for our country to have
faith in its business and investment community.
We also believe, however, that great leadership is hard to fi nd.
Great CEOs are signifi cant (though not always sustainable) com-
petitive advantages in the business world, so generous compen-
sation packages can be reasonable as long as a CEO’s per for mance
and long- term track record warrant such pay.
It’s that dichotomy that informs the overarching judgment we
make when it comes to CEO compensation. That is to make sure
that the CEO is not using the company primarily as a vehicle for
personal enrichment. It doesn’t matter what a CEO makes as
long as long- term shareholder interest is a priority. Per for mance
reviews should be tied to the proper benchmarks and all ele-
ments of the compensation package should be transparent and
fully disclosed.
This was the problem with the compensation plans at Home
Depot and Merrill Lynch. Neither, it turned out, ended up being
tied to benchmarks that mattered. O’Neal, for example, should
have been judged by the ultimate outcome of the company’s sub-
prime investments (which have largely fl opped and were written
down by $8 billion), rather than by the paper profi ts it booked at
the time the deals were made (which were signifi cant).
The compensation plan at any company you’re interested in
investing in is disclosed in a company’s annual proxy statement.
36 THE MOTLE Y FOOL MILLION D OLL AR PORTFOLIO
Make sure that you’re comfortable with it and that it aligns with
your interest as a shareholder. Pay very close attention to a CEO’s
incentives. After all, these are the metrics he or she is going to
manage toward.
One common CEO incentive that we don’t like to see is when a
CEO’s compensation package is tied too closely to the per for-
mance of a company’s stock. Remember, the stock market is of-
ten irrational. Any CEO who tries to control it is delusional. But
a CEO can try to manage his or her stock price through all sorts
of accounting shenanigans, such as booking revenue early in or-
der to meet quarterly analyst expectations.
These shenanigans generally keep the CEO’s focus on increas-
ing a stock’s price in the short term rather than on where it
should be: building a company’s value for the long term. As a
shareholder, you want someone who is focused on, and being re-
warded for, building long- term value.
What metrics are worthwhile for inclusion in incentive plans?
There are many, and they can vary from stock to stock and in-
dustry to industry. But for a general guideline, just refer back to
the traits that Warren Buffett likes to see in a business and that
we’ve been going through in this chapter.
Again, they are:
1. At least $75 million in pre- tax earnings
2. Consistent earnings growth
3. Good return on equity
4. Manageable or no debt
5. Quality management that’s committed to the company
6. A simple business model
At least four of those (consistent growth, good return on
equity, manageable or no debt, and a committed management
team) are easy to incent for. So look for compensation plans
that reward those benchmarks and not other, more short- term
strategies.
YOUR FIR S T S TOCK 37
4. How Long Is Their Tenure, and How Good Is the Track Record?
This is an easy one. Long tenures are better than short ones and,
of course, managers who have presided over success are superior
to those who have presided over failure. Indeed, one study we did
at the Fool found that of the 100 top- performing small companies
from 1996 to 2005, 84 benefi ted from committed and long- tenured
leadership teams. Of those, 66 were found ers or CEOs who had at
least fi ve years experience at the company at the start of the
timeframe.
That frequency of clearly committed leadership is far greater
than in the broader market, and it’s another reason why we make
management assessment such an integral part of our investment
research pro cess.
It’s also worth noting that track rec ords don’t necessarily have
to be made at a CEO’s current company. One of our favorite in-
vestment tacks is to “follow the entrepreneur.” Keep track of
people who have founded and built successful companies in the
past and see what they come up with next—and when it goes
public. Netfl ix CEO Reed Hastings, for example, has built sev-
eral successful companies. Before his current project, he founded
Pure Software in 1991, took it public in 1995, and made it one of
the 50 largest software fi rms in the world by 1997, when it was
acquired by Rational Software (since acquired by IBM) for $515
million.
The key, though, is for you to judge success by the proper
metrics—sustained growth and good returns on equity—rather
than by a company’s stock price. Stock price, as you’ll read time
and time again in this book and hear from many smart investors,
is not always a refl ection of a company’s quality or value.
5. Are They Smart?
This question is another easy and fun, though subjective, test.
We judge a management team’s relative intelligence by looking
38 THE MOTLE Y FOOL MILLION D OLL AR PORTFOLIO
for a few core traits. It’s easy to fi nd any of the information below
with a quick Google search.
First, are they good communicators? We agree with hedge
fund manager Mark Sellers (who gave a riveting speech on this
topic at Harvard Business School) that smart business people
have both sides of their brain working. They’re good with both
numbers and language. As Sellers noted in that speech, “If you
can’t write clearly . . . you don’t think very clearly. And if you
don’t think clearly, you’re in trouble.” So listen to a company’s
conference calls and read its CEO’s annual letter to sharehold-
ers. Both will let you know if your CEO is a clear thinker.
Second, are the se nior leaders experts in their fi elds? This
would mean that they’re routinely invited to serve on other com-
panies’ boards of directors as well as on government and uni-
versity committees, research teams, or panels. Heck, it’s also a
good sign if your CEO is invited every year to give commence-
ment addresses. Keep track of those things. They’re little, but
they count—and they’ll give you a better idea of the person
who’s determining the fate of your hard- earned investment
dollars.
Third, do they serve on other sorts of boards or work with
charity or government? If they do, it’s evidence that they’re
well respected by their peers. That’s about as much as you can
do to affirm someone’s qualifi cations without knowing them
personally.
Finally, what’s their educational background? We write this
here with the caveat that a college or even high school degree
does not necessarily confer smarts or common sense. Some of our
country’s most successful business leaders—such as Microsoft’s
Bill Gates, Oracle’s Larry Ellison, and even Facebook’s Mark
Zuckerberg— were all college dropouts (though they did all drop
out from Harvard). But all else being equal, we prefer leaders
who have demonstrated a passion for learning. That can be done
by dropping out of an Ivy League school to pursue a business
idea (as Gates did) or by working one’s way through community
college (as Ross Perot and Tom Golisano, CEO of Paychex, did).
YOUR FIR S T S TOCK 39
One smart guy is Google CEO Eric Schmidt. He has an under-
graduate degree from Prince ton, a PhD from Cal- Berkley, expe-
rience at Bell Labs, Novell, and the Palo Alto Research Center,
and is also on the boards at Apple and Carnegie Mellon Univer-
sity. Oh, and he’s also a member of the National Academy of En-
gineering, a fellow at the American Academy of Arts and Sciences,
and chairman of the non- profi t New America Foundation.
6. A SIMPLE BUSINESS MODEL
Here’s the thing about simple business models: They’re not nec-
essarily better at making money than complicated business mod-
els. Yet there’s a great reason Warren Buffett loves them: they’re
much easier to understand. Everything else should go in that
“too hard” pile.
That doesn’t mean that down the line you shouldn’t rescue
some names from your “too hard” pile or invest in a company
with lots of moving parts. But don’t start there. Start with a
company where you understand how it makes money. That way
you’ll understand when it’s doing well (making more money) and
doing poorly (making less or even losing money).
One exercise we like is to try to describe a company in one
sentence. If we can—and can do so compellingly—then it’s passed
the test. “Great stocks,” David will often proclaim, “don’t make
you think!”
If, however, you fi nd yourself hemming and hawing and dron-
ing on in a run- on sentence with multiple commas, ellipses, bul-
leted lists, and so on, then stop right there. This is not a good fi rst
stock. It’s complicated and unclear, and you likely won’t enjoy
following it.
So, can we describe Google and Wal- Mart each in a sentence?
Google makes most of its money by selling targeted advertise-
ments alongside its top- notch Internet search results. Wal- Mart
makes money by being the low- cost retailer of an incredible va-
riety of goods.
40 THE MOTLE Y FOOL MILLION D OLL AR PORTFOLIO
Both sentences clearly explain how these companies make
money and what their competitive advantage is in the space.
Google has the best technology; Wal- Mart has the best prices.
Those are simple business models, and you’ll know very quickly
if either is faltering (Google ceases to have the best search capa-
bilities or Wal- Mart ceases to have the best prices).
So Who Wins?
Not surprisingly, both Wal- Mart and Google, our two fi rst stock
fi nalists in this exercise, are favorites of Warren Buffett’s. In
fact, Buffett himself owns shares of Wal- Mart through Berk-
shire Hathaway, and he wrote in his 2008 letter to shareholders
that Google embodies his dream company that has “an
ever- increasing stream of earnings with virtually no capital re-
quirements.”
So, while we don’t think you can go wrong buying either
Wal- Mart or Google today based on this short study of their
businesses, don’t just go out and make either your fi rst stock. Go
through this entire pro cess from scratch. You’ll not only learn
how to do it and become a more seasoned investor in the pro cess,
you may also fi nd a company that will outperform both Wal- Mart
and Google from here.
What Can Go Wrong?
If you bought a consumer- facing company like Wal- Mart or
Google that you knew well and that you felt comfortable buying,
chances are you overpaid for it, at least in the short term. We
don’t necessarily know if that’s true, but consumer- facing com-
panies in good times tend to have lots of growth expectations
priced into them.
This book is going to get much more in- depth about valuation
later, so we won’t bore you with the details here, but if your fi rst
stock declines or drops suddenly on earnings, the culprit is likely
valuation. Google, for example, trades for a price- to- earnings
YOUR FIR S T S TOCK 41
ratio (the famed P/E ) of 39. Wal- Mart’s is 19. The market average
today is close to 13. That means that investors are willing to pay
a premium to own both Google and Wal- Mart because—as we’ve
already seen—they are excellent businesses. When you pay a pre-
mium, whether it’s for a stock, a bottle of wine, or an article of
clothing, you have higher expectations. As a result, if you open
an expensive bottle of wine only to discover that it’s become vin-
egar, you will be upset. You may even return it to the store and
demand your money back.
This is exactly what happens when a company posts quarterly
results that disappoint investors. These investors get upset and
some may demand their money back by selling the stock and
causing its stock price to drop. This is not the end of the world.
Remember, the purpose of your fi rst stock is not necessarily to
make a fortune. It is to help you become a better investor. If you
made a mistake with your fi rst stock and that mistake was based
on the valuation, well, then you know what you have to work on.
The remaining chapters in this book will help you do just that.
Also keep in mind that the stock market is often irrational
and that it might test your patience (and stomach) on a daily ba-
sis. If you own a great company like Wal- Mart or Google, it’s
generally worth holding through good times and bad. If you re-
member our example from earlier in this chapter, it’s much easier
to do better as an investor by doing less. That means minimizing
your tax burden and trading costs, and the only way to do that is
to buy to hold.
The stock market, however, is not always irrational. If your
stock drops substantially, it is always worth revisiting your re-
search. You may discover that you were wrong about your assess-
ment of the quality of a business. You may also discover, later on,
that a fundamental part of your investment thesis was based on
inaccurate or no longer accurate information (the CEO resigns
over a previously undisclosed scandal, the accounting turns out
to have been fraudulent, or a competitive advantage—like Google’s
search technology—has eroded). In either of these scenarios, it
is time to consider selling.
42 THE MOTLE Y FOOL MILLION D OLL AR PORTFOLIO
We recommend that investors keep good notes about why they
bought a stock. Only by knowing that—and being able to refer to
it—will you know when something has gone wrong.
WHAT YOU SHOULD LEARN FROM YOUR FIRST STOCK
If your stock goes up right off the bat, you may become a victim
of dreaded confi rmation bias. You’ll convince yourself that your
analysis was fl awless, that you have all the makings of a top in-
vestor, and that this Warren Buffett we keep referencing isn’t all
he’s cracked up to be. If you’re not careful, such a mind- set can
lead to sloppy research pro cesses and excessive risk-taking.
You may actually become a better investor in the long run if
your fi rst stock drops in the days following your purchase. Such
a scenario would be a gut- check, and it would help you to de-
velop the emotional makeup to be a great stock investor.
But if you fi nd yourself drilling down on your assumptions,
reassessing the effectiveness of your pro cess, and looking for what
you missed or did not miss, then you have the potential to be a
successful stock investor. If you really focus on the business and
decide that although the stock price has dropped, the quality of
the underlying investment remains the same and you want to buy
more, then you have the makings of a superior stock investor.
In other words, if your fi rst stock can teach you to have an
even temperament about the market, that’s a major victory. If it
goes down because you missed a crucial piece of information,
then you’ve also benefi ted. Presumably, you’ll not make the same
mistake twice.
Your fi rst stock should only be a small slice of your portfolio—
even just a few hundred dollars. Never invest more money in
stocks than you can afford to lose. If you’re a beginning stock
investor, your portfolio should be built upon a sound asset allo-
cation plan and a set of carefully chosen mutual funds. (See Ap-
pendix A for a detailed guide to mutual fund investing.)
YOUR FIR S T S TOCK 43
Above all, we view your fi rst stock as a learning tool. Some of
you may learn that investing on your own is too time- consuming,
too stressful, or just not much fun. And that’s OK, too. At The
Motley Fool, we invest alongside you in our newsletter ser vices.
Come join us!
Finally, when you’re having fun following your fi rst stock and
regaling cocktail party attendees with tales of your research,
your fi rst stock should also have taught you what Warren Buffett
has called one of the most important lessons that he learned
about investing: You should have started sooner.
Motley Fool Advisor Tim Hanson contributed to this chapter.
Tim spent a few years digging into the fundamentals of small- cap
companies for our Hidden Gems and Pay Dirt newsletter ser-
vices, and now serves as co-advisor to Global Gains. The fi rst
stock Tim bought was Whole Foods.
Visit us at mdpbook .com to get some of our current favorite
stocks—free! You might fi nd the perfect candidate for your fi rst
stock purchase.
CH A PTER 4
DIVIDEND DYNASTY
A t this point, you’re probably thinking, “I get it. High- quality
stocks are my route to a million- dollar portfolio.” But now
you’d like more guidance on what types of equities to buy.
You may already know the classifi cations of stocks—value,
high- growth, small- cap, blue- chip, high- yielders, international
stocks, and so on. But that taxonomy, while useful, has overlaps
that can be confusing. After all, aren’t there such things as
high- growth dividend stocks? What about blue- chip value
stocks?
Over the next several chapters, we’ll give you specifi c guid-
ance on how to build your portfolio around the most useful
stock- picking strategies. We’ll move beyond the black and white
into the grey areas of classifi cation, where most of the best
long- term investments fi nd their hiding places. But let’s start
with one of the most fundamental principles, both theoretically
and practically, at your disposal—the dividend. Investing in com-
panies that pay dividends has let our Income Investor newsletter
ser vice beat the market by about 8 percentage points.
DIVIDE ND DYNA S T Y 45
GET PAID TO INVEST
Rewind the clock to your childhood, back to your average Satur-
day morning. If you’re like us, you had chores around the house.
Weeding the brickwork out front. Cleaning up board games from
the fl oor of your room. Cutting lawns, hosing fl owerbeds, clip-
ping hedges. Your reward—a few dollars of allowance—was as
good as gold.
We can reclaim that childhood glory together by investing in
companies that pay dividends, the business world’s allowance.
When we invest long in public companies, there are two ways to
profi t: stock appreciation and dividend payments. Each makes
up a part of what we call the “return equation.” The fi rst, stock
appreciation—or capital gains—is straightforward. We buy stock
in Whole Foods Market or Apple, and then we root them on, hop-
ing years from now to sell those shares at a higher price.
Dividends are the second part of the return equation. A divi-
dend is a quarterly, annual, or one- time special payment back to
the shareholders. House hold and personal care giant Procter &
Gamble, for example, has paid a dividend to its shareholders for
more than 100 years. The company currently pays out around 40%
of its earnings each year in dividends. Even if Procter & Gamble’s
stock goes down one year or the next, or remains fl at for a three-
year period, all’s not lost. Stockholders can earn money during fl at
periods in the form of dividend payments. And those payments are
made out of the company’s annual fl ow of earnings.
For that reason, dividend investors need to keep their eyes
trained to the bottom line.
THE BOTTOM LINE
The primary way that a public company delivers investment re-
turns—as capital gains or via dividends—is by generating profi t.
It’s the raison d’être of incorporation. Of course, there are many
46 THE MOTLE Y FOOL MILLION D OLL AR PORTFOLIO
accompanying reasons to be in business. Public companies fi ll
consumer needs in the marketplace, provide tens of millions of
jobs, compete to lower prices for buyers, and strive to help hu-
manity use its resources more efficiently. But the bottom line is
the bottom line. Profi t is necessary for every public company’s
operations—from the world’s largest oil company, ExxonMobil,
to other fl ourishing companies like Copenhagen’s Vestas Wind
Systems, with the grand mission of building and maintaining
wind power systems to produce electricity.
Companies need to make money to survive and to reward their
shareholders for shouldering the risk of investment.
Of course, given the natural limitations of accounting, “profi t”
can take many forms. In our 15- year history at The Motley Fool,
we’ve had courtside seats to view public companies as they’ve
fl ourished and faltered. And we’ve watched closely enough to
know that there are both healthy and unhealthy forms of profi t.
The former includes gains won by delighting customers, renew-
ing long- standing business partnerships, innovating to create
sustained competitive advantages, and making prudent invest-
ments. But not all stated profi t is healthy! Always remember that
not every company’s chief executive is committed to building a
great business for the long term. Short- term greed, fostered by
fl awed compensation plans, can lead certain CEOs to furiously
bend and twist accounting rules to create phantom profi ts. By do-
ing so, they can mislead their board of directors, the market-
place of investors, and sometimes even themselves into thinking
they’ve succeeded. That can enable them to take home millions
in compensation for a job poorly done.
The beauty of dividend investing, as you’ll see in a moment, is
that when practiced Foolishly, it can help you steer clear of
scoundrels.
Let’s start in on this problem by defi ning profi t as the money
remaining after all expenses are subtracted from the sale of
products and ser vices. That’s the “bottom line” to a company’s
income statement, with revenues at the top, material expenses
below it, followed by the cost of labor and marketing, through
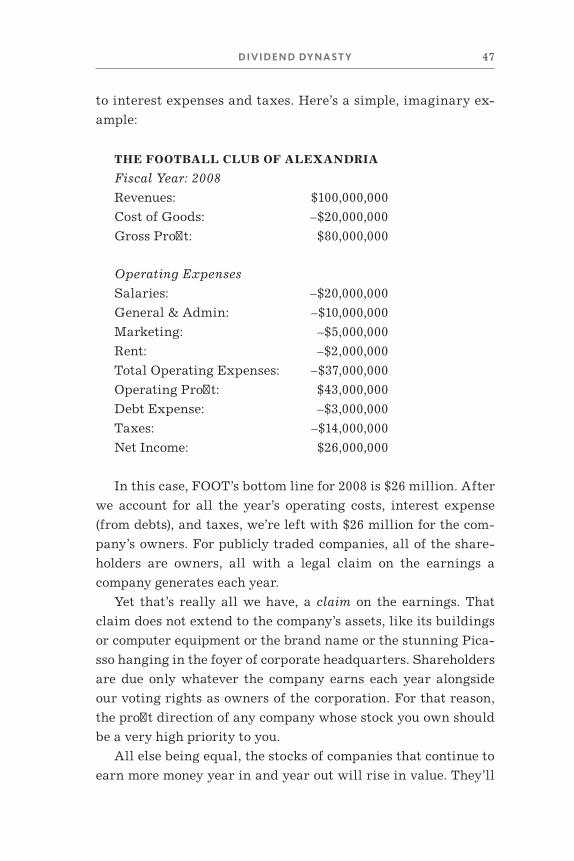
DIVIDE ND DYNA S T Y 47
to interest expenses and taxes. Here’s a simple, imaginary ex-
ample:
THE FOOTBALL CLUB OF ALEXANDRIA
Fiscal Year: 2008
Revenues: $100,000,000
Cost of Goods: –$20,000,000
Gross Profi t: $80,000,000
Operating Expenses
Salaries: –$20,000,000
General & Admin: –$10,000,000
Marketing: –$5,000,000
Rent: –$2,000,000
Total Operating Expenses: –$37,000,000
Operating Profi t: $43,000,000
Debt Expense: –$3,000,000
Taxes: –$14,000,000
Net Income: $26,000,000
In this case, FOOT’s bottom line for 2008 is $26 million. After
we account for all the year’s operating costs, interest expense
(from debts), and taxes, we’re left with $26 million for the com-
pany’s own ers. For publicly traded companies, all of the share-
holders are own ers, all with a legal claim on the earnings a
company generates each year.
Yet that’s really all we have, a claim on the earnings. That
claim does not extend to the company’s assets, like its buildings
or computer equipment or the brand name or the stunning Pica-
sso hanging in the foyer of corporate headquarters. Shareholders
are due only what ever the company earns each year alongside
our voting rights as own ers of the corporation. For that reason,
the profi t direction of any company whose stock you own should
be a very high priority to you.
All else being equal, the stocks of companies that continue to
earn more money year in and year out will rise in value. They’ll
48 THE MOTLE Y FOOL MILLION D OLL AR PORTFOLIO
also have more money to pay out to their shareholders in the
form of dividends. There’s that return equation again. Let’s say
you own one tenth of 1% of the Football Club of Alexandria. At
the end of 2008, your claim on FOOT’s $26 million in earnings is
about $260. Now, while you have a claim on those earnings,
you’re probably not going to receive a check in that amount in the
mail. A company’s board of directors and its CEO choose what to
do with those earnings. Essentially, they have fi ve choices, not all
of which are mutually exclusive.
1. Bank the earnings
2. Reinvest in the company
3. Make an acquisition
4. Buy back company stock (this increases each own er’s
share of the pie)
5. Pay out dividends to shareholders
As we noted above, a dividend is simply a slice of a company’s
earnings that the board decides to pay to its own ers. Not all com-
panies choose to pay them. Fast- growing companies, which you’ll
learn about in Chapters 6 and 7, typically need to reinvest all of
their earnings to fuel growth. They live by the old mantra “You
gotta spend money to make money!” These companies tend to be
smaller, with less stable earnings but higher potential growth
rates. In most of these cases, it would be ill- advised for them to
promise a regular dividend. The canary in the coal mine for in-
vestors is when management overpromises and underdelivers,
thereby having to reduce or eliminate dividend payments in
down periods. That’s a no- no.
Let’s look again at Google—one of the most innovative and
remarkable companies in history. In just its tenth year of exis-
tence, the online search power house earned more than $4 billion
in profi t. That’s an unmatched pace in the history of business.
What does Google do with all that cash? Today, it spends about
a third on research and development with the aim of growing
its market share over the long term. Its management team rein-
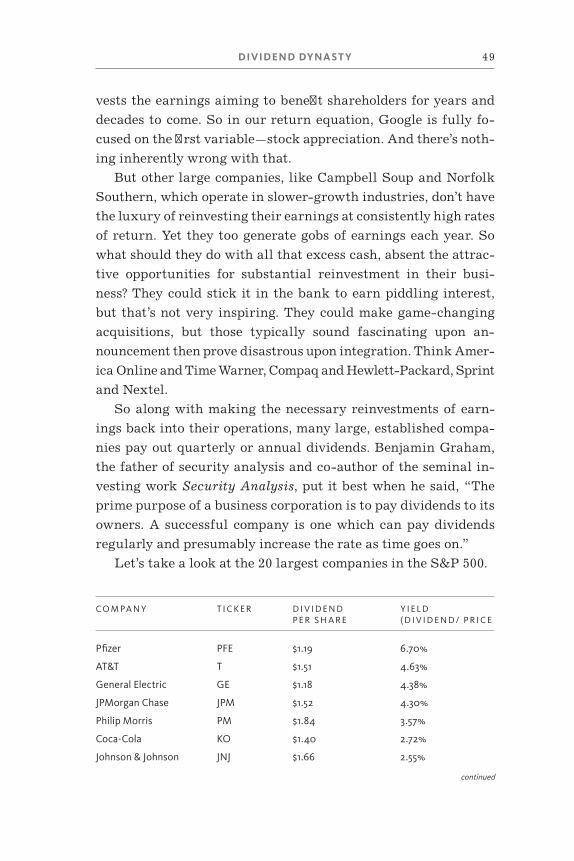
DIVIDE ND DYNA S T Y 49
vests the earnings aiming to benefi t shareholders for years and
de cades to come. So in our return equation, Google is fully fo-
cused on the fi rst variable—stock appreciation. And there’s noth-
ing inherently wrong with that.
But other large companies, like Campbell Soup and Norfolk
Southern, which operate in slower- growth industries, don’t have
the luxury of reinvesting their earnings at consistently high rates
of return. Yet they too generate gobs of earnings each year. So
what should they do with all that excess cash, absent the attrac-
tive opportunities for substantial re investment in their busi-
ness? They could stick it in the bank to earn piddling interest,
but that’s not very inspiring. They could make game- changing
acquisitions, but those typically sound fascinating upon an-
nouncement then prove disastrous upon integration. Think Amer-
ica Online and Time Warner, Compaq and Hewlett- Packard, Sprint
and Nextel.
So along with making the necessary reinvestments of earn-
ings back into their operations, many large, established compa-
nies pay out quarterly or annual dividends. Benjamin Graham,
the father of security analysis and co- author of the seminal in-
vesting work Security Analysis, put it best when he said, “The
prime purpose of a business corporation is to pay dividends to its
own ers. A successful company is one which can pay dividends
regularly and presumably increase the rate as time goes on.”
Let’s take a look at the 20 largest companies in the S&P 500.
CO M PA N Y T I C K E R D I V I D E N D Y I E L D P E R S H A R E ( D I V I D E N D/ P R I C E
Pfi zer PFE $1.19 6.70%
AT&T T $1.51 4.63%
General Electric GE $1.18 4.38%
JPMorgan Chase JPM $1.52 4.30%
Philip Morris PM $1.84 3.57%
Coca- Cola KO $1.40 2.72%
Johnson & Johnson JNJ $1.66 2.55%
continued
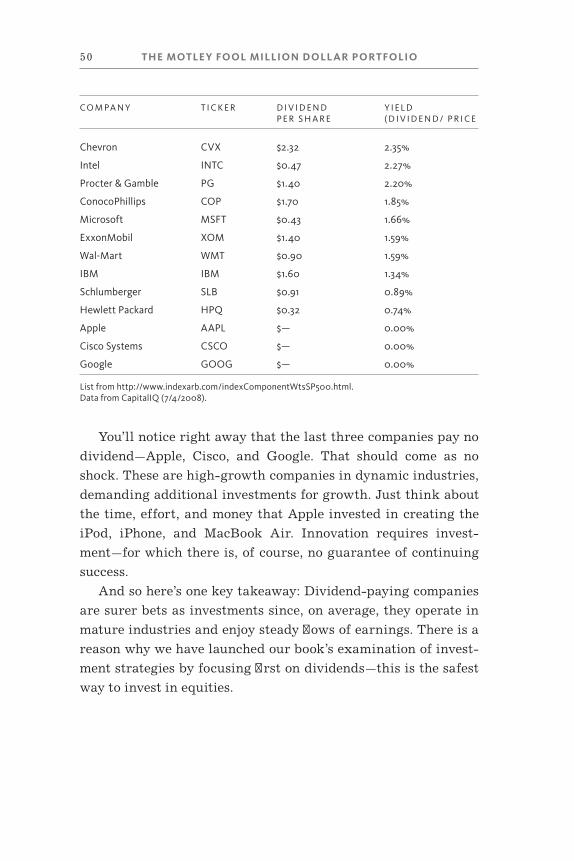
50 THE MOTLE Y FOOL MILLION D OLL AR PORTFOLIO
CO M PA N Y T I C K E R D I V I D E N D Y I E L D P E R S H A R E ( D I V I D E N D/ P R I C E
Chevron CVX $2.32 2.35%
Intel INTC $0.47 2.27%
Procter & Gamble PG $1.40 2.20%
ConocoPhillips COP $1.70 1.85%
Microsoft MSFT $0.43 1.66%
ExxonMobil XOM $1.40 1.59%
Wal- Mart WMT $0.90 1.59%
IBM IBM $1.60 1.34%
Schlumberger SLB $0.91 0.89%
Hewlett Packard HPQ $0.32 0.74%
Apple AAPL $— 0.00%
Cisco Systems CSCO $— 0.00%
Google GOOG $— 0.00%
List from http:// www .indexarb .com/ indexComponentWtsSP500 .html.Data from CapitalIQ (7/4/2008).
You’ll notice right away that the last three companies pay no
dividend—Apple, Cisco, and Google. That should come as no
shock. These are high- growth companies in dynamic industries,
demanding additional investments for growth. Just think about
the time, effort, and money that Apple invested in creating the
iPod, iPhone, and MacBook Air. Innovation requires invest-
ment—for which there is, of course, no guarantee of continuing
success.
And so here’s one key takeaway: Dividend- paying companies
are surer bets as investments since, on average, they operate in
mature industries and enjoy steady fl ows of earnings. There is a
reason why we have launched our book’s examination of invest-
ment strategies by focusing fi rst on dividends—this is the safest
way to invest in equities.
DIVIDE ND DYNA S T Y 51
THE DIVIDEND YIELD
To master dividend investing, you’ll have to start with a grasp of
the dividend yield and its importance. Nothing tough here. The
yield represents the yearly dividend a company pays out divided
by its current share price, then expressed as a percentage. So if
the annual dividend is $1 and the current stock price is $50, the
dividend yield is simply ($1/$50) * 100 = 2%.
Investors use the dividend yield to gauge how much they’ll get
paid relative to the cost for each share of stock. We often com-
pare the dividend yield between companies within the same in-
dustry as well as across other investment types, like savings
accounts and bond yields.
The dividend yield should be considered as an interest rate
earned for owning a company’s stock. The average yield of the 20
stocks in our chart above, including the three that don’t pay
dividends, is 2.27%, which is just a tad higher than the 2.23%
average for all S&P 500 stocks. That makes sense. The 20 compa-
nies above are some of the largest corporations in the world.
Many operate in established industries, leaving them few places
to intelligently invest their enormous piles of profi t. Paying a
dividend to their shareholders is the best alternative.
THE PAYOUT RATIO
A second critical dividend metric is the payout ratio, a simple cal-
culation to determine how much of a company’s earnings are re-
turned to shareholders each year. Why calculate this? Well, how
anxious would you be if one of your investments paid out more in
dividends than the company earned each year? We’d be pretty
anxious. That’s not a sustainable program.
Here’s how to calculate the payout ratio. Simply divide total
dividends by total earnings. Often the easiest way to do this is to
52 THE MOTLE Y FOOL MILLION D OLL AR PORTFOLIO
take the per- share calculations in a company’s fi nancial fi lings.
This ratio is also expressed as a percentage.
Put simply, the lower the payout ratio, the better. That would
indicate that management has room to increase its dividend even
if earnings don’t grow. Here’s where the statistic gets even more
interesting. There is empirical evidence to show that low- payout
companies perform better than their high- payout counterparts.
Investment fi rm Credit Suisse has proved that a portfolio of
high- yielding, low- payout- ratio stocks of the S&P 1500 (a big-
ger universe than the more common S&P 500 benchmark) deliv-
ered annualized returns of 19.2% between 1990 and 2006 versus
11.2% for the S&P 500. Just as important, the study found that
stocks with low dividend yields and high payout ratios gener-
ated subpar annualized returns of just 8.6% (per for mance below
the S&P 500 and below companies that paid no dividends at all).
For obvious reasons, you cannot make informed investment
decisions based solely on the dividend yield. This second factor—
the payout ratio—has been a key to our continuing success buy-
ing dividend stocks in Income Investor.
A PENNY INVESTED IS MANY PENNIES EARNED
A truckload of academic studies has shown that investing in
companies that pay dividends is just about the best way to earn
huge returns over time. Yet it can get far better still. As authors
Elroy Dimson, Paul Marsh, and Mike Staunton proved in Tri-
umph of the Optimists: 101 Years of Global Investment Returns,
a portfolio in which we reinvest dividends—using the dividend
to then buy more shares of stock—generates almost 85 times the
value of a portfolio that relies solely on stock appreciation.
Let’s take it one step further. According to money manage-
ment fi rm Eaton Vance, more than 50% of the annualized returns
of the S&P 500 since 1960 has come from dividends. Translation:
Between 1960 and 2005, $1,000 invested in the S&P 500 index
DIVIDE ND DYNA S T Y 53
would have grown to more than $108,000 including reinvested
dividends, but only $23,681 without dividends.
Still not convinced? Try this. According to Ned Davis research,
between 1972 and 2006, S&P 500 stocks not paying a dividend
returned a measly 4.1% annualized. Dividend payers, meanwhile,
blew the hinges off the doors with a 10.1% annual return. The
numbers speak for themselves: Dividend investing works.
DIVIDENDS HERE, THERE, BUT NOT EVERYWHERE
However, of the almost 7,000 publicly traded companies on the
major U.S. stock exchanges, only about 40% paid a dividend over
the past year. You’ll come to learn that only the best, most stable
companies with earnings power can afford to establish a divi-
dend policy and keep it up indefi nitely. Promising to pay a slice of
your earnings each quarter or year is not for the faint of heart.
For a company to pay a dividend consistently each year, it
should have:
1. Consistent and proven cash earnings power that can
grow over time
2. A stable business in an industry that won’t experience
massive disruptions that could negatively affect divi-
dends
3. Shareholder- friendly management dedicated to treating
shareholders as own ers
4. A business model that doesn’t require massive amounts
of capital outlays relative to its earnings power
At this point, it goes without saying that cash earnings are
crucial since dividends are real cash outlays made by manage-
ment. If the earnings vanish, the fi nancial officers will either
have to cut the dividend or raise capital by issuing debt. Neither
is acceptable. And so here’s a great way to understand the effects
54 THE MOTLE Y FOOL MILLION D OLL AR PORTFOLIO
that dividend paying can have on the business practices of a
corporation. Dividends act as Wonder Woman’s magic lasso;
they force the truth out of a company’s fi nancial statements.
The accounting sleights of hand that we mentioned earlier—
where CEOs wrestle accounting standards to the mat to juice their
short- term compensation—are a very serious problem in the pub-
lic markets. These dastardly acts can mask devastating opera-
tional problems even as executives rake in enormous bonuses.
Those are absolute worst- case scenarios for investors. But, for
obvious reasons, these are pretty rare occurrences at public
companies that feature a long- standing and rising dividend. No
accounting trick is going to shield the company from having to
either make or break its dividend payment. Dividends are a
“barometer of a corporation’s health,” as Eaton Vance puts it.
It’s important that we not overgeneralize, though. There are
certainly remarkable companies that would make a mistake by
paying a dividend. Take a smaller company like Buffalo Wild
Wings, one of our favorites in Hidden Gems, our small- cap
newsletter at The Motley Fool. Through its hundreds of restau-
rants, it earns millions in profi t each year that it could kick back
to shareholders in the form of a dividend. But management has
made a deliberate decision to spend twice its annual earnings on
store improvements and expansions. Buffalo Wild Wings is in
supergrowth mode, where it lacks the fl exibility to pay a consis-
tent dividend. Its shareholders expect to be rewarded in the
years ahead through capital gains, not dividend payments.
Perhaps one day, when Buffalo Wild Wings eateries are in every
major urban area, we’ll see management pay a dividend. But with
the business profi tably growing at rates in excess of 25% per year,
cash payouts would be a misallocation of funds. A larger company
like McDonald’s, of course, is in quite a different position. As a $70
billion company that earns nearly $3 billion per year, its years of
supergrowth have waned. Beyond making the occasional brilliant
investment, as it did in taking a controlling stake in Chipotle be-
fore the turn of the century, McDonald’s is smart to make dividend
payments. It has done so without interruption since 1976. And dur-
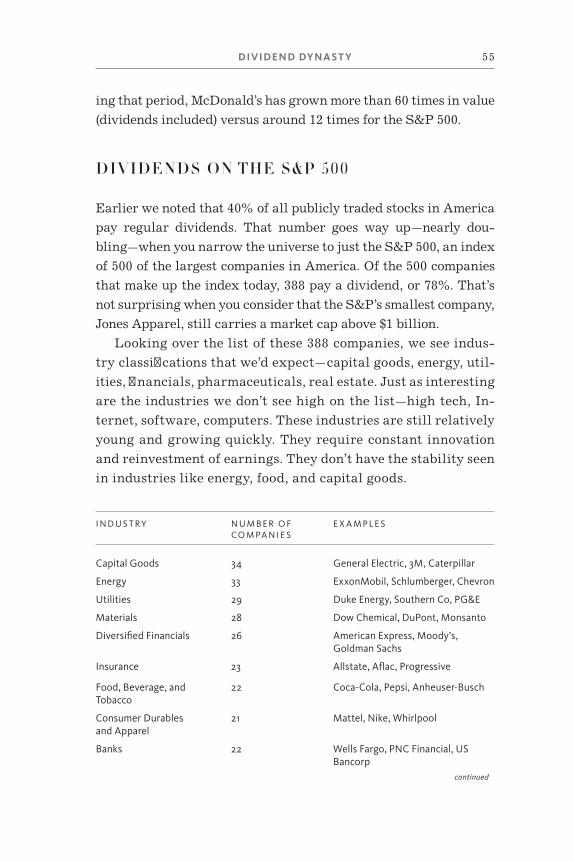
DIVIDE ND DYNA S T Y 55
ing that period, McDonald’s has grown more than 60 times in value
(dividends included) versus around 12 times for the S&P 500.
DIVIDENDS ON THE S&P 500
Earlier we noted that 40% of all publicly traded stocks in America
pay regular dividends. That number goes way up—nearly dou-
bling—when you narrow the universe to just the S&P 500, an index
of 500 of the largest companies in America. Of the 500 companies
that make up the index today, 388 pay a dividend, or 78%. That’s
not surprising when you consider that the S&P’s smallest company,
Jones Apparel, still carries a market cap above $1 billion.
Looking over the list of these 388 companies, we see indus-
try classifi cations that we’d expect—capital goods, energy, util-
ities, fi nancials, pharmaceuticals, real estate. Just as interesting
are the industries we don’t see high on the list—high tech, In-
ternet, software, computers. These industries are still relatively
young and growing quickly. They require constant innovation
and reinvestment of earnings. They don’t have the stability seen
in industries like energy, food, and capital goods.
I N D U S T R Y N U M B E R O F CO M PA N I E S
E X A M P L E S
Capital Goods 34 General Electric, 3M, Caterpillar
Energy 33 ExxonMobil, Schlumberger, Chevron
Utilities 29 Duke Energy, Southern Co, PG&E
Materials 28 Dow Chemical, DuPont, Monsanto
Diversifi ed Financials 26 American Express, Moody’s, Goldman Sachs
Insurance 23 Allstate, Afl ac, Progressive
Food, Beverage, andTobacco
22 Coca- Cola, Pepsi, Anheuser- Busch
Consumer Durables and Apparel
21 Mattel, Nike, Whirl pool
Banks 22 Wells Fargo, PNC Financial, US Bancorp
continued
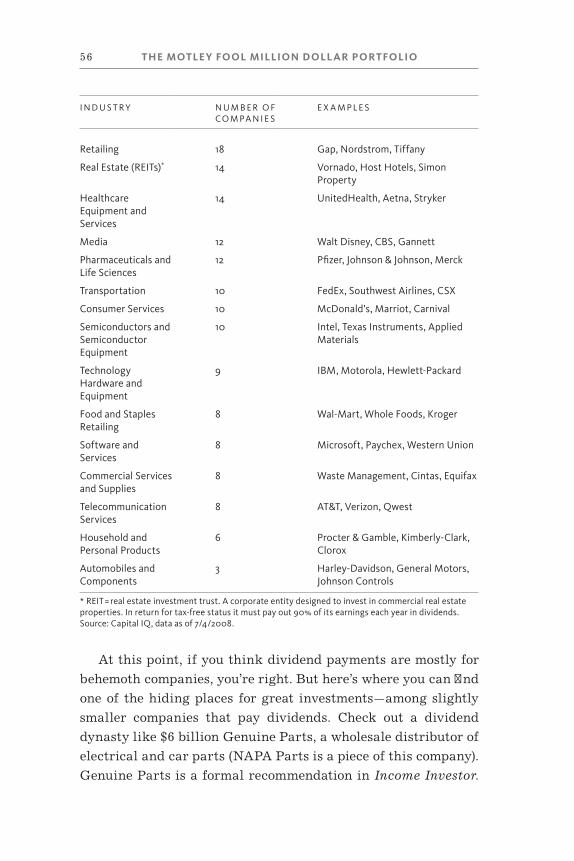
56 THE MOTLE Y FOOL MILLION D OLL AR PORTFOLIO
I N D U S T R Y N U M B E R O F CO M PA N I E S
E X A M P L E S
Retailing 18 Gap, Nordstrom, Tiffany
Real Estate (REITs)* 14 Vornado, Host Hotels, Simon Property
Healthcare Equipment and Ser vices
14 UnitedHealth, Aetna, Stryker
Media 12 Walt Disney, CBS, Gannett
Pharmaceuticals and Life Sciences
12 Pfi zer, Johnson & Johnson, Merck
Transportation 10 FedEx, Southwest Airlines, CSX
Consumer Ser vices 10 McDonald’s, Marriot, Carnival
Semiconductors and Semiconductor Equipment
10 Intel, Texas Instruments, Applied Materials
Technology Hardware and Equipment
9 IBM, Motorola, Hewlett- Packard
Food and Staples Retailing
8 Wal- Mart, Whole Foods, Kroger
Software and Ser vices
8 Microsoft, Paychex, Western Union
Commercial Ser vices and Supplies
8 Waste Management, Cintas, Equifax
Telecommunication Ser vices
8 AT&T, Verizon, Qwest
House hold and Personal Products
6 Procter & Gamble, Kimberly- Clark, Clorox
Automobiles and Components
3 Harley- Davidson, General Motors, Johnson Controls
* REIT = real estate investment trust. A corporate entity designed to invest in commercial real estate properties. In return for tax- free status it must pay out 90% of its earnings each year in dividends.Source: Capital IQ, data as of 7/4/2008.
At this point, if you think dividend payments are mostly for
behemoth companies, you’re right. But here’s where you can fi nd
one of the hiding places for great investments—among slightly
smaller companies that pay dividends. Check out a dividend
dynasty like $6 billion Genuine Parts, a wholesale distributor of
electrical and car parts (NAPA Parts is a piece of this company).
Genuine Parts is a formal recommendation in Income Investor.
DIVIDE ND DYNA S T Y 57
The company has increased its dividend payout a freakish 52
years in a row, putting it near the top of U.S. companies in that
respect and ahead of larger names like Coca- Cola, 3M, and John-
son & Johnson, all great companies in their own right.
These smaller, dividend- paying companies are often over-
looked by investors, giving us opportunities to buy them on the
cheap.
ROLLER COASTERS BELONG IN AMUSEMENT PARKS, NOT YOUR PORTFOLIO
In total, Americans spend millions of dollars and thousands of
hours each year waiting to get tossed and turned on giant
wood- steel roller coasters. We seek them out for the excitement,
thrills, and danger that we don’t experience in our mundane
daily lives. But in investing, most of us shun the topsy- turvy.
Studies show that investors far prefer the merry go- round (con-
sistent path with consistent speed) than the Nitro at Six Flags.
Our brains and stomachs aren’t programmed to handle stock
volatility. When the turns get too sharp, most investors are soon
crying to get off the ride (and at the wrong time).
Dividends can help settle the nerves. Not only do dividend-
paying stocks provide regular income streams to reinvest in more
shares, but they also carry less volatility than non- dividend pay-
ers and the general market. This a critical point to remember:
Dividend investing offers very good returns with lower volatil-
ity. Never forget it.
Now, in case some of you worry that dividend investing means
buying boring utility companies, fear not. As we pointed out in
the S&P 500 table on the previous page, there is a wide range of
dividend payers, some of which sell products or ser vices you use
each and every day. Just look at the following:
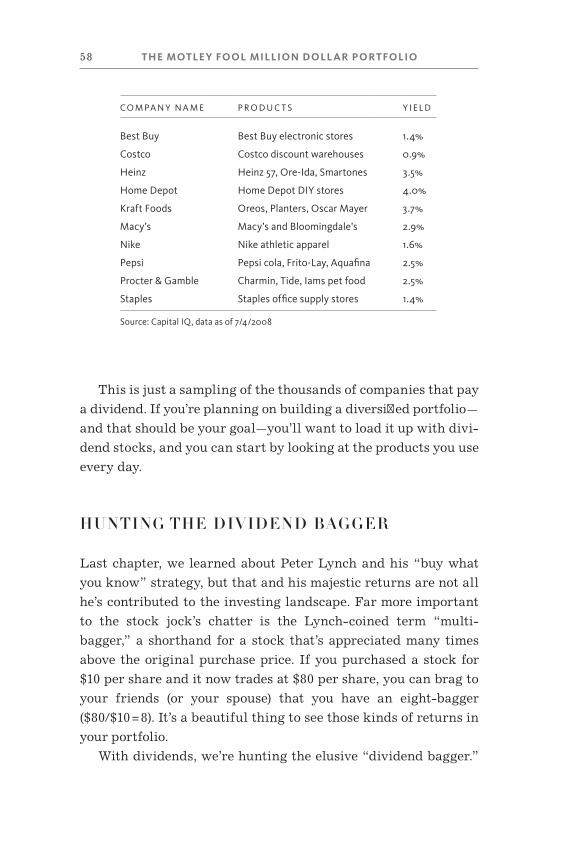
58 THE MOTLE Y FOOL MILLION D OLL AR PORTFOLIO
This is just a sampling of the thousands of companies that pay
a dividend. If you’re planning on building a diversifi ed portfolio—
and that should be your goal—you’ll want to load it up with divi-
dend stocks, and you can start by looking at the products you use
every day.
HUNTING THE DIVIDEND BAGGER
Last chapter, we learned about Peter Lynch and his “buy what
you know” strategy, but that and his majestic returns are not all
he’s contributed to the investing landscape. Far more important
to the stock jock’s chatter is the Lynch- coined term “multi-
bagger,” a shorthand for a stock that’s appreciated many times
above the original purchase price. If you purchased a stock for
$10 per share and it now trades at $80 per share, you can brag to
your friends (or your spouse) that you have an eight- bagger
($80/$10 = 8). It’s a beautiful thing to see those kinds of returns in
your portfolio.
With dividends, we’re hunting the elusive “dividend bagger.”
CO M PA N Y N A M E P R O D U C T S Y I E L D
Best Buy Best Buy electronic stores 1.4%
Costco Costco discount ware houses 0.9%
Heinz Heinz 57, Ore-Ida, Smartones 3.5%
Home Depot Home Depot DIY stores 4.0%
Kraft Foods Oreos, Planters, Oscar Mayer 3.7%
Macy’s Macy’s and Bloomingdale’s 2.9%
Nike Nike athletic apparel 1.6%
Pepsi Pepsi cola, Frito- Lay, Aquafi na 2.5%
Procter & Gamble Charmin, Tide, Iams pet food 2.5%
Staples Staples offi ce supply stores 1.4%
Source: Capital IQ, data as of 7/4/2008
DIVIDE ND DYNA S T Y 59
This is what happens when you hold dividend- paying stocks for
years, letting your dividends reinvest and compound over time.
A dividend bagger comes about when the shares purchased by
your reinvested dividends are worth more than your original
purchase amount. (Quickly re- read this paragraph to be sure you
understand how amazing this is!)
Now, let’s take PepsiCo as an example. Assume you bought
100 shares of Pepsi back in 1988 for a split- adjusted $5.79 per
share, or a $579 outlay. If you reinvested all your dividends over
the past 20 years, you would now have just over 150 shares of the
company, valued at more than $10,000. Those 50 additional shares
that your reinvested dividends bought are today worth around
$3,400, giving us a near six- dividend- bagger (nearly six times
your original $579). And all that for just holding on and rede-
ploying dividends back into more and more shares.
SECRETS OF OUR STRATEGY
While not every company is going to share Pepsi’s long- term suc-
cess, our Income Investor team is armed with some strict criteria
that help us determine whether a company is a true dividend
champ or just a pretender. Here are our core criteria:
1. Dividend and payout ratio. We look for companies that pay a
dividend with a clear ability to keep paying it. For us, that means
companies with payout ratios less than 65%.
2. Capital gain potential. We want stocks that will appreciate
in value while also paying a steady dividend. As we saw in the
Pepsi example, those massive gains come from the combination
of growth and income. A rich dividend yield is nice, but if we
don’t think there is much upside to the stock outside of the yield,
we’ll stay away.
3. Financial fortitude. We’re not interested in investing in un-
proven business models or companies that have paid a dividend
60 THE MOTLE Y FOOL MILLION D OLL AR PORTFOLIO
once or twice. We’re looking for the best of the best, companies
that will continue to return cash to own ers, through good times
and bad. Balance sheet strength is important and we like to see
high returns on equity and capital for us to jump aboard.
4. Competitive advantages. We want the best of breed. We
want the last man standing in a corporate bar fi ght. Companies
with winning business models are the ones that last. We are very
specifi cally looking for businesses with very loyal customers,
uniquely strong brands, insignifi cant uses of leverage, and com-
petent leadership with tenure. There’s a lot of qualitative work
that goes on here, but companies like Campbell Soup, American
Express, and Nordstrom stand out.
5. Smart, shareholder- friendly management. This begins with
intangibles like integrity—not to mention a winning game plan.
As we discussed in the last chapter, we study up on the back-
ground, corporate governance plans, and own ership stakes of
the executive officers of the company. The leaders are ultimately
the drivers of operational returns. We’re looking for a manage-
ment team like we see at Sherwin- Williams, a group that has
been at the company for years and has delivered spectacular
shareholder returns for de cades.
6. Size. Risky little pipsqueak companies can be fun, but we
typically want stocks large enough not to get tossed around by
turbulent market waves. We like to invest in companies with
market value greater than $1 billion. We will dip lower if we fi nd
a particularly strong candidate, but it must be particularly
strong.
Let’s take a closer look at a company that meets our six
criteria.
DIVIDE ND DYNA S T Y 61
PACCAR—A TRUCKLOAD OF DIVIDEND RETURNS
Through this chapter we’ve pointed to numerous companies that
have been wonderful long- term dividend performers. Many are
house hold names like Pepsi, Procter & Gamble, and Johnson &
Johnson. But dividends come in all shapes and sizes, and from all
types of industries. Sometimes the wonderful company that War-
ren Buffett wants to buy at a fair price is one that we may not
necessarily know much about.
Tom tapped Paccar as an official recommendation in our gen-
eral equity newsletter, Stock Advisor, in July 2005. If you’ve never
heard of this truck and parts manufacturer, don’t be alarmed.
Most active investors don’t recognize the name. But for years, it’s
been a dividend beauty delivering market- smashing returns. Since
1988, two years after it hit the public markets, Paccar has gener-
ated 16% annualized returns. Through a combination of capital
gains, regular dividends, and special end- of- year dividends, Pac-
car shareholders who invested $5,000 in 1988 at a split- adjusted
$2.50 are now sitting on a trea sure of over $100,000 as of June 2008.
That’s another big step toward that $1 million portfolio.
Who said truckers aren’t sexy?
We got on board this company late during its prolifi c ride, yet
we’ve still earned nearly twice our money in barely three years.
And it’s not because Tom found a company destined to be the next
Microsoft or because every analyst on Wall Street was touting it as
the top stock of the de cade. Paccar is a simple story of a family- run
business that focuses on what it does best—designing, producing,
and marketing the bodies of commercial trucks and aftermarket
parts. And doling out cash to its own ers through dividends.
Paccar has been around for more than a century, long before
trucks roared down U.S. highways. In 1905, William Pigott
started the Seattle Car Manufacturing Company to manufac-
turer logging and railway equipment. In 1934, under William’s
son Paul’s leadership, the company—then known as Pacifi c Car
62 THE MOTLE Y FOOL MILLION D OLL AR PORTFOLIO
and Foundry—entered the industrial winch business for crawler
tractors, which later served as the foundation for Paccar’s winch
division (still around today).
After manufacturing Sherman tanks for the U.S. military
during World War II, Paccar entered the heavy- duty truck mar-
ket in 1945 by buying the Kenworth Motor Truck company. A
de cade later, it added Peterbilt Motors and Dart Truck to its
family. Since then it has become a worldwide leader in supplying
Kenworth, Peterbilt, and DAF high- quality diesel trucks around
the globe. Today around two- thirds of its revenues come from
foreign countries.
Let’s run Paccar through our dividend criteria to see what
Tom saw three years ago.
1. It Pays a Dividend
Paccar shares started trading hands during the summer of 1986.
By November 1987, just a few weeks after the October 1987 crash
and with its shares down 15%, Paccar declared its fi rst dividend—a
little more than a penny per share. Since then it has gone on to pay
out more than $10 in per- share dividends. And while it has lowered
the dividend from time to time—during the recessionary period of
1991, for instance—it has paid out dividends each and every year. It
helps when you’ve produced nearly 70 consecutive years of profi t-
ability. Starting in 1998 it began paying an end- of- the- year special
dividend in addition to its quarterly payouts.
So as dividend payers go, Paccar has demonstrated that it is
committed to returning cash to shareholders and that it has the
fi nancial and operational model in place to keep it going.
2. Capital Gain Potential
When Tom looked at Paccar, he saw a market- leading company
run by the great- grandson of the found er, selling at around 13
times earnings and yielding about 4%. He kicked the tires (fi g-
uratively, that is), analyzed the growth potential, and studied
DIVIDE ND DYNA S T Y 63
the sleepy nature of the business: building trucks. But the truck
manufacturing industry was just starting to catch the increas-
ing tailwinds of stricter U.S. emission requirements for trucks.
Buyers had to update their fl eets by 2007 or else face stiff fi nes.
So along with a relatively cheap earnings multiple, there was a
catalyst to spark earnings growth and therefore the stock price.
Tom predicted the market cap would more than double by
2010.
A healthy dividend and a stock that could double? That’s a
return equation that adds up quite nicely.
3. Financial Fortitude
At the time of Tom’s recommendation, Paccar was a $12.5 billion
company selling more than $12 billion worth of trucks and
winches, and earning nearly $1 billion in cash earnings. The bal-
ance sheet carried almost $2 billion in cash and short- term in-
vestments and barely any long- term debt (although it had some
debt for its fi nancing operations—a natural byproduct of that
business). And, impressively, it had paid an uninterrupted divi-
dend since 1987. Tom wrote then, “I have no concerns about its
[Paccar’s] fi nancial position.”
With this fi nancial picture and its industry- leading position,
Paccar possessed the strength to rumble through the inevitable ups
and downs of the cyclical trucking business. We’re not interested in
fl y- by- night dividend- newbies that may or may not be around down
the road to pay us. We’re looking for those 300- pound linemen who
can handle any kind of blitz coverage. Paccar was an All- Pro.
4. Competitive Advantage
You may not be able to tell one 18- wheeler from another, but
truckers and freight haulers can. If your take- home pay depended
on trucking thousands of miles up and down the eastern sea-
board, you would want the most reliable truck on the market.
That’s what truckers get in Kenworth, Peterbilt, and DAF. The
64 THE MOTLE Y FOOL MILLION D OLL AR PORTFOLIO
company’s trucks consistently win customer satisfaction awards
and carry the latest technologies.
Supporting these brands is a dedication to innovation in both
research and development and information technology that
would make a tech company envious. These reinvestments allow
Paccar to stay ahead of the curve in designing the next great
trucking product. Paccar’s integrated global supply chain is a
leader in the industry, allowing it to shorten truck production
scheduling to mere minutes.
Strong brand names and excellent operational per for mance
allow Paccar to deliver returns on equity north of 20%—and
close to 30% when demand is kicking. The cash conversion cycle
is less than zero, which means that Paccar is paid by its custom-
ers well before it has to pay its suppliers, giving management
cash leverage to earn higher returns.
5. Smart and Shareholder- Friendly Management
Individual investors are almost always best served when man-
agement and the board of directors own meaningful amounts of
stock in their company. We trust them to keep their priorities in
line with our priorities. At the Fool, we like to see management
teams that own lots of stock in their companies—and even better,
are buying shares. That’s a clear indication that management
considers the stock undervalued.
Mark Pigott, chairman and CEO of Paccar, has trucking in his
blood. He is the great- grandson of Paccar found er William Pigott
and has been sitting in the executive driver’s seat for more than ten
years. Since taking over, he has delivered an eight- bagger, or 20%
annualized returns, making shareholders—and himself since he
owns nearly 2% of the company—wealthy. Mark’s uncle James Pig-
ott, a board member since the early 1970s and an own er of 5% of the
company, is also on the board. Uncle James collects more than $13
million in dividend checks each year.
With a deep legacy that has no interest in letting down the
DIVIDE ND DYNA S T Y 65
family name, intimate knowledge of the business, and a vested
interest in earning high shareholder returns, Paccar’s leadership
team appealed to Tom.
6. Size
Paccar’s market cap when Tom recommended it was $12.5 billion—
well above our $1 billion guideline.
Not every dividend investment is going to fi t so nicely with
our six criteria, but we always evaluate each company according
to this checklist. It’s no surprise that Paccar has been such a big
winner for us—returning 34% versus the S&P’s return of −2%.
PITFALLS TO DIVIDEND INVESTING
As we hope you now grasp, dividends are one of the best ways to
accumulate wealth and beat the market. But buying a bunch of
companies that pay dividends is no guarantee of investing suc-
cess. Applied incorrectly, dividend investing can produce sub- par
results. Here are the primary pitfalls of dividend investing, and
what you can do to avoid them.
1. Dividend Bear Traps
Be careful of investing in a company that carries a large divi-
dend yield but doesn’t meet our other criteria. These “dividend
traps” are typically too good to be true. Not that we have any-
thing against high- yielding stocks, it’s just that the current yield
may actually refl ect a severely troubled company. Its stock may
have been beaten down (for good reason), and the fi nancials may
show an elevated payout ratio. Those can be very ominous signs.
Often these companies have fundamental problems that will lead
to dividend cuts down the road.
Think back to the 2008 credit crisis that wreaked havoc on many
U.S. banks. As the stocks fell precipitously, their yields moved up,
66 THE MOTLE Y FOOL MILLION D OLL AR PORTFOLIO
some to double- digits. But as the companies’ balance sheets weak-
ened, the banks couldn’t sustain the payouts. And so, alongside
collapsing stock prices, investors agonized through falling divi-
dend yields. Be sure not to focus exclusively—or even primarily—
on the dividend yield. The payout ratio is a critical factor as well.
2. Dividend Overloading
Let’s say you already love dividend- paying companies. That’s
great, so do we. But even if you fi nd solid companies with rich
yields, low payout ratios, and stocks selling at a discount, you
shouldn’t build your entire portfolio around dividend payers.
You’ll want diversifi cation in your portfolio, which means stocks
with attractive yields alongside small- and large- cap stocks,
value plays and fast- growers, backed by mutual- fund invest-
ments. You need to protect yourself from the downside that may
ravage one par tic u lar group or industry. Too much of a good
thing is actually a bad thing.
Also, dividend stocks are more stable and more likely to de-
liver singles and doubles than home runs. They don’t grow nearly
as fast as companies that re- deploy all their earnings back into
the business. Think here of a telecom business like Citizens Com-
munications. It’s a rock- solid company that pays a consistently
high dividend. But it doesn’t grow much. Of course, our singles
and doubles tend to come with less volatility. Nevertheless, it’s
healthy for the average investor to take a few home run swings
on companies that don’t pay a dividend. We’ll show you how to
fi nd the best of these in Chapters 6 and 7.
3. Overconcentration
As you research and track dividend stocks, you’ll notice that they
tend to fall within a cluster of industries. We listed the primary
ones within the S&P 500—capital goods, energy, utilities, and so
on. So if you invest purely in dividend companies, you run the
risk of too much industry concentration, which is not a good
DIVIDE ND DYNA S T Y 67
idea. You’ll want to make sure you spread your dividend invest-
ing across industries and countries. There are some wonderful
foreign dividend- paying companies trading on the U.S. markets,
which our Global Gains newsletter focuses on.
4. The Tax Man Cometh
Alas, there is one downside to getting paid each year—you have
to pay taxes on those earnings when you receive them.
ONE FINAL DIVIDEND DEEP DIVE
By digging deeper into the decision- making pro cess behind some
of the recommendations in our dividend newsletter, Income In-
vestor, you can get an even better sense of what we look for. Here
are three short snapshots of dividend- paying, lesson- providing
examples. The fi rst two might even make nice additions to your
portfolio today.
Petrobras—Booming in Brazil
Income Investor advisor James Early snagged shares of Petro-
bras not once, but twice, in back- to- back months no less, because
he was so excited about the prospects for the company and its
stock. Income Investor subscribers who heeded his advice earned
a double in less than a year. A double? Those types of returns are
more commonly seen on our small- cap Hidden Gems scorecard.
But Petrobras was the world’s eighth- largest oil company at the
time with a market cap of almost $120 billion—not exactly a
speedy little small cap. What did James see that other investors
may have missed? Let’s drill a little deeper.
Petrobras, the former oil monopoly of Brazil, has an ingrained
competitive advantage in its deep- water drilling capabilities un-
matched among its oil brethren. Plus, its huge oil reserve assets
gave it enough of a cushion to run for more than a de cade without
68 THE MOTLE Y FOOL MILLION D OLL AR PORTFOLIO
ever drilling for another barrel of oil. These reserves, some of
the richest on the planet, went unappreciated by the market.
Toss in its huge distribution system of gas stations in its home
market and nearly 100% of Brazil’s production and refi ning ca-
pacity, and we’re looking at an operational position that can’t be
beat.
But James also calculated that this cash fl ow machine was
selling at a huge discount to its true value, and still paying a
healthy 3.5% yield. The incoming profi ts suggested to him that
Petrobras could increase its dividend over time because its
payout ratio was just 35%, nicely below our cutoff of 60%. Fur-
thermore, the oil consumption rate in Brazil was expected to
grow more than double the world’s average, so there was plenty
of room to run. The return equation was adding up nicely.
Of course the increases in the price of oil have certainly
helped, and we won’t always be so fortunate to hit this kind of
“perfect storm.” But fortune favors the brave and James realized
that the market was not giving Petrobras its due. His two recom-
mendations have returned 37% and 65% above the S&P.
Diageo—Taste the Magic
Keeping our passport out, we headed next to En gland to belly up
to the bar for some shares of Diageo, the largest producer and
distributor of alcoholic beverages in the world. You might not
recognize the corporate name, formed from the Latin word dia
(day) and Greek word geo (world), but if you appreciate a fi ne
drink at the end of a hard day, you will recognize some of the
company’s brands. They include Guinness stout, Johnny Walker
scotch, Smirnoff vodka, Tanqueray gin, Seagram’s 7 whiskey,
and Jose Cuervo tequila. Income Investor subscribers have en-
joyed market- besting returns of 40% since we added Diageo to
our scorecard in May of 2004, yet we believe there are still better
days ahead.
After spending years as a bit of a conglomerate—it owned ev-
erything from Burger King to Pillsbury—Diageo sold off its
DIVIDE ND DYNA S T Y 69
non- core businesses and focused solely on the spirits game. Now-
adays, Diageo’s brand portfolio is one of the tastiest around, con-
taining more top 20 brands than its next fi ve competitors
combined. This brand equity gives it an edge with distributors
around the world, who push cases of spirits to restaurants, bars,
and The Motley Fool for our holiday parties. The Diageo brands
sell.
These top- selling brands drive operating margins of near 30%
(tops in the industry), returns on equity of around 36%, and more
than $3 billion in earnings, which management uses to pay a
healthy, and growing, dividend. When we picked it, the yield was
around 3.4% and the shares were trading around 14 times earn-
ings. Reasonable, if not drop- dead cheap, for a company of this
quality.
Looking through our list of criteria, Diageo scored close to
perfect, with the exception of management owning few shares.
Yet the executive team is packed with loads of talent. They have
been with the company for years and have a specifi c vision of
where they are going. Additionally, they are determined to re-
turn cash to shareholders through dividends and billions of dol-
lars worth of share repurchases. Cheers, mate.
Entercom—Radio Killed the Portfolio Star?
We’re certainly not immune to mistakes. While we’ve had more
successes than failures, Entercom stands out as one we wish we
could take back.
Entercom is one of the largest radio station own ers in the
country, with more than 100 stations spread across 23 U.S. mar-
kets. The big miss here was that we overestimated the company’s
competitive position. We thought it was stronger not only in the
local radio space, but also against the plethora of substitute
forces like satellite radio, iPods, and Internet radio. Now, in a
world where advertisers have many ways to reach potential buy-
ers, local radio no longer mea sures up as it once did. The lack of
a deep and growing competitive moat was our fi rst oversight.
70 THE MOTLE Y FOOL MILLION D OLL AR PORTFOLIO
Our second mistake was overlooking the company’s weak fi -
nancial picture, consisting of more debt than cash. It also was a
rookie dividend payer, having started distributing cash to its
shareholders just a few months before we recommended it. Add-
ing some salt to the wound was the dual- class share structure
that put voting control in the hands of the founding family.
While their economic interest aligned well with shareholders,
their lock on voting control quieted outside voices. In retrospect,
it was obviously a mistake to recommend Entercom—what were
we thinking? But this is how you become a great investor—by
revisiting your winners and losers with equal intellectual vigor.
In this case, we underestimated the competitive forces facing
Entercom and its radio cousins. Earnings dried up, debt levels
grew, and a once- cheap stock got cheaper. Ultimately we decided
to sign off at a near 50% loss. That’s very painful—made less so,
though, by our commitment to diversifi cation. We’ve learned the
lesson: Stick to growing businesses that have defensible competi-
tive advantages.
THE PIECE OF YOUR PORTFOLIO
As an investor, you should build a diversifi ed portfolio including
all kinds of stocks—stable dividend payers, small- cap unknowns,
fast- growing rockets, and large- cap value plays. There is a place
for all of them in your holdings. This is a driving principle of our
book.
Think carefully about how much volatility your brain can
stomach. Well- regarded portfolio management author William
Bernstein labels this fi nding your “sleeping point.” That’s the
point at which you start worrying about your stock exposure. If
you’re the type who will be pacing the living room in a bathrobe
at 2 a.m. at the thought of a 15% single- day drop, you’ll probably
want to skimp on the small- cap portion of your portfolio and
load up on large- cap dividend stalwarts that you know, under-
stand, and can follow.
DIVIDE ND DYNA S T Y 71
You will have to determine what the right breakdown of
stocks in your portfolio should be. We can help you in later chap-
ters and with our tools and community online at mdpbook .com.
But we hope we’ve gone a long way toward convincing you that
dividend- paying stocks are an integral part of winning portfo-
lios. An average investor with plenty of years ahead can have
anywhere between 30% and 50% in solid dividend- paying stocks,
which include large-, mid-, and small-caps as well as foreign
companies. This range is rough, but we think it makes sense
given the typical investor’s risk profi le.
Due to the tax consequences of receiving dividend checks
each year, you should consider placing some of your dividend
payers in a tax- advantaged account like a Roth IRA or a
self- directed 401k, if you qualify. Thanks to the 2003 tax change,
dividends in the U.S. are taxed at 15%, the same rate as capital
gains. A Roth would shield you from the tax man each year. In a
tax- deferred account, however, at withdrawal time you may end
up paying a higher tax rate if your ordinary income tax rate is
higher than 15%. So make sure you chat with your tax advisor
before you start fl ooding your IRA with dividend payers.
BUILDING YOUR DIVIDEND DYNASTY
Dividend- paying stocks can work for you, no matter who you are
or what your investing experience. Whether you’re a newbie, sea-
soned hand, empty- nester, or education saver, dividends should
fi ll an important role in your stock portfolio. The best news is
that it’s not difficult to start. You don’t have to understand high
fi nance, charting hocus- pocus, or discounted cash fl ow models to
enjoy the compounding returns dividends offer.
By investing in a handful of the best- run, highest- quality
companies operating in growing industries and with sustainable
competitive positions, you’re well on your way to creating real
wealth that will compound at higher returns year after year. You
won’t have to worry about the daily gyrations of your stock
72 THE MOTLE Y FOOL MILLION D OLL AR PORTFOLIO
prices, if the general stock market is up or down, or if the com-
pany’s latest one-hit wonder is taking off. There is a time and a
place for that kind of investing, but it’s not part of the deal when
we invest in dividend stalwarts.
We are not advocating buy- and- forget investing here, but
dividend investing is about as close as you can get. It’s been
demonstrated that dividends are just about the perfect way to
generate winning returns over years if not de cades. Your mail-
box and your portfolio are waiting for those dividends to start
rolling in.
Motley Fool Advisor Andy Cross contributed to this chapter.
A Fool since 1995 and a current or past advisor to our Income
Investor, Stock Advisor, and Hidden Gems newsletter ser vices,
Andy has been a fan of dividends ever since his father taught
him the ABCs of compound interest with stocks such as Pepsi,
Home Depot, and Johnson & Johnson.
Visit us at mdpbook .com to get our top dividend stock pick
for your portfolio.
CH A PTER 5
BLUE- CHIP BARGAINS
There’s certainly something to be said for stocks that pay you
to own them. They are vaguely reminiscent of the Sherman
tanks that Paccar built during World War II: strong, secure,
plodding steadily forward. But for those looking for a little more
upside potential, the next step up the risk- reward ladder is value
investing.
Value stocks—companies trading for less than they’re worth—
have a lot in common with dividend- paying companies, and they
often pay dividends themselves. But for value investors, the divi-
dend is a happy bonus, the icing on the high- per for mance cake,
the olive in the value martini, the colorful analogy on top of an
already clear explanation.
Buying great companies at a good price is even better than a
quarterly check. Following the value investing principle of pay-
ing 80 cents for the proverbial dollar, it only makes sense that as
a group, value stocks have been more rewarding than any other
group of equities since the dawn of investing. At The Motley Fool,
our value investing newsletter ser vice, Inside Value, is beating
the market by more than 4 percentage points.
74 THE MOTLE Y FOOL MILLION D OLL AR PORTFOLIO
WHO WOULDN’T TRADE 80 CENTS FOR ONE DOLLAR?
Value investing pays. There are lots of studies mea sur ing the
extent to which value stocks beat the market’s average returns,
owing to the many different ways one can defi ne “value” or
“growth.” One of the most recent, by noted professors Eugene
Fama and Kenneth French, determined that large- cap value
stocks returned 11.82% per year from 1927 through 2006, com-
pared to 10.03% for the broader market of large- cap stocks. If
that doesn’t sound like much to you, think of it this way: $10,000
compounded at 10.03% for those 80 years would grow to just un-
der $21 million. At 11.82%, it would grow to a little over $76 mil-
lion.
Beyond the compelling data is the plain, old- fashioned,
common- sense logic behind value investing. By defi nition, value
stocks are businesses that are worth more than their stock price
indicates. By focusing on these bargain businesses, you’re fol-
lowing in the footsteps of the previously mentioned Benjamin
Graham, the man who taught Warren Buffett how to invest and
who invented the practice of valuing stocks in the fi rst place—
and that’s where we begin our story.
In the beginning, there were stocks. But there was no par tic-
u lar way to value the worth of individual stocks—no mathemati-
cally proven way to determine what a company or a company’s
stock was worth. There were plenty of people buying and selling
stocks, but they were basing their decisions on a cryptic combi-
nation of dividends and rumors. We still see this same combina-
tion today in emerging foreign markets, which creates plenty of
opportunities for investors, as we’ll discuss in Chapter 8.
Back then, businesses published the results of their opera-
tions, but investors often had to write to the company to request
that information or search for it at the library. It certainly wasn’t
a couple of keystrokes away on the Internet. But Benjamin Gra-
ham, a business professor at Columbia and a re nais sance man of

BLUE- CHIP BARGAINS 75
extraordinary accomplishment, studied the types of companies
that most rewarded shareholders and at what prices. He devel-
oped a formal methodology for determining the “intrinsic value”
of a company, padded it with what he referred to as a “margin of
safety,” and made a fortune.
Before we get to the fortune, we should understand the con-
cepts. Value investing starts with the intrinsic value of a company—
the value that a company is worth based on what you can rationally
expect it to earn and the cash it will be able to distribute to its
investors after paying all of its bills. And here’s the key to all
investing: The value of a stock is often completely in de pen dent
of the daily price that a stock trades for. That’s a profound con-
cept, but one that is often forgotten. Consider the degree to which
it is still ignored in most coverage of stocks.
To an alarming degree, the chatter that makes up stock “anal-
ysis” focuses on what the price of a stock is and where it’s going
next. Tune in to any fi nancial network, and you’ll fi nd talking
head after talking head telling you “don’t fi ght the tape,” “the
trend is your friend,” or “this stock is dead money.” Any one of
these “insights” is nothing more than a prediction about where the
stock is headed in the short term. The value investor couldn’t
care less where a stock is headed or has been. Rather, the ques-
tion is: What should a rational private investor pay for the whole
company?
The answer to that question is the stock’s intrinsic value, and
knowing whether a par tic u lar stock is worth buying or selling
by comparing its price to its intrinsic value sets the value inves-
tor apart.
VALUE HUNTERS
Benjamin Graham concentrated on what a company had in liq-
uid or near liquid assets: cash on hand and those assets closest to
cash, such as inventories and accounts receivable. Back in Gra-
ham’s day (the 1920s to 1950s), the market was so inefficient at

76 THE MOTLE Y FOOL MILLION D OLL AR PORTFOLIO
gathering and digesting information that you could make an
easy fortune simply buying companies that were trading at a
market value lower than what they had in net cash. Those were
the days!
Alas, now it is well known that companies trading for less
than their cash and liquid securities on hand are typically great
investments. You’ve got to dig a bit further today, but the search
is more than worth it.
The difference between price and value is at the heart of the
value investor’s approach. As Warren Buffett said, “Price is what
you pay. Value is what you get.”
The market yields hundreds of different quotes for the price
of a stock every day. If you track every tick up and down through-
out the day, the actual number of prices for a pop u lar stock will
be in the thousands. Those are all real prices that you can
choose—or not choose—to pay for a stock. But that doesn’t mean
that the value of a company is changing every couple of seconds.
Instead, the intrinsic value of a company can well be increasing
at the same time that the price of its stock is falling.
But if the price of a stock isn’t a correct valuation of the
business, what should give an investor confi dence that buying a
company for a price below its intrinsic value makes for an in-
vestment that can be sold for the actual—and higher—price
later on? Why do we expect the market to come to its collective
senses and see the value that we see? The answer to that ques-
tion is in a famous quote from Benjamin Graham: “In the short
term, the market is a voting machine. In the long term, the mar-
ket is a weighing machine.”
Key to making money in the stock market—particularly in
value stocks, which are often not appreciated for signifi cant
periods of time—is to have the right temperament. You must
have confi dence that the market will ultimately recognize the
value of a company over time. The market price at any given
moment refl ects the fl avor of the month and the whims of buyers
and sellers. When headlines shout that gas prices are skyrocket-
ing, droves of traders sell the shares of companies affected by
BLUE- CHIP BARGAINS 77
gasoline. Any business with the word “fi nancial” in its name
took a tumble with the subprime crisis, even if it was only tan-
gentially related to the mess. When there’s a headline about a
potential new cure for a disease, shares of the company making
the drug take off . . . even though the company is likely years
and many levels of unpredictable hurdles away from reaching
the market.
The market’s extreme focus on the near term creates opportu-
nities. Companies that don’t make headlines, companies that
miss earnings estimates by a penny or two, and those that are
engaged in some form of business that isn’t “sexy” are the com-
panies that make the best value investments.
THREE KEYS TO VALUE
Bruce Greenwald now teaches the value investing course at Co-
lumbia that Graham created, and his book, Value Investing:
From Graham to Buffett and Beyond, provides teachings that
master Graham would surely appreciate. Greenwald says that
there are three things a good value investor must do.
1. Look Closely at the Assets
Start with the balance sheet. How much cash does the company
have? It’s always nice to see companies with piles of cash on hand
because that’ll serve them well when things get a bit rough. You
also want to know what else the company owns—the value of its
buildings, its property, plants, and equipment. What are its pat-
ents and other assets worth? Luckily, all the information you
need is contained on the balance sheet.
The “book value” of the company—everything the company
has minus its liabilities—is the most reliable information you’ll
have. As Greenwald says, “Low market to book all over the
world—every place—has outperformed the market in every ex-
tended period at least by 3% to 5% per year.”
78 THE MOTLE Y FOOL MILLION D OLL AR PORTFOLIO
To clarify, that means that companies with very, very low ra-
tios of market price to book value—those where the market values
the stock at a fraction of the book value of the company—are
stunning outperformers. Such bargains aren’t easy to come by.
Where true blue chips are concerned, you’re unlikely to fi nd big,
well- known stocks trading at a fraction of their book value.
Companies with prices that far out of whack are usually unloved
for a reason. They are more often the spinoffs, the turnarounds,
the bankruptcies, and the other messy situations that classify as
riskier deep- value investments, which is an entirely different
book. (In fact, it’s the subject of a wonderful book entitled You
Can Be a Stock Market Genius, by Joel Greenblatt.)
But by toning that principle down a couple notches, you can
defi nitely fi nd value among the market’s big boys. Blue- chip com-
panies are more likely to have a lot of their value tied to their
brands and other intangible items that don’t necessarily contrib-
ute to book value. They don’t need as much equipment as some
old- line industrials to make massive profi ts. Companies like
Coca- Cola, Kraft Foods, or Pfi zer are comparatively “light” com-
panies in terms of assets, yet at the right price still qualify as
value investments.
2. Know the Present Earnings of the Company
The second most reliable factor is what the company is earning
right now—not what it earned when things were unusually and
temporarily good in the past, and not an estimate of what the
company could earn in some delightfully optimistic version of
the future. We’re optimists ourselves, but we’re not just going to
assume that companies will increase their earnings year after
year at astronomical rates. On average, companies only increase
their earnings by about 3% to 6% per year.
The present gives the best idea of a company’s earnings power.
There will be time to make estimates about the company’s fu-
ture, but the value investor has to be a bit curmudgeonly com-
pared to the typical growth investor.
BLUE- CHIP BARGAINS 79
3. Last and Least, Consider Growth
Many people divide the investing world into two opposing cate-
gories—value and growth. The value investor cares only about
book value and a low P/E multiple; the growth investor scoffs at
these things, investing in companies that rapidly grow their sales
and earnings.
But as Warren Buffett has said, there is no true division bet-
ween value and growth investing. The growth of a company is
always factored into the intrinsic value of an investment. You
cannot determine the intrinsic value of a company without esti-
mating what its future cash fl ows might be. Instead, what distin-
guishes the classic value investor from the growth investor is
that the value investor is looking for a large chunk of the value in
the present. The growth investor is looking for most of the value to
be developed in the future.
Outside of the value framework, most investing strategies
take growth as a given for any company and incorrectly assume
that all growth is good. In reality, a lot of growth can be detri-
mental. Too often, companies are fi xated on growth for growth’s
sake—or worse, for the sake of a management team that rewards
itself with bonuses on the basis of a company’s short- term stock
price or how many acquisitions it can make. But the reality is
that growth often does not benefi t the investor nearly as much as
it enriches the company’s employees and management.
All that growth in sales has to be funded by greater expenses,
whether it’s increases in equipment or more hiring. To fund that
growth, a company either has to funnel much of its earnings into
its own operations or raise additional capital by issuing more
shares or taking on more debt. Either way, that cuts into profi ts.
While growing profi ts leads to winning investments—no great
company of the past century stayed tiny—value investors care
much more about how management uses the company’s assets.
The majority of the time, that means returning money to inves-
tors either by buying back shares (and thus increasing the value
of each existing share) or by increasing the dividend.
80 THE MOTLE Y FOOL MILLION D OLL AR PORTFOLIO
AND THREE LITTLE WORDS
Warren Buffett’s favorite three words are “margin of safety.”
This phrase refers to buying stocks of companies that not
only are underpriced by the market, but are substantially below
your calculated intrinsic value. If investing were as easy as com-
ing up with your own valuation for a stock and then seeing it
proven out, it would make sense to buy all the stocks you could
fi nd that are 10% below what you’ve calculated to be their in-
trinsic value. But we’re all fallible. We all make mistakes about
a company’s true worth because we don’t have perfect vision
into the future.
For that reason, even Buffett isn’t satisfi ed with a 10% or even
a 20% margin of safety, and he’s pretty darned good at applying
a value to a company. He’s going to hold out for ones that are
30%, 40%, or even 50% or more below his fair value calculation.
To give yourself some room for error, wait for companies trading
well below their intrinsic value, ones where the margin of safety
between a conservatively calculated intrinsic value and the mar-
ket price reaches 30% or more. For blue chips, a margin of safety
of 30% is rare; for a high- quality business, 20% may be a better
guide.
Once you’ve conducted the valuation, be patient. Wait for a
good price. Then, when a good price comes around, keep waiting.
Because you’re waiting for a great price.
DIGGING THROUGH THE BLUE- CHIP BARGAIN BASEMENT
In a famous speech given by Warren Buffett in 1984 at the Co-
lumbia University School of Business, he stated that it was no
coincidence that so many successful investors studied under
Benjamin Graham. Buffett said the reason that these investors
decisively beat the market was that they were singularly focused
BLUE- CHIP BARGAINS 81
on fi nding companies trading at prices on the stock market be-
low what a private investor would pay. Ultimately the approach
works because it depends on the discipline to ignore the market’s
fl uctuations. Many other investing strategies are focused on
charts and trading techniques. These buyers and sellers of stock
chart readings create opportunities for the disciplined value in-
vestor.
But value investing also works because, by defi nition, it must.
If you are acquiring stocks below their intrinsic value, the mar-
ket will eventually recognize that value. Or, if not the market it-
self, some company or group of investors will decide to acquire
the company at a premium. Companies available for below their
intrinsic value will always rise in share price . . . except when
they don’t.
BEWARE THE VALUE TRAP
Not all companies that sport some, most, or even all value indica-
tors will be winning investments. Many a company has revealed
itself to be a “value trap”—a company with a low book value or
low P/E ratio that remains in that bin for a long, long time, as
seemingly transitory problems reveal themselves to be perma-
nent.
Take Eastman Kodak. It managed the seemingly impossible
task of returning essentially nothing to investors for 40 years. Its
management issued an endless parade of quarterly reports, an-
nual reports, and profi t warnings explaining that its most recent
problems were now behind it. The company was pointed toward
a brighter kind of future that you’d want to take a whole roll of
pictures of, they would promise—but it hasn’t yet developed.
Not every company that’s going through a rough patch is des-
tined to come back. But if you’re looking at large, high- quality
companies with lengthy histories of success, the odds are in your
favor that the winners will outnumber the losers. And even if
you get a couple bad apples that slowly lose value over time, a

82 THE MOTLE Y FOOL MILLION D OLL AR PORTFOLIO
portfolio diversifi ed among many blue chips will assuredly yield
enough big winners that will, over the long haul, cover for your
disappointments. After all, a loser can only cost you 100% of
your investment, but there’s no ceiling to the upside.
When trying to distinguish the potential winners from the
losers, value investors use many approaches to reach their magic
answer. In a nutshell, however, the classic value investing strat-
egy is to fi nd companies that are unloved. It’s the companies that
are underappreciated based on their assets, their current earn-
ings, and their opportunities for growth that turn up the corners
of the curmudgeonly value investor’s smile. After all, the stock
market is just an auction, and we like to buy merchandise that
few are bidding on. Typically, it will be priced cheaper than its
true value.
BEHIND BIG BLUE
Although we agree with Buffett that the division of the world
into growth and value stocks is somewhat arbitrary, the invest-
ing community persists in neatly dividing it this way. Take the
Russell 1000, an index of what are roughly the 1,000 largest pub-
licly traded companies. Russell divides the index strictly along
that split, with the value half comprising those companies that
have lower price- to- book values and lower expected growth
rates. The value names include many companies from the oil and
fi nancial sectors, well- known businesses that have a lot of assets:
the biggest companies as of early 2008 are ExxonMobil, General
Electric, AT&T, Chevron, Bank of America, JPMorgan Chase,
Pfi zer, ConocoPhillips, Citigroup, and Procter & Gamble.
In the “growth” half of the Russell 1000, the biggest compa-
nies were Microsoft, Cisco, Apple, Google, IBM, Intel, Schlum-
berger, Hewlett- Packard, PepsiCo, and Wal- Mart. That’s obviously
a list primarily of tech companies, plus a few well- known names
that have either decent growth or less in the way of tangible
assets.
BLUE- CHIP BARGAINS 83
The value investor can profi t from both sides of the great in-
vestment divide. That’s because value comes not only in the world
of solid assets, but—on less common but still plentiful occasions—
from great companies that have a strong horizon of reasonable
growth.
Although IBM might currently be classifi ed as a growth in-
vestment, that wasn’t always the case. If you turn back the clock
to 1993, the once- proud leader in technology was stalled in a
de cade- long period of stagnation, having ceded leadership in
computers to younger, faster- moving hotshots like Microsoft.
The stock was stuck at a split- adjusted price of less than $11 per
share, no higher than it had been in—get this—1967.
Sure, the company didn’t seem to have a good story going for
it. It was no longer the technology innovator that it had once
been. But wasn’t there something to like there? To the astute
value investor, there was: an easy- to- discern book value, tangi-
ble assets galore, and actual earnings.
For a good chunk of the year, IBM traded at less than the
worth of its assets. It had a book value below 1, meaning you
could buy the whole company for less than the “book” value of its
assets. It also had begun scraping together some earnings, as
long as you looked past a couple of large non- recurring and
non- cash charges. But looking just a little bit past those stated
earnings, IBM’s business was beginning to produce cash again.
The company was trading at the end of the year for less than 15
times earnings adjusted for the one- time charges, below the mar-
ket’s average historical multiple, and well below IBM’s historical
multiple.
Most investors had had it with IBM, having watched the com-
pany do nothing for them over the balance of the previous quar-
ter century except pay some dividends—and then suddenly the
dividend was slashed in early 1993. The company looked to be on
the brink, and the market priced it accordingly.
But a few value investors saw opportunity. The company had
new management in the form of CEO Lou Gerstner as of April
1993, and new management can often be the catalyst that turns a
84 THE MOTLE Y FOOL MILLION D OLL AR PORTFOLIO
moribund company around. There were plenty of tangible assets,
cash being one of them, but also property, plants, and equipment,
and the many patents that the company had developed over the
de cades.
It turned out to be a classic value opportunity, and the credit
goes mostly to CEO Gerstner. However, you hardly needed to bet on
the company the moment he came into office. Sure, IBM doubled
in price between its 1993 lows and 1995, but there was still plenty
of value left. From January 1995, when the price was at a
split- adjusted $20 per share, to the end of 2007, the stock again
increased 556%, making it an 11- bagger from late July 1993.
Certainly IBM could go straight down the drain, though com-
panies as big as IBM with sales in the tens of billions of dollars
are much more likely to bounce back. The rewards here were a
reasonable bet, given the assets of the company and its earnings.
You could have made this bet and won handsomely, even if you
did poorly on many other investments. The spectacular rewards
with IBM were not discovered by investors interested strictly in
the growth of the company, as there was no growth to mea sure.
HIGH ON THE HOG
That’s not to say a company has to be on the scrap heap to get a
value investor’s heart pumping. Let’s say you love motorcycles.
When it comes to motorcycles, the best- known name around is
Harley- Davidson, a company so pop u lar that customers tattoo
themselves with the name to show their devotion. This company
exemplifi es value investing on a number of levels. First, it was
one of the truly great value investments of the 1980s and 1990s,
rising from a split- adjusted price of $0.33 a share in 1987 to $40
a share in 2000—that’s more than a 100- bagger. Even if you’d
waited until 1992 when it was at a split- adjusted price of $4 a
share, there was still a lot of fuel left in the tank. It was still good
for a tenfold increase in price over the next eight years—one of
America’s great business stories. Let’s look at why it remained

BLUE- CHIP BARGAINS 85
such a strong value buy for so many years and how you could
have spotted it.
In 1901, 21- year- old William Harley designed a motor to put
onto a bicycle. He was soon joined by his good friend Arthur Da-
vidson, and together they started a company that would eventu-
ally build motorcycles. Over the next 70 years, the company was
private, surviving the ups and downs of the American economy,
with major contributions to the war efforts of both World War I
and World War II. By the 1950s and 1960s, though, the company
saw its reputation diminished, as it was associated with the Hell’s
Angels and other less savory characters.
In 1967, the company was bought out by American Machinery
and Foundry (AMF), which produced leisure equipment such as
snow skis, golf clubs, and bowling balls. AMF mismanaged the
company to the point of near death, and sold it for $80 million in
1981 to a group of private investors, including Willie Davidson, a
descendant of the original Davidson family. They rebuilt the
company, placing a new emphasis on quality that had gotten
away from them for de cades. Customers returned. In 1987, Da-
vidson and friends took the company public.
That was the beginning of a spectacular ride. Shares of Har-
ley at the end of 2007 were worth roughly 110 times what they
traded for when the makers of the Fat Boy fi rst went public. And
that’s with a product that’s right under everyone’s nose.
From the time that it went public to today, Harley- Davidson
has never appeared to be a value stock on the basis of its asset
base. It’s never traded at a particularly enticing price- to- book
ratio. While it has solid assets in the form of its plants, equip-
ment, inventories, and cash, its value came not from to- the- moon
estimates of the company’s future, but from the ability to grow
at a mea sured but prolonged pace while improving its profi ts
from each bike sold (the profi t margin) and sticking to its core
business.
And that’s exactly the way a company that truly belongs in
this style of investing typically goes about creating value. It’s
generally not by expanding outside its core competencies. You
86 THE MOTLE Y FOOL MILLION D OLL AR PORTFOLIO
might recall that Coca- Cola tried to grow by branching into mo-
tion pictures, a value- destroying move epitomized by what is
now the poster child for Hollywood fl ops. From 1982 to 1987,
Coke owned Columbia Pictures, the masterminds behind Ishtar.
That’s the type of growth you want to avoid at all costs, and
not just because the movie was painful to watch. Yes, Coca- Cola
became a great value investment for Warren Buffett . . . but only
in 1987, after it had rid itself of Columbia pictures. Coincidence?
Hardly.
Which brings us back to Harley, which makes motorcycles. For
the better part of two de cades, Harley had the opportunity to do
the right thing with its profi ts—sink them back into the business,
making new and better products, and reaching out to loyal cus-
tomers. In fact, the true glory years for Harley’s stock were those
when management limited how fast the company made bikes.
Rather than make all the hogs it could sell, Harley increased pro-
duction at a rate of only about 10% a year, lower than what the
marketplace could bear. The ensuing scarcity of bikes raised the
value of those machines that did make it to the market. For the bet-
ter part of a de cade, customers were willing to pay more than the
manufacturer’s recommended price. In fact, many were willing
to pay more for used bikes than new ones, just so they didn’t have
to stay on a waiting list.
Harley- Davidson made for an excellent value investment from
the time it came public until at least 12 years later, as the market
continually underestimated the company’s ability to generate cash
for its shareholders. During the seven years between 1988 and
1995, Harley grew sales from $709 million to $1.35 billion—strong
but hardly overwhelming growth. This represents only 9.6% sales
growth per year, and less than that when you factor in infl ation.
But while those numbers are nothing to sneeze at, what was truly
amazing was that Harley’s share price went from an adjusted
price of $0.68 per share on December 31, 1988, to $6.38 on Decem-
ber 31, 1995, a total return of 838%, and a stunning compounded
return of 36% per year. During those glory years for Harley share-
holders, the growth in sales hardly began to tell the entire story.
BLUE- CHIP BARGAINS 87
How did the shares increase in value during a time in which
sales were not especially exciting? For one thing, the company
was becoming more and more profi table on every dollar of sales.
These expanding margins proved that the company was becom-
ing much more efficient in its operations, and instead of focus-
ing on growth, it was more concerned with running its business
better.
At the same time, there was real growth in the operations.
Harley- Davidson had to raise money to grow, but it did so with-
out issuing loads of new shares and diluting existing sharehold-
ers. Over those seven years, the company only increased shares
20%, and then kept its share count steady for the next de cade.
In 2004, it started buying back its own shares. At the beginning
of 2008, the company actually had fewer shares outstanding than
it did 20 years before, a remarkable achievement for a company
selling more than eight times as much product as it was back
then.
Earnings growing faster than sales is defi nitely a marker to
watch for in the value realm. Sales simply can’t grow at levels
approaching 20% per year for long. As Harley proved over that
time period, growing sales below double- digit percentage rates
can be plenty, as long as the business is becoming more efficient.
Harley didn’t need to get reckless and start buying up other op-
erations. It didn’t start selling Hog Beer or Harley- Davidson hot
dogs. It grew internally—patiently, consistently, and intelligently.
In other words, it grew just like a value company should.
THE CHALLENGE OF PATIENCE
Almost everybody can fi nd a classically defi ned value stock right
for them. Whether you like cereal or banks, cola or motorcycles,
medicine or kitty litter (who are you?), you’re bound to fi nd a
company that makes products you know, understand, and enjoy
following. And the results of value investing speak for them-
selves, as we’ve consistently beaten the market in Inside Value.
88 THE MOTLE Y FOOL MILLION D OLL AR PORTFOLIO
Any established path to beating the market’s returns—and with
less volatility than the market’s averages—appeals to the vast
majority of investors.
While it seems obvious that the approach should be appeal-
ing, this strategy just doesn’t take hold for some investors. War-
ren Buffett put it this way: “[I]t is extraordinary to me that the
idea of buying dollar bills for 40 cents takes immediately with
people or it doesn’t take at all. It’s like an inoculation. If it doesn’t
grab a person right away, I fi nd that you can talk to him for years
and show him rec ords, and it doesn’t make any difference. They
just don’t seem able to grasp the concept, simple as it is.”
What Buffett means is that not everybody “gets” the concept
of investing in companies at a deep discount if it means they
have to wait a while, maybe even years, for the market to agree
with their assessment. Many people like the daily action the
market provides, and enjoy guessing the next move—even though
frequent trading has been shown to deliver very poor returns.
More than anything else, the value approach demands patience
and a willingness to stay disciplined without an upward move in
share price to confi rm your thinking. You have to be willing to
wait for as long as it takes for the market to recognize the value
of your dollar, even as it stubbornly remains at “40 cents.”
The best time to buy value stocks is when nobody else wants
them. If everyone “knows” that they are producing the next big
thing, changing the world, or reinventing life as we know it,
shares aren’t going to come cheap. Value stocks, almost by defi ni-
tion, are not the ones grabbing the headlines for their outstand-
ing per for mance or for joining the ranks on the 52- week-high
lists. Value investing will also not work for frequent stock trad-
ers. These are the kinds of stocks that don’t give you a lot of quick
pops and drops. The excitement behind blue- chip value investing
doesn’t reside in life- changing tales of a stock that moved up
800% in a year or two. Those stories were common during the late
1990s with Internet stocks, but as we saw in 2001 and 2002, what
rises dramatically and rapidly often falls with equal fury.
The excitement of blue- chip value investing comes from look-
BLUE- CHIP BARGAINS 89
ing at long- term charts of what value stocks do as a group over a
period of de cades—or what they have done for Warren Buffett.
That extra 2% or 3% a year in returns, multiplied over a lifetime
of investing, makes for some heart- pounding piles of cash down
the line. It will give you your million- dollar portfolio—and much
more.
ADDING VALUE TO YOUR PORTFOLIO
The value approach encompasses an enormously wide range of
styles, which can lead to very different types of stocks in a port-
folio. In the case of Warren Buffett, a large part of his equity
holdings are formed by Coca- Cola, The Washington Post Com-
pany, American Express, and GEICO. These are all companies
that saw more of their value tied to the growth properties of
their franchises than in a strict book value approach. Some, such
as “vulture investor” Wilbur Ross, have made billions by diving
into extreme situations such as bankrupt or near- bankrupt steel,
coal, and textile companies. The approach of value investing is
fl exible enough to permit investors to buy stocks from nearly any
sector as long as it is accompanied by a strict discipline of valu-
ing the security fi rst, and waiting for a sufficient margin of
safety.
How do you build the value portion of your portfolio? Without
getting down too deep into the weeds, you should always remem-
ber that every valuation of a company hinges on an accurate es-
timate of all the future cash fl ows of the business, properly
discounted. You need to estimate how much the company is going
to be making next year, and the year after that, and for all the
years that follow. This is exactly what we teach in detail in In-
side Value.
In the December 2004 issue, advisor Philip Durell recom-
mended toothpaste and soap provider Colgate- Palmolive, pointing
to its excellent balance sheet, high debt rating, shareholder- friendly
policies, and exceptional brand value. At the time, the company did
90 THE MOTLE Y FOOL MILLION D OLL AR PORTFOLIO
not have huge levels of cash lying around, nor did it have tons of
hard assets. Most of the company’s value comes from its ability to
charge a premium for its brands, coupled with a superlative world-
wide distribution system.
Sticklers for companies with price- to- book ratios below 2
would have skipped out on this company, as its metric then was
close to 20. But, as Philip points out, this company’s brand recog-
nition provides a substantial moat, the advantage that keeps
competitors at bay. And as the great value investors have demon-
strated time and again through outstanding investing returns,
products and ser vices that offer wide and sustainable moats are
the ones that reap the biggest rewards.
Philip’s valuation of Colgate- Palmolive was premised mostly
on the company’s proven ability to create cash with its opera-
tions. We’re looking at a company that’s been cleaning our teeth
for around 200 years. There’s a lot of data available on how well
this company typically does over time in terms of growth, and its
current earnings are easy to compare to previous years.
In this case, we have Philip’s estimate of what the growth of
earnings would be—a cool 9% per year. Consider how much more
conservative that estimate is than the more common estimates
you’ll see from Wall Street analysts, which tend to start around
10% to 12% for the most moribund company, and work their way
up from there. Remember that one of the keys to getting it right
as a value investor is not to be too aggressive.
Philip saw the company increasing earnings at 9% a year
from 2004. Between the end of 2004 and 2007, Colgate actually
increased its earnings 9.4%, so over that period at least, the esti-
mate was accurate and conservative. The stock fairly quickly
met the $58 value that Philip had assigned to the company.
Did that mean that it was time to move on? Not at all. The value
of a company is not static. As a company delivers on its operations,
the value of both the cash it has accrued and the new opportunities
that it has identifi ed must be reintroduced into the computation
of the company’s intrinsic value. Throughout the time that Inside
Value has followed the company, the analysts working on the
BLUE- CHIP BARGAINS 91
ser vice have taken the quarterly results, re- run them through the
Motley Fool HQ supercomputer (actually an Excel spreadsheet),
and have redetermined the value. As of May 2008, the calculated
value had moved up to $72.
Somewhat coincidentally, so had the price of a share of Colgate-
Palmolive. For the moment, at least, the newsletter and the market
were on the same page about the value of one stock. A rare excep-
tion to the rule that value and price are two different things.
The realization by the market of Colgate- Palmolive’s value
means that as of May 2008, there was no margin of safety for the
purchase of shares. That’s what happens when a stock moves up
over 60% in a little over three years. However, that isn’t reason
enough to sell shares. It’s better to hold on to securities that are
fairly valued rather than trade in and out of them. Any new money
should be added to other companies that instead are trading at
sufficient margins of safety below their own fair value. Con-
stantly following more companies every month allows the Inside
Value team to invest with that happy margin of safety, which has
helped us earn market- beating returns.
THE PIECE OF YOUR PORTFOLIO
Blue- chip value stocks have made up all or nearly all of the port-
folios of many legendary investors, and for good reason. With
their stability, they don’t require the same level of vigilance by
investors. They aren’t going to be as volatile as riskier fare.
Shares rarely plummet when growth projections are missed.
And, as we’ve mentioned, they usually increase in value over
time. We’re quite fond of blue- chip value stocks.
But that’s not to say you should load up on blue chips to the
exclusion of other asset classes. (And we’re not saying that just
because there are a lot of chapters left to go.) We absolutely think
that blue- chip value stocks and dividend payers are extremely
attractive and provide a foundation of a fully diversifi ed Foolish
portfolio, but they’re just the start.
92 THE MOTLE Y FOOL MILLION D OLL AR PORTFOLIO
As much as we like stability, we also see the value of high re-
turns. By taking on the extra risk in small caps, international
stocks, and select growth companies, you give your portfolio a bet-
ter chance of phenomenal results as opposed to a steady march
upward. But if you make blue- chip value and dividend stocks the
core of your portfolio—especially for beginning investors—you
will be able to make a lot of wrong calls on risky stocks before
they cause too much damage. Great companies selling at a dis-
count provide a solid base that can defend your portfolio against
the worst the market has to offer.
Motley Fool Se nior Analyst—and former SEC attorney—Bill
Barker contributed to this chapter. While his focus at the Motley
Fool has been on the Pay Dirt and Hidden Gems ser vices, Bill is
a value guy at heart who searches for bargains in all aspects of
his life, especially when it comes to tennis shoes.
Visit us at mdpbook .com, where you can get our current top
value stock idea.
CH A PTER 6
THE TREA SURES OF SMALL- CAP INVESTING
A t this point in your journey of investing, we hope we’ve been
able to convince you that the single greatest way to increase
wealth is via the stock market. Nothing—not Trea sury bills, not
municipal bonds, not even home own ership—outperforms the
returns available through the stock market.
Sort of.
Over any given year, it doesn’t matter all that much whether
you own bonds, stocks, CDs, or a decorative spoon collection.
The returns from each on a $10,000 investment during any one
average year amounts to a couple hundred bucks. You’re not go-
ing to get rich on one- year returns.
Sorry ’bout that.
But when you study the outcomes over de cades, it becomes
clear that owning stocks is the greatest wealth- generating action
you can take.
The news only gets better as we glide down the market cap
range into the lesser- known room- to- grow world of small- cap
stocks, the companies that we at The Motley Fool call “Hidden
Gems.” When most people think of stock market investments,
94 THE MOTLE Y FOOL MILLION D OLL AR PORTFOLIO
they think of companies like the ones we’ve already discussed:
Wal- Mart, Google, Coca- Cola, IBM, and other easily identifi able
monsters. Especially for the newbie investor who’s looking for a
little stability, these giant companies seem to offer the safest
ways to invest money in common stocks. Without question, they
do that, and there’s a place for quality large- cap businesses like
these in every portfolio.
The problem is that many of these companies are already too
large to grow substantially over the next three to ten years. And
they’re too well- followed on Wall Street for any investor to gain
a serious pricing edge in the auction market of stocks. Warren
Buffett has warned investors that his returns at Berkshire Hath-
away will necessarily slacken, as he has no choice but to allocate
more and more of his $40 billion in cash into large- capitalization
companies. As much as it pains him, he simply has too much
money to invest in small companies, an area of the market where
he once said he could earn 50% per year. His dilemma is that in
order to invest enough in a small company for it to make any dif-
ference at all to the Berkshire bottom line, he’d have to buy it
outright—a few times over.
If you’re like most individual investors, you don’t have Buf-
fett’s problem. So you have a built- in advantage—an ability to
negotiate into the tiny, inefficient crevasses of the market. And
because of that edge, small caps—which we defi ne as those com-
panies valued between $200 million and $2 billion in market
capitalization—offer individuals the greatest shot at superior re-
turns and in de pen dent wealth.
At our Hidden Gems newsletter service, small caps are our
playground. Given the choice between, say, Wal- Mart and the
leading producer of deer repellent—American Vanguard—you
can probably guess which is the larger company. As of this writ-
ing, Wal- Mart’s market capitalization is $200 billion. American
Vanguard’s is just $400 million. Wal- Mart is 500 times larger.
But which is the better investment opportunity? On average,
the small- cap world of deer repellent, coin counting machines,
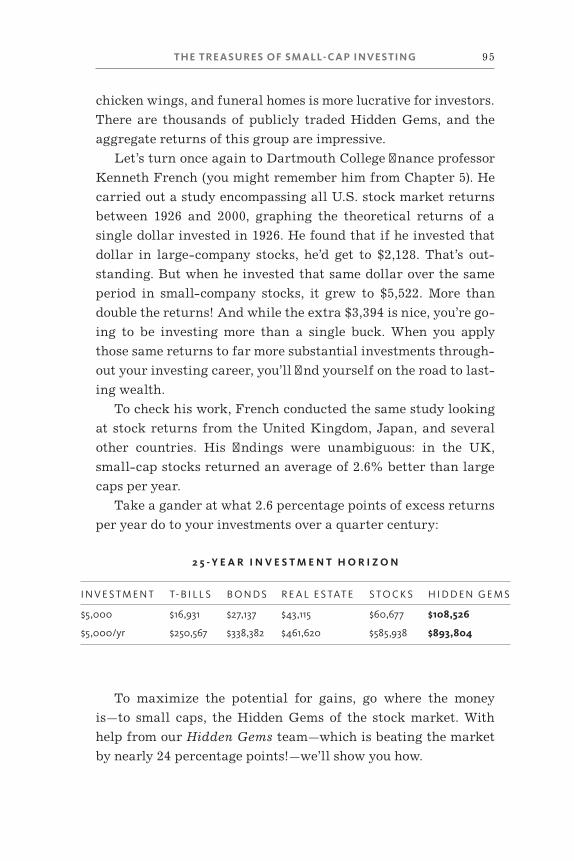
THE TRE A SURES OF SM ALL- C AP INVES TING 95
chicken wings, and funeral homes is more lucrative for investors.
There are thousands of publicly traded Hidden Gems, and the
aggregate returns of this group are impressive.
Let’s turn once again to Dartmouth College fi nance professor
Kenneth French (you might remember him from Chapter 5). He
carried out a study encompassing all U.S. stock market returns
between 1926 and 2000, graphing the theoretical returns of a
single dollar invested in 1926. He found that if he invested that
dollar in large- company stocks, he’d get to $2,128. That’s out-
standing. But when he invested that same dollar over the same
period in small- company stocks, it grew to $5,522. More than
double the returns! And while the extra $3,394 is nice, you’re go-
ing to be investing more than a single buck. When you apply
those same returns to far more substantial investments through-
out your investing career, you’ll fi nd yourself on the road to last-
ing wealth.
To check his work, French conducted the same study looking
at stock returns from the United Kingdom, Japan, and several
other countries. His fi ndings were unambiguous: in the UK,
small- cap stocks returned an average of 2.6% better than large
caps per year.
Take a gander at what 2.6 percentage points of excess returns
per year do to your investments over a quarter century:
2 5 - Y E A R I N V E S T M E N T H O R I Z O N
I N V E S T M E N T T- B I L L S B O N D S R E A L E S TAT E S TO C K S H I D D E N G E M S
$5,000 $16,931 $27,137 $43,115 $60,677 $108,526
$5,000/yr $250,567 $338,382 $461,620 $585,938 $893,804
To maximize the potential for gains, go where the money
is—to small caps, the Hidden Gems of the stock market. With
help from our Hidden Gems team—which is beating the market
by nearly 24 percentage points!—we’ll show you how.
96 THE MOTLE Y FOOL MILLION D OLL AR PORTFOLIO
BUYING THE SEED INSTEAD OF THE PLANT
Small-company stocks offer tremendous opportunity in part be-
cause, relative to large-company stocks, these securities repre-
sent part- own ership in businesses that tend to have a lot more
room to grow. If a software company with $50 million in annual
revenues grows to $500 million, that would transform that busi-
ness and likely enrich investors . . . yet its revenues would equal
just 1% of Microsoft’s sales base. Conversely, for Microsoft to
grow its sales by ten times, it would need to increase its total
revenues from $50 billion to $500 billion, and that would mean
absolute and utter domination of the world of technology.
While we’re sure Microsoft has considered the possibility, in
all likelihood, you won’t land a ten- bagger owning Microsoft
anytime soon. That tremendous growth is in the past for Micro-
soft. Today, the law of large numbers—and anti- trust regulators
who fi ght business monopolies—get in the way. Though not im-
possible, it is going to take a very, very, very long time before
Microsoft returns ten times its present value to shareholders.
The likelihood of scoring a 10- bagger is enhanced if you focus
on the stocks of fi rst- rate small companies that fl y below Wall
Street’s radar—like Microsoft back in 1990. These companies
have far more room to grow, and you can fi nd these stocks on the
cheap because they aren’t being followed closely—if they are fol-
lowed at all—by the investment banks. Gigantic corporations
like General Electric and Pfi zer have their every move scruti-
nized by dozens of professional analysts; their shares are already
held by hundreds of money managers and hundreds of thousands
of individual investors. Finding meaningfully discounted prices
among large- company stocks is daunting.
At Hidden Gems, rather than go where the investment crowd
already is, we spend our days rustling through the dustbins of
the more than 5,000 listed stocks valued under $2 billion, looking
for the best investments. Specifi cally, we look for small compa-
nies with:
THE TRE A SURES OF SM ALL- C AP INVES TING 97
1. Rising demand for their products
2. Great business models
3. Firm fi nancial foundations
4. Forthright managers who hold a signifi cant own ership
stake in their businesses
5. High and rising rates of return on equity
6. Stock prices trading at low multiples to own er earnings
7. Little analyst coverage
8. Scant institutional own ership
BUT FIRST, ONE THING. WELL, ACTUALLY TWO.
Lest we be accused of being too general regarding our affinity
for small- cap stocks, let us make two clarifi cations.
Even within the universe of small- cap stocks, there are in-
vestment fads, crazes, and manias. These often form around “ob-
viously great” companies, often referred to as “growth” stocks.
They operate in temporarily hot industries, with buyers furi-
ously lining up “not to be left behind” (one of the most devastat-
ing phrases in investment history, responsible for more net
investment losses than any other fi ve words). We like growth.
After all, it’s tough for a company’s valuation to shrink while
sales go from $300 million to $3 billion. But when growth com-
panies are considered “obviously great,” everyone already knows
about them. That does no favors for potential investors because
such universal admiration means a higher price for the stock. In
fact, here’s a controversial thought borne out by years of invest-
ment research:
Obviously great companies tend to make for bad stock invest-
ments; obviously horrible companies tend to make for better
stock investments.
We prefer to avoid both camps, searching instead for solid
small companies, unknown to the general public and priced at a
discount.

98 THE MOTLE Y FOOL MILLION D OLL AR PORTFOLIO
How does an investment sour when you have an obviously
great business in the hottest of industries, carry ing a high price
tag? In 2000, Cisco Systems was riding high, in the wake of awe-
some growth in the Internet industry. At a market capitalization
of $550 billion, it was defi nitely not a small cap, but it’s a perfect
example. For a short time, Cisco Systems was the most valuable
company on the planet. When Paul Johnson, an analyst at invest-
ment bank Robertson Stephens, wrote Warren Buffett an open
letter trying to convince him to buy Cisco, he made his argument
using nearly infallible mea sures such as excellent returns on in-
vested capital, spectacular cash fl ow generation, and superlative
growth rates. Cisco was an obviously great company, he main-
tained. And it really was. Yet Buffett didn’t buy.
So what happened to Cisco?
The stock imploded the moment that the unpredictable yet in-
evitable downturn in the computer cycle took place. And we—
well, Tom— were right in the midst of the action. He held the stock
much of the way up and then watched it get clobbered. Cisco’s
shares tumbled from $82 per share down to a low of $8, an in-
credible evaporation of nearly $500 billion in shareholder wealth.
It happens. Cisco was priced as a growth stock. It was obviously
great. And it was already a large- cap company. Be very, very
wary of obviously great large companies tagged with a rich valu-
ation. These companies have less room to grow, are already owned
and followed broadly, and often see their stocks crumble.
Small- cap value stocks are the fl ipside to this fascination
with growth and obvious greatness. The unloved. The forgotten.
The underfollowed. The unknown. For evidence, we return once
again to Professor French and his incredible set of data. His
work shows that since 1926, small- cap value companies have re-
turned 14.9% per year, while small- cap growth stocks have aver-
aged 9.9%. In fact, while small- cap value stocks thrashed the
returns of large- cap companies, small- cap growth stocks actu-
ally trailed them! (Re- read that to be sure you just pro cessed it.
Not all small companies are attractive investments!)
Let’s compare the two in our table format.
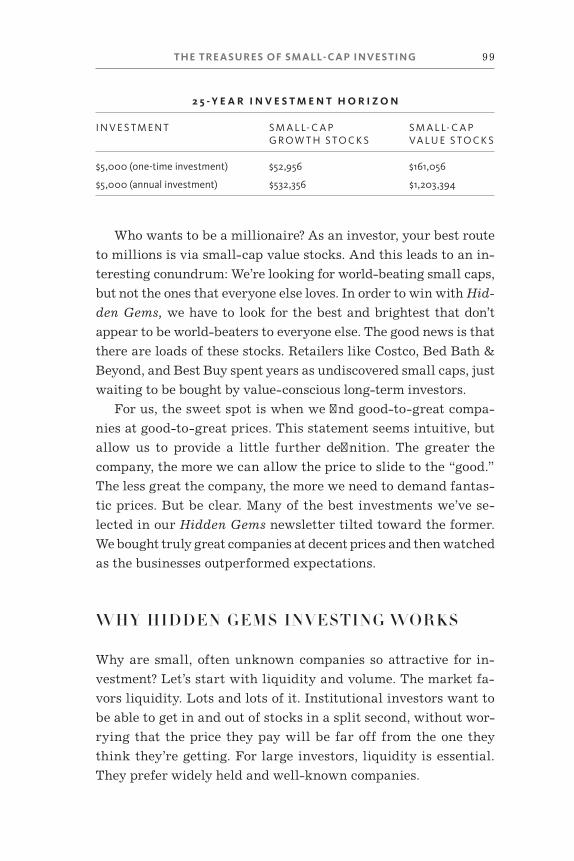
THE TRE A SURES OF SM ALL- C AP INVES TING 99
2 5 - Y E A R I N V E S T M E N T H O R I Z O N
I N V E S T M E N T S M A L L- C A P G R O W T H S TO C K S
S M A L L- C A P VA LU E S TO C K S
$5,000 (one- time investment) $52,956 $161,056
$5,000 (annual investment) $532,356 $1,203,394
Who wants to be a millionaire? As an investor, your best route
to millions is via small- cap value stocks. And this leads to an in-
teresting conundrum: We’re looking for world- beating small caps,
but not the ones that everyone else loves. In order to win with Hid-
den Gems, we have to look for the best and brightest that don’t
appear to be world- beaters to everyone else. The good news is that
there are loads of these stocks. Retailers like Costco, Bed Bath &
Beyond, and Best Buy spent years as undiscovered small caps, just
waiting to be bought by value- conscious long- term investors.
For us, the sweet spot is when we fi nd good- to- great compa-
nies at good- to- great prices. This statement seems intuitive, but
allow us to provide a little further defi nition. The greater the
company, the more we can allow the price to slide to the “good.”
The less great the company, the more we need to demand fantas-
tic prices. But be clear. Many of the best investments we’ve se-
lected in our Hidden Gems newsletter tilted toward the former.
We bought truly great companies at decent prices and then watched
as the businesses outperformed expectations.
WHY HIDDEN GEMS INVESTING WORKS
Why are small, often unknown companies so attractive for in-
vestment? Let’s start with liquidity and volume. The market fa-
vors liquidity. Lots and lots of it. Institutional investors want to
be able to get in and out of stocks in a split second, without wor-
rying that the price they pay will be far off from the one they
think they’re getting. For large investors, liquidity is essential.
They prefer widely held and well- known companies.
100 THE MOTLE Y FOOL MILLION D OLL AR PORTFOLIO
But for small, private investors like us, liquidity stinks. We
dream of a land where there are lots of sellers and no buyers—
except for us. Fortunately, if you’re not too fussy about
semantics, it happens all the time in the small- cap environ-
ment.
Think about what it means for a company to trade $200,000
in share volume per day. That sounds like a lot of money. But in
the global marketplace, that’s signifi cantly less than peanuts.
It’s not even the shells of peanuts. If you’re a fund manager with
$10 billion to invest, how long will it take to build a meaning-
ful position if the stock you like is only trading $200,000 per
day? And what’ll happen to the price as you’re doing all the buy-
ing? It will go up and up and up. For large institutions, getting
into small stocks just isn’t practical, and that’s the heart of
Buffett’s lament.
With only $200,000 moving through a stock over an entire
day, you can bet that no investment bank in the country is going
to offer research coverage, no big mutual fund is going to own it,
and only a handful of institutional investors are going to want to
mess with it. In effect, none of them want to have to explain to
their investment committees, their bosses, or their partners why
this itty- bitty stock sits in their portfolio—a stock they couldn’t
sell in an orderly fashion if necessary. General Electric trades
more volume than that every second. You could cover that much
dollar volume with two shares of Berkshire Hathaway. Why
bother with the guppy?
When a big chunk of the market isn’t even fi shing in the pond
where you’re casting lines, you can fi nd sound companies at ri-
diculously cheap prices. That’s a beautiful thing. We call it “The
Inefficient Pond Theory,” and we invite any remaining business
school professors or students who think the market is perfectly
efficient to fi sh with us one day. The waterways where small caps
swim offer a great deal of inefficiency because there just aren’t
that many ready buyers.
The big difficulty with small- cap investing is that the compa-
THE TRE A SURES OF SM ALL- C AP INVES TING 101
nies in this realm tend to be obscure. Everyone has heard of
Home Depot, which has 2,200 stores, generates annual revenues
of nearly $80 billion, and has a market capitalization of $40 bil-
lion. Few people, though, have heard of Duckwall- ALCO, a
variety- store chain that has 262 locations in 23 states concen-
trated in towns with fewer than 5,000 people, has revenues of
$500 million, and a market cap of less than $40 million.
Duckwall- ALCO may or may not be a good investment. What
we can guarantee you, though, is that the market pricing around
Duckwall- ALCO is much less efficient than it is for Home De-
pot. There are dozens of Wall Street analysts who follow Home
Depot. There is one analyst following Duckwall- ALCO. There
are thousands of investors paying attention to every move that
Home Depot makes. Duckwall- ALCO trades on average just
$100,000 per day. Virtually no one is watching. There simply is
no big money pushing the shares around; it wouldn’t be worth
their time.
So while Home Depot’s price calibrates quickly on the con-
sensus of thousands of people as to how the fi rm is doing,
Duckwall- ALCO’s value on a daily basis may be determined by a
single investment club in Dubuque. Point being, there is little at-
tention being paid to these small companies. And in the markets,
a lack of attention is a key ingredient for long- term value.
THE MARKET IS WILD
Let’s revisit Buffalo Wild Wings, the Minneapolis- based pur-
veyor of chicken wings we mentioned a few chapters back. To il-
lustrate our point in this chapter, we recently pulled some data
for the stock:
52- week high: $44.19
52- week low: $18.25
Variance: 58.7%
102 THE MOTLE Y FOOL MILLION D OLL AR PORTFOLIO
Is the market really suggesting that this business was worth
$775 million in July 2007, but only $321 million the following
January? Yes, this is exactly what the market is suggesting. The
real question we need to answer is “What’s the business worth?”
Because it ought to be obvious that a fast- growing company can-
not be worth $300 million and $800 million at roughly the same
time. Our goal as investors is to buy $500 million businesses
when the market’s charging $300 million. If you think these
things don’t happen, let us assure you: They happen all the
time.
We like even better when we can buy a $500 million business
for $300 million and watch the company grow into a $3 billion
business. It’s this effect—the fact that great businesses make
themselves more valuable over time—that keeps us from selling a
$500 million business when its market cap increases to $600 mil-
lion. After all, the $500 million valuation is based on our own
analysis, and mathematically speaking, it’s our single point of
highest confi dence in a range of values we believe the company
could be worth. It might be substantially more. If you’re disci-
plined enough to only buy companies when they are priced at the
low end of your range of potential values, your returns over time
are almost guaranteed to satisfy.
Holding a company when it’s in the higher end of your range
of values leaves you somewhat susceptible to a stock drop, given
the lower margin of safety. But if you’ve properly identifi ed the
company as a superior generator of wealth, the biggest mistake
you might ever make is selling it because its shares are a few
dollars too high. If you bought Costco back in December 1987,
for example, your shares rose 75%, from $23 to $40 in about two
months. That’s a great return—but over the next 20 years, the
stock has risen another seven times in value—tax- free. Ulti-
mately, it is nearly impossible to manage superior long- term re-
sults by focusing on short- term aims. Costco has evolved from a
regional small cap into one of the most important retailers in
the world, generating spectacular returns for shareholders in
the pro cess.
THE TRE A SURES OF SM ALL- C AP INVES TING 103
TIME FOR AN EXAMPLE: DREW INDUSTRIES
Small- cap investing isn’t always focused on companies that are
as undeniably exciting as chicken wings and deer repellent. Tom
recommended Drew Industries for Hidden Gems in May 2005.
This White Plains, New York–based company operates in the ex-
traordinarily exciting market of parts and accessories for the
motor home and recreational vehicle (RV) industry. Please
contain your enthusiasm. It’s a company that we found fairly late
in the game. Between 1990 and 2005, it rose 50 times in value. Is
this because the RV market was so explosive that it fl oated all
boats? Were investors so focused on dot- coms that we forgot to
pay attention to the proliferation of white whales on our nation’s
highways?
No. Drew Industries succeeded almost in spite of the sleepy
nature of its business because it is run by a couple of motivated,
shareholder- friendly geniuses. Leigh Abrams and Fredric Zinn
have led this company for four de cades and have made a fortune
for their shareholders. A visit to Drew Industries’ global head-
quarters gives you a sense of the company’s values. We love lead-
ers that are frugal with shareholder money. But nothing prepared
us for our visit to Drew.
Their office is in a nondescript building in downtown White
Plains. Were you to ask the students at the karate studio that
takes up the bottom fl oor of their building if they knew which
company’s global headquarters were located just upstairs, likely
none of them would have a clue. As we rode the elevator up, each
fl oor seemed to carry us back a de cade. The door opened on the
fourth fl oor, and there we were in the 1970s. We half expected
the Brady Bunch to come strolling from behind the wood panel-
ing. The executive washroom sat outside the office suite, down
the hall, and required a key (which was attached to a heavy piece
of wood, so we wouldn’t forget to return it). The place was, in
short, anti- swank.
And yet from this modest place, Abrams and Zinn turned a
104 THE MOTLE Y FOOL MILLION D OLL AR PORTFOLIO
collection of horribly unspectacular businesses into a fantasti-
cally rewarding investment. We couldn’t be happier as long- term
partners with these guys—unless we could have managed to fi nd
them closer to 1990 than we did. We’d probably be happier in that
case, as $20,000 invested in 1990 is worth around $1 million to-
day. That would have given you your entire $1 million portfolio
in one fell swoop.
Let’s take a look at Drew Industries as it relates to our list of
characteristics.
1. A rising demand for products.
In 2002, Drew Industries’ revenue stood at $325 million. By the
end of 2007, it was $668 million, a clean double. Importantly,
earnings per share generally tracked total revenue growth. Many
people focus exclusively on the bottom line as a mea sure of a
company’s health. We think that when investors focus too much
on earnings per share as a mea sure of a company’s health, they
miss something fundamental. It’s easy to use accounting ruses to
grow earnings in the short term. But if a company isn’t putting
out products that people want to buy, then all that accounting
fi ction isn’t going to make a difference in the long run. Drew In-
dustries has demonstrated excellent long- term growth.
2. A sound—even sleepy—business model.
Drew Industries has focused on two major sectors—mobile homes
and RVs. We’ve already noted that these aren’t thrilling sectors.
But guess what? A non- exciting sector is unlikely to draw kids into
a garage or rally PhDs around the lunch table to whip up ways to
form a competing company. Buried trea sure is, in fact, buried.
These aren’t fast- money companies. They’re long- term, steady-
growth, achingly dull businesses. To that we say, “Fantastic!”
A favorite story: A competitor called up Drew management
one day and claimed that Drew was infringing on a patent. CEO
THE TRE A SURES OF SM ALL- C AP INVES TING 105
Abrams consulted a patent attorney who said, “Yes, it’s proba-
ble that you are in fact in violation of their patent.” But rather
than settling, Abrams offered to buy the competitor for about
$6 million, which they did. Then Abrams set out to sue everyone
else in the sector, fi guring that if his company was unknow-
ingly violating the patent, in all likelihood, other companies
were as well. Drew Industries has generated more than $25 mil-
lion in settlement- related revenues alone from this acquisition,
not to mention the incremental revenues from bringing the com-
pany in house—all for just $6 million in acquisition costs.
These guys know everything that’s going on in their industry.
They stick to their knitting and they know that the ultimate goal
is to generate cash for their shareholders. The day Drew Indus-
tries cavalierly diversifi es into a sexier business segment is the
day we look for the exits.
3. A firm financial foundation.
The idea here is to fi nd a company with plenty of cash and no
debt. But we’re not doctrinaire about this. Companies sometimes
fi nd that a little debt causes them to act with greater discipline,
as debt repayment requires steady cash fl ows.
We look for companies with low levels of debt, as debt- ridden
companies have an additional risk factor that works in the same
direction as other market risk factors. You know the old adage
about the best time to borrow being when you don’t need the money?
Well, the opposite is also true. If you have a lot of debt that you
need to ser vice and your market suffers a downturn, delaying
that cash payment can push a company into default and bank-
ruptcy. One such disaster happened to the well- known brand
U-Haul. At the moment its business suffered a temporary down-
turn in 2003, its debt ser vice levels exceeded its cash levels.
Boom. Bankruptcy for an otherwise healthy business enduring its
normal cycles.
Drew Industries carries a low level of debt on its balance sheet,
106 THE MOTLE Y FOOL MILLION D OLL AR PORTFOLIO
$27 million as of December 2007, versus $56 million in cash.
Our rule of thumb is that a company’s debt should be no more
than two times its shareholder equity. If it’s much higher, the
fi rm is carry ing an excessive level of debt, as well as other per-
nicious forms of leverage.
4. A forthright leadership team.
One knock on many CEOs is that they have a story to tell—er,
sell. Anything that makes their shares go up today is a good
thing; anything that might make them go down tomorrow morn-
ing is bad. Of course, over the long term, we want the shares to
rise. That’s why we’re here, putting our money to work. But
there’s a danger for companies with share prices that rise with-
out commensurate improvements in the underlying business.
People who buy in at elevated prices on unrealistic expectations
tend to lose, and lose badly. The company’s reputation will suf-
fer. And management—who likely were far too focused on
short- term per for mance—may put the or ga ni za tion in perma-
nent competitive danger over the long haul. A realistic share
price is always better than a distended one if you’re a long- term
own er.
At Drew Industries, the insider directors and executives own
13% of outstanding shares. Naturally, then, a high share price is
of interest to them. Given that self- interest, the following story
may surprise you. Drew Industries’ share price skyrocketed fol-
lowing Hurricane Katrina’s devastation of the Gulf Coast, as the
Federal Emergency Management Agency (FEMA) purchased
nearly 25,000 manufactured homes for transitional housing to
help those displaced by the storm. For many chief executives,
this circumstance would be an ideal time to trumpet the compa-
ny’s growth story—to stoke the fi re just a little bit. We phoned
Abrams, and he warned us not to read anything into the demand
from the federal government. Abrams felt it was likely to be
one- time in nature. Federal agencies have a tendency, in his ob-
THE TRE A SURES OF SM ALL- C AP INVES TING 107
servation, to over- order and then let unused inventory bleed back
into the market. As it turns out, Abrams was right. Company
revenues in 2007 trailed those of 2006, and the chief culprit was
soft demand for manufactured homes.
In every instance, we would rather hear truthful neutral or
negative news from our leadership team than manufactured
glory stories that might jump the stock over the next few days or
weeks. You should adopt this perspective as well.
5. A high rate of return on investments.
As with Drew Industries, we occasionally look at companies that
are not at the moment demonstrating earnings growth, or even
positive earnings at all. We track earnings histories carefully,
and as part of our analysis, we seek to determine whether a com-
pany’s earnings swoon is temporary, cyclical, or a sign of sys-
temic weakness at the fi rm. The fi rst is an opportunity, the second
is a piece of information, and the third a warning of more pain to
come. We look at a few mea sures here for rates of return (what
returns they’re getting on the investments they’re making). We
study the return on assets, return on equity, and return on in-
vested capital at all of our companies and look for signs of im-
provement. All of these are important in helping us determine
the quality of the fi rm and its earnings, as well as the likelihood
of the company generating positive returns into the future.
We seek companies that generate oodles of free cash fl ow. The
stronger a company is, the more it is able to generate excess profi t
to invest in the future, pay dividends, or buy back its stock. Cash
fl ow is an important mea sure for all non- fi nancial companies,
but it’s especially important for small caps that need to reinvest
in their operations to grow. A company lacking positive cash
fl ows is unlikely to thrive, as it will consistently need to go to the
public markets to fund growth.
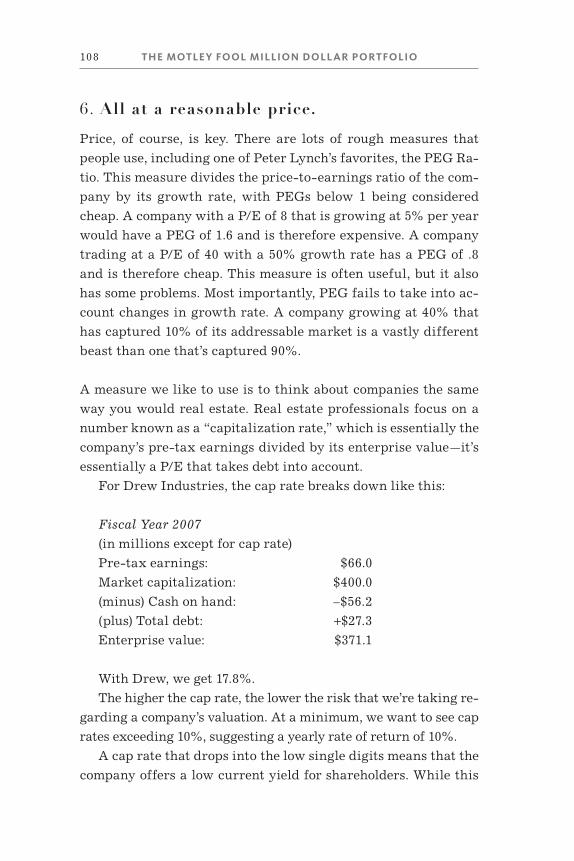
108 THE MOTLE Y FOOL MILLION D OLL AR PORTFOLIO
6. All at a reasonable price.
Price, of course, is key. There are lots of rough mea sures that
people use, including one of Peter Lynch’s favorites, the PEG Ra-
tio. This mea sure divides the price- to- earnings ratio of the com-
pany by its growth rate, with PEGs below 1 being considered
cheap. A company with a P/E of 8 that is growing at 5% per year
would have a PEG of 1.6 and is therefore expensive. A company
trading at a P/E of 40 with a 50% growth rate has a PEG of .8
and is therefore cheap. This mea sure is often useful, but it also
has some problems. Most importantly, PEG fails to take into ac-
count changes in growth rate. A company growing at 40% that
has captured 10% of its addressable market is a vastly different
beast than one that’s captured 90%.
A mea sure we like to use is to think about companies the same
way you would real estate. Real estate professionals focus on a
number known as a “capitalization rate,” which is essentially the
company’s pre- tax earnings divided by its enterprise value—it’s
essentially a P/E that takes debt into account.
For Drew Industries, the cap rate breaks down like this:
Fiscal Year 2007
(in millions except for cap rate)
Pre- tax earnings: $66.0
Market capitalization: $400.0
(minus) Cash on hand: –$56.2
(plus) Total debt: +$27.3
Enterprise value: $371.1
With Drew, we get 17.8%.
The higher the cap rate, the lower the risk that we’re taking re-
garding a company’s valuation. At a minimum, we want to see cap
rates exceeding 10%, suggesting a yearly rate of return of 10%.
A cap rate that drops into the low single digits means that the
company offers a low current yield for shareholders. While this
THE TRE A SURES OF SM ALL- C AP INVES TING 109
won’t necessarily push us off of a company we believe has ex-
traordinary future earnings power, at the moment the company
barely yields better than the risk- free rate offered by U.S. trea-
suries. The best situation of all is for us to fi nd a company offer-
ing a high capitalization rate and extraordinary earnings power
or some other characteristic that the market has not yet recog-
nized. At 17.8%, Drew Industries, even after the super long-term
gains shareholders have enjoyed to date, offers a compelling
investment based on its capitalization rate.
WHEN SMALL CAPS DIE
Right now, you might be wondering why you wouldn’t put 100% of
your money into small- cap stocks. If the returns are better in
small caps, why would a rational investor put a red cent anyplace
else? The truth is, we believe that much of what passes for asset
allocation wisdom is garbage. (We think we’ve laid out a better ap-
proach in Chapter 10.) And we do believe—depending on your age,
income level, and risk temperament—that you could construct a
well- diversifi ed portfolio out of just small- capitalization stocks.
But you have to be aware that the outsized climbs in small- cap
stocks also happen in reverse. And as we’ve seen on multiple oc-
casions (and have been seeing), companies in certain segments of
the market tend to move together, particularly in times of great
volatility. Without knowing anything about any of the constitu-
ent companies, we can almost guarantee that a portfolio made up
exclusively of small- cap companies is going to be substantially
more volatile than the overall market as mea sured by the S&P
500. During the great times, it’s easy to forget what it feels like to
see your stocks lose 20% or 30% or more in a single day. In the
small- cap sector, these declines can happen in a hurry.
Even sleepy little Drew Industries has been a volatile stock.
When we fi rst recommended Drew in May 2005, it was trading
for $18.95 per share. Over the next two and a half years, the
stock was one of our best performers, reaching a high of $44.18
110 THE MOTLE Y FOOL MILLION D OLL AR PORTFOLIO
in October 2007—a 133% gain! However, rising energy costs and
declining disposable income combined to crush Drew’s share
price. As of August 2008, our recommendation was actually
slightly in the red. As we said above, we still believe Drew is a
great company, but it just goes to show that small- cap investors
often must endure sharp declines on the way to outsized gains.
Even if you have the stomach for the potential increased vola-
tility, the fact is that small- cap companies are often far less se-
cure than large caps. Let’s face it—behemoths like General
Electric may have bad years, but short of extreme situations such
as those that occurred with Tyco and Enron, it’s unlikely that
things will be so bad that shareholders will lose a bundle.
Small- cap companies are not in the same boat. They compete
against larger fi rms, they have fewer resources than the big com-
panies, and some of them are pretty speculative. They are also
more dependent on their managers, who may or may not be com-
petent. And so, while you’re unlikely to see sudden, massive gains
in large- cap companies, you can also be pretty confi dent that
you’re not going to have your entire investment wiped away. With
small- cap companies, you will almost assuredly experience both
along the way.
DEFENDING AGAINST THE DANGERS
In our experience, the two greatest risks for small- cap investors
are pricing volatility and the threat of defaults. The greatest pro-
tection against them is to invest in a broad, diverse array of
small- cap companies within your overall portfolio. Investors
will hotly argue the relative merits of broad versus concentrated
portfolios, and there are convincing arguments on both sides.
While broad diversity will temper the outsized results of picking
a concentrated number of overwhelmingly successful stocks, the
problem, as Peter Lynch wrote, is in knowing in advance which
few are going to work out best!
Some of America’s greatest investors—Lynch, Walter Schloss,
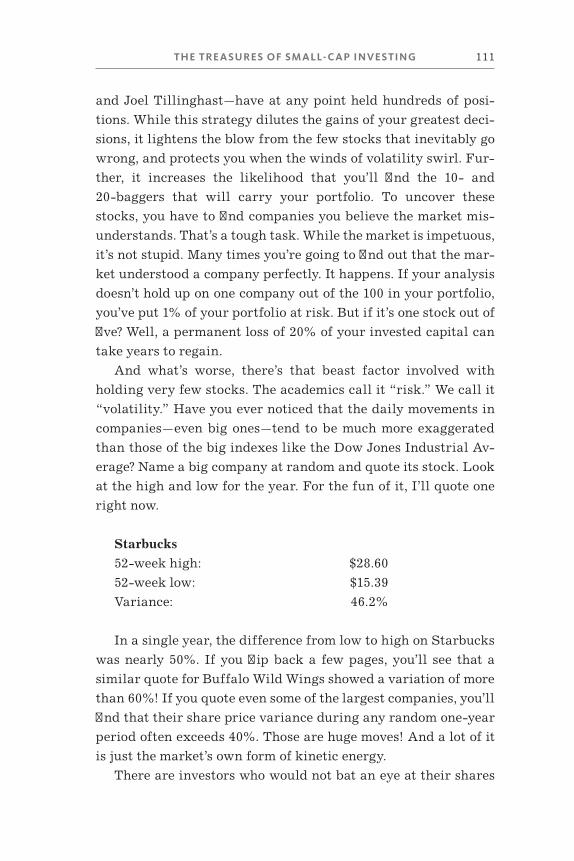
THE TRE A SURES OF SM ALL- C AP INVES TING 111
and Joel Tillinghast—have at any point held hundreds of posi-
tions. While this strategy dilutes the gains of your greatest deci-
sions, it lightens the blow from the few stocks that inevitably go
wrong, and protects you when the winds of volatility swirl. Fur-
ther, it increases the likelihood that you’ll fi nd the 10- and
20-baggers that will carry your portfolio. To uncover these
stocks, you have to fi nd companies you believe the market mis-
understands. That’s a tough task. While the market is impetuous,
it’s not stupid. Many times you’re going to fi nd out that the mar-
ket understood a company perfectly. It happens. If your analysis
doesn’t hold up on one company out of the 100 in your portfolio,
you’ve put 1% of your portfolio at risk. But if it’s one stock out of
fi ve? Well, a permanent loss of 20% of your invested capital can
take years to regain.
And what’s worse, there’s that beast factor involved with
holding very few stocks. The academics call it “risk.” We call it
“volatility.” Have you ever noticed that the daily movements in
companies—even big ones—tend to be much more exaggerated
than those of the big indexes like the Dow Jones Industrial Av-
erage? Name a big company at random and quote its stock. Look
at the high and low for the year. For the fun of it, I’ll quote one
right now.
Starbucks
52- week high: $28.60
52- week low: $15.39
Variance: 46.2%
In a single year, the difference from low to high on Starbucks
was nearly 50%. If you fl ip back a few pages, you’ll see that a
similar quote for Buffalo Wild Wings showed a variation of more
than 60%! If you quote even some of the largest companies, you’ll
fi nd that their share price variance during any random one- year
period often exceeds 40%. Those are huge moves! And a lot of it
is just the market’s own form of kinetic energy.
There are investors who would not bat an eye at their shares
112 THE MOTLE Y FOOL MILLION D OLL AR PORTFOLIO
moving that much in a concentrated portfolio. These people tend
to be sophisticated investors. For most of us, a broadly diversi-
fi ed portfolio composed of carefully chosen stocks is better. Every-
one has stock investments that go badly. Everyone.
A FEW FINAL HISTORICAL EXAMPLES
Many of today’s greatest companies began their publicly traded
lives as Hidden Gems: small, obscure, and unloved.
Before Wal- Mart was “Wal- Mart,” it was just a chain of 32
unremarkable stores in rural Arkansas. At the company’s fi rst
annual meeting in 1971, there were six attendees—including the
management team. The company was valued at less than $50
million. Today it’s worth around $230 billion.
Many of today’s most successful companies, from Best Buy to
Dell to Taco Bell, share similarly humble origins. There were
early signs of greatness at these businesses, but for years, the
companies were too small to attract Wall Street’s attention.
Of course, it’s easy to identify Hidden Gems in the rearview
mirror (“Dude, I told you Taco Bell could support more than
5,800 U.S. locations!”), but separating the real jewels from the
small- cap pyrite takes a keen eye.
In this section, we’ll profi le three of our favorite Hidden Gems,
and share the qualities that fi rst drew us to these businesses.
And to be fair, we’ll provide one disaster for good mea sure.
Now You’re Cooking: Middleby
You’ve probably never heard of Middleby, but this company may
have cooked more of your dinners than you have. Middleby
manufactures commercial kitchen equipment—ovens, warmers,
fryers, and griddles—for major restaurant chains such as
Cheesecake Factory, Ruby Tuesday, Pizza Hut, and Papa John’s.
The company also provides kitchen equipment for con ve nience
stores, schools, and prisons, and makes food- pro cessing equip-
THE TRE A SURES OF SM ALL- C AP INVES TING 113
ment for companies such as Sara Lee, Kraft Foods, and Tyson
Foods.
Today, Middleby is a profi table growth machine that gener-
ates tremendous return on equity, but that wasn’t always the
case. The company was plagued by declining sales, poor mar-
gins, and a lack of strategic direction until a man named Selim
Bassoul grabbed the reins.
Bassoul is exactly the type of leader we like to see at our Hid-
den Gems companies: passionate, dedicated, and innovative, with
a large own ership stake to boot. In the late 1990s, new manage-
ment, led by Bassoul, radically restructured Middleby’s business.
Instead of serving the entire kitchen, Bassoul chose to concen-
trate on the company’s core competency. He eliminated less prof-
itable businesses such as sink sanitizers, mixers, and refrigerated
deli cases—more than half of the company’s products—and threw
Middleby’s might behind heat.
That was the beginning of a turnaround that has created tre-
mendous value for shareholders. In 2001, Bassoul engineered the
acquisition of Middleby’s biggest competitor, the Blodgett Oven
Company. He also slashed the number of distribution facilities,
reduced total headcount by 36%, and began to aggressively repay
the company’s debt.
At the same time, Bassoul implemented a per for mance- based
culture with the goal of improving sales and operating income
per employee. He emphasized customer satisfaction, energy effi-
ciency, and continuous innovation, introducing higher- margin
products that could cook healthier food faster.
The results were immediate and impressive. Between 2001
and 2003, Middleby’s revenue doubled, while net income in-
creased 11- fold. Margins improved across the board, and the
company’s return on equity leaped from 4% to 35%. As a result
of the Blodgett acquisition, the company now had inroads into
the school and public institution markets, and Bassoul was ac-
tively seeking additional growth avenues.
By the time we discovered Middleby in October 2003, the stock
had already tripled. But at a market cap of just $175 million, it was
114 THE MOTLE Y FOOL MILLION D OLL AR PORTFOLIO
still far too small to attract Wall Street’s attention—only one ana-
lyst followed the company. Since that time, Middleby shares have
appreciated for us more than 530% (a six- bagger!), but Wall Street
remains largely oblivious. Even today, the company is followed by
just seven analysts.
You Calling Us Chicken? Buffalo Wild Wings
We know what you’re thinking. No, we don’t fi nd all our invest-
ment ideas while we’re eating—just most of them.
Although the fi rst B-Wild opened its doors in 1981, the chicken
chain didn’t start fl apping its wings until 1994, when Miracle
Ear found er Kenneth Dahlberg asked his CFO Sally Smith and
controller Mary Twinem to clean up his investment in the strug-
gling sports bar. Smith stepped in as CFO and two years later
jumped to CEO; Twinem took over as CFO. And the business,
with the 90- year- old Dahlberg serving as chairman, has fl our-
ished ever since.
B-Wild’s new management team gave the business a much-
needed kick in the pants. When Smith and Twinem took the helm,
B-Wild lacked any semblance of a brand identity. Customers
couldn’t tell from the exterior whether it was a wing- slinging
sports bar or a tire store. The new management team introduced a
relentless focus on building the brand and enhancing the cus-
tomer experience—making sure patrons could count on the same
fun, family- friendly atmosphere at every B-Wild location. Smith
made it a point to interact with as many customers as possible,
soliciting their feedback on every aspect of their dining experi-
ence, right down to which of B-Wild’s 14 dipping sauces they pre-
ferred (we’re partial to the Mango Habanero).
B-Wild grew from just 35 locations in 1994 to around 250
restaurants when we recommended the company in July 2004.
The company boasted an expanded menu and broader demo-
graphic appeal, and it was successfully penetrating new mar-
kets. By the time we found B-Wild, it was one of the country’s
ten fastest- growing restaurant chains, with sales increasing at a
THE TRE A SURES OF SM ALL- C AP INVES TING 115
33% annual clip. But at a market cap of a little over $200 million,
B-Wild was simply too small for Wall Street’s scrutiny. Once
again, the Street’s loss was our gain: B-Wild shares are up 191%
since that point.
Boring Is Beautiful: Sun Hydraulics
Screw- in hydraulic cartridge valves. Ductile iron subplate mani-
folds. Sun Hydraulics is about as boring as it gets. And that’s
exactly what drew us to this 38- year- old industrial equipment
company.
For the non- engineers out there, Sun Hydraulics manufac-
tures components that help control force, speed, and motion in
machine tools, bulldozers, and other large similar devices. The
company has been profi table every year since 1972, and has paid
out quarterly dividends since it came public in 1997. Sun boasted
excellent margins, a strong balance sheet, and tremendous
growth potential, both domestically and abroad.
That wasn’t even the best part. Sun featured the kind of
family- run, insider- own ership culture we love to see at Hidden
Gems. Sun’s found er and former CEO, Robert Koski, sat on the
board of directors, and his family held a 30% own ership stake
in the company. Koski instituted a unique own ership culture—so
unusual, it became the subject of three Harvard Business School
case studies.
At Sun, there were no job titles or job descriptions, no hierar-
chy, no or gan i za tion al charts, no private offices, and, in fact, no
walls inside the building (except for structural purposes). It was
the ultimate horizontal or ga ni za tion, with only a few top execu-
tives. Employees were cross- trained and encouraged to make
suggestions and changes in all areas, so continuous improvement
was hardwired into the company.
Sun’s success was hardly a secret. From the beginning of 2004
until we recommended it in October 2007, the stock had increased
in value nearly eight times! You know how the story ends by
now—despite Sun’s strong fundamentals, quality management,
116 THE MOTLE Y FOOL MILLION D OLL AR PORTFOLIO
innovative culture, and history of success, only one analyst fol-
lowed the company. We couldn’t be more thrilled—as of this writ-
ing, Sun has returned 20% for us.
Sleep Number Zero: Select Comfort
Select Comfort had much that we look for: a great product, strong
fi nancials, a super- efficient business model, and little Wall Street
attention. Yet we’re using the company as our example of a Hid-
den Gem gone wrong.
We weren’t just wrong about Select Comfort. We were spec-
tacularly wrong about Select Comfort. We loved its product—a
high- quality mattress with air chambers that allowed different
fi rmness settings for each side of the mattress. The company
claimed its “Sleep Number” technology was clinically proven to
help people fall asleep faster and to sleep more comfortably. And
we were believers—Tom purchased a Select Comfort mattress,
and claims he’s never slept better.
Select Comfort’s efficient business model was also attractive.
Select Comfort employed a made- to- order manufacturing pro-
cess and delivery system, which enabled the company to operate
with a negative cash conversion cycle. That means the company
collected payment for its mattresses before it even ordered the
parts to build the bed! That type of efficiency is quite rare, and it
made Select Comfort’s operations far more fl exible than those
of conventional mattress manufacturers like Sealy, Serta, and
Simmons.
The company boasted surging revenues, a pristine balance
sheet with ample cash and no debt, and phenomenal return on
equity. Sound great? We thought so—and that’s why we made
Select Comfort our fi rst (and only) four- time Hidden Gems rec-
ommendation.
But shortly after that fourth recommendation, the Select
Comfort story started to defl ate.
Select Comfort’s unfocused marketing campaign had always
been a concern (a luxury product being hawked via infomercials
THE TRE A SURES OF SM ALL- C AP INVES TING 117
at 3 a.m.?), but we were confi dent that management would craft
the right message to connect with its target customer. However,
repeated advertising revamps failed to generate the kind of
brand awareness enjoyed by arch- rival Tempur- Pedic.
Meanwhile, trouble in the housing market made consumers
question whether they could afford a $3,000 mattress, and Select
Comfort developed a nasty habit of missing its quarterly earn-
ings guidance. The stock began to slide—slowly at fi rst, but
gradually picking up speed as the consumer environment dete-
riorated. Making matters worse, the company conducted a series
of ill- fated stock repurchases that depleted its cash hoard and
forced it to take on debt. By the time we fi nally sold the stock,
Select Comfort had lost about 80% of its value.
Yup. 80%.
Select Comfort will forever haunt our scorecard, but the losses
we incurred on this investment are inconsequential compared to
the value of the lessons we learned. For starters, we now insist
on a top- notch management team—no matter how strong the
underlying business appears.
Select Comfort’s management was waving red fl ags all along,
but we were so enamored with its efficient economic model that
we failed to see them. CEO Bill McLaughlin did an admirable
job of reviving the business from the brink of bankruptcy in
2001, but it should have been clear that he wasn’t the right man
to grow a multibillion- dollar mattress brand. McLaughlin didn’t
love beds. He didn’t have any industry experience. He took the
Select Comfort job after working at Frito- Lay in Eu rope in part
because Minneapolis seemed like a nice place to raise a family.
That’s not enough.
A great CEO must demonstrate passion and mastery in the
fi eld of business in which the company is engaged. We want our
leaders to eat, breathe, and sleep the business, like Selim Bassoul
or the dynamic duo at B-Wild—and we want executives and di-
rectors to own a lot of stock, which Select Comfort’s leaders
did not.
In addition, the management team at Select Comfort didn’t
118 THE MOTLE Y FOOL MILLION D OLL AR PORTFOLIO
demonstrate the Warren Buffett–like partnership mentality that
we value so highly. Management was a little too generous with
stock option compensation for our liking, and more interested in
conducting share repurchase programs than modifying the mis-
erable marketing campaign. We want our CEO, CFO, and board
of directors to feel equal alignment with employees, sharehold-
ers, and customers of the business.
Secondly, the “brilliant” business model may not have been as
brilliant as we originally believed. After all, how often does the
typical consumer actually purchase a new mattress? Even the most
stalwart Select Comfort shopper only needs a new bed once ev-
ery ten years. It’s awfully tough to build brand loyalty when
shoppers are visiting your store once a de cade.
And fi nally, the Select Comfort experience only underscored
the importance of a solid balance sheet—especially at a smaller
company. When we fi rst found Select Comfort, it had $74 million
in cash and zero debt. By the time we fi nally sold out, Select
Comfort carried $43 million in debt and had just $6 million cash
on hand. In a short time period, a few questionable management
decisions transformed a healthy, growing company into a busi-
ness in legitimate danger of bankruptcy.
There is one additional lesson that you can learn from our
Select Comfort experience, and it has nothing to do with stock
selection. Small- cap stocks are risky. Even the most promising
company can turn into a giant pumpkin at the stroke of midnight.
If you decide to be a small- cap investor, make sure you hold a
well- diversifi ed basket of at least a dozen small- cap stocks, and
never put yourself in a position where your fi nancial and emo-
tional well- being is dependent on the per for mance of any single
company.
THE PIECE OF YOUR PORTFOLIO
We’ve already said you could allocate 100% of your capital to
small- cap stocks and create a well- diversifi ed, market- beating
THE TRE A SURES OF SM ALL- C AP INVES TING 119
portfolio. However, for the vast majority of investors, that’s prob-
ably not a prudent approach. We think small caps should consti-
tute at least a portion of your investable assets—probably
somewhere between 10% and 40%, depending on your risk toler-
ance. If you are terrifi ed by the thought of one of your portfolio
holdings losing a quarter of its market value over the course of a
single day, then you’ll probably want to keep that number on the
low end of that range. If you’re willing to accept greater volatil-
ity in exchange for greater potential rewards, then small caps
are right up your alley. One benefi t to evaluating small- cap com-
panies is that they tend to be somewhat simpler structures than
the massive conglomerates with multiple divisions, branches, and
subsidiaries. Dow Jones Industrial Average–component United
Technologies sells air conditioners, he li cop ters, elevator fuel cells,
and aircraft engines. Analyzing its fi nancials requires knowl-
edge of a wide range of businesses. Dawson Geophysical, a
small- cap company, operates seismic ser vices for oil and gas
drillers. To know Dawson Geophysical, you must understand the
economics of oil and gas drilling. We won’t claim this is easy, but
it’s a far less daunting task than sorting out a huge, complex fi rm
like United Technologies.
Over time, small caps beat large caps because they’re un-
known to the general public and generally ignored. Yet they tend
to be easier to analyze than large caps. Investing is a complex
pursuit, involving critical analysis, math, psychology, and even a
little soothsaying. But that doesn’t mean that it can’t be made
simpler. Seek out small- cap companies with the characteristics
we listed above, do a little thinking about the three most impor-
tant elements of the business, and get on the road to mastery of
small- cap investing. By so doing, you’re seeking own ership in
companies most people don’t know about. And this much we can
guarantee—if a company is unknown, it’s much, much harder for
it to be efficiently priced. If you’re looking in places where few
others are, you’re going to fi nd some bargains. And when those
bargains are applied to the stocks of sound and promising small
companies, the sky’s the limit!

120 THE MOTLE Y FOOL MILLION D OLL AR PORTFOLIO
Motley Fool Advisor Bill Mann and analyst Rich Greifner
contributed to this chapter. Bill—a longtime Fool who previ-
ously reigned as co- advisor on Hidden Gems and lead advisor
on Global Gains—once ate an entire plate of Buffalo Wild Wings’
hottest wings and lived to tell about it. Rich, a se nior writer for
our Million Dollar Portfolio ser vice, witnessed this feat and lost
his appetite for a week.
Visit us at mdpbook .com for our best small- cap stock right
now.
CH A PTER 7
RISK TAKERS AND RULE BREAKERS
L et’s begin our adventure in growth stock investing with a
tale—a true one at that. In April of 1770, Captain James Cook
and his crew became the fi rst Eu ro pe ans to land on the east coast
of Australia. Rumors of a southern continent in the far Pacifi c
had been circulating since the time of Ptolemy, but no explor-
atory voyage had ever achieved more than glancing blows off
the north and west coasts. By the time of Cook’s voyage, there
were serious doubts as to whether the southern continent even
existed.
When he set off in the Endeavour in 1768, Cook’s chief mis-
sion was to sail to Tahiti and take mea sure ments that would help
establish the distance of the sun from the earth. Exploration was
an afterthought, but his choice to take the westward route on his
homeward voyage changed the course of history.
Cook’s journey brought him into contact with the Tahitians
and Maori people of New Zealand, but little prepared him for the
reaction of the aboriginal Australians, described by Robert
Hughes in The Fatal Shore, a history of Australia’s founding.
122 THE MOTLE Y FOOL MILLION D OLL AR PORTFOLIO
It was the largest artifact ever seen on the east coast of
Australia, an object so huge, complex and unfamiliar as to
defy the natives’ understanding. The Tahitians had fl ocked
out to meet her in their bird- winged outriggers, and the
Maoris had greeted her with hakas and showers of stones;
but the Australians took no notice. They displayed neither
fear nor interest and went on fi shing.
When Cook and three other men landed on shore in a small
craft, however, the native Australians reacted with alarm and
fear. They had quite simply not seen the huge, high- masted ship
pass their fi shing boats; its enormity was simply too great and
alien for them to mentally pro cess.
Business is full of invisible ships—challenges to the status
quo so unexpected that they are imperceptible, sometimes even
when they are in plain view. The goal of investing in what we call
Rule Breakers—emerging growth companies with some special
characteristics—is to join the band of pirates aboard these invis-
ible ships. We want to be there for a share of the booty when a
new company emerges to dominate a business niche.
Let’s get one thing straight up front: Not all growth compa-
nies are Rule Breakers. But all Rule Breakers exhibit, or promise
to exhibit, extraordinary growth. Most are small- cap stocks. So
while Rule Breakers would generally be lumped into the category
of small- cap growth, there are some special characteristics that
distinguish them from the herd.
DISRUPTION IS IN ITS DNA
In the late 1970s, common wisdom held that no newcomer could
ever join the ranks of the world’s largest pharmaceutical compa-
nies. Most of the well- known drug companies—house hold names
like Pfi zer, Johnson & Johnson, Merck, and others—trace their
origins back to the 19th century. They were built over de cades,
deploying huge amounts of capital to build up imposing infra-
RISK TAKE R S AND RULE B RE AKE R S 123
structures. That a newcomer could catch up seemed far- fetched.
The pharmaceutical R&D pro cess for a single drug can take
more than a de cade from the lab bench to the pharmacy shelf,
and building an or ga ni za tion that thrives under such constraints
requires not only a lot of capital, but patient capital. Add to that
the need for a global apparatus to distribute and sell drugs
around the world—it just wasn’t something a start- up could rea-
sonably hope to accomplish.
In the midst of that environment, a company called Amgen
started exploring the commercial possibilities raised by new ge-
ne tic engineering technologies. In 1973, for the fi rst time scien-
tists spliced instructions for making a protein into an unrelated
host organism. Microscopic cells grown in a vat could become
factories for a new kind of medicine: biologic drugs.
It wasn’t that Amgen was a stealth or ga ni za tion or that it was
working with arcane knowledge. The recombinant DNA technol-
ogy around which the company was built was the subject of a
National Medal of Science. The successful insertion of frog
DNA into a bacterial cell in 1973 by Stanley Cohen and Herbert
Boyer—one of Amgen’s found ers—is often cited as the most sig-
nifi cant discovery ever to be overlooked by the Nobel Prize com-
mittee. But even though anyone involved in biological R&D must
have been aware of the discovery, it didn’t seem like a commer-
cial, competitive threat to pharmaceutical business- as- usual.
Amgen itself struggled with the possibilities raised by new
ge ne tic engineering technologies. In its 1983 IPO prospectus, the
company outlined the handful of projects it was working on. One
was indigo dye. Another was chicken growth hormone. The en-
trenched pharmaceutical industry wasn’t exactly shaking in its
boots.
Yet just two years later, in 1985, another biotech company
called Genentech launched a human growth hormone to treat a
hereditary condition in children. Four years after that, Amgen
launched Epogen, a red blood cell booster that, in a slightly dif-
ferent form, is still the company’s chief source of revenue today.
Still the drug companies paid little notice.
124 THE MOTLE Y FOOL MILLION D OLL AR PORTFOLIO
Fast forward to 1996, 20 years after the birth of the biotech
industry. The aggregate market cap of the entire industry—the
value of every single public biotech company in the world, added
together—was less than that of just one drug company, Merck.
Yet that same year, annual sales of Amgen’s Epogen and its white
blood cell booster, Neupogen, each broke $1 billion for the fi rst
time. The fi rst monoclonal antibody, a new class of biologic that
has added tens of billions of dollars in value to the industry, had
been approved two years before. If the ships on the horizon
weren’t apparent before, surely they were by now, right?
Well, they were to some people. In 1994, David established the
original Rule Breakers portfolio with $50,000, and Amgen as one
of the companies in the original roster. That pick helped the port-
folio return more than 1,200% over the next fi ve years.
Today, Amgen and fellow biotech Genentech are two of the
largest 20 pharmaceutical companies in the world. Through its
health- care sales, Amgen outranks venerable companies like
Schering- Plough and Procter & Gamble, and trails only a little be-
hind Eli Lilly, a company founded exactly a century before
Genen tech. Perhaps even more signifi cantly, the biotech industry
has become one of the main sources of innovation for the old
guard. Though they haven’t given up on conventional pills, the
mainstream pharmaceutical industry has transformed itself,
through acquisition and investment, into a branch of the biotech
industry. They throw billions of dollars every year at small bio-
tech companies, looking to license the next big blockbuster drugs,
which are proving increasingly elusive to their in- house R&D ef-
forts.
Now that’s creative disruption for you.
PROFIT, EVEN THROUGH HINDSIGHT
After you fi nish reading all about small caps and value and mu-
tual funds and retirement, hold on to at least one key point from
this chapter. It’s easy to look back with hindsight and say, “Look
RISK TAKE R S AND RULE B RE AKE R S 125
how important this technology turned out to be!” But making
massive profi ts from the advent of the biotechnology industry
didn’t require being a visionary who saw what few others did in
the early 1980s. You could have waited until the leading company
in the sector had multiple billion- dollar products and still racked
up market- crushing returns.
Where are the creative disruptions happening today? Some
are undoubtedly just bubbling up now, invisible to all but a few.
But others have matured enough to become apparent to investors
willing to break a few rules, and still offer great potential re-
turns. Are those opportunities in solar power? In robotics? In
something seemingly boring, like soft drinks? Maybe all of the
above?
To fi nd these companies is a challenge to your sleuthing abili-
ties. To buy them can be a challenge to your well- honed impulses
as a cautious investor. Often these companies don’t have the
qualities we expect to fi nd in a “smart” investment. They may be
losing money. They may trade at an exorbitant P/E multiple. A
consensus of investment banking analysts may not agree the
company is a “buy.” In fact, you may not fi nd any analyst that
reports on them at all.
But that’s not to say that Rule Breaker investing is about tak-
ing giant gambles on unproven, blue- sky ideas. Sure, trying to
recognize the ramifi cations of important innovations before oth-
ers do is part of the approach—and as we’ll discuss later, Wall
Street hands the individual investor some built- in advantages in
that regard. More importantly, it’s about recognizing the compa-
nies already creating a new niche, and identifying the ones that
are going to dominate tomorrow.
In other words, it’s the ultimate in growth investing, and us-
ing this strategy, David’s Rule Breakers newsletter ser vice is
beating the market by more than 12 percentage points.
126 THE MOTLE Y FOOL MILLION D OLL AR PORTFOLIO
WHY BUY GROWTH?
Why are investors obsessed with growth? That’s not a riddle. The
answer is straightforward: Because growth, more than anything
else, drives sustainable increases in earnings and cash fl ow. And
these factors determine a company’s real worth and, hence, its
stock price.
When we talk about growth, we’re basically talking about a
company selling more goods and ser vices this year than it did
last year, and expecting to sell even more the following year.
Increasing sales aren’t the only way for a company to grow the
bottom line—it could, for a while at least, cut expenses and “do
more with less.” It could buy back its own stock and decrease the
denominator used in the earnings per share calculation (as long
as this amount outweighs the loss of interest income from the
money used to repurchase the shares). But there’s only so much
fat to trim, and if a company is going to see its profi ts—and ulti-
mately its stock-price rise over the long term, it must grow the
top line.
But wait a minute. Didn’t we just tell you in Chapter 5 that
value stocks beat growth stocks? Well, yes, we did . . . and they
do . . . broadly speaking.
Unless, that is, you pick the right growth companies.
OK, that may sound like a glib answer—of course you’ll come
out ahead if you pick the right stocks! But the fact is that you’re
not investing in broad concepts; you are investing in carefully
selected businesses—and behind this seemingly foolish state-
ment stands a principle that has enriched a lot of Fools. We’re not
suggesting you search out “hot companies” or high rates of
growth in isolation. Rule Breaker investing is about identifying
companies that are likely to turn a high growth rate—or an
anticipated high growth rate—into a sustainable force to drive
future cash fl ow for a long time. With the right principles and
a little discipline, you can pick these stocks, and the payoff can
be huge.
RISK TAKE R S AND RULE B RE AKE R S 127
EVERYONE’S GOTTA GROW
If we scared you at all about growth earlier in this book, let us
put you at ease now: There is nothing about pursuing strong
growth that contradicts a value- based approach.
Most value investors, if they are looking to hold a stock for the
long term, are ultimately counting on growth to make their in-
vestments gain in value. Outside of a few special situations like
mergers and acquisitions or spin- outs, value investments only pay
off if the company improves operations or increases sales. The
small- cap strategy we outlined in Chapter 6 involves fi nding
largely unnoticed (and therefore underpriced) growth.
The strategy we’re talking about here involves fi nding under-
appreciated growth, and that can be trickier because the com-
panies involved are often quite well known and actively traded.
We don’t necessarily have the liquidity advantages that come
with Hidden Gems. But we have other advantages. We’ll discuss
some of those in a moment, but fi rst let’s take a look at the big
picture. Earlier in the book, we cited research to suggest that
value handily beats growth. Let’s take a different look at the
same question.
A STOCK- PICKER’S GAME
In a May 2002 study, David Kovaleski of SEI Investments looked
at the per for mance of fund managers working in different in-
vestment styles and mea sured them against their relevant bench-
marks. Large- cap value funds were weighted against the Russell
1000 Value Index, and large- cap growth fund managers against
the Russell 1000 Growth Index.
He found that over a fi ve- year period, just 20% of the value
managers managed to beat their benchmark, while 55% of the
growth managers did. That’s a striking difference. Does it con-
tradict other studies that favor a value strategy?
128 THE MOTLE Y FOOL MILLION D OLL AR PORTFOLIO
Not necessarily. It suggests that growth is a strategy in which
stock pickers may have a better chance of success. Buying growth
with a broad- brushed index approach is a formula for underper-
for mance, but some smart choices can lead to outper for mance.
And there are reasons that this makes sense. A good value
investment will rise in price because the market will eventually
take notice of it—either because people become more widely aware
of its per for mance or because they recognize that its problems
are being corrected. As the market corrects its earlier impres-
sions, the stock rises, sometimes dramatically. If it is to continue
to rise, however, the company has to do more than show it is wor-
thy of recognition. It has to perform . . . and grow.
Some “value” investments actually have great growth poten-
tial, while many will at best turn in tepid growth even if all goes
well. The best growth companies, however, will achieve phe-
nomenal expansion. And the very best can keep it up for years,
letting you grow wealth while deferring taxes. That kind of
long- term, high growth is what creates 20- baggers and even 100-
baggers. A single investment like that can transform your port-
folio—your whole fi nancial future, in fact. And you’re unlikely to
fi nd such a company without identifying extraordinary growth
potential. The businesses we’re talking about aren’t just looking
to succeed in an established industry. They want to shake things
up, topple kings, speak truth to power, and all that.
SURE, THERE’S A CATCH
There are two catches. First, rapid growth usually doesn’t last
long. Some companies manage to grow sales at an exponential
rate (over 100%) for a year, maybe even several. But maintaining
that pace eventually becomes impossible. If they are successful,
companies naturally mature to a state of slow growth. They
evolve into the kind of large, steady companies that offer steady,
but usually not large, returns. Using a growth strategy means
fi nding companies that can sustain extraordinary growth longer

RISK TAKE R S AND RULE B RE AKE R S 129
than the market realizes or expects, either because you’ve caught
it early in its growth cycle, or because it has such strong structural
advantages that it maintains a dominant position in its industry.
The second catch is that the market tries to anticipate the fu-
ture. You may have heard about companies being “priced” for
future events, including an expectation that future earnings will
be a lot better than the ones you see today. Sometimes predic-
tions are too rosy; sometimes they underestimate what a com-
pany can do. When they are too optimistic, high- priced stocks
crash down to earth. When they are too cautious, an “expensive”
stock can keep rising, sometimes for years. We want to fi nd the
latter.
FINDING BREAKERS, AVOIDING FAKERS
Rapid growth can lead to big returns . . . or painful mistakes
that will drag down your portfolio. Just how do we fi nd the com-
panies that will win the Darwinian struggle for survival in a
hostile and competitive business environment?
First, recognize that this isn’t just a numbers game. Screen-
ing stocks for high rates of revenue or earnings growth, for in-
stance, may lead you to businesses that have experienced brief
spurts for transient reasons. Think back to our example from
Chapter 6 of how Drew Industries experienced a spike in de-
mand following Hurricane Katrina and the government’s pur-
chase of large numbers of manufactured homes. Drew is a great
company, but if you’d bought on expectations that its 2006 rate of
growth would continue, you’d have been sorely disappointed. (In
fact, those investors who bid the stock up to over $38 a share in
the months following the hurricane undoubtedly were disap-
pointed when it fell back below $24 by the following summer.)
Indeed, those investors who don’t love spreadsheets and math
may feel a special affinity for Rule Breakers. These companies
are hard to assess by traditional valuation metrics like P/E ratios
or discounted cash fl ow calculations. While all companies are
130 THE MOTLE Y FOOL MILLION D OLL AR PORTFOLIO
ultimately valued on their ability to produce cash from their op-
erations, Rule Breakers tend to operate in such a state of fl ux
that trying to predict their future with any kind of numerical
precision is a questionable prospect.
Think of all those analysts who can’t successfully pin down
what a company will earn in a given quarter even after the sales
are all in . . . yet still think they can predict how much the same
company will sell for fi ve years from now out to three decimal
points. And the problem gets much worse when the company in
question is rapidly gaining market share, creating new demand,
and seeing high- double- digit growth—all subject to a lot of vola-
tility. That analysis involves more variables, moving less predict-
ably in larger swings. To paraphrase the statistician John Tukey,
you’re better off being approximately right than precisely wrong,
which is where most numerical analyses will get you with these
kinds of companies.
That doesn’t mean analysis is unimportant. In fact, it’s more
important than ever in the world of Rule Breakers, even if it re-
quires less feverish use of your calculator.
Here are six criteria you can use to help identify a Rule
Breaker. Not every great growth investment has all these traits,
but then again not every growth company is a Rule Breaker. The
companies with these characteristics deserve special attention.
They are more likely to be the businesses that see extraordinary
growth sustained over a long period of time, and defy investors’
expectations. They are the companies most likely to lead you to
market- beating returns.
1. Top Dog and First Mover in an Important, Emerging Industry
A top dog is a company that has a dominant market share in its
industry. Usually that also means it is the largest by market
capitalization. A fi rst- mover business was the fi rst to exploit its
par tic u lar niche—in most cases, it created the market. Think
RISK TAKE R S AND RULE B RE AKE R S 131
DVDs by mail and Netfl ix. Think of Whole Foods Markets in
natural and organic groceries, Starbucks in coffee, or Microsoft
in world domination . . . and software. You might argue that
Starbucks didn’t invent the coffee shop, or that Whole Foods
wasn’t the fi rst to stock its shelves with eggs from free- roaming,
gourmet- fed chickens and gluten- free cereal that has saving the
rain forests as a goal. But they were the fi rst to conceive of these
businesses on a national and international scale, when others
didn’t recognize the major growth opportunities.
Remember also that your prospective investment should be a
top dog, a fi rst mover, and operate in an important, emerging
industry. You may remember Kozmo .com, a short- lived company
that let you order virtually anything over the Internet, from a
single candy bar to a Palm Pi lot, and have it delivered to your
door in under an hour. It was a fi rst mover and, for a time, top
dog in this endeavor. But was one- hour delivery of snacks and
electronics really an important, emerging industry? Likewise,
the ill- fated company Webvan was a fi rst mover in dedicated
home delivery of groceries—a business area that could conceiv-
ably still someday prove important. But Webvan was never top
dog. For a while, market capitalization made it look that way, but
its sales were nothing compared to those of the major grocery
store chains, which had better infrastructure to compete in the
same business. And they did.
2. Sustainable Advantage Gained Through Business Momentum, Patent Protection, Visionary Leadership, or Inept Competitors
In a free market, all successful businesses attract competition.
The critical question is how well a company will fend it off.
Patents are one key means of sustaining competitive advan-
tage. In some businesses, like the pharmaceutical industry, pat-
ents alone are enough to enforce a lasting competitive advantage.
A unique molecule can be patented, and competitors can’t count
132 THE MOTLE Y FOOL MILLION D OLL AR PORTFOLIO
on making a few changes to it and having it work the same way
(there are only a few atoms of difference between Ritalin and
cocaine, for instance—good luck getting the second one past the
Food & Drug Administration!) On the other hand, patent protec-
tion can be problematic in the software industry, where pro-
tected inventions can often be worked around.
Luckily, there are other ways of protecting a competitive ad-
vantage. Companies have trade secrets (the formula for Coke
isn’t patented, but it is a well- guarded secret known to only a
few employees) and expertise can be built over time that others
fi nd hard to duplicate. Some businesses require daunting levels
of capital investment to establish. Other companies are sustained
by their reputation and brand name. Sometimes companies are
just smarter than their competitors, and sometimes competitors
fi nd they just can’t adapt to a changing world. We’ll discuss ex-
amples of both those situations a little later.
The point here is to fi nd a company’s moat—its bulwark
against inevitable competitors—and fi gure out how many alliga-
tors are in it.
3. Strong Past Price Appreciation
What we want to know here is if the stock has already been going
up. Consider Newton’s First Law of Motion, also called the law of
inertia: Corpus omne perseverare in statu suo quiescendi vel
movendi uniformiter in directum, nisi quatenus a viribus im-
pressis cogitur statum illum mutare.
Got it?
Well, OK, we need the translation, too: “Every body perse-
veres in its state of being at rest or of moving uniformly straight
forward, except insofar as it is compelled to change its state by
force impressed.” A translation of the translation is that some-
thing in motion tends to remain that way unless an outside force
acts on it otherwise.
So it is with the best growth stocks. They continue rising be-
RISK TAKE R S AND RULE B RE AKE R S 133
cause their advantages allow them to sustain remarkable earn-
ings and cash fl ow growth, and to win new converts among the
ranks of both customers and investors continuously. Don’t count
on momentum to save your bacon in the absence of other strong
fundamentals. But a strong company that is fi ring on all cylinders
can sustain a remarkably extended appreciation in stock price.
Also remember that the market isn’t stupid. If the company
you’re evaluating strikes success or anticipates great things, some
of that will fi nd its way into the stock price. The market may un-
derestimate the company’s potential, but if it isn’t valued much
at all in the form of a rising stock price, you need to reevaluate
whether this company has the potential you’re banking on.
4. Good Management and Smart Backing
Unless you’re specifi cally looking at a turnaround, spin-off, or
takeover situation, one rule you never want to break is that good
management trumps almost all other concerns. Think of a com-
pany like Target, which we would argue is at its core just another
discount retailer with few structural advantages over its rivals.
Yet by dint of good management, it has returned a lot of value to
shareholders over the years. Better a mediocre business with
great management than a great business with mediocre manage-
ment. Over time, the latter group will screw up a free lunch.
Judging the quality of a management team is a bit subjective,
but that’s because human beings head these companies. Luckily,
we’re human beings, too, and most of us are equipped with some
ability to assess the subjective aspects of personality. As we’ve
suggested in chapters past, listen to conference calls and inves-
tor pre sen ta tions. Even if you can’t talk to management directly,
the Internet makes it easy to hear how the top brass thinks and
how they interact with investors. Are they smart? Visionary? In-
spiring? You’ll necessarily get an imperfect picture, and you may
not be able to put a number on it, but you can get some idea of
whom it is you are entrusting with your money. In addition, the
134 THE MOTLE Y FOOL MILLION D OLL AR PORTFOLIO
heads of Rule Breaker companies are often career entrepreneurs
with a track record of business formation you can look to.
5. Strong Consumer Appeal
It’s almost impossible to underestimate the power of a strong
brand. If a business has mass consumer appeal, sustaining ex-
traordinary growth is that much easier. A brand eventually rein-
forces itself—that’s why a company like Starbucks has never
really had to advertise. A brand also becomes associated with an
experience. We are creatures of habit, and when we have to think
less, our lives seem easier. You may know where your next cup of
coffee is coming from, or where you’ll buy your next computer, or
where you’ll go to look for your next outfi t—without thinking
about it. That’s the habituation that comes from a strong brand,
and it strengthens a company against its competitors immeasur-
ably. Brands also give a company pricing power over rivals—is
that Starbucks venti really worth double the cost of a cup of the
stuff in the corner con ve nience store?
One fi nal thought: We’d rather see a company sell a $1 item to
a million people than a $1 million item to one person. That may
seem counterintuitive, as selling to a million people seems like a
lot more work than selling to just one. But repeat business gets a
lot easier when a product has mass appeal.
Of course, some great companies are engaged in specialty
businesses that are not intended to have mass consumer appeal.
That’s OK, too, but we want to know that the company’s product,
name, and reputation constitute a brand among the people who
matter. Even if you’re looking at some esoteric software business,
ask yourself: Could this company price its product 5% or 10%
higher than its competitors and still maintain market share be-
cause of its reputation?
RISK TAKE R S AND RULE B RE AKE R S 135
6. Grossly Overvalued, According to At Least One Significant Constituent in the Financial Media
This criterion might sound like an odd one. Who wants to buy a
stock that everyone says is too expensive and poised for a tumble?
But this actually aligns with what we said earlier about avoid-
ing “obviously great” companies. In this case, a major media
source is saying they don’t like the stock. Bravo! Being derided
as overvalued is a trait shared by many Rule Breaker companies
that “smart” investors avoid and that then go on to double, triple,
or quintuple over subsequent years. The “too expensive” label
gets thrown around because analysts don’t appreciate how power-
fully a Rule Breaker can disrupt its industry, displace competi-
tors, and grow over a short period. Fear leaves many on the
sidelines, only to come in later and drive the stock up further
once the fi nancial media fi nally gets on board.
These six criteria aren’t guaranteed to weed out every dog, or
to point you to every winner. But they offer a framework for
evaluating fast- growing companies. They can focus your atten-
tion on the characteristics most likely to be shared by companies
that turn growth into extraordinary per for mance over a long
period.
MAKING MONEY BY BREAKING RULES
We’ve outlined an approach for fi nding rule- breaking compa-
nies. But these companies often command high stock prices be-
cause investors already recognize at least some of their advantages.
Winning here means fi nding companies where investors have
recognized, but underestimated, potential growth. Why does the
Rule Breakers approach give you a better chance of fi nding them?
To understand why, let’s consider the concept of discounting.
We’re not talking about marking down last year’s jeans, exactly,
but rather about applying a present value to future dollars. If

136 THE MOTLE Y FOOL MILLION D OLL AR PORTFOLIO
someone says they will give you $100 a year from now, what’s
that worth today? How much money would you take at this in-
stant in lieu of that $100 payment down the road? There’s no ex-
act answer because it depends on the kind of returns you
demand—what you think you can do with money now versus
later. As long as you’re reasonably rational, however, you’d be
willing to take less than $100 now to avoid waiting a year.
Discounting is the art of fi nding present values for future sce-
narios. One of the best means of valuing a company is to predict
what its cash fl ow will be in the future, and discount that back to
a present value. But the faster that company is growing, the more
the present value depends on increasingly distant future cash
fl ows, and the more unpredictable that kind of analysis becomes.
That opens up growth stocks to more uncertainty, risk, and vola-
tility. But it also confers a few advantages.
The fi rst is that most investors are risk- averse. They’d rather
take a smaller risk with a lower payoff than a larger risk with a
higher payoff. That keeps them on the sidelines until the growth
stock that was “too expensive” suddenly becomes the “obviously
great” company everyone just has to own. Then, look out.
The second is what is called conservatism bias, which means
that people are too slow and too timid to update their beliefs in the
face of changing evidence. This scenario is particularly true when
exceptional changes are taking place in a business or industry—
that is, when rules are being broken.
When we think of the future, we tend to extrapolate in a
straight line from the present. Who in the 1980s would have ex-
pected that within a de cade crime rates would be at their lowest
levels since the 1950s? No one we know of. We can model proba-
ble events with reasonable accuracy, but we are terrible at fore-
seeing the impact of the improbable.
Medical technology company Intuitive Surgical fi rst turned a
profi t in 2004. The maker of the da Vinci robotic surgical device
earned 67 cents per share. Plenty of analysts were willing to haz-
ard guesses on what the company would earn several years hence,
but not one dared to suggest it could pull in $3.70 a share by 2007.
RISK TAKE R S AND RULE B RE AKE R S 137
That would be to suggest that over the following three years,
earnings would climb at an annual rate of 77%! To publish such
an outlandish prediction would be to risk ridicule, to appear like
a biased cheerleader more interested in pumping the stock than
in providing a sober estimate of the future.
In fact, Intuitive Surgical did grow that fast. Some analysts
even recognized that Intuitive represented a paradigm shift in
the fi eld of surgery, yet they couldn’t bring themselves to envi-
sion a future so different from the present.
In our 1999 book Rule Breakers, Rule Makers, David haz-
arded a guess on what the market capitalization of Amazon .com
would be in 2009. At the time David was writing, Amazon was
worth about $6 billion. The point was not to predict the future,
but rather to illustrate how futile such long- term projections
were in a fast- changing business. His “mostly, if not completely,
ridiculous” estimate: $18 billion. Amazon’s actual market cap as
of this writing in 2008: $32 billion.
That’s not too bad for a wild, 10- year- old guesstimate. But
just consider that someone who was very bullish on the possibili-
ties of the Internet and the prospects of Amazon .com, writing at
a time when investors were feverishly pushing the valuations of
Internet companies into a speculative bubble of historic propor-
tions, still undershot the mark by almost 50%.
AN INTUITIVE BET
So, are there really any companies out there that satisfy all these
criteria?
Absolutely. We live in a free market society with (relatively)
abundant capital that richly rewards innovation. In an average
year, more than 350 new companies enter the stock market for
the fi rst time, each one claiming something competitive to offer
the world. Few of these are Rule Breakers, but you’ll never run
out of hunting opportunities.
One great example fl itted past just a couple of paragraphs ago.
138 THE MOTLE Y FOOL MILLION D OLL AR PORTFOLIO
Like many great technologies, the magic behind Intuitive Surgi-
cal was born from military funding. In the late 1980s, research-
ers at the Stanford Research Institute, working under contract to
the U.S. Army, created a prototype of a robot that could act as
the hands of a surgeon. The idea was that a skilled surgeon could
operate controls in one location while a robot mimicked those pre-
cise manipulations elsewhere. On the battlefi eld, that meant that
skilled surgeons—always in short supply—didn’t have to be in the
same place as a wounded soldier. The robot just had to be there.
And while the battlefi eld applications were impressive, Intui-
tive Surgical was founded in 1995 by a team of entrepreneurs
and scientists who believed civilian applications weren’t far be-
hind. Procedures conducted by the robot they developed were far
less invasive than conventional surgery—an entire operation
could be performed through a tiny 1-cm “port,” eliminating the
need for large, open incisions. The company’s found ers believed
the technology would shorten hospital stays, reduce healing time,
and improve post- surgical health.
But not many others shared this vision. With little attention
from the outside world, Intuitive refi ned what it called the da
Vinci system, and in 2000 gained FDA marketing approval. The
company went public in the same year. It racked up less than $27
million in sales that year, and the stock traded between a
split- adjusted $10.76 and $38.12 a share.
Intuitive Surgical was added to the Rule Breakers portfolio in
April 2005, at a price of $44.17 a share. The stock had more than
doubled from its debut price, while sales had more than quintu-
pled. Despite a lot of evidence that surgeons were open to the
benefi ts of robotic surgery, investors hadn’t woken up.
Let’s look at how Intuitive Surgical stacks up against our six
Rule Breaker criteria.
1. Top dog and fi rst mover in an important, emerging in dustry.
No questions here: Intuitive invented robotic surgery. It had only
one competitor, a company called Computer Motion that it ac-
quired in 2003. By the time we found it, Intuitive was essentially
RISK TAKE R S AND RULE B RE AKE R S 139
a monopoly. Whether robotic surgery would prove to be an im-
portant industry may have been a matter of debate, but fast-
rising sales of robotic systems, and the more reliable repeat sales
of disposable instruments used with each procedure, pointed to
fast- growing ac cep tance and gave us confi dence.
2. Sustainable advantage gained through business momentum,
patent protection, visionary leadership, or inept competitors. In-
tuitive had established a monopoly because no other company had
the vision to put a stake in the fi eld. As time went on, traditional
bulwarks against competition, such as patents, became increas-
ingly irrelevant. Intuitive had a rapidly swelling installed base of
repeat customers who continued to buy instruments and accesso-
ries. The company’s head start effectively closed out newcomers.
Today, with more than 700 da Vinci systems installed around the
world, a newcomer would be hard pressed to get a foot in the door
without a revolutionary improvement in technology or price.
3. Strong past price appreciation. Intuitive went public in
June 2000, right when the stock market was melting down from
the excesses of the Internet bubble. It wasn’t a friendly environ-
ment for small technology start- ups, but even so, Intuitive more
than doubled from its IPO price over the following fi ve years.
That’s a compound annual growth rate of about 15% over a pe-
riod when the S&P 500 lost ground at an annual rate of about
4%, and the Nasdaq composite fared far worse.
It’s worth noting that Intuitive’s rate of appreciation accel-
erated as the “secret” of the company’s success became more
widely known—the stock went up more than 500% in a period of
less than three years between 2005 and 2007. It “looked expen-
sive” to a lot of investors at $50 . . . and $100 . . . and $200 . . . and
$300 a share. It turns out the acceleration of the stock price was
a fantastic signal to get on board.
4. Good management and smart backing. One of Intuitive’s
co- found ers, Dr. Fred Moll, previously founded two separate
medical device companies subsequently acquired by larger busi-
nesses. That’s an encouraging track record of success, although
by the time we came on board, Moll had handed over the reins to
140 THE MOTLE Y FOOL MILLION D OLL AR PORTFOLIO
Lonnie Smith, whose background was more in managing an es-
tablished business. Major venture backers included the Mayfi eld
Fund, a fi rm responsible for launching Genentech, Amgen, Silicon
Graphics, Compaq, and many others. Of course, qualifi ed man-
agement and blue- chip investors are no guarantee of success. But
it certainly helps to know that a company trying to create demand
for an entirely new category of product has the support of inves-
tors who have made similar things happen many times before.
5. Strong consumer appeal. It might not sound like brand rec-
ognition or sex appeal would have much relevance to a medical
device. But consumers have been one of the drivers behind Intui-
tive’s success. Surgical patients don’t want to experience any more
pain, scarring, or complications than absolutely necessary. The
da Vinci system fi rst made its mark in prostatectomy (surgical re-
moval of the prostate), and informed patients quickly learned that
having the procedure done robotically would get them out of the
hospital more quickly with fewer complications. Demand from
patients helped push hospitals to purchase the machines.
6. Grossly overvalued, according to at least one signifi cant
constituent in the fi nancial media. In July of 2005, just a few
months after we staked a claim in Intuitive, Wall Street Journal
fi nancial columnist Herb Greenberg appeared on the CNBC tele-
vi sion show Mad Money. That’s the program where veteran
trader and TheStreet .com found er Jim Cramer screams out
lightning- fast reactions to dozens of tickers. Greenberg high-
lighted the risks of owning Intuitive, and Cramer urged inves-
tors to cash in on their gains. After all, the stock had moved up
from the mid-$40s in April to about $69 per share in July. Green-
berg and Cramer, who have made plenty of other good calls, were
just two examples of the cautionary voices that abound when a
stock rises “too far, too fast.” Sometimes caution pays. But this
caution was just delaying investors who fi nally couldn’t resist
the company and piled in over the subsequent two- and- half
years, causing the stock to more than quintuple, topping $350 a
share in late 2007. We held it that whole time, and still do today.
It has returned 518% for us versus just 0.5% for the S&P 500.
RISK TAKE R S AND RULE B RE AKE R S 141
Intuitive created an industry that essentially didn’t exist be-
fore. It engaged in what might be termed asymmetrical competi-
tion. The company wasn’t trying to put an earlier generation of
surgical robots out of business—there was no earlier generation.
It wasn’t trying to bully, advertise, or price its way into the high-
est market share. In fact, its real competition was the status quo:
surgeons with scalpels. Because of what the da Vinci system
could offer in throughput, outcomes, and return on investment,
these competitors became Intuitive’s most ardent supporters.
Now that’s a brilliant strategy.
Intuitive didn’t need massive amounts of capital; about $80 mil-
lion in venture capital was used to create a company that would be
valued at more than $11 billion less than seven years after its IPO.
Its advantage was that no one else saw a market while it did. Of
course others see it now, but it’s probably too late for a would- be
competitor to fi nd a foothold. That’s sustainable advantage.
Is Intuitive immune to competition? It’s possible a canny, com-
mitted competitor could enter the fi eld during an upgrade cycle
as users replace older da Vinci systems. It’s possible that better
technology could offer signifi cant improvements over the cur-
rent robots. But you should think twice before betting against
this company.
THE WORLD NEEDS RULE FOLLOWERS, TOO
So are you ready to go out and discover the ultimate growth
companies, like Amazon and Intuitive Surgical, that can
single- handedly build your $1 million portfolio? Great! But keep
in mind that you’re going to lose some money somewhere along
the way.
Every investor, no matter what style or strategy he or she
chooses to pursue, makes mistakes. Everyone. We can make rea-
sonable assumptions and sensible inferences about the future,
but we can’t predict it with any accuracy. We make bets.
142 THE MOTLE Y FOOL MILLION D OLL AR PORTFOLIO
When it comes to growth stocks, your mistakes will cost you.
You’re buying companies priced with the expectation that to-
morrow is going to be a lot better than today. That new technol-
ogy is going to work, that product is going to reach the market,
that demand is going to climb.
If it turns out tomorrow is only a little bit better than today,
you’ll pay. If tomorrow turns out to be worse than today, you’ll
really pay. Rule Breakers tend to be volatile because necessarily
rough predictions of the future are constantly being reevaluated,
amplifying both good news and bad news. You’ve got to have the
stomach for some volatility to invest in Rule Breakers. If the idea
that an investment might lose 30% or more of its value in a single
day gives you a stomachache, it might be a good idea to skip
ahead to the next chapter.
But remember that you should be buying Rule Breakers as
part of a portfolio approach. Just consider: If you own equal
amounts of ten stocks and one drops 50%, your portfolio goes
down 5%. If you own equal amounts of ten stocks and one goes up
500%, your whole portfolio increases in value by 50%. From just
one stock. You can apply that logic on what ever scale you like—a
concentrated portfolio of just a few stocks or a less- volatile port-
folio of 100 stocks. But if you apply the Rule Breakers approach
with diligence and patience, you will fi nd stocks that go up 500%
and more, as Intuitive Surgical has for us. You will also pick some
that go down 90%. We have. Just remember that your Rule Breaker
investments are part of a broader approach to wealth creation.
FLYING INTO THE SUN
Rule Breakers, if they succeed, don’t remain Rule Breakers for-
ever. It’s the rule of Daedalus: You can’t keep fl ying higher and
higher without eventually getting burned. Some companies can
manage exponential growth when they are just starting out.
Even if a newcomer displaces an older industry with a new prod-
uct or ser vice, that product or ser vice will eventually reach a
RISK TAKE R S AND RULE B RE AKE R S 143
level of saturation. Some of the greatest Rule Breakers of the past
de cades are not Rule Breakers any longer. They’ve been success-
ful enough to mature into a slower, steadier state of growth.
In your hunt for new Rule Breakers, look at the circumstances
and strategies that favored the success of past and present Rule
Breakers. Similar dynamics surround some of today’s fast-
growing contenders.
It’s Not Too Late to Wake Up and Smell the Coffee
There’s a decent chance that you’ll be enjoying a cup of Star-
bucks coffee at some point during your reading of this book.
But when did you fi rst hear of the company? Was it when you
bought some fresh beans from a tiny storefront in Seattle in the
early 1970s? Probably not. Was it in the mid–1980s, when Star-
bucks fi rst became America’s answer to the Eu ro pe an coffee-
house, selling espresso drinks from its Pike Place location and
giving customers a place to gather and relax? Again, pretty un-
likely. Maybe it was in the late 1980s, when Starbucks coffee-
houses had spread around the Pacifi c Northwest. Or when the
company went public in 1992, by which time there were 165 stores
operating. Perhaps it wasn’t until the chain opened its fi rst store
in Cincinnati in 1995, by which time there were 676 locations.
Eventually, though, you heard about the chain. No one can blame
you for your ignorance of the brand—or for missing the shares at
their 1992 debut price of 65 cents (split- adjusted). But by the time
Starbucks was starting to expand in Asia in 1996, you could still
have gotten shares for between a split- adjusted $2 and $3.
By June of 1998, the brand was so ubiquitous that the humor
magazine The Onion ran a satirical article headlined “New Star-
bucks Opens in Rest Room of Existing Starbucks.” That same
year, Starbucks was both a plot point and a joke in the romantic
comedy You’ve Got Mail. It was a secret to no one. Yet you could
still have grabbed shares for an adjusted $6. That was still a
pretty sweet embarkation point for a ride to $40 in late 2006.
144 THE MOTLE Y FOOL MILLION D OLL AR PORTFOLIO
Admittedly, few people scored the potential 62- bagger that
this company offered between its debut and what is (thus far) its
peak price in 2006. But as we sit here today, you could have
bought too late and held on too long and still crushed the S&P
500 with a compound annual return of 10.3% from mid–1998 to
mid–2008, a period during which the S&P returned a mere 2.7%.
This company, really no longer a Rule Breaker, created one of the
world’s best brands. It used its early Rule Breaker advantages—
fi rst- mover and top- dog status—to build itself into an iconic pres-
ence. The ubiquity of its stores reinforce the brand. That Starbucks
was so obvious by 1998 is a good deal of what still made it a great
investment.
Online Auctions: Going, Going, Gone!
Monopolies were fi rst outlawed in the U.S. by the Sherman Anti-
trust Act of 1890. For well over a century, it’s been illegal in most
circumstances for one company to exercise exclusive or near-
exclusive control over an entire market or industry. Monopolies
stifl e competition and can, among other things, lead to artifi -
cially high pricing and low levels of innovation. That’s bad for
consumers. But monopolies sure can be good for investors.
In fact, there are monopolies in this country. Microsoft, itself
a former Rule Breaker, has long held a near- monopoly on com-
puter operating systems. It was tolerated as such until the 1998
case United States v. Microsoft declared the company to be an
“abusive monopoly” [emphasis added]. Following appeal, the
company was not forced to break up, and today still holds over-
whelming market share in PC operating systems.
Such de facto monopolies form when competitors can’t gain
an effective foothold against a market leader. And as long as the
dominant company doesn’t do anything illegal to hinder compe-
tition, such monopolies are allowed to exist.
Not all de facto or natural monopolies are Rule Breakers.
Utilities, for instance, have such high start- up costs that they
generally operate as monopolies in their local regions. And by
RISK TAKE R S AND RULE B RE AKE R S 145
now you’ll probably recognize that most utilities aren’t Rule
Breakers by a long shot. But outside such capital- intensive situa-
tions, successfully creating a de facto monopoly is probably
enough to satisfy most of our Rule Breaker criteria. We already
discussed how Intuitive Surgical accomplished this feat, but it’s
not alone. Some businesses are prone to winner- take- all effects.
Consider eBay, the world’s largest virtual garage sale. The
company operates an online marketplace for almost anything
(short of human organs and a few other controversial items). All
eBay does is put together buyers with sellers, and facilitate a bid-
ding pro cess that lets transactions take place. That’s it. It doesn’t
carry inventory, it doesn’t ship goods, it doesn’t take legal re-
sponsibility for buyers and sellers living up to their mutual obli-
gations.
In fact, there’s nothing innovative about this concept. It’s been
around for de cades in other forms such as newspaper classifi ed
ads. What was revolutionary is that eBay took the pro cess online
and made it work on a global scale—which has really hurt the
newspaper business.
Your local paper probably once had a near monopoly in your
community. Even the largest cities only support two major pa-
pers at most. That’s what made the classifi ed ads work. If you
had to list an item for sale in 20 different publications to have a
decent chance of success, you’d probably look for an alternative
marketing channel. For exactly the same reason, eBay was able
to take a visionary idea and a good head start to create an endur-
ing competitive advantage. Sellers sell on eBay because that’s
where buyers go to shop. They may grumble about the fees
eBay charges, but that’s where the game is played. Would- be
competitors have been singularly unsuccessful at wresting away
any sort of meaningful market share from eBay.
Its rule- breaking days are in the rearview mirror for eBay,
but its stock offered exceptional returns to investors who got in
on the ground fl oor. Even investors who bought at the very peak
of the Internet bubble would still be ahead on their investment if
they held shares through today.
146 THE MOTLE Y FOOL MILLION D OLL AR PORTFOLIO
Was eBay unique in exploiting the network effect? Not at all.
We like to think The Motley Fool, with its critical mass of smart
investors engaging in intelligent dialog, offers something of a
network effect in the fi nancial world, especially when it comes to
the world of CAPS (sorry, you’ll have to wait a few chapters to
learn more). And there are other companies out there achieving
similar leverage. You just need to hunt them down!
Cutting Down the Competition with Lasers
IPG Photonics was founded in 1990 with the mission of becom-
ing a leading manufacturer of lasers. That was a tall order. La-
sers have been around since the 1960s, and IPG’s aspirations put
it up against some venerable competitors, including Coherent,
Rofi n- Sinar Technologies, Newport, and even defense contractor
Lockheed Martin.
But IPG doesn’t just make lasers, it makes fi ber lasers. With-
out getting into a lot of technical detail, suffice it to say that
older laser technologies rely on special crystals or carbon diox-
ide gas. Years of technological improvements have created some
powerful and precise devices that can do everything from cut-
ting and welding steel to excising small amounts of tissue to cor-
rect your vision to determining the sequence and structure of
proteins in biomedical research.
Fiber lasers, in contrast to older technologies, consume low
amounts of power, don’t require special cooling or other special
environments, and need far less maintenance. Unfortunately, for
many years, they were so low in power that they weren’t useful
for many applications.
This is where things started to get interesting. Because fi ber
lasers were of little interest to its competitors, IPG had free reign
to innovate, develop, and improve the technology. As it found
niche applications for low- powered fi ber lasers, the big compa-
nies were happy to concede a few unimportant markets. As it
found more customers for its not- quite- so low- powered fi ber
lasers, the larger players still didn’t see a signifi cant threat.
RISK TAKE R S AND RULE B RE AKE R S 147
By the time IPG went public in late 2006, it had nearly
three- quarters of the worldwide market for fi ber lasers. More
importantly, fi ber lasers were beginning to dominate the fi eld of
materials pro cessing—that is, the use of high- powered lasers for
cutting, drilling, welding, and etching that had been the main-
stay of the older companies.
IPG is still a young company, and we don’t know how the
story will end. Its competitors have all belatedly embraced fi ber
lasers and are fi ghting back. But IPG has a serious head start in
patents, expertise, reputation, recognition, and infrastructure,
all of which will prove tough obstacles for its rivals.
Bursting Blockbuster’s Bubble
Many of you probably receive little red envelopes from Netfl ix. If
you’re a fan of movies or just about anything else recorded onto
DVD, there’s a good chance you appreciate the con ve nience of
having your latest selections mailed to your home for a modest
monthly fee, with almost unlimited choices and no worries about
late fees.
Netfl ix started with a rule- breaking vision and executed on it
almost fl awlessly. Despite its imitators, it has benefi ted from its
fi rst- mover and top- dog status, not to mention its excellent man-
agement and its keen focus on customer satisfaction.
But Netfl ix has also benefi ted from something else: Its most
signifi cant competitors proved unable to mount any kind of co-
herent defense against its steady pull of market share. In many
ways, Blockbuster embodies the idea of the inept competitor
spelled out in our Rule Breaker criteria. But let’s take a little
pity on the company—it was put in a tough place.
The advent of the DVD changed Blockbuster’s business.
Blockbuster dealt in VHS tapes—a bulky, fragile, and relatively
expensive medium not readily suited to a mail- order business.
DVDs, on the other hand, are light, durable, inexpensive to re-
place, and easily mailed in fl at envelopes for a low bulk rate.
These differences, perhaps subtle at fi rst blush, made Netfl ix
148 THE MOTLE Y FOOL MILLION D OLL AR PORTFOLIO
possible. They also spelled Blockbuster’s (near) doom. Block-
buster management was slow to adapt to DVDs, and once they
did, they treated them as just another medium to stock on the
shelves. This slow reaction doesn’t refl ect well on Blockbuster’s
management, but there were also powerful forces at work that
made it difficult for the company to counter its new competitor
effectively.
If management had been incredibly nimble and armed with
bold and accurate foresight, Blockbuster would have begun shut-
tering many of its more than 5,000 retail locations back in 2002
when Netfl ix was heating up and Blockbuster stock was at an all-
time high . . . and Blockbuster shareholders would have stormed
the headquarters in protest. Perhaps if Blockbuster had tran-
sitioned its business model and executed on the plan well, it
might have been able to use its high- profi le brand to prevent
Netfl ix from dominating mail- order movie delivery.
But realistically this wasn’t going to happen.
For one thing, Blockbuster still does a lot of business through
its retail outlets and brings in more than four times the annual
revenue of Netfl ix. Getting rid of the stores wouldn’t have made
sense (and that about a fi fth of them are operated by franchisees
would have further complicated the matter). On the other hand,
keeping them meant continuing to support expenses that Netfl ix,
operating out of centralized ware houses with relatively few em-
ployees, simply doesn’t have. Between 1996 and 2007, Blockbuster
reported only two profi table years. Netfl ix has been profi table
every year since 2003.
Blockbuster was stuck with an inferior business model. Chang-
ing it to compete head- to- head with Netfl ix would have been
tantamount to liquidating and starting all over, an option that
management would not have seriously considered, and that
shareholders would not have accepted. Netfl ix has a structural
advantage in its business, which led us to recommend the stock
in Stock Advisor back in 2004. Since then, Netfl ix has risen 96%
while Blockbuster has fallen 68%.
RISK TAKE R S AND RULE B RE AKE R S 149
A RULE BREAKER GONE WRONG
As we noted, checking off companies against our Rule Breaker
criteria, and the deeper diligence that should follow that fi rst
step, doesn’t always guarantee success. We were handed a big
loss in our Rule Breakers portfolio by a company that seemed to
be a sure thing.
Force Protection essentially invented mine- resistant, ambush-
protected vehicles, known more commonly as MRAPs (pro-
nounced EM- raps). The realities of modern urban warfare with
roadside bombs, improvised explosive devices, suicide attacks,
ambushes, and rocket- propelled grenade attacks created a whole
new battlefi eld paradigm. Early in the Iraq War, soldiers in tra-
ditional Humvees suffered a terrible death and injury toll from
such attacks. Even when heavily armored, these older vehicles
often couldn’t survive.
Force Protection created an innovative V-shaped vehicle hull
that defl ected blasts from mines and other explosives outward,
protecting the vehicle and its occupants. In early use, these ve-
hicles amassed an almost perfect safety record. All of a sudden,
the military was awarding billions of dollars in contracts for
MRAPs, and talking about replacing its entire fl eet of Humvees.
Force Protection was the top dog and fi rst mover, and there was
no question that this was an important market. In early con-
tracts, the military appeared to favor Force Protection’s vehicles
over those of its relatively few rivals. Sales exploded—almost 20-
fold in two years—and so did the stock.
Moving down our checklist, we also believed the military
would gravitate toward only one or two models of MRAP, not
wanting to complicate the parts and maintenance issue that would
come with multiple manufacturers. Force Protection, the innova-
tor and seemingly favored vendor, looked like it would win the
bulk of the contracts. There was our sustainable advantage.
When the military awarded the bulk of a large contract to
150 THE MOTLE Y FOOL MILLION D OLL AR PORTFOLIO
Navistar, a company that had actually been delisted from the
New York Stock Exchange because of per sis tent problems with
its fi nancial bookkeeping, we were surprised. But we reasoned
that the government was still in exploratory mode, testing out
different models in real- world applications.
But contracts kept going out to Force Protection’s rivals. It
turned out that the company’s size worked against it. It was
able to grow rapidly because it was starting from a much smaller
base than the major defense contractors, but the military was
worried the company wouldn’t be able to keep up with the pro-
duction demands that went with the large contracts. Force Pro-
tection forged manufacturing partnerships with BAE Systems
and General Dynamics to keep up with demand—cutting out
much of its profi t margin in the pro cess—even as the military
increasingly seemed to favor other models. Worse yet, the com-
pany made a large investment in its own manufacturing capacity
just in time to see demand for the vehicles start to slacken, and
the bulk of contracts to go elsewhere.
Force Protection is still in business, and is winning some gov-
ernment contracts for certain vehicles. But it did not offer the
growth prospects we originally expected. When we sold the
stock, it had lost about 90% of its value.
It was painful to our wallets, but that 90% loss bought us
some valuable lessons. Force Protection wasn’t prepared for the
demand it created with its innovative product, pushing its cus-
tomers to larger, better- capitalized competitors. At the same time,
it relied on too few customers, where just one decision- maker
could dramatically affect its business. Though it was the innova-
tor, it had no real protection against better- heeled imitators that
moved in on an obvious opportunity.
Of course, we knew there were risks when we made the in-
vestment. Force Protection’s shortcomings look clear in hind-
sight, but we also considered most of them upfront. The company
offered a set of risks in which we thought the odds favored suc-
cess. It turns out they didn’t. That happens sometimes. There’s a
lot to learn from Force Protection, but one of the most important
RISK TAKE R S AND RULE B RE AKE R S 151
things to remember is that you will always make some mistakes
as an investor. The upside is that even against such losses—such
expensive, dramatic losses—a few winners will tilt your port-
folio heavily into the black.
THE PIECE OF YOUR PORTFOLIO
Even the most committed, risk- loving, growth- craving Fool
would be loath to suggest that you put your entire savings into
Rule Breakers. While the right stock could catapult your net
worth into the stratosphere, you’d be taking on far too much risk
of steep, potentially unrecoverable loss. Even with a successful
set of Rule Breaker stocks, the inevitable volatility alone would
probably turn you into an insomniac.
But we feel that Rule Breakers should make up a portion of
your stock portfolio. We’ve got no hard and fast rule as to the
exact proportion, except for the general rule of thumb that your
risk exposure should generally decline as your age advances and
retirement draws nearer.
We also think most investors should own a Rule Breaker or
three no matter what their age. They can be tremendous fun, and
the right investment can make a real difference to a portfolio.
When a world- changing company comes along, and you’re smart
enough and lucky enough to recognize it, you should grab it. Be-
lieve us, the company doesn’t know how old you are or what your
risk profi le is.
And consider this: Bell curves, that favorite tool of statisti-
cians, don’t describe most of reality. They work fi ne for some
things. Take height, for example. Most people are between about
5 foot 4 inches and 6 feet 2 inches. The number of people shorter
or taller than this decreases at an accelerating pace as you re-
treat from the statistical norm. You’ll never fi nd somebody two
inches tall or 30 feet tall. It’s not physically possible.
But bell curves fall short (no pun intended) when mea sur ing,
say, wealth. After all, how much wealth can a person have? Not
152 THE MOTLE Y FOOL MILLION D OLL AR PORTFOLIO
less than zero, certainly (assuming we’re not counting debt as
negative wealth). But what’s the upper limit? When it comes to
earning power, you can be 30 feet tall.
When you invest in Rule Breakers, you can lose money. But
unless you’re engaged in short selling or an aggressive derivative
strategy, you can’t lose any more than 100% of your investment.
That’s the total downside.
How much can you gain? We’ve talked about companies that
have increased 10, 20, 60 times in value over relatively short peri-
ods. There’s no upward constraint here, just as there are no limits
on creativity and innovation. Rule Breaker investing is an ex-
pression of that aspiration.
So here’s to being 30 feet tall.
Motley Fool Analyst Karl Thiel contributed to this chapter. A
key part of both the Stock Advisor and Rule Breakers newsletter
teams, Karl enjoys running with scissors, swimming after eat-
ing, and wearing white after Labor Day.
Visit us at mdpbook .com for the Rule Breaker team’s best
growth stock pick.
CH A PTER 8
WE ARE THE WORLD
In our fi rst book, The Motley Fool Investment Guide, we made
the point that one can do just fi ne in this life never looking be-
yond the shores of the United States for investments. After all,
the American economy is the largest, most diverse on earth; the
American legal and regulatory regimes offer the most protection
for minority shareholders; and the U.S. market is less prone to
wild swings than most foreign markets.
We still believe this to be true—we think it would be small-f
foolish to think that one cannot fi nd fortune among American
companies. But we also believe that our previous view was in-
complete. There are opportunities among the 36,000 public com-
panies based beyond our borders that dwarf those of the 18,000
public companies based in the United States. So while you need not
ever invest a dime overseas, we have updated our previous view—a
steadfast refusal to consider international companies makes about
as much sense today as investing only in companies with two syl-
lables in their names. Aiding us tremendously in our under-
standing of and enthusiasm for these incredible opportunities is
154 THE MOTLE Y FOOL MILLION D OLL AR PORTFOLIO
Bill Mann, one of our top investors at The Motley Fool and the
founding advisor of our Global Gains international investing
ser vice.
Many overseas markets, including the growing monsters of
China and India, have improved their regulatory oversight by
leaps and bounds. There are markets with all the legal frame-
work of 19th- century Deadwood, to be sure. Those tend to be
obvious. No one today would confuse the Zimbabwe Stock Ex-
change with the London Stock Exchange, for example.
Besides, the increasing globalization of markets, and the ex-
plosion in individual company cross- listings and exchange- traded
funds (ETFs), have made buying foreign shares easier than ever
before. In fact, international investing can be as easy as picking
a foreign country and buying an index fund based on the per for-
mance of its market. Malaysia? Check. Brazil? Check. Japa nese
small caps? Check. Eu ro pe an bonds? You get the idea.
Of course, the trouble with international investing is that we
can generally only be in one place at once. It is challenging to tell,
for example, what the feeling is on the streets of Jakarta, unless
you happen to be on the streets of Jakarta. To buy foreign equi-
ties, you have to understand some additional considerations and
challenges. In the six months after October 2007, the Shanghai
Composite Index lost nearly 50% of its value, wiping away $2
trillion in wealth for investors. This wasn’t supposed to happen—
the ascendancy of China is considered inevitable. Did this drop
portend cracks in the China thesis or a once- in- a-lifetime op-
portunity? Only investors extremely familiar with the Chinese
economy had a hope of knowing the right answer. Point being,
an investing thesis constructed on a skin- deep understanding
of a country is likely to end with a suboptimal outcome. And we
try to avoid suboptimal outcomes.
WE ARE THE WORLD 155
A FOREIGN STOCK JUNKIE
Bill Mann was in Mongolia in the summer of 2007 visiting a com-
pany with enormous mining concessions—“metal veins the size
of boxcars.” As Bill tells the story, his host took him on a whirl-
wind visit of Ulan Bator, the Mongolian capital, and stood before
him in the center of Sukhbataar Square describing his compa-
ny’s prospects. Bill learned a few things that day. He learned, for
instance, that he should stand in the same direction as his com-
panions, even while having a conversation, to keep the damage
from windborne sand to a minimum. He also learned that the
company had an agreement before the Mongolian congress that
it hoped would be ratifi ed before Naadam, the Mongolian festival
that marked the end of the legislative session (after which most
Mongolians would live in the steppe for the next few months). He
learned that Mongolia was blessed with mineral wealth, but that
Mongolians’ connection to the Gobi Desert was so strong that
they were willing to leave that wealth in the ground rather than
put the Gobi at risk of destruction.
As he stood there, in the middle of the main square of a nation
where even legislators are semi- nomadic, talking to a represen-
tative of a company that hoped to convince them to let it dredge
up a corner of their precious land, it hit him. “Wow,” Bill thought,
“this right here is pretty foreign to me.”
BUYING THE WORLD
Foreign investing is not just a means of diversifi cation—although
diversifi cation is the chief allure for many U.S. investors. Spread
your bets across industries, countries, and market caps, the rea-
soning goes, and you’re less susceptible to a huge hit if one of
those bets goes bust.
We Fools believe in diversifi cation—revisit any previous or
future chapter for a refresher—but it’s not the reason to own
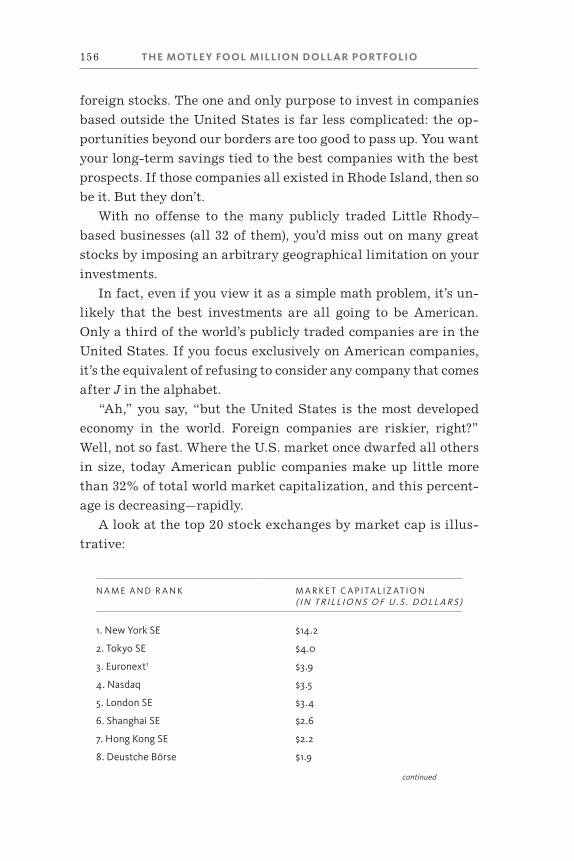
156 THE MOTLE Y FOOL MILLION D OLL AR PORTFOLIO
foreign stocks. The one and only purpose to invest in companies
based outside the United States is far less complicated: the op-
portunities beyond our borders are too good to pass up. You want
your long- term savings tied to the best companies with the best
prospects. If those companies all existed in Rhode Island, then so
be it. But they don’t.
With no offense to the many publicly traded Little Rhody–
based businesses (all 32 of them), you’d miss out on many great
stocks by imposing an arbitrary geo graph i cal limitation on your
investments.
In fact, even if you view it as a simple math problem, it’s un-
likely that the best investments are all going to be American.
Only a third of the world’s publicly traded companies are in the
United States. If you focus exclusively on American companies,
it’s the equivalent of refusing to consider any company that comes
after J in the alphabet.
“Ah,” you say, “but the United States is the most developed
economy in the world. Foreign companies are riskier, right?”
Well, not so fast. Where the U.S. market once dwarfed all others
in size, today American public companies make up little more
than 32% of total world market capitalization, and this percent-
age is decreasing—rapidly.
A look at the top 20 stock exchanges by market cap is illus-
trative:
N A M E A N D R A N K M A R K E T C A P I TA L I Z AT I O N( I N T R I L L I O N S O F U . S . D O L L A R S )
1. New York SE $14.2
2. Tokyo SE $4.0
3. Euronext1 $3.9
4. Nasdaq $3.5
5. London SE $3.4
6. Shanghai SE $2.6
7. Hong Kong SE $2.2
8. Deustche Börse $1.9
continued
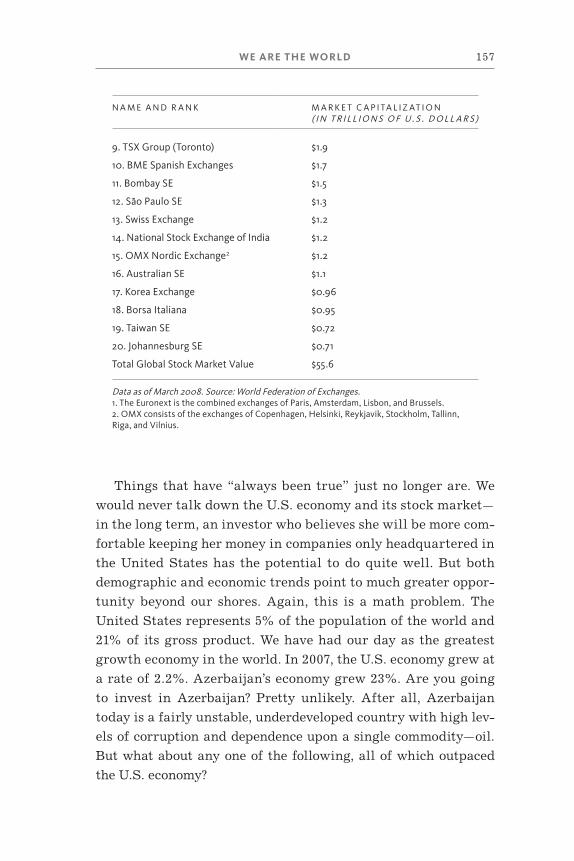
WE ARE THE WORLD 157
N A M E A N D R A N K M A R K E T C A P I TA L I Z AT I O N( I N T R I L L I O N S O F U . S . D O L L A R S )
9. TSX Group (Toronto) $1.9
10. BME Spanish Exchanges $1.7
11. Bombay SE $1.5
12. São Paulo SE $1.3
13. Swiss Exchange $1.2
14. National Stock Exchange of India $1.2
15. OMX Nordic Exchange2 $1.2
16. Australian SE $1.1
17. Korea Exchange $0.96
18. Borsa Italiana $0.95
19. Taiwan SE $0.72
20. Johannesburg SE $0.71
Total Global Stock Market Value $55.6
Data as of March 2008. Source: World Federation of Exchanges.1. The Euronext is the combined exchanges of Paris, Amsterdam, Lisbon, and Brussels.2. OMX consists of the exchanges of Copenhagen, Helsinki, Reykjavik, Stockholm, Tallinn, Riga, and Vilnius.
Things that have “always been true” just no longer are. We
would never talk down the U.S. economy and its stock market—
in the long term, an investor who believes she will be more com-
fortable keeping her money in companies only headquartered in
the United States has the potential to do quite well. But both
demographic and economic trends point to much greater oppor-
tunity beyond our shores. Again, this is a math problem. The
United States represents 5% of the population of the world and
21% of its gross product. We have had our day as the greatest
growth economy in the world. In 2007, the U.S. economy grew at
a rate of 2.2%. Azerbaijan’s economy grew 23%. Are you going
to invest in Azerbaijan? Pretty unlikely. After all, Azerbaijan
today is a fairly unstable, underdeveloped country with high lev-
els of corruption and dependence upon a single commodity—oil.
But what about any one of the following, all of which outpaced
the U.S. economy?
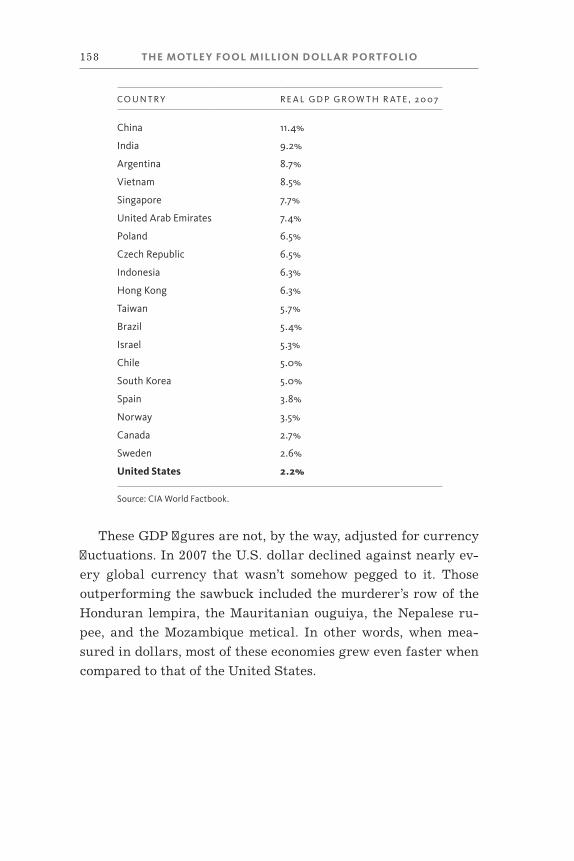
158 THE MOTLE Y FOOL MILLION D OLL AR PORTFOLIO
CO U N T R Y R E A L G D P G R O W T H R AT E , 2 0 0 7
China 11.4%
India 9.2%
Argentina 8.7%
Vietnam 8.5%
Singapore 7.7%
United Arab Emirates 7.4%
Poland 6.5%
Czech Republic 6.5%
Indonesia 6.3%
Hong Kong 6.3%
Taiwan 5.7%
Brazil 5.4%
Israel 5.3%
Chile 5.0%
South Korea 5.0%
Spain 3.8%
Norway 3.5%
Canada 2.7%
Sweden 2.6%
United States 2.2%
Source: CIA World Factbook.
These GDP fi gures are not, by the way, adjusted for currency
fl uctuations. In 2007 the U.S. dollar declined against nearly ev-
ery global currency that wasn’t somehow pegged to it. Those
outperforming the sawbuck included the murderer’s row of the
Honduran lempira, the Mauritanian ouguiya, the Nepalese ru-
pee, and the Mozambique metical. In other words, when mea-
sured in dollars, most of these economies grew even faster when
compared to that of the United States.
WE ARE THE WORLD 159
THERE IS ALMOST NO DIFFERENCE BETWEEN INTERNATIONAL AND DOMESTIC STOCKS
So if you’re thinking about sticking to domestic stocks, you’re
eliminating the majority of companies in the world, and more-
over you’re turning your back on thousands of companies bene-
fi ting from economic tailwinds no longer blowing in the United
States. If you could go back to 1980 and invest in the United States
when the Dow stood at 1,000, would you? Today, that kind of eco-
nomic growth is standing directly before you in countries like
China, India, Vietnam, and even Colombia.
This chapter is a little bit different from any of the others in
this book. International investing isn’t a single strategy, much as
some asset- allocation specialists like to claim that it is. What is
the right level of allocation to foreign stocks? 10%? 20%? 70%? To
us it’s a crazy question. After all, giant Eu ro pe an pharmaceuti-
cal companies have nothing in common with Chinese startups or
South African mining companies. And just the same, what’s the
difference between owning a California- based networking com-
pany like Cisco Systems and one from Finland, like Nokia? And
what of Afl ac, which is based in Columbus, Georgia, but does
70% of its business in Japan? Is it more or less “international”
than India- based Infosys, which does more than 60% of its busi-
ness in North America?
Our approach at Global Gains is the same as the Fool’s overall
approach to stock- picking: we’re bottoms- up, business- focused
investors. The key difference is not the how, it’s the where. Our
approach encompasses small caps and fast- growers and dividend
payers and value stocks. It’s just that we disregard borders in our
search because there is almost no difference between interna-
tional and domestic stocks.
This ought to be somewhat obvious. Just like domestic compa-
nies, foreign companies—generally speaking—seek to reward
their investors by generating profi ts. Even if these profi ts are
160 THE MOTLE Y FOOL MILLION D OLL AR PORTFOLIO
denominated in dong, gourds, or escudos, they’re still profi ts,
and they can be converted to dollars. The scorecard for foreign
stocks isn’t based on kittens, buildings, or ennui. It’s based on
their ability to turn profi ts.
WHY GLOBAL GAINS INVESTING WORKS
Economies around the world are growing quickly. As illustrated
in the table above, China’s economy (mea sured by GDP) grew
11.4% in 2007. The U.S. economy will never again reach those
levels—it’s just too big and too developed.
Those economies resemble the trajectory America was on de-
cades ago—and that’s why international investing works. The
Chinese economy, for instance, looks a lot like the U.S. economy . . .
of the early 1900s. Industrialization is propelling China much
like it did on our home soil, bringing plenty of growing pains
along with it. One example can be seen through the efforts of
China Fire & Security, a company helping China write, develop,
and implement national fi re codes in industrial buildings. These
are the sorts of safety regulations we take for granted in the
United States, but in China their absence poses a clear threat—
and the company is booming.
It’s not an exaggeration to say that foreign investing is a “time
machine” for U.S. investors. We have an opportunity to examine
mature industries domestically and fi nd those same industries
in their high- growth phases elsewhere. Think back to when
Bank of America began consolidating the banking industry
many years ago, and then look at HDFC Bank, which is doing the
same thing in its home country of India. Think back to the online
auction industry that eBay created out of thin air, and then con-
sider that MercadoLibre is doing those same things in Latin
America . . . a de cade later.

WE ARE THE WORLD 161
THE 0%/100% RULE
Diversifi cation, while important, is not the goal of investing. To
the extent it can help you make money—and prevent you from
losing it—it’s a worthy endeavor. But in the end, you want 100%
of your money invested in companies that don’t suck, and 0% in
companies that do—and that’s regardless of whether a company
is headquartered in Paris, France, or Paris, Texas. Do not make
the common mistake of lumping “international” together with
“consumer staples” or “energy” or other diversifi able sectors.
That’s crazy, especially when you consider that foreign markets
in aggregate exceed the size of all U.S. stocks. Is “crazy” a bit
harsh? Let’s look at two stocks in this would- be “industry.”
America Movil provides wireless and fi xed communications
ser vices. It is a $90 billion company headquartered in Mexico
City, and it generates most of its revenues in Latin America. Teva
Pharmaceutical, a generic drug maker founded more than a cen-
tury ago in Israel, has a market value of $35 billion and does
most of its sales in Eu rope and North America.
Now, would you consider America Movil and Teva Pharma-
ceutical to be part of the same “sector”? They aren’t located in
the same country—or continent for that matter. They don’t com-
pete in the same industry. They denominate earnings in different
currencies (pesos and shekels, respectively). They draw on dif-
ferent labor pools, and they do not rely on the same supplies or
commodities. The only reason they’d belong to the same sector is
that they’re (1) for- profi t entities that (2) are not based in the
United States.
So Global Gains investing is not about exposure to a par tic u-
lar sector or style. It’s about opening up all the doors available
for our portfolio. And that’s why it works—it broadens frontiers.
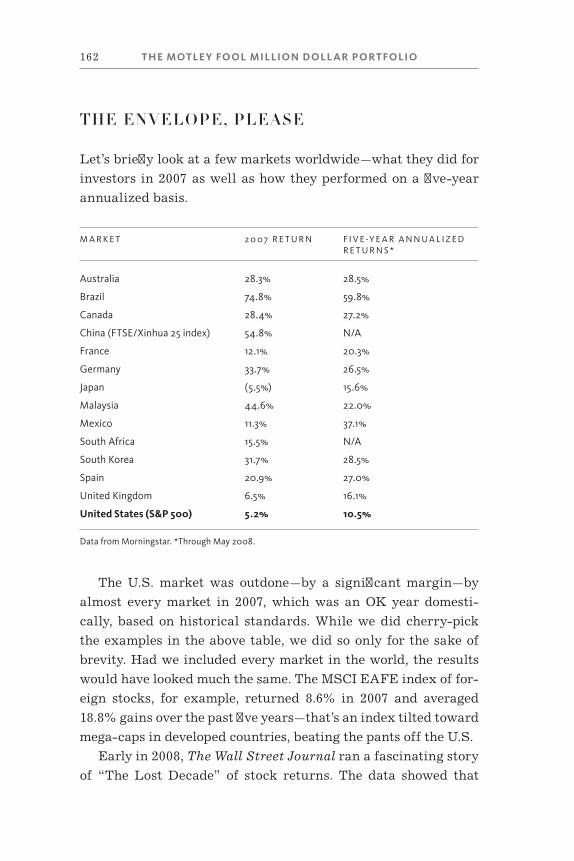
162 THE MOTLE Y FOOL MILLION D OLL AR PORTFOLIO
THE ENVELOPE, PLEASE
Let’s briefl y look at a few markets worldwide—what they did for
investors in 2007 as well as how they performed on a fi ve- year
annualized basis.
M A R K E T 2 0 0 7 R E T U R N F I V E - Y E A R A N N U A L I Z E D R E T U R N S *
Australia 28.3% 28.5%
Brazil 74.8% 59.8%
Canada 28.4% 27.2%
China (FTSE/Xinhua 25 index) 54.8% N/A
France 12.1% 20.3%
Germany 33.7% 26.5%
Japan (5.5%) 15.6%
Malaysia 44.6% 22.0%
Mexico 11.3% 37.1%
South Africa 15.5% N/A
South Korea 31.7% 28.5%
Spain 20.9% 27.0%
United Kingdom 6.5% 16.1%
United States (S&P 500) 5.2% 10.5%
Data from Morningstar. *Through May 2008.
The U.S. market was outdone—by a signifi cant margin—by
almost every market in 2007, which was an OK year domesti-
cally, based on historical standards. While we did cherry- pick
the examples in the above table, we did so only for the sake of
brevity. Had we included every market in the world, the results
would have looked much the same. The MSCI EAFE index of for-
eign stocks, for example, returned 8.6% in 2007 and averaged
18.8% gains over the past fi ve years—that’s an index tilted toward
mega- caps in developed countries, beating the pants off the U.S.
Early in 2008, The Wall Street Journal ran a fascinating story
of “The Lost De cade” of stock returns. The data showed that
WE ARE THE WORLD 163
from March 1999 to March 2008, U.S. stock market returns were
up only slightly on an annualized basis—well behind the returns
bonds and Trea sury Infl ation- Protected Securities (TIPS) of-
fered. D’oh. Over that same period, though, the best- performing
“sector” was the stocks in emerging markets, which averaged
annual returns of more than 18%.
Plenty of U.S. investors rode the coattails of those markets.
Pull up fi ve- year charts for PetroChina, China Mobile, Potash,
Petrobras, Cemex, Baidu .com—we could go on and on—and you’ll
likely see stock returns that dominated any competitor from our
home soil.
DOLLARS OR DINARS?
When the subprime mortgage mess fi rst began to spread through
fi nancial institutions, ultimately resulting in what was poeti-
cally called a “credit crunch,” the Federal Reserve aggressively
lowered interest rates to spur lending. This didn’t help the U.S.
dollar, which declined in value versus just about every foreign
currency in 2007 (except those pegged to our greenbacks). While
a weak dollar might make you rethink that vacation to Bavaria,
it makes a good case for owning international stocks.
If your paycheck is denominated in dollars, it’s a good bet that
almost all your currency exposure is to U.S. dollars. That makes
a lot of sense—if you live in the States and try to pay for a latte in
loonies, you’ll be laughed at (even if the loonie is worth more
than the dollar). Nevertheless, you’re missing a big opportunity.
Over the past fi ve years, as the dollar has declined in value,
Americans who have invested heavily in overseas companies
have seen a powerful diversifi cation (there’s that word again)
benefi t—because earnings denominated in pounds, euros, rupees,
dinars, and, yes, loonies, are worth more for folks investing in
dollars.
If you’re worried about the future of the buck, you don’t need
to research foreign exchange derivatives or such bets. The easier
164 THE MOTLE Y FOOL MILLION D OLL AR PORTFOLIO
move is to buy solid companies that produce growing cash fl ows
in stronger currencies. As they churn out more cash, that cash
will become more valuable in dollar terms—effectively giving
you two ways to grow your savings.
Let’s look at Canadian coffee and donut chain Tim Hortons.
During a three- month run- up in late 2007, the company’s shares
on the Toronto exchange jumped from CAD$28 to CAD$34.59, a
respectable 24% gain. Meanwhile, over the exact same period,
Tim Hortons shares on the New York Stock Exchange went from
$25 to $34.14, a 36% jump. The sliding dollar made the difference.
Now let’s dig a little deeper into a foreign stock case study.
BUILDING AN INTERNATIONAL FOUNDATION
Cemex is a dynamic Mexico- based multinational cement com-
pany we fi rst recommended fi ve years ago. It has tripled since
then. Cemex is the real deal. In fact, we are still big fans of this
three- bagger, although the investment thesis today is a bit dif-
ferent from when we originally singled it out.
Cemex was founded in 1906 and dominates its home market of
Mexico. Though its largest markets are Mexico and the United
States, the company operates in more than 50 countries. The
sheer size of its footprint means it is less tied to the construction
industry of any single country.
Over the course of the 20th century, Cemex transformed itself
from a domestic near- monopoly into an international power-
house. The company went public in the mid–1980s, but only in
the 1990s did it branch out of Mexico. What Cemex actually does
is not difficult to understand—although it may be difficult to
stay awake for. The company produces, markets, and distributes
cement, ready- to- mix concrete, and aggregates. A lot of it. All
over the world.
When we fi rst recommended the stock, we saw several very
attractive things:
WE ARE THE WORLD 165
• The management team, led by Lorenzo Zambrano, was
transparent, fi scally conservative, adept at managing
risk, and respectful to minority shareholders.
• The company was secure within its industry. It dominated
its home market and had a substantial foothold in Spain
and the United States. It was also branching off into
emerging economies around the world. Such an interna-
tional reach meant that the company could be somewhat
protected from slowdowns in one country or region.
• Part of Cemex’s strategy at the time was
growth- by- acquisition, which meant it carried a heavy
debt load. All things being equal, a company that grows
by acquisitions is riskier than a company that grows
organically, so this would have been a red fl ag, if not for
the superb talents of the management team.
• Also, the company had several weak quarters leading up
to our recommendation, which refl ected not poor opera-
tions but poor economic conditions in its larger markets.
Nevertheless, the market didn’t think much of Cemex—it
carried a price- to- earnings ratio of 8—in spite of its
superior free cash fl ow margins and more than 2%
dividend yield.
Cement is sort of a commodity business—“sort of” because ce-
ment is much more asset- intensive than just about any other
commodity. There are steep costs to develop a cement plant, and
because cement doesn’t travel well, it’s not cost- effective to
transport or ship cement from a large plant to a job site thou-
sands of miles away. In developing countries—which made up
60% of Cemex’s revenues when we recommended it—poor infra-
structure poses problems for moving a time- sensitive material
like cement. Cemex had production facilities in 16 countries, but
because those facilities had access to the sea and the company’s
own shipping fl eet, it sold concrete in more than 30 countries.
Having successfully conquered its home market—a developing
market, no less—Cemex began applying those practices to new

166 THE MOTLE Y FOOL MILLION D OLL AR PORTFOLIO
markets. The company put the then- nascent technology of global
positioning systems (GPS) in its mixing trucks, turning cement
deliveries from a “when we get there . . . perhaps next week”
scenario down to 30- minute windows of time. Cemex also
reached out to distributors in Mexico who sat between the manu-
facturer and the end customer. In an outreach program called
Construrama, it gave those distributors cost reductions, IT shar-
ing, and branding benefi ts in exchange for the exclusive market-
ing of Cemex products. In barely a year, Construrama created an
additional 2,000 points of sale. These initiatives were good for
customers and shareholders alike. They afforded Cemex remark-
able brand strength in a not- quite commodity business.
It was easy to like the company back then. Competitive ad-
vantages? Check. It had a strong brand, superior leadership, and
the ability to acquire competitors (and then digest those acquired
companies without a hiccup). Superior leadership? Check. Zam-
brano had been on the job a de cade and a half; Cemex had some
of the best corporate governance practices we’d seen in any com-
pany, regardless of nationality. Growth catalysts? Check. It was
positioning itself in the emerging markets while not losing focus
in the more developed markets it already dominated. Reasonable
valuation? Check. It sold for only eight times earnings. Since
then, Cemex has been a three- bagger.
FEAR OF FLYING
Yet how many times have you heard a Mexican cement company
being hyped at a cocktail party? Exactly. That may be because of
a subconscious—perhaps even a natural—reason many U.S. in-
vestors don’t care for international investing. It’s called home
equity bias and, according to Professor Jeremy Siegel’s The Future
for Investors, “Recent data show that U.S. investors, both profes-
sional and individual, hold only 14% of their stocks in non- U.S.-
based companies, less than one- third of the indexed proportion.”

WE ARE THE WORLD 167
International investing may frighten more than just the xeno-
phobes. There are added layers of due diligence that create more
work for you—keeping up with not only the minutiae of compa-
nies, but entire countries. We do this every day in Global Gains.
For example, early in 2008, Venezuelan President Hugo Chavez
decided to nationalize the domestic cement industry. Cemex gen-
erated 2% of its revenues from operations in Venezuela but had
no say in the decision. For U.S.- based Cemex shareholders, it
was a reminder of the sometimes Wild West nature of operating
in emerging (or frontier) economies.
But you should be up for Global Gains investing anyway. You
are likely familiar with some of the other companies affected by
Chavez’s nationalization plans: American oil concerns Exxon-
Mobil and ConocoPhillips, to take two examples.
“Foreign” events don’t just affect “foreign” companies. Exxon
and Conoco both do signifi cant business outside the U.S. As I
mentioned earlier, Georgia- based Afl ac—originally the Ameri-
can Family Life Assurance Company of Columbus—does 70% of
its business in Japan! Heck, iconic American brands McDonald’s
and Coca- Cola actually generate more than 65% of their revenue
outside the United States. If you hold these “U.S.” companies,
you already have a lot of exposure to the idiosyncrasies of inter-
national investing.
That’s not to suggest that owning foreign stocks is no differ-
ent from owning American stocks. There is almost no difference,
but there is a difference.
LET’S FOCUS ON THAT MAGICAL WORD “ALMOST”
Almost no difference, is, of course, not the same thing as no dif-
ference. There are, in fact, differences between foreign compa-
nies and American ones. Some of these matter, some not so much.
But it’s good to be aware of them all.
168 THE MOTLE Y FOOL MILLION D OLL AR PORTFOLIO
1. An ADR (American Depositary Receipt) is not common
stock.
2. Foreign companies use different accounting methods.
3. Foreign companies have different shareholder laws and
practices.
4. You may have little recourse if something goes really wrong.
5. Your dividends are taxed immediately, and some foreign
countries have been known to jack up their taxes on
foreign shareholders.
6. Some of the companies you can invest in sell absolutely
no products or ser vices in the United States.
7. Your risk of having the company delist is somewhat
elevated.
8. You have currency risks.
9. Many countries have stock markets that are substantially
more volatile than that of the United States, and as such
your shares might rise and fall much more quickly than a
comparable company’s would in the U.S.
Most of the concerns on this list are not huge deals. OK, they
tax dividends—so does the U.S. Investors might not be well rep-
resented in case of a problem. Well, how many gigantic checks
have the folks who owned shares of Enron received? We’ve just
listed some of the problems and differences with foreign compa-
nies. On the fl ip side, we offer the following:
1. China currently has 24 cities larger than Chicago, and
due to internal migration must build infrastructure to
handle a population the size of Houston every month.
2. India, one of the world’s poorest countries in 1980, has a
middle class equal in size to the population of the United
States—and its members are rapidly increasing their
level of consumption.
3. Argentina has some of the most fertile farmland in the
world, valued at a tiny fraction of what the comparable
land would cost in Iowa.
WE ARE THE WORLD 169
4. Some regulations and practices in the United States,
compare quite poorly to many foreign markets. The
gross overpayment of executives and “heads I win,
tails you lose” mentality so pervasive in American
executive suites is generally non ex is tent overseas.
Certain countries, like Mexico, are extremely protec-
tive of their biggest private companies, which benefi ts
shareholders.
5. The expansion of the Eu ro pe an Union has caused a rapid
development in the economies of Eastern Eu ro pe an
countries, which have a combined population equal to
that of the United States.
6. In 2007, only one major emerging market index under-
performed the S&P 500: Chile. This massive,
wide- ranging outper for mance took place in spite of the
existence of all of the risk factors enumerated above.
7. Regardless of the problems and challenges of owning
foreign securities, most foreign markets are growing
faster than the United States—and will generally con-
tinue to do so. While stock market per for mance and
economic growth don’t perfectly correlate, over the long
term there will be more wealth created in markets that
grow the fastest.
8. These are huge opportunities, but it’s hard to get at them
if you only focus on U.S. companies for fear of the for-
eign. The key is making good decisions.
DIGGING IN AROUND THE GLOBE
If you’ve never owned a foreign stock before, let’s get started
on setting up your foreign stock brokerage account. Are you
ready?
Step 1: Log onto your existing brokerage account.
Step 2: You’re done. Go make a sandwich or something.
170 THE MOTLE Y FOOL MILLION D OLL AR PORTFOLIO
Your domestic brokerage is perfectly capable of handling trades
in shares of hundreds, if not thousands, of foreign securities. We
live in a country with the largest base of investors in the world. So
instead of having to set up brokerage accounts in a number of
countries, you can buy many foreign companies right here. There
are approximately 850 foreign companies listed on the three major
U.S. exchanges, plus another 5,000 listed on the over- the- counter
and Pink Sheets exchanges. Every company in the fi rst group can
be bought exactly the same way you’d buy an American stock. If
you type in GE, you buy shares of General Electric. If you type in
E, you buy shares of Italian oil exploration giant Eni.
Almost all foreign companies trading in the United States
have their primary stock market listing in their home countries.
Even though the majority of Finnish wireless communications
giant Nokia’s trading volume takes place on its secondary listing
on the New York Stock Exchange, its primary listing is in Hel-
sinki. This leads to an interesting phenomenon: Whereas there is
no company on the S&P 500 that constitutes more than 4% of the
total value, Nokia’s market capitalization represents more than
60% of the value of the Helsinki Stock Exchange. As goes Nokia,
so goes Finland.
It’s only been in the past two de cades that cross- listings have
become pop u lar. For the most part, the primary benefi ciary is
the company, not you. By listing shares in the United States, they
access cheap, copious capital. That we get to trade in these shares
is but a by- product, but that’s the reason a thousand companies
have secondary listings in America, and why no companies have
secondary listings in Albania.
Some companies, particularly those from China, Bermuda,
and Israel, do not bother listing on their home exchanges. A Chi-
nese citizen could not, for example, buy shares of New Oriental
Education & Technology, a Beijing- based company, on the Shang-
hai or Shenzhen Stock Exchanges. Its sole listing is on the NYSE,
so if you buy shares of New Oriental, you’re not buying ADRs of
a Chinese company, you’re buying stock. What’s the difference?
Ultimately, almost nothing.
WE ARE THE WORLD 171
Finally, the companies on the Pink Sheets and the OTC ex-
change are much more of a mixed bag. They tend to have much
lower trading volumes, and some brokerages are better at getting
shares than others. Furthermore, while you’ll receive an annual
report and have voting rights with companies that trade on the
major exchanges, the OTC and Pink Sheet foreign companies
have lower reporting standards for American shareholders.
HOW TO APPROACH INTERNATIONAL STOCKS
You know everything you’ve learned so far about stock invest-
ing? Yeah, those are the same basic principles for foreign stock
investing. The game hasn’t changed—it just has a few more boxes
you need to check off.
What you don’t need to pay much attention to is the size of the
country, the richness of its natural resources, or how awesome a
time your nephew Ronny had when he visited over fall break.
Of course, and at the risk of sounding like a broken record,
there are foreign elements to foreign investing. “Country risk” is
a catch- all way to mea sure the goings- on of a par tic u lar country.
What’s the po liti cal environment? Is corruption a problem? How
is the country’s debt structured? What are its plans for economic
development?
A subset of country risk is po liti cal risk. For instance, is there
a real threat of nationalization, rebellion, or military action?
The last risk unique to foreign investments is currency risk.
Zimbabwe’s insane infl ation rate—it hit 66,000% in the early
months of 2008—may be extreme, but it’s a helpful reminder to
pay attention to the level of exposure a company has to weak
currencies.
These risks shouldn’t supersede the other risks you’re
examining—the existence of competitive advantages, suspicious
management, or an outrageously high valuation—but you need to
add them to your due diligence pro cess.
172 THE MOTLE Y FOOL MILLION D OLL AR PORTFOLIO
And fi nally, and this might seem obvious, you should make
sure that you can actually buy shares of a company before you
get down to the business of analysis. When we created the
Awesome International Portfolio Featuring 30 Awesome Inter-
national Companies and Please Pay Special Attention to the Awe-
some Diversifi cation (AIPFTAICAPPSATTAD), which you’ll
encounter on the next page, we selected 30 companies listed on
the major U.S. exchanges. A fabulous study of Qatar Telecom
does you no good unless you have access to one of the exchanges
it trades on.
So to boil this down, Global Gains looks for countries with:
1. Respect for rule of law, strong rights of appeal, and low
levels of corruption
2. Po liti cal stability and a government that doesn’t domi-
nate the local economy
3. A stable currency
4. Investability
THE PIECE OF YOUR PORTFOLIO
When it comes down to it, international versus domestic is al-
most a difference without distinction. It would not be hard to
construct a balanced portfolio entirely out of international
companies. It would be scarcely more of a challenge to do so
only with companies domiciled in emerging markets. In other
words, a targeted percentage allocation to international stocks
in a portfolio is nonsensical. Some investors would be perfectly
comfortable having 100% of their portfolio in international
companies.
Did You Get a Little Ner vous Just Then?
Look, while we stand by the 0%/100% rule, proper allocation
is always an important consideration. In The Future for Inves-
tors, Professor Siegel found that a balanced portfolio that in-
WE ARE THE WORLD 173
cluded a hefty dose of foreign stocks increased returns while
decreasing risk. Sounds pretty good, doesn’t it? Professor Siegel
recommends a 40% allocation to foreign stocks, via broad- market
foreign index funds. Even this conclusion is “aggressive,” ac-
cording to the standards of many money managers. (How 40%
can be aggressive when foreign stocks in aggregate outnumber
U.S. stocks is anybody’s guess.)
While the 40% rule makes sense for passive investors who have
little interest in rolling up their sleeves (or just wearing T-shirts)
and digging for stocks, Global Gains investing is all about out-
performing the indexes. It’s about a bottoms- up search for the
best companies with the brightest prospects. So, for example, we
wouldn’t recommend an 18.4% stake in companies domiciled in
northwestern Eu rope. Because when building, refi ning, or rebal-
ancing your overall portfolio, your top priority is to invest in your
best ideas—ignoring country, sector, or number of vowels in the
ticker. Your secondary concern should be ensuring that you’re not
overexposed to any specifi c geographic region or industry sector.
Investing only outside the United States, you could achieve a
level of diversifi cation at least as meaningful as one that was
30% domestic, 60% domestic, or 100% domestic. Further, you
could do it by only focusing on the international companies trad-
ing on the major U.S. exchanges. If you did an analysis of the
following companies, bought in equal size, you’d have a list of
companies diverse in every way except one: 0% of these compa-
nies suck.
T H E A W E S O M E L I S T O F 3 0 A W E S O M E I N T E R N A T I O N A L C O M P A N I E S A N D P L E A S E P A Y S P E C I A L A T T E N T I O N T O
T H E A W E S O M E D I V E R S I F I C A T I O N
CO M PA N Y & T I C K E R I N D U S T R Y M A R K E T C A P CO U N T R Y
New Oriental Education (EDU)
Education $2.3 billion China
Veolia (VE) Infrastructure $25 billion France
Lihir Gold (LIHR) Metals & Mining $5.5 billion Papua New Guinea
continued

174 THE MOTLE Y FOOL MILLION D OLL AR PORTFOLIO
CO M PA N Y & T I C K E R I N D U S T R Y M A R K E T C A P CO U N T R Y
Banco Itau (ITU) Banking $58 billion Brazil
HDFC Bank (HDB) Banking $10 billion India
Toyota Motor Company (TM)
Automobiles $147 billion Japan
Sanofi Aventis (SNY) Pharmaceuticals $95 billion France
Cresud (CRESY) Agriculture $670 million Argentina
Turkcell (TKC) Telecommunications $13.5 billion Turkey
Sasol (SSL) Energy $35 billion South Africa
Ctrip.com (CTRP) Travel Ser vices $2.8 billion China
Melco PBL (MPEL) Gaming/Hotels $3.3 billion Hong Kong
Infosys (INFY) Software Ser vices $24 billion India
Wimm- Bill- Dann (WBD) Food $4.3 billion Rus sia
Rio Tinto (RTP) Metals & Mining $156 billion United Kingdom
WPP Group (WPPGY) Media & Advertising $10.7 billion United Kingdom
Nokia (NOK) Telecommunications $93 billion Finland
Potash Corp. of
Saskatchewan (POT) Fertilizer $66 billion Canada
Brookfi eld Asset Mgmt (BAM)
Real Estate $18 billion Canada
Autoliv (ALV) Automotive $3.2 billion Sweden
Endurance Specialty (ENH)
Insurance $1.8 billion Bermuda
Vina Concha y Toro (VCO) Wines & Spirits $1.2 billion Chile
Cemex (CX) Basic Materials $19 billion Mexico
Sadia (SDA) Food $4.4 billion Brazil
CGG Veritas (CGV) Oil Ser vices $5.6 billion France
Teva Pharmaceuticals (TEVA)
Pharmaceuticals $35 billion Israel
Willbros Group (WG) Engineering $1.5 billion Panama
Posco (PKX) Steel $37 billion South Korea
Diageo (DEO) Beer/Spirits $45 billion United Kingdom
Diana Shipping (DSX) Shipping $2.1 billion Greece
That’s 30 companies—the number of non- related companies
that classic fi nancial texts claim is necessary to achieve diversi-
fi cation. None is based in the U.S. (though plenty of these compa-
nies have big exposure to the American market), and each is a
WE ARE THE WORLD 175
leader in its market, even the small caps. Does this look like a
risky portfolio to you? We’d be content holding this portfolio if
the markets closed for a de cade.
A POSTSCRIPT ON ETFs
We would be remiss if we didn’t point out that while we have
focused on foreign equities in this chapter, over the past de cade
hundreds of exchange- traded funds (ETFs) have sprung up, cov-
ering all sorts of foreign markets. There’s even one such fund,
the iShares MSCI ACWI ex US Index, that seeks to track the
index of all of the world’s stock markets except the United
States.
Using ETFs gives you the ability to make national, regional,
sector- based, even combination investments using extremely
low- cost index products. In fact, some ETFs give you access to
markets and segments that you simply cannot buy on a
stock- by- stock basis. For example, there are no Malaysian com-
panies trading on the major U.S. exchanges, but there is an ETF
that will give you exposure to the country: iShares MSCI Ma-
laysia. Just the same, though there are plenty of Japa nese com-
panies trading on the U.S. exchanges, most of them are large
caps. Exposure to the Japa nese small- cap market is most easily
achieved through the SPDR Russell/Nomura Small Cap Japan
Index.
These products are generally wonderful. They give interna-
tional exposure to anyone who wants it but does not have confi -
dence in his or her own stock- picking abilities (the famed
“know- nothing” investor, who tends to do much better than those
claiming to know something), and can be used simply to get
broader exposure than one could through buying individual
stocks alone. You should be careful, though. Generally speaking,
we’d recommend that you stick to ETFs that are based on world-
recognized indexes, like anything created under the SPDR (run
by Standard & Poor’s, a division of McGraw Hill) or MSCI (a
176 THE MOTLE Y FOOL MILLION D OLL AR PORTFOLIO
division of Morgan Stanley) headings. Some ETFs, most notably
the Xinhua China 25 Index, were constituted by non- indexing
organizations and include companies that do not accurately re-
fl ect the composition of the country’s market.
FINAL THOUGHTS
An increasingly global economy has erased one of the longstand-
ing reasons for holding foreign stocks: diversifi cation due to low
correlation. With the U.S. market moving in lockstep with over-
seas markets—a trend that certainly doesn’t seem to be reversing
itself—diversifi cation is no longer the reason to consider foreign
equities for your portfolio. In fact, one of the key conclusions of
The Future for Investors is this: “Where a fi rm is headquartered
will become increasingly irrelevant to investors.”
The reason to look overseas is much simpler: opportunity. Pull
up the fi ve- year charts for almost any international index and
you’ll see that it’s outperformed the S&P 500. Just as you’d never
limit your stock search to companies based in Rhode Island—or
those that have names beginning before the letter J in the alpha-
bet—you don’t want to ignore foreign stocks.
Motley Fool Advisor Bill Mann and editor Brian Richards
contributed to this chapter. A founding advisor of Global Gains,
Bill has traveled all over the world and can speak several lan-
guages. His favorite foreign word is jäätelö (Finnish for “ice
cream”). Brian heads up our advocacy team, writing and editing
articles on every one of our investing strategies.
Visit us at mdpbook .com for our favorite international stocks.
CH A PTER 9
CAPS: THE POWER OF COMMUNITY
INTELLIGENCE
While an investment thesis of any public company necessar-
ily must change with time, the principles we’ve outlined in
this book are timeless. As you’ll fi nd in our reference section at
the end of this book, we’ve built our approaches by reading in-
tensively. There are libraries of great business and investing
books. These strategies have been tested for years and, when
used correctly, will lead to superior results.
But while the principles are timeless, the companies are con-
stantly changing. How might you fi nd the best of these for your
portfolio? We’ve built our entire business around providing you
that advice, in the form of membership ser vices at fool .com. But
a funny thing has happened on the way to providing all of this
advice. We’ve learned, over time, that some of the greatest origi-
nal research anywhere in the world is being done by millions of
people who visit fool.com each month.
To understand the concept, think for a second about this book.
The two of us, working with our team of advisors, analysts, and
editors, have laid out our entire approach to stock investing. And
178 THE MOTLE Y FOOL MILLION D OLL AR PORTFOLIO
while we hope you’ve thoroughly enjoyed the read, we can’t help
noticing that you haven’t had an opportunity to share your
insights. Your sticky notes, your underlines, your constructive
criticisms, your questions and opinions serve an audience of
one—you. What a remarkable waste of creative energy—the en-
ergy of the thoughtful reader.
This is exactly what David was thinking a few years ago
when he began to develop a concept for linking investors to-
gether online. He was starting to fi nd more and more invest-
ment ideas on the discussion boards of the world’s greatest
investment community at Fool .com. And as a company, we began
hiring more aggressively out of our community. Today, most of
our investment analysts proved themselves to us by showcasing
great analytical work online at fool .com. Why then, David asked,
should we anchor exclusively on the work we’re doing in- house?
Why limit ourselves, when we have millions of monthly visitors
to our site? Why not build a platform to allow investors around
the world to share their insights, learn together, and prove their
mettle?
In 2005, we began making the largest capital allocations in
our company’s history into the creation of CAPS, home to more
than 100,000 active investors. In less than two years, CAPS has
grown into the largest and deepest stock ratings database in the
world, exceeding long- standing ratings ser vices such as Value
Line, Morningstar, and Schwab by a two- to- one margin. The ser-
vice features ratings on more than 6,000 public companies. And
every day CAPS gets smarter and more powerful, as investors
input more analysis into a ratings system that tilts toward the
very best contributors. Now we can leverage this powerful net-
work to improve your investment returns by overlaying our pro-
prietary data across stocks you fi nd using any of the strategies
outlined in this book.
Before we explain how CAPS works, we want you to know
why it matters. The CAPS system rates public companies from
one to fi ve stars, with fi ve indicating a “most attractive” buy rat-
ing. These ratings emerge from the more than two million stock
C APS: THE POWE R OF COM MUNIT Y INTELLIG E N CE 179
picks that have been entered into the system since inception, and
here are the results thus far during a tough market:
5- Star Stocks: +10.3 points annualized
1- Star Stocks: –14.3 points annualized
S&P 500: +1.3 points annualized
Data from 1/3/07 through 5/12/08.
Given the breadth and depth of coverage, those results are
stunning. We’re putting them to work in our newest service, Mot-
ley Fool Pro, where we are using our CAPS data to drive
market-beating results. We’ll talk below about how this system
can help to improve your investment returns as well. But fi rst, let
us explain how CAPS works so that you can get the most out of it:
Step 1: Members make stock predictions. It begins with
investors around the world making stock picks. With every
stock pick, we ask a simple question: Will this stock out-
perform or underperform the S&P 500?
Step 2: We keep score. As soon as investors answer that
question, we score them. If they choose “outperform” for a
stock and a month later that stock is up 8% over the mar-
ket, the investor is rated in two ways, as (1) “Accurate”
since the pick was correct, and (2) “Positive” with your
score being credited +8 to indicate the outper for mance.
Now, Foolish investors like you know that we invest for
the long term, so why are we scoring after a single month?
For the simple reason that we want to provide all viewers
with a moment- by- moment view of all the competitors and
all the company ratings. In this way, CAPS gets smarter
every day.
Step 3: Members receive CAPS ratings. Once an inves-
tor has made seven or more stock picks, they get their own
personal rating. We then continue to aggregate their re-
sults over time. To tabulate their score, we factor in their
per for mance based on accuracy (the percentage of right
180 THE MOTLE Y FOOL MILLION D OLL AR PORTFOLIO
calls about the direction of a stock) as well as their total
per for mance against the market. We then compare per for-
mance across every investor, stacking up competitors
against each other across our database. Just like high
school se niors with the SAT, CAPS participants are scored
by a percentile ranking. An investor who is rated 77.34 is in
the 77th percentile of the entire marketplace of investors.
Step 4: Stocks also receive CAPS ratings. In our data-
base, we’re able to see which stocks are rated highly by our
smartest members—those members with the highest score.
This is a very important point. CAPS is not a democracy
but a meritocracy. The most successful investors carry the
most weight in infl uencing the ratings of public companies.
Through the magic of computing, we’re able to crunch
numbers across all these stocks and stock- pickers every 15
minutes to give what equates to a “Doppler radar view” of
the stocks our community likes most and which they like
least. We break all our stocks up into quintiles—assigning
fi ve stars to the most attractive stocks and a single star to
the dregs of the market. In the two years that CAPS has
been running, our star rankings are pretty accurate in
predicting which stocks will beat the market. As men-
tioned above, 5- star stocks, taken in aggregate, have beaten
the S&P 500 by a full nine percentage points and 1- star
stocks have trailed the benchmark by 13 percentage points.
Here are the exact fi gures again:
5- Star Stocks: +10.3 points annualized
1- Star Stocks: –14.3 points annualized
S&P 500: +1.3 points annualized
Data from 1/3/07 through 5/12/08
Step 5: CAPS gets smarter. Finally, every day we get
better at rating our community’s intelligence. In the Step 2
example above, our investor had a score of +8 after one
month. That doesn’t tell us a lot. She might be the next
C APS: THE POWE R OF COM MUNIT Y INTELLIG E N CE 181
Warren Buffett or she may just have been lucky. Time will
tell. That’s exactly what CAPS uses to get smarter. As time
passes, our ratings of both people and stocks become more
accurate. Our CAPS members are getting smarter every
day, too. They learn from their successes and mistakes;
they gain a greater understanding of the stock market;
they don’t have to put their own money on the line to learn;
and they begin to pick more winners and fewer losers.
HOW CAPS CAN HELP YOU BEAT THE MARKET
Housing more than two million stock picks, featuring the selec-
tions and blogged research of more than 100,000 investors, and
showcasing star ratings that look predictive, CAPS can be used
in a variety of ways. It’s worth mentioning at this point that
CAPS is a free ser vice that can be accessed at caps .fool .com, or
by typing “CAPS” into Google.
Let’s work through its best uses.
1. To fi nd the best stocks. Yes, there are more than two million
stock picks out on CAPS, but how might you sort through it for
the best of the lot? Simply by using the CAPS Screener at caps.
fool.com. You can quickly fi nd the highest- rated stocks in any
industry or style of investing.
2. To get a second opinion. Most investors get stock picks from
isolated sources such as a broker, a magazine, or their Uncle Bob.
It’s difficult to know just how good these picks are. CAPS is an
ideal sounding board for verifying the quality of stock ideas you
come across anywhere. A third of U.S. stocks aren’t even covered
by Wall Street analysts, meaning that there’s little information
available on these companies to help you make intelligent deci-
sions. CAPS allows you to drill down into just about any public
company in America, by studying the information and analysis
from other investors. A plethora of investment analysis, ranked
182 THE MOTLE Y FOOL MILLION D OLL AR PORTFOLIO
according to the per for mance of each contributor, is available to
you on any stock you own. Still not convinced? CAPS had it right
on Bear Stearns, the oil industry, and home- builder stocks.
3. To track some darn good investors. As you go about your
research, you’ll undoubtedly run into the names of the top play-
ers over and over again. If you fi nd fellow members who strike
you as smart, take a look at their CAPS pages and their blogs.
These pages and blogs serve as a repository for all they think and
do as investors, and it’s open for you to study.
4. To evaluate your own per for mance. In CAPS, every action
you take is archived and publicly accessible. A public showing
of every prognostication you’ve made on stocks is a fantastic
learning tool. Look back over your permanent track record and
compare it to those of other investors. Get your investment club,
friends, and family members to track their results for free on the
platform, as well.
When we launched CAPS two years ago, we could not have
imagined the breadth, depth, quality, and investment per for mance
emerging from the network. By combining the investment strate-
gies we’ve taught throughout this book with our CAPS system,
your odds of superior investing results rise dramatically. If you
use CAPS for no other reason than to get second opinions on any
stock you own or are considering, you will have improved your
chances of success.
Visit us at mdpbook .com for more on putting CAPS to work
for you.
CH A PTER 10
YOUR NEXT MILLION
S o, by now, you’ve put all of our advice to work and built your
one million dollar portfolio, right? No? That’s OK. We hope
you at least know where to start (and when—now!). But no matter
how far along you are in your investment journey, building a
portfolio is not enough. You also need to know how to protect
and grow it.
That’s what this chapter is all about. We’re going to explain
how you can use all the investment strategies illustrated in this
book to create a solid, intelligent portfolio, and arm you with
some portfolio- management techniques to help boost your net
worth, regardless of what kinds of investments you ultimately
choose.
ASSET ALLOCATION
When some people hear the words “asset allocation,” they also
hear the word “diversifi cation,” which is a dirty word in some
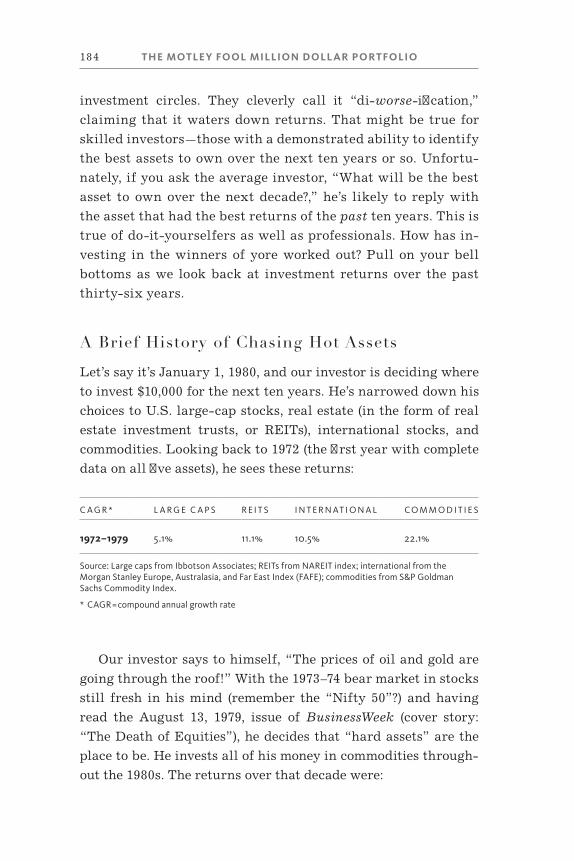
184 THE MOTLE Y FOOL MILLION D OLL AR PORTFOLIO
investment circles. They cleverly call it “di-worse- ifi cation,”
claiming that it waters down returns. That might be true for
skilled investors—those with a demonstrated ability to identify
the best assets to own over the next ten years or so. Unfortu-
nately, if you ask the average investor, “What will be the best
asset to own over the next de cade?,” he’s likely to reply with
the asset that had the best returns of the past ten years. This is
true of do- it- yourselfers as well as professionals. How has in-
vesting in the winners of yore worked out? Pull on your bell
bottoms as we look back at investment returns over the past
thirty-six years.
A Brief History of Chasing Hot Assets
Let’s say it’s January 1, 1980, and our investor is deciding where
to invest $10,000 for the next ten years. He’s narrowed down his
choices to U.S. large- cap stocks, real estate (in the form of real
estate investment trusts, or REITs), international stocks, and
commodities. Looking back to 1972 (the fi rst year with complete
data on all fi ve assets), he sees these returns:
C A G R * L A R G E C A P S R E I T S I N T E R N AT I O N A L CO M M O D I T I E S
1972–1979 5.1% 11.1% 10.5% 22.1%
Source: Large caps from Ibbotson Associates; REITs from NAREIT index; international from the Morgan Stanley Eu rope, Australasia, and Far East Index (FAFE); commodities from S&P GoldmanSachs Commodity Index.
* CAGR = compound annual growth rate
Our investor says to himself, “The prices of oil and gold are
going through the roof!” With the 1973–74 bear market in stocks
still fresh in his mind (remember the “Nifty 50”?) and having
read the August 13, 1979, issue of BusinessWeek (cover story:
“The Death of Equities”), he decides that “hard assets” are the
place to be. He invests all of his money in commodities through-
out the 1980s. The returns over that de cade were:
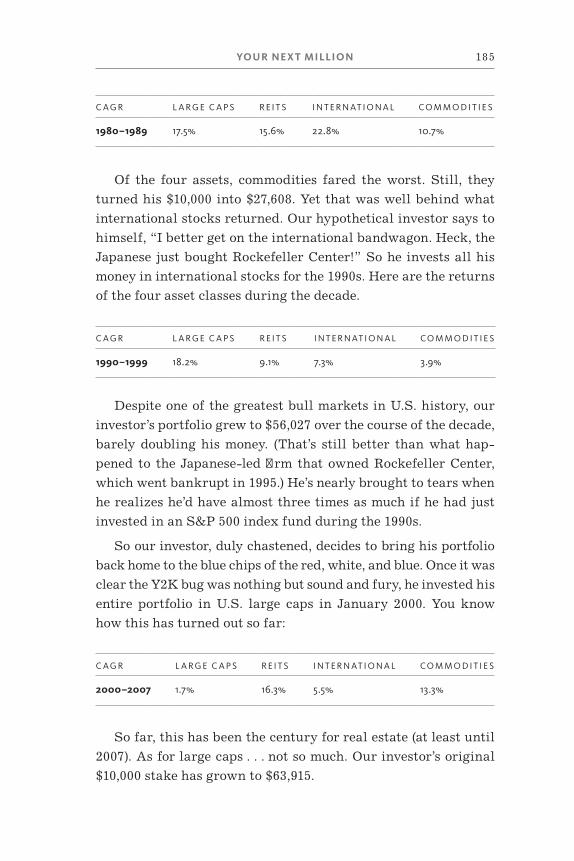
YOUR NE X T MILLION 185
C A G R L A R G E C A P S R E I T S I N T E R N AT I O N A L CO M M O D I T I E S
1980–1989 17.5% 15.6% 22.8% 10.7%
Of the four assets, commodities fared the worst. Still, they
turned his $10,000 into $27,608. Yet that was well behind what
international stocks returned. Our hypothetical investor says to
himself, “I better get on the international bandwagon. Heck, the
Japa nese just bought Rocke fel ler Center!” So he invests all his
money in international stocks for the 1990s. Here are the returns
of the four asset classes during the de cade.
C A G R L A R G E C A P S R E I T S I N T E R N AT I O N A L CO M M O D I T I E S
1990–1999 18.2% 9.1% 7.3% 3.9%
Despite one of the greatest bull markets in U.S. history, our
investor’s portfolio grew to $56,027 over the course of the de cade,
barely doubling his money. (That’s still better than what hap-
pened to the Japa nese- led fi rm that owned Rocke fel ler Center,
which went bankrupt in 1995.) He’s nearly brought to tears when
he realizes he’d have almost three times as much if he had just
invested in an S&P 500 index fund during the 1990s.
So our investor, duly chastened, decides to bring his portfolio
back home to the blue chips of the red, white, and blue. Once it was
clear the Y2K bug was nothing but sound and fury, he invested his
entire portfolio in U.S. large caps in January 2000. You know
how this has turned out so far:
C A G R L A R G E C A P S R E I T S I N T E R N AT I O N A L CO M M O D I T I E S
2000–2007 1.7% 16.3% 5.5% 13.3%
So far, this has been the century for real estate (at least until
2007). As for large caps . . . not so much. Our investor’s original
$10,000 stake has grown to $63,915.
186 THE MOTLE Y FOOL MILLION D OLL AR PORTFOLIO
Meanwhile, our hypothetical investor had a hypothetical
neighbor—a boring guy who didn’t seem to care about the hottest
thing. Instead of shifting his investments around each de cade, he
invested equal amounts into each of these assets, and rebalanced
his portfolio annually. Losing money in just four years (instead
of our fi rst investor’s six years of losses), the neighbor ended up
with a tidy $302,186—except he wasn’t the neighbor anymore
because he was able to move to a much nicer community.
Chase What’s Hot, Get Burned
Granted, our story was a little contrived—but perhaps not by
much. Many studies have shown the extent to which investors
chase the hot investments, a recipe for buying high and selling
low. According to research fi rm Dalbar’s “Qualitative Analysis
of Investor Behavior” study, the typical equity fund investor
earned just 4.3% a year from 1987 to 2006, compared to the S&P
500’s 11.8% annual return. Why the lousy returns? Investors tend
to sell what has already declined and buy what ever has already
risen.
And that behavior is not exclusively for the itchy individual
investor, according to a study titled “Assessing the Costs and
Benefi ts of Brokers in the Mutual Fund Industry.” Written by Dan-
iel Bergstresser and Peter Tufano of Harvard Business School
and John Chalmers of the University of Oregon, the study com-
pared the per for mance of more than 4,000 mutual funds sold by
fi nancial advisors with those chosen by do- it- yourself investors
from 1996 to 2002. The results aren’t pretty, at least if you’re a
full- ser vice broker (or one of their clients).
The study found that the returns of equity funds—net of all
expenses—chosen by individual investors earned an average an-
nual 6.6% versus just 2.9% for broker- sold funds. The study’s
authors conclude: “There is no consistent evidence that funds
sold through the broker channel exhibit substantially greater or
less trend- chasing behavior.” In other words, the evidence sug-
YOUR NE X T MILLION 187
gests that brokers chase the hot assets just as much as individual
investors. Incidentally, the study also found that advisors tend to
recommend investments that earn them the most money. Not
very heartening.
Putting all your money into recent winners can lead to a sig-
nifi cantly smaller portfolio. What was “in” during one period
might be “out” the next. We call it the “asset hokey pokey,” and it
can shake your portfolio all about. If you want to increase your
wealth, if you want to protect your wealth, and if you want to
parlay that wealth into a long and comfortable retirement, an
intelligently created and maintained asset allocation strategy is
the way to go for most investors.
THE BEAUTY OF BALANCE
If you started your reading with this chapter, you might now be
dialing your broker to invest 25% of your portfolio in each of the
aforementioned assets with a plan to rebalance annually—not a
horrible idea, considering that strategy outperformed the S&P
500 13.7% versus 11.2% annually from 1972 to 2007. That’s con-
siderably less horrible when you look at the dramatic impact
such a seemingly small edge could build over time—$10,000 in-
vested in the S&P 500 in 1972 would have grown to $454,614 by
the end of 2007; that same ten grand invested equally in U.S.
large caps, international stocks, REITs, and commodities, with
annual rebalancing thrown in, would have grown to $871,984,
almost twice as much, just by squeezing an extra two percentage
points of return out of the portfolio each year. (We must add that
the same effect can be gained by reducing your investment costs
by a couple of percentage points a year.)
But no, that’s not our fi nal answer. Our saunter through in-
vestment history is intended to show how holding a bunch of as-
sets that don’t move in the same directions at the same times has
the benefi t of enhancing returns and lowering risk. Let’s look a
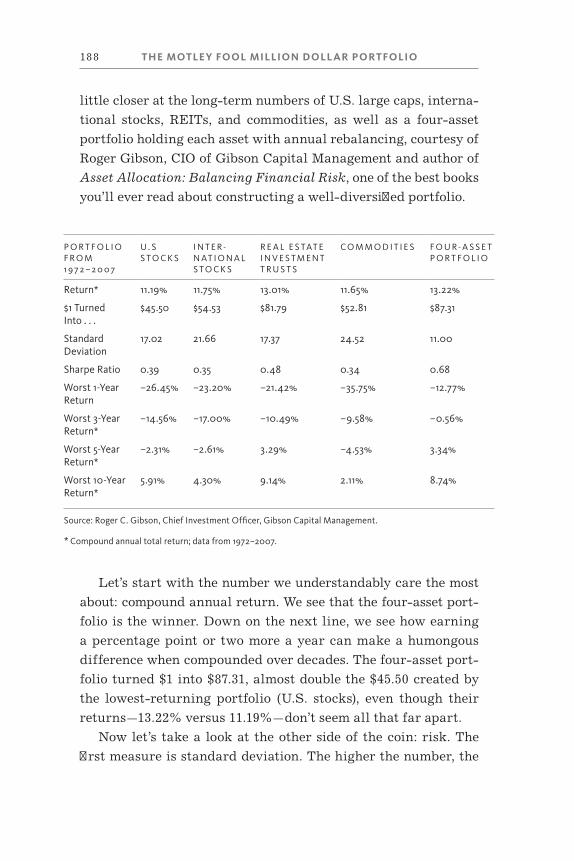
188 THE MOTLE Y FOOL MILLION D OLL AR PORTFOLIO
little closer at the long- term numbers of U.S. large caps, interna-
tional stocks, REITs, and commodities, as well as a four- asset
portfolio holding each asset with annual rebalancing, courtesy of
Roger Gibson, CIO of Gibson Capital Management and author of
Asset Allocation: Balancing Financial Risk, one of the best books
you’ll ever read about constructing a well- diversifi ed portfolio.
P O R T F O L I O F R O M 1 9 7 2 – 2 0 0 7
U . S S T O C K S
I N T E R-N AT I O N A L S T O C K S
R E A L E S TAT E I N V E S T M E N T T R U S T S
CO M M O D I T I E S F O U R- A S S E T P O R T F O L I O
Return* 11.19% 11.75% 13.01% 11.65% 13.22%
$1 Turned Into . . .
$45.50 $54.53 $81.79 $52.81 $87.31
Standard Deviation
17.02 21.66 17.37 24.52 11.00
Sharpe Ratio 0.39 0.35 0.48 0.34 0.68
Worst 1- Year Return
–26.45% –23.20% –21.42% –35.75% –12.77%
Worst 3- Year Return*
–14.56% –17.00% –10.49% –9.58% –0.56%
Worst 5- Year Return*
–2.31% –2.61% 3.29% –4.53% 3.34%
Worst 10- Year Return*
5.91% 4.30% 9.14% 2.11% 8.74%
Source: Roger C. Gibson, Chief Investment Offi cer, Gibson Capital Management.
* Compound annual total return; data from 1972–2007.
Let’s start with the number we understandably care the most
about: compound annual return. We see that the four- asset port-
folio is the winner. Down on the next line, we see how earning
a percentage point or two more a year can make a humongous
difference when compounded over de cades. The four- asset port-
folio turned $1 into $87.31, almost double the $45.50 created by
the lowest- returning portfolio (U.S. stocks), even though their
returns—13.22% versus 11.19%—don’t seem all that far apart.
Now let’s take a look at the other side of the coin: risk. The
fi rst mea sure is standard deviation. The higher the number, the
YOUR NE X T MILLION 189
more likely the portfolio was to vary widely above or below its
“average” return. Here, the clear winner is the four- asset port-
folio, with a standard deviation (11) dramatically lower than its
rivals. And look at its Sharpe Ratio! That’s a metric developed by
Nobel Prize–winning economist William Sharpe, who developed
the ratio as a way to mea sure risk- adjusted returns. The higher
the number, the more bang you’re getting for the amount of risk
your buck is taking. But you don’t need that fancy- pants number
to fi gure that out. All you have to look at is the worst one-, three-,
fi ve-, and ten- year returns. The four- asset portfolio had a darn
good compound annual return over those three- plus de cades, yet
its bad years weren’t quite so bad, relative to the other portfo-
lios.
HOW DID THEY DO THAT?
How can a portfolio have a greater return than the sum of (most
of) its parts and have lower volatility than each of its parts? The
answer is intelligent and true diversifi cation, which means se-
lecting assets that don’t move in the same direction at the same
time. Some asset classes thrive in an environment with low in-
terest rates, for example, while others wilt a little bit more with
each quarter- point cut from the Fed. Finding the right blend
brings the best chances of success.
In the academic world, this dance is mea sured by “correlation”—
how much two investments tend to move in or out of sync. And
when you combine assets that don’t perform similarly at the same
time, the standard deviation of the entire portfolio declines.
Throw in regular rebalancing and you not only get less volatility,
you also increase your chances for an enhanced return because
you’re selling the investments that have done well to buy the in-
vestments that have lagged. Since assets take turns sprinting
ahead and then taking a breather, rebalancing often leads to
selling high and buying low.
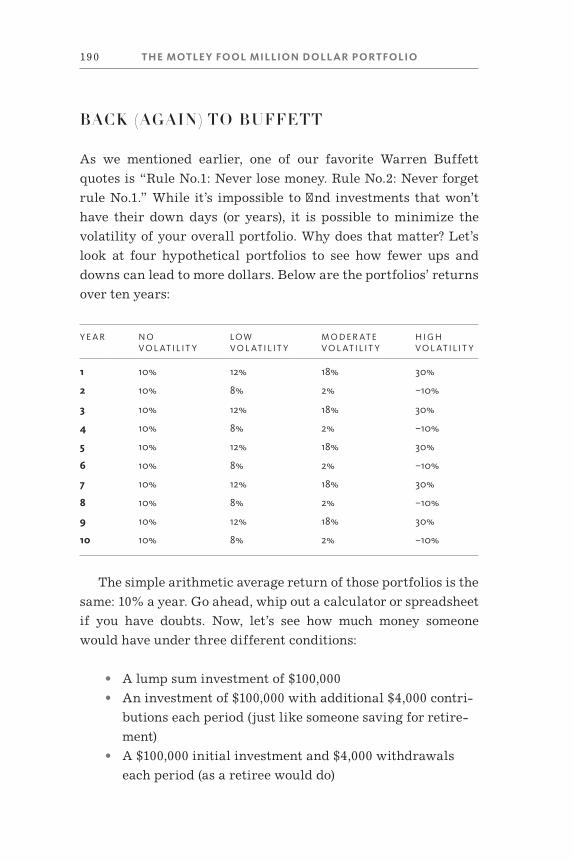
190 THE MOTLE Y FOOL MILLION D OLL AR PORTFOLIO
BACK (AGAIN) TO BUFFETT
As we mentioned earlier, one of our favorite Warren Buffett
quotes is “Rule No.1: Never lose money. Rule No.2: Never forget
rule No.1.” While it’s impossible to fi nd investments that won’t
have their down days (or years), it is possible to minimize the
volatility of your overall portfolio. Why does that matter? Let’s
look at four hypothetical portfolios to see how fewer ups and
downs can lead to more dollars. Below are the portfolios’ returns
over ten years:
Y E A R N O V O L AT I L I T Y
LO W V O L AT I L I T Y
M O D E R AT E V O L AT I L I T Y
H I G HV O L AT I L I T Y
1 10% 12% 18% 30%
2 10% 8% 2% –10%
3 10% 12% 18% 30%
4 10% 8% 2% –10%
5 10% 12% 18% 30%
6 10% 8% 2% –10%
7 10% 12% 18% 30%
8 10% 8% 2% –10%
9 10% 12% 18% 30%
10 10% 8% 2% –10%
The simple arithmetic average return of those portfolios is the
same: 10% a year. Go ahead, whip out a calculator or spreadsheet
if you have doubts. Now, let’s see how much money someone
would have under three different conditions:
• A lump sum investment of $100,000
• An investment of $100,000 with additional $4,000 contri-
butions each period (just like someone saving for retire-
ment)
• A $100,000 initial investment and $4,000 withdrawals
each period (as a retiree would do)
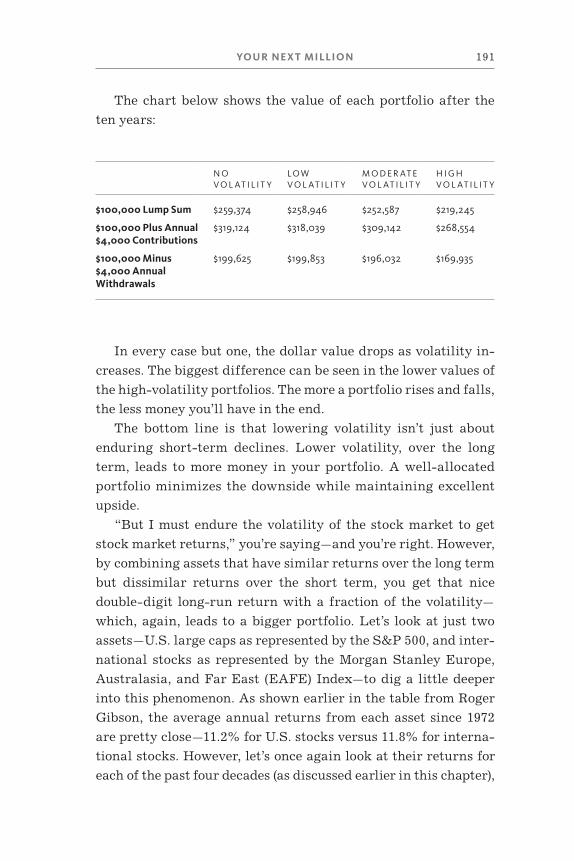
YOUR NE X T MILLION 191
The chart below shows the value of each portfolio after the
ten years:
N OV O L AT I L I T Y
LO W V O L AT I L I T Y
M O D E R AT E V O L AT I L I T Y
H I G H V O L AT I L I T Y
$100,000 Lump Sum $259,374 $258,946 $252,587 $219,245
$100,000 Plus Annual $319,124 $318,039 $309,142 $268,554$4,000 Contributions
$100,000 Minus $199,625 $199,853 $196,032 $169,935$4,000 Annual Withdrawals
In every case but one, the dollar value drops as volatility in-
creases. The biggest difference can be seen in the lower values of
the high- volatility portfolios. The more a portfolio rises and falls,
the less money you’ll have in the end.
The bottom line is that lowering volatility isn’t just about
enduring short- term declines. Lower volatility, over the long
term, leads to more money in your portfolio. A well- allocated
portfolio minimizes the downside while maintaining excellent
upside.
“But I must endure the volatility of the stock market to get
stock market returns,” you’re saying—and you’re right. However,
by combining assets that have similar returns over the long term
but dissimilar returns over the short term, you get that nice
double- digit long- run return with a fraction of the volatility—
which, again, leads to a bigger portfolio. Let’s look at just two
assets—U.S. large caps as represented by the S&P 500, and inter-
national stocks as represented by the Morgan Stanley Eu rope,
Australasia, and Far East (EAFE) Index—to dig a little deeper
into this phenomenon. As shown earlier in the table from Roger
Gibson, the average annual returns from each asset since 1972
are pretty close—11.2% for U.S. stocks versus 11.8% for interna-
tional stocks. However, let’s once again look at their returns for
each of the past four de cades (as discussed earlier in this chapter),
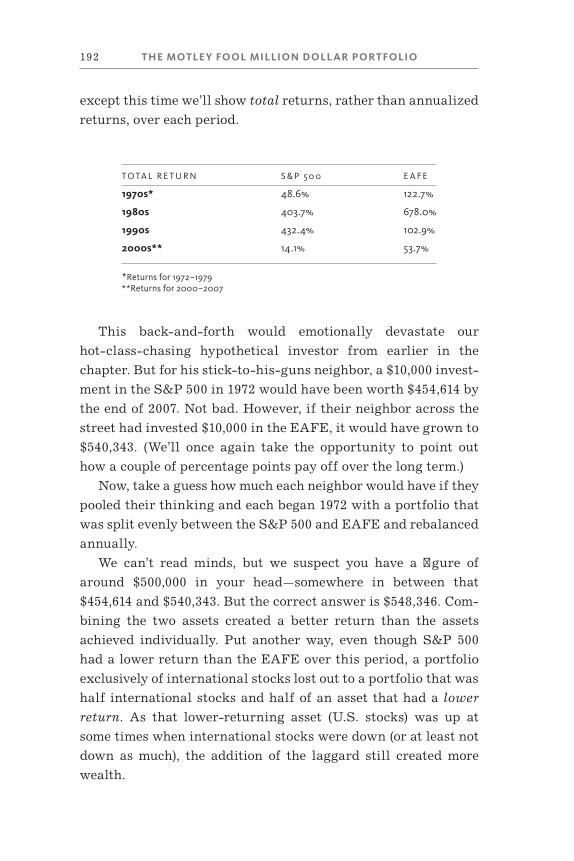
192 THE MOTLE Y FOOL MILLION D OLL AR PORTFOLIO
except this time we’ll show total returns, rather than annualized
returns, over each period.
T O TA L R E T U R N S & P 5 0 0 E A F E
1970s* 48.6% 122.7%
1980s 403.7% 678.0%
1990s 432.4% 102.9%
2000s** 14.1% 53.7%
*Returns for 1972–1979**Returns for 2000–2007
This back- and- forth would emotionally devastate our
hot- class- chasing hypothetical investor from earlier in the
chapter. But for his stick- to- his- guns neighbor, a $10,000 invest-
ment in the S&P 500 in 1972 would have been worth $454,614 by
the end of 2007. Not bad. However, if their neighbor across the
street had invested $10,000 in the EAFE, it would have grown to
$540,343. (We’ll once again take the opportunity to point out
how a couple of percentage points pay off over the long term.)
Now, take a guess how much each neighbor would have if they
pooled their thinking and each began 1972 with a portfolio that
was split evenly between the S&P 500 and EAFE and rebalanced
annually.
We can’t read minds, but we suspect you have a fi gure of
around $500,000 in your head—somewhere in between that
$454,614 and $540,343. But the correct answer is $548,346. Com-
bining the two assets created a better return than the assets
achieved individually. Put another way, even though S&P 500
had a lower return than the EAFE over this period, a portfolio
exclusively of international stocks lost out to a portfolio that was
half international stocks and half of an asset that had a lower
return. As that lower- returning asset (U.S. stocks) was up at
some times when international stocks were down (or at least not
down as much), the addition of the laggard still created more
wealth.
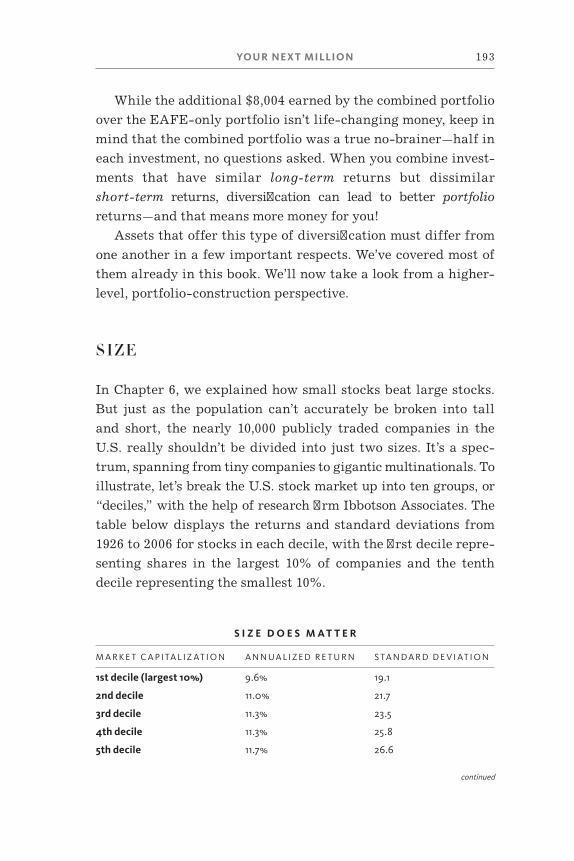
YOUR NE X T MILLION 193
While the additional $8,004 earned by the combined portfolio
over the EAFE- only portfolio isn’t life- changing money, keep in
mind that the combined portfolio was a true no- brainer—half in
each investment, no questions asked. When you combine invest-
ments that have similar long- term returns but dissimilar
short- term returns, diversifi cation can lead to better portfolio
returns— and that means more money for you!
Assets that offer this type of diversifi cation must differ from
one another in a few important respects. We’ve covered most of
them already in this book. We’ll now take a look from a higher-
level, portfolio- construction perspective.
SIZE
In Chapter 6, we explained how small stocks beat large stocks.
But just as the population can’t accurately be broken into tall
and short, the nearly 10,000 publicly traded companies in the
U.S. really shouldn’t be divided into just two sizes. It’s a spec-
trum, spanning from tiny companies to gigantic multinationals. To
illustrate, let’s break the U.S. stock market up into ten groups, or
“deciles,” with the help of research fi rm Ibbotson Associates. The
table below displays the returns and standard deviations from
1926 to 2006 for stocks in each decile, with the fi rst decile repre-
senting shares in the largest 10% of companies and the tenth
decile representing the smallest 10%.
S I Z E D O E S M A T T E R
M A R K E T C A P I TA L I Z AT I O N A N N U A L I Z E D R E T U R N S TA N D A R D D E V I AT I O N
1st decile (largest 10%) 9.6% 19.1
2nd decile 11.0% 21.7
3rd decile 11.3% 23.5
4th decile 11.3% 25.8
5th decile 11.7% 26.6
continued
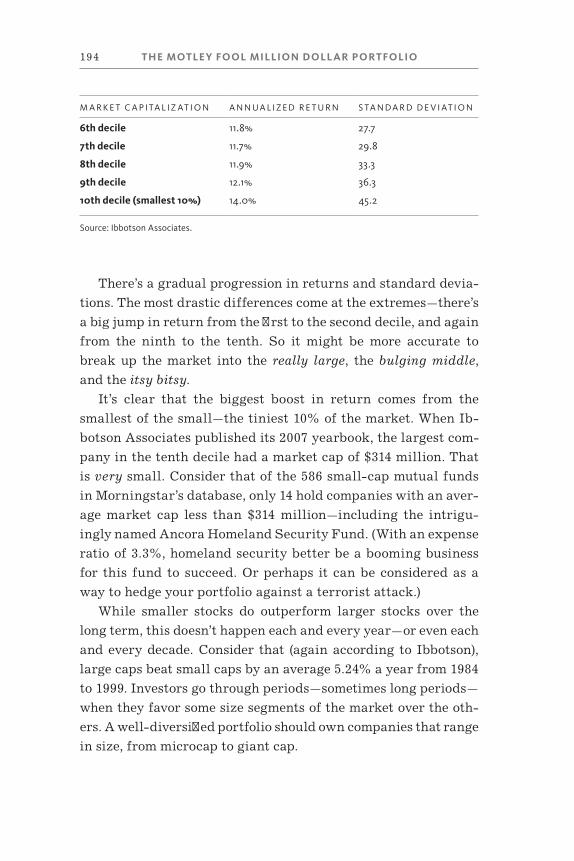
194 THE MOTLE Y FOOL MILLION D OLL AR PORTFOLIO
M A R K E T C A P I TA L I Z AT I O N A N N U A L I Z E D R E T U R N S TA N D A R D D E V I AT I O N
6th decile 11.8% 27.7
7th decile 11.7% 29.8
8th decile 11.9% 33.3
9th decile 12.1% 36.3
10th decile (smallest 10%) 14.0% 45.2
Source: Ibbotson Associates.
There’s a gradual progression in returns and standard devia-
tions. The most drastic differences come at the extremes—there’s
a big jump in return from the fi rst to the second decile, and again
from the ninth to the tenth. So it might be more accurate to
break up the market into the really large, the bulging middle,
and the itsy bitsy.
It’s clear that the biggest boost in return comes from the
smallest of the small—the tiniest 10% of the market. When Ib-
botson Associates published its 2007 yearbook, the largest com-
pany in the tenth decile had a market cap of $314 million. That
is very small. Consider that of the 586 small- cap mutual funds
in Morningstar’s database, only 14 hold companies with an aver-
age market cap less than $314 million—including the intrigu-
ingly named Ancora Homeland Security Fund. (With an expense
ratio of 3.3%, homeland security better be a booming business
for this fund to succeed. Or perhaps it can be considered as a
way to hedge your portfolio against a terrorist attack.)
While smaller stocks do outperform larger stocks over the
long term, this doesn’t happen each and every year—or even each
and every de cade. Consider that (again according to Ibbotson),
large caps beat small caps by an average 5.24% a year from 1984
to 1999. Investors go through periods—sometimes long periods—
when they favor some size segments of the market over the oth-
ers. A well- diversifi ed portfolio should own companies that range
in size, from microcap to giant cap.
YOUR NE X T MILLION 195
VALUE VS. GROWTH
As we’ve said a few times now, exactly how “value” and “growth”
are defi ned depends on whom you ask. The famous Fama- French
studies referenced in Chapter 5 simply break up the market by
one criterion: the book value of a company divided by its recent
stock price, known as the book- to- market ratio. Companies
with a high book- to- market ratio are considered “value” com-
panies. Mutual fund research provider Morningstar, on the
other hand, uses ten different characteristics to differentiate
value from growth stocks, taking into account stock valuation
as well as estimated earnings growth.
If you asked each analyst at The Motley Fool for their defi ni-
tions of “growth” and “value,” you’d likely get a broad and enter-
taining array of responses. But this much we all agree upon: The
market goes through cycles of favoring one over the other. Un-
less you’re reading this book when you should be paying atten-
tion to your fi fth- grade social studies teacher, you’re old enough
to remember the go- go- growth days of the late 1990s. Tradi-
tional value investors were being mocked; Warren Buffett’s
Berkshire Hathaway was down 20% in 1999, a year the S&P 500
was up 21%.
Then the bubble burst; dot- com was out and dividends were
in. From 2000 to 2006, value- oriented companies as a group wal-
loped growth stocks. The tide changed again in 2007, as growth
once again assumed the throne. To benefi t from this irrational
value- growth seesaw, simply include both styles in your portfolio.
DOMESTIC VS. INTERNATIONAL
You read plenty in Chapter 8 about the benefi ts of international
investing. And, earlier in this chapter, we demonstrated the value
of sending money overseas. But again, the world can’t be divided
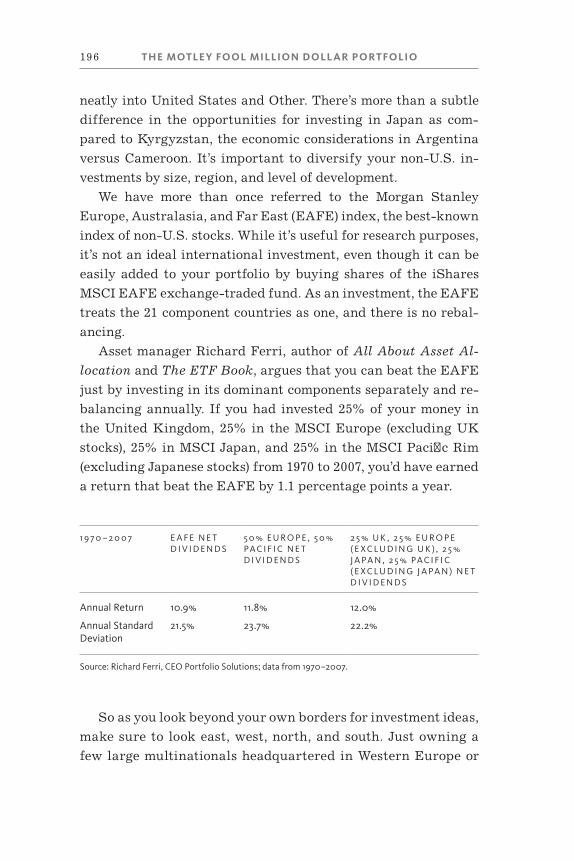
196 THE MOTLE Y FOOL MILLION D OLL AR PORTFOLIO
neatly into United States and Other. There’s more than a subtle
difference in the opportunities for investing in Japan as com-
pared to Kyrgyzstan, the economic considerations in Argentina
versus Cameroon. It’s important to diversify your non- U.S. in-
vestments by size, region, and level of development.
We have more than once referred to the Morgan Stanley
Eu rope, Australasia, and Far East (EAFE) index, the best- known
index of non- U.S. stocks. While it’s useful for research purposes,
it’s not an ideal international investment, even though it can be
easily added to your portfolio by buying shares of the iShares
MSCI EAFE exchange- traded fund. As an investment, the EAFE
treats the 21 component countries as one, and there is no rebal-
ancing.
Asset manager Richard Ferri, author of All About Asset Al-
location and The ETF Book, argues that you can beat the EAFE
just by investing in its dominant components separately and re-
balancing annually. If you had invested 25% of your money in
the United Kingdom, 25% in the MSCI Eu rope (excluding UK
stocks), 25% in MSCI Japan, and 25% in the MSCI Pacifi c Rim
(excluding Japa nese stocks) from 1970 to 2007, you’d have earned
a return that beat the EAFE by 1.1 percentage points a year.
1 9 7 0 – 2 0 0 7 E A F E N E T D I V I D E N D S
5 0 % E U R O P E , 5 0 % PA C I F I C N E T D I V I D E N D S
2 5 % U K , 2 5 % E U R O P E ( E X C LU D I N G U K ) , 2 5 % J A PA N , 2 5 % PA C I F I C ( E X C LU D I N G J A PA N ) N E T D I V I D E N D S
Annual Return 10.9% 11.8% 12.0%
Annual Standard Deviation
21.5% 23.7% 22.2%
Source: Richard Ferri, CEO Portfolio Solutions; data from 1970–2007.
So as you look beyond your own borders for investment ideas,
make sure to look east, west, north, and south. Just owning a
few large multinationals headquartered in Western Eu rope or
YOUR NE X T MILLION 197
Japan won’t result in all the benefi ts of international own er-
ship.
INDUSTRY
No need to dwell on this one too long. You’re smart enough to
know that your portfolio shouldn’t be fi lled with just bank
stocks, or just tech stocks, or just oil stocks, or . . . you get the
idea. A tidal wave sinks all ships, so if a sector gets walloped,
every stock gets dragged down. We saw this with dot- com
stocks in 2000 and, more recently, with fi nancial stocks in
2007 and 2008. Make sure your fi nancial future isn’t riding on
a single industry.
Does this mean you should aim to own a stock in every sector
of the economy? No. But if diversifi cation is what you’re after, a
rough guide is to own stocks in fi ve industries.
And broad diversifi cation means more than a basket of stocks
and funds. The illustrations from earlier in this chapter include
real estate and commodities, which could be considered sectors.
The proxies used in those illustrations—the NAREIT index and
the S&P Goldman Sachs Commodity Index—mea sure the per-
for mance of investments that have different structures than
common stocks. Real estate investment trusts must pay out 90%
of their income for the company to receive special tax benefi ts,
which is why they have a signifi cantly higher dividend yield than
most other stocks.
The S&P GSCI does not mea sure the price changes of actual
commodities, but of fully collateralized futures contracts. If you
happen to know what that means, terrifi c. If not, no worries. Just
know that this investment vehicle is not an index that mea sures
the per for mance of publicly traded oil, mining, and agriculture
stocks. As Goldman Sachs says on its Web site, it’s designed to
provide investors with a reasonable benchmark in the commod-
ity markets.
198 THE MOTLE Y FOOL MILLION D OLL AR PORTFOLIO
If you’re looking to diversify a portfolio dominated by U.S.
stocks, REITs and commodities will do the trick. In 2000, when
the S&P 500 was down almost 10%, REITs were up 26.4% and
the GSCI was up 52.6%. Of course, low correlation works the
other way, too; while the S&P 500 was up 28.6% in 1998, REITs
were down 17.5% and commodities declined 35.8%.
If you’re forced to pick between the two for some reason, a
stronger case can be made for including REITs in your port-
folio. They’re not nearly as volatile as commodities (or even U.S.
stocks) and they represent actual companies making actual
money. Plus, that higher dividend is pretty sweet. As for com-
modities, if you own a globally diversifi ed portfolio of common
stocks, you likely have plenty of exposure through U.S. stocks
that work in commodities- related businesses, as well as stocks
in countries with economies tied to the booms and busts of oil,
agriculture, and metal prices. However, if you’re looking for an
investment more likely to hold up during times of infl ationary
and international turmoil, consider direct own ership of com-
modities.
PULLING IT ALL TOGETHER
Looking back at all the investment strategies discussed through-
out this book, what kind of returns would a portfolio that dab-
bled in each strategy have earned over the past 20 years? It’s not
particularly fair to go back a couple de cades and select Microsoft
as our portfolio representative for the growth category, but we
can get an idea by constructing a portfolio of mutual funds that
follow similar strategies. (For more on investing in funds, don’t
miss Appendix A.) This isn’t an exact science. There’s no mutual
fund that fully embodies the Rule Breaker philosophy, for ex-
ample. Plus, we’re limited to choosing funds that have been
around for two de cades. But the investments chosen by the strat-
egies outlined in this book can be found in the six funds selected
YOUR NE X T MILLION 199
on the next page—large and small stocks, growth and value, do-
mestic and international are all represented, plus some REITs. I
also included a science and technology fund to represent our
Foolish penchant for picking investments from cutting- edge in-
dustries.
In the chart on the next page, you’ll fi nd the returns for the
Vanguard 500 Index Fund (VFINX) for comparison purposes,
the six mutual funds selected to represent the various strate-
gies, and the returns of an annually rebalanced portfolio
equally allocated to the six mutual funds. The returns are
computed for fi ve- year periods starting in 1988, as well as for
the entire 1988–2007 period.
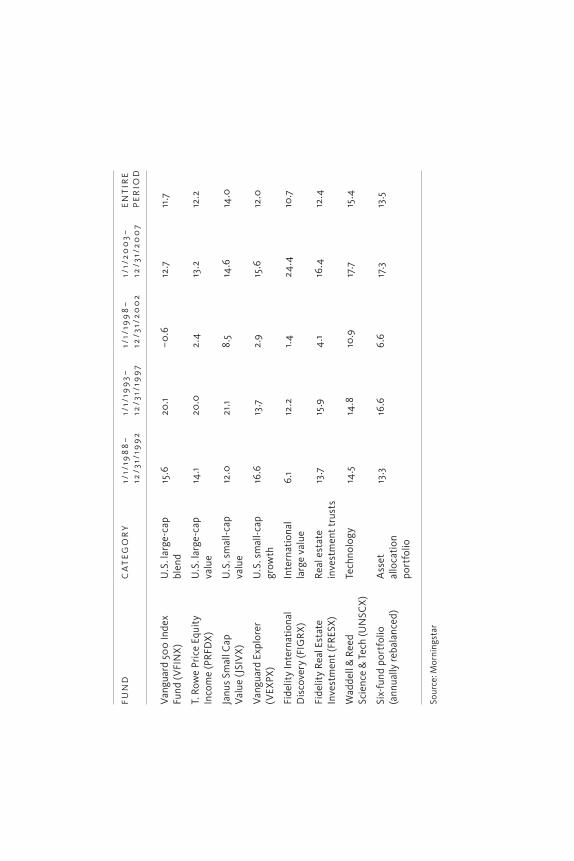
FU
ND
CA
TE
GO
RY
1/1/
198
8–
12/3
1/19
92
1/1/
199
3–
12/3
1/19
97
1/1/
199
8–
12/3
1/2
00
21/
1/2
00
3–
12/3
1/2
00
7E
NT
IRE
PE
RIO
D
Van
guar
d 50
0 In
dex
Fund
(V
FIN
X)
U.S
. lar
ge- c
ap
blen
d15
.620
.1–
0.6
12.7
11.7
T. R
owe
Pric
e Eq
uity
In
com
e (P
RFD
X)
U.S
. lar
ge- c
ap
valu
e14
.120
.02.
413
.212
.2
Janu
s Sm
all C
apV
alue
(JS
IVX
)U
.S. s
mal
l- ca
p va
lue
12.0
21.1
8.5
14.6
14.0
Van
guar
d Ex
plor
er
(VEX
PX)
U.S
. sm
all-
cap
grow
th16
.613
.72.
915
.612
.0
Fide
lity
Inte
rnat
iona
l D
isco
very
(FIG
RX
)In
tern
atio
nal
larg
e va
lue
6.1
12.2
1.4
24.4
10.7
Fide
lity
Real
Est
ate
Inve
stm
ent
(FR
ESX
)R
eal e
stat
e in
vest
men
t tr
usts
13.7
15.9
4.1
16.4
12.4
Wad
dell
& R
eed
Scie
nce
& T
ech
(UN
SCX
)Te
chno
logy
14.5
14.8
10.9
17.7
15.4
Six-
fund
por
tfol
io(a
nnua
lly re
bala
nced
)A
sset
allo
cati
on
port
folio
13.3
16.6
6.6
17.3
13.5
Sour
ce: M
orni
ngst
ar
YOUR NE X T MILLION 201
For the fi rst ten years, owning just the S&P 500 (in the form
of the Vanguard 500) was a perfectly fi ne strategy. For the next
ten years, it was the worst possible approach. Notice also that
the absolute best fi ve- year return for any asset came from the
Fidelity International Discovery Fund, which returned an aver-
age annual 24.4% from 2003 to 2007 . . . but seasoned investors
might have shied away after the period from 1988 to 1997, in
which international stocks were clearly the laggards in the
batch.
So why not just pick the Waddell & Reed Science & Tech
Fund, which had the best run for the duration of the period? For
one, because the 10.9% average annual return from 1998 to 2002
glosses over the fact that those returns were earned with the fol-
lowing annual returns: 59.3%, 102.9%, –14.0%, –13.4%, –26.8%.
Even the steeliest investor would be shaken by that volatility.
Of the seven funds (the six we chose plus the Vanguard 500),
the well- diversifi ed portfolio beat fi ve of them over the entire
period, with just two down years (compared to fi ve down years
for the Science & Tech fund). Not a bad showing, especially since
the amount it trailed the No. 2 fund (0.5% annually) was much
smaller than the amount by which it beat the other fi ve funds
(1.1% to 2.8% annually).
Now, here’s a little math to show how the whole is greater
than the sum of its parts. Add up the returns of the six funds we
chose, and then divide by six to get an average return. The result:
12.8%, which is 0.7% less than the 13.5% earned by the annually
rebalanced portfolio. Not earth- shattering, but enough to add
thousands of dollars to a long- term portfolio. It’s just another ben-
efi t of a diversifi ed portfolio, augmented by regular rebalancing.
This is why we started our Million Dollar Portfolio ser vice—to
bring together all of the philosophies in this book in a smart,
Foolish, market- beating portfolio.
202 THE MOTLE Y FOOL MILLION D OLL AR PORTFOLIO
WHO HAS TIME FOR PROPER PLANNING?
During the 2005 Berkshire Hathaway annual meeting, Vice
Chairman Charlie Munger turned to Chairman Warren Buffett
and asked, “When was the last time you sat down and wrote out
an asset- allocation plan?” Buffett replied, “Never.”
So if the world’s greatest investors don’t bother with asset al-
location, why should you?
Because you’re not as good as Munger or Buffett . . . yet.
Among the pantheon of legendary stock pickers, you probably
won’t fi nd many masters who had a checklist with required al-
location amounts—Peter Lynch almost assuredly never fretted
that he was slightly underweighted in small- cap companies in
emerging markets. No, that rarefi ed club is dominated by people
who look for attractive businesses at attractive prices, period.
And their ability to do so has led to market- crushing returns. It’s
also their full- time job.
The problem is that this group is small. As we’ll discuss fur-
ther in our appendix on mutual funds, the majority of actively
managed funds lose to their respective indexes over the long
term. A study by Thomas McGuigan published in the Journal of
Financial Planning found that just 10.5% of large- cap U.S. stock
mutual funds beat the Vanguard 500 Index Fund from 1983 to
2003. These mutual fund managers aren’t dummies (well, most of
them aren’t), and they have tons of resources at their disposal.
It’s just very hard to beat the market after fees.
Of course, we think that we (and you) have a distinct advan-
tage as small investors. We have the potential to rub elbows with
the other great investors in the exclusive club of market-beaters.
But if you’re nervous about jumping right in, consider keeping
the bulk of your money in a portfolio of low- cost index funds,
gradually venturing into individual stocks and honing your
skills as you focus on fi nding great companies, regardless of
whether they’re small caps, large caps, or bottle caps.
How do you know you’re a great stock picker? You keep accu-
YOUR NE X T MILLION 203
rate rec ords, learn every day, and you’re honest with yourself.
Every person who chooses to invest in individual stocks should
be comparing his or her per for mance to a relevant benchmark.
Don’t worry about a year or two, since the returns from one
year to the next are often full of noise, distractions, and crazi-
ness. What you want to see is that your investments have been
paying off over a fi ve- year period. If so, that’s encouraging
news. If not, don’t give up, but don’t pour too big a portion of
your portfolio into individual stocks until you improve your
track record.
THE GLASS IS ALWAYS HALF SOMETHING
Owning several types of investments guarantees one thing: Some
will be winners and some will be losers. So, you’ll always be un-
happy with some part of your portfolio. You’ll also be happy with
some part of your portfolio. Every year, your portfolio will be a
mixed bag and the heat will jump from one asset class to the
next. The well- diversifi ed asset allocation portfolio is a middle-
of- the- road strategy—your portfolio won’t double overnight, but
it also won’t lose half its value in any given day.
If you’re looking for the excitement that comes from holding
a more concentrated portfolio, asset allocation may not be the
strategy for you.
ASSET ALLOCATION REQUIRES PATIENCE
Diversifi cation often does not pay off in the short term. The
six- fund portfolio had the third- worst return from 1988 to 1992.
It also didn’t post the best return over any of the fi ve- year periods.
But over the long term, the returns from smart asset allocation
will gradually rise toward the top of relative rankings.
For that to happen, however, you have to stick with the strat-
egy, which means holding onto assets that are out of favor. This
204 THE MOTLE Y FOOL MILLION D OLL AR PORTFOLIO
is especially difficult when U.S. stocks are on top, an interesting
behavioral risk that Roger Gibson, author of Asset Allocation,
refers to as “frame of reference risk.” U.S. investors subcon-
sciously benchmark their investments against the U.S. market,
clouding their view of diversifi cation. They perceive diversifi ca-
tion as a positive whenever the U.S. market is a relative under-
performer because they had the good sense to dabble in other
areas that are beating the results they see in each day’s headlines.
And they believe diversifi cation is a bad thing when the U.S.
market is taking its turn in the sun.
Anyone holding international stocks in the late 1990s proba-
bly had moments of doubt. These investors certainly did not have
as much to brag about at cocktail parties. Maybe some decided to
swear off non- U.S. stocks for good amidst all the Yankee eupho-
ria. But that would have been a mistake if they didn’t buy back
in, since international stocks have crushed U.S. stocks since
2002. If you don’t have the patience to hold onto investments that
can underperform the investments owned by your neighbors,
family, and co- workers, then stick with U.S. stocks, secure that
you’ll all suffer and prosper together.
CAN YOU PREDICT THE FUTURE?
Maintaining a well- diversifi ed portfolio is premised on the as-
sumption that it’s difficult to predict the next hot asset or to
pinpoint per for mance. Even the “experts” get it wrong. Back in
July 2000, after the stock market peaked early that year and had
started what would eventually be a three- year slide—the biggest
crash since the Great Depression—USA Today published an ar-
ticle featuring the opinions of many of the bigwigs at Wall Street’s
biggest fi rms. Did they warn investors of the impending crash?
Nope. Five of the seven experts interviewed expected the Dow
to end the year above 12,000. By New Year’s Eve, the Dow was at
10,788. Here are some choice quotes from that July 2000 article:
YOUR NE X T MILLION 205
“[Abby] Cohen of [Goldman Sachs] . . . remains upbeat on
stocks despite a slowdown in corporate profi ts. ‘What matters
most is that profi ts are sustainable and durable, which we think
they are,’ she says.”
“ ‘Stocks will head higher—much higher,’ says Thomas Galvin
of Donaldson, Lufkin & Jenrette.”
“ ‘We’re pretty upbeat,’ says Alan Skrainka at Edward
Jones. . . . ‘We’ll still have solid economic growth and strong
earnings.’ ”
“ ‘There is no end in sight for the best economic and fi nancial
market cycle in U.S. history,’ says Jeffrey Applegate of Lehman
Bros.”
To be fair, you could dig through the Fool .com archives and
fi nd plenty of examples of when we were wrong, too. These ana-
lysts are far from stupid. Even smart, experienced, well- resourced
people aren’t so good at predicting where the market will be at
any given point. If you can’t predict which type of investment will
outperform the others, you should own a little bit of all of them.
BUILDING THE PERFECT PORTFOLIO
So how do you create the right portfolio for you? It all starts with
our four Foolish rules for asset allocation:
Rule 1: If You Need the Money in the Next Year, It Should Be in Cash
You don’t want the down payment for your home to evaporate in
a stock market—or a bond market—crash. Find a high- yielding
money market fund or savings account—such as those offered by
ING Direct, HSBC, GMAC Bank, or Emigrant Direct—that al-
lows you to transfer money to your checking account whenever
you need it.
206 THE MOTLE Y FOOL MILLION D OLL AR PORTFOLIO
Rule 2: If You Need the Money in the Next One to Five Years, Choose Safe, Income- Producing Investments
Whether it’s your kid’s college money or the retirement income
you’ll need in the not- so- distant future, stay away from stocks.
As with all investments, risk and reward go hand- in- hand when
it comes to “safe” assets. So, in order of “safest” to “still safe but
technically riskier,” we have Trea sury notes and bills, CDs, and
corporate bonds. That is, not coincidentally, also the order of
lowest- to highest- yielding. CDs are still safe (as long as your ac-
count is FDIC-insured), and you should be able to fi nd some that
pay a percentage point above Trea suries. Shop around for the
best rates. Your local bank is probably not the best- yielding
option.
As for corporate bonds, the general rule is to choose bond
mutual funds if you have less than $25,000 to $50,000 to invest,
as buying individual bonds can be tricky. With a stock, you can
pull up a quote on your computer and—presto!—you have a good
idea of the going price. But since even bonds from the same is-
suer will have their own characteristics—different coupon rates,
maturity dates, and so on—and thus sell at different prices, it’s
hard to comparison shop for a good deal. Plus, in addition to
charging a commission, many brokerages embed a “markup” in
the price of the bond, making it difficult to know what fees you
paid.
It is gradually becoming easier (and more cost- effective) to
buy individual bonds, so it can be done if you’re willing to put in
the effort. The advantage of individual bonds over bond funds is
you know exactly how much you’ll get back when the bond ma-
tures. Bond funds, on the other hand, don’t technically mature,
so you don’t know what your investment will be worth when you
need the money. In fact, they can lose quite a bit of money, which
can be incon ve nient if it happens right before you need it.
YOUR NE X T MILLION 207
If you’re going to choose a bond fund, stick with short- to
intermediate- term bonds (that is, bonds that mature in two to
fi ve years). And be vigilant about costs—you can fi nd plenty of
good funds with expense ratios below 0.50%. Dodge & Cox In-
come and the Vanguard Short- Term Bond Index Fund are a
couple of Fool favorites.
Rule 3: Any Money You Don’t Need for More than Five Years Is a Candidate for the Stock Market
At this point in the book, you’ve been barraged with stats about
the superiority of stocks for the long run. Any cash you don’t
need in the next few years might wisely be used to buy a piece of
a promising company using any or many of the strategies we’ve
outlined.
We’d be remiss if we didn’t point out that the long run might
have to be long indeed for stocks to pay off. Surely you remember
the 2000–2002 bear market—and, more recently, the fi nancial
crisis of 2008—when the S&P 500 plummeted 40%, and still
hasn’t fully recovered several years later. As of this writing, the
Nasdaq is less than one- half its March 2000 peak. It will take
many years for those who bought at those prices to see a profi t.
If another such debacle would increase your blood pressure,
impair your sleep, or scare you into selling stocks after they’ve
already declined (a real wealth killer), perhaps some of your
longer- term money should be kept in bonds. If history is any
guide (and it’s the only guide we have), you won’t earn as much.
But when the next bear market comes (and there will always be
bear markets), you won’t lose as much. So owning a low- cost,
intermediate bond fund has merit—not excitement or promise of
great rewards, but merit nonetheless.
208 THE MOTLE Y FOOL MILLION D OLL AR PORTFOLIO
Rule 4: Always Own Stocks
Even if you’re in or near retirement, a portion of your money
should be invested for the long term. According to the Centers
for Disease Control, a 55- year- old can expect to live another 26
years. A 65- year- old has another two de cades. The average 75-
year- old lives into her late 80s. (A 110- year- old, however, should
sell everything and get to Vegas while he still can.) And those are
averages, meaning half of the population will live longer. So un-
less you’re a 95- year- old skydiver who smokes, expect your re-
tirement to last two to three de cades. To make sure your portfolio
lasts that long, you need stocks. Over the long term, equities are
the best vehicles to ensure that your portfolio withstands infl a-
tion and your retirement withdrawals.
As Wharton professor Jeremy Siegel wrote in his investing clas-
sic Stocks for the Long Run, for every rolling fi ve- year investing
period since 1802 (1802–1807, 1803–1808, etc.), stocks outper-
formed bonds 80% of the time. Stocks beat bonds in 90% of the
rolling 10- year periods, and essentially 100% of the rolling 30-
year periods. For holding periods of 17 years or more, stocks have
always beaten infl ation, a claim bonds can’t make.
Put it all together, and you should arrive at a stock/fi xed-
income mix that works for you. History tells us that young work-
ers with de cades until retirement should have an all- stock
portfolio. Those within a de cade of retirement should begin
ratcheting down their stock exposure, starting with 10% to 20%
in bonds, reaching 30% to 40% bonds by retirement. Retirees
should maintain that same allocation to fi xed income throughout
their golden years, including an “income cushion” of the next
three to fi ve years’ worth of living expenses out of the stock
market.
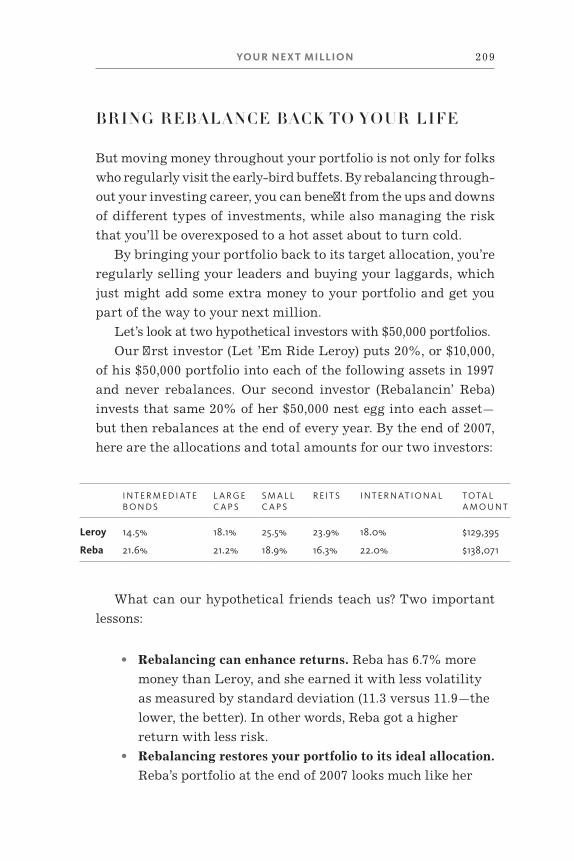
YOUR NE X T MILLION 209
BRING REBALANCE BACK TO YOUR LIFE
But moving money throughout your portfolio is not only for folks
who regularly visit the early- bird buffets. By rebalancing through-
out your investing career, you can benefi t from the ups and downs
of different types of investments, while also managing the risk
that you’ll be overexposed to a hot asset about to turn cold.
By bringing your portfolio back to its target allocation, you’re
regularly selling your leaders and buying your laggards, which
just might add some extra money to your portfolio and get you
part of the way to your next million.
Let’s look at two hypothetical investors with $50,000 port folios.
Our fi rst investor (Let ’Em Ride Leroy) puts 20%, or $10,000,
of his $50,000 portfolio into each of the following assets in 1997
and never rebalances. Our second investor (Rebalancin’ Reba)
invests that same 20% of her $50,000 nest egg into each asset—
but then rebalances at the end of every year. By the end of 2007,
here are the allocations and total amounts for our two investors:
I N T E R M E D I AT E B O N D S
L A R G E C A P S
S M A L L C A P S
R E I T S I N T E R N AT I O N A L T O TA L A M O U N T
Leroy 14.5% 18.1% 25.5% 23.9% 18.0% $129,395
Reba 21.6% 21.2% 18.9% 16.3% 22.0% $138,071
What can our hypothetical friends teach us? Two important
lessons:
• Rebalancing can enhance returns. Reba has 6.7% more
money than Leroy, and she earned it with less volatility
as mea sured by standard deviation (11.3 versus 11.9—the
lower, the better). In other words, Reba got a higher
return with less risk.
• Rebalancing restores your portfolio to its ideal allocation.
Reba’s portfolio at the end of 2007 looks much like her
210 THE MOTLE Y FOOL MILLION D OLL AR PORTFOLIO
original allocation of 20% in each asset. Presumably, she
chose that risk distribution for a reason. Leroy’s port-
folio, on the other hand, has grown riskier as his stocks
have outperformed the bonds. If history repeats itself,
and stocks continue to outperform bonds over the long
run, Leroy’s portfolio will get riskier and riskier, even
though he should be taking less risk as he gets older.
Over the years, we’ve reviewed countless studies on the topic,
and it turns out that rebalancing every year is too much—every
few years is a better strategy. An asset’s relative ranking gener-
ally persists for two or three years before turning the other di-
rection. So annual rebalancing has you selling the winners and
buying the losers too early. A better strategy is to rebalance
when an asset class has moved a certain percentage from your
ideal allocation.
To illustrate, let’s return to Reba. If she rebalanced only when
an asset strayed fi ve percentage points from her target allocation—
dropped below 15% or jumped above 25% of her portfolio—she
would have rebalanced just three times from 1997 to 2007 and
she would have saved on commissions, too. This would have re-
sulted in a portfolio worth $141,078—that’s $3,007 more than her
annually rebalanced portfolio and $11,684 more than Leroy’s
left- alone portfolio. Plus, the standard deviation dropped a tad
as well, to 11. Even more return with even less risk.
Now, this illustration brings us to a sticky question for stock
pickers. For investors whose wealth is mostly in mutual funds,
rebalancing makes a world of sense. For stock pickers, it’s a
tougher question. Your decision to sell a stock should be based on
your analysis of its future earnings as they relate to its current
price. Permitting a few stocks to dominate your portfolio will
increase the volatility, but that alone shouldn’t be a reason to cut
your winners off at the knees.
That said, many risks that investors face—such as executive
malfeasance—may not be revealed by even the best analysis. If a
YOUR NE X T MILLION 211
single stock makes up more than 10% of your net worth and a big
drop in its value would change your life, consider diversifying.
REBALANCING IN REAL LIFE
While rebalancing is an easy concept, it’s not so easy to
implement—especially if you have several investment accounts.
You can’t sell the stocks in your 401(k) to buy bonds in your Roth
IRA (that would be considered a distribution, which would incur
taxes and maybe penalties). Here are some strategies for rebal-
ancing your overall portfolio across many accounts.
The Add and Subtract Strategy: The easiest way to rebalance
is to direct where you put new money or make withdrawals. Sav-
ers should add money to the investments that have lagged. On the
fl ip side, those who need cash might sell recent winners the next
time assets need to be converted into spending money, starting
with the categories that have done particularly well.
The Mother Ship Strategy: If you have one account that con-
tains the majority of your assets, do all your rebalancing there,
especially if it’s a tax- advantaged account that doesn’t charge
commissions (for example, an IRA with no load). While rebalanc-
ing is important, it actually doesn’t affect most of your assets.
Rather, it takes place mostly on the fringes—selling a little bit
here, buying a little bit there. The rest of the portfolio—including
smaller “satellite” accounts outside of the “mother ship”—can
stay invested as is.
The Every Portfolio Is an Island Strategy: If you have several
accounts that are of approximately equal value, treat each ac-
count as an individual portfolio, which means each would have
roughly the same mix of assets. You still might tweak the alloca-
tions based on each account’s tax status.
The U.S. Large Caps in Every Pot Strategy: When you rebal-
ance, chances are U.S. large- cap stocks will be involved—they
make up the biggest piece of most portfolios and they tend to
212 THE MOTLE Y FOOL MILLION D OLL AR PORTFOLIO
move faster than, say, bonds, so they have a habit of growing or
shrinking beyond their original allocation. Thus, one way to re-
balance across many accounts is to hold a position in large- cap
U.S. stocks in each account, ready to be increased or decreased
as needed. Their relatively high tax efficiency makes them an
appropriate common denominator in all of your accounts.
Make Benefits Outweigh Costs
Rebalancing your portfolio involves selling and buying invest-
ments, which could incur taxes, fees, and commissions. Follow
these tips to ensure that shuffling your investments doesn’t con-
sume your assets.
1. Invest in no- load or no- transaction- fee funds. Choose funds
that let you in for free, but also watch for back- end commissions
or redemption fees when you sell. Even no- load fund pioneer
Vanguard sometimes charges fees if you sell too soon.
2. Keep it in the family. Ask if back- end fees will be waived if
you move your money to a fund within the same family. This ma-
neuver is known as an “exchange” and is common with B-share
mutual funds. But an exchange is still a taxable event if the
money isn’t in a retirement account.
3. Rebalance in a tax- advantaged retirement account. Uncle
Sam doesn’t care about transactions within a 401(k) or IRA—it’s
when you start taking money out that the government takes no-
tice.
4. Sell the shares with the highest cost basis. If you need to
sell shares of a stock or fund in a non- retirement account, desig-
nate the shares that cost you the most (contact your brokerage or
fund company to fi nd out how). Your gain will be smaller (or your
loss bigger), and you’ll pay fewer taxes. If you’re selling at a
profi t, make sure you’ve held the shares for longer than a year so
they’ll qualify as long- term capital gains (and a lower tax rate).
One fi nal note: Once you’ve designated a method for selling your
mutual fund shares, you must stick with that method until all
the shares have been liquidated.
YOUR NE X T MILLION 213
Risk Before Return
Now that we’ve got you all pumped up about the joy of rebalanc-
ing, we must provide a bit of perspective. Our hypothetical illus-
tration doesn’t include taxes and commissions, which could wipe
out the return benefi ts of rebalancing. And we only used one
time period. As the lawyers say, past per for mance is not indica-
tive of future returns. There have been periods when rebalancing
actually hurt returns, especially for portfolios that have more
than 20% allocated to bonds.
So, rebalancing must fi rst be thought of as a risk- control
strategy. If the future resembles the past, rebalancing every few
years will pay off over the long term (ten years or more). But
there’s no guarantee. However, steering your portfolio back to a
mix you’re comfortable with is guaranteed to help you sleep at
night. You should be the one in control of the amount of risk you
take—not the market.
THE $1 MILLION PORTFOLIO AND BEYOND
You’ve now spent a good chunk of time and thought pondering
your fi nancial future—which, incidentally, puts you in far better
shape than the vast majority of Americans, many of whom are
counting on a combination of the lottery, reality show winnings,
and valuable things they fi nd in their attics to see them through
their retirement years.
The next step is to apply this knowledge, and to get started on
building your fi rst million. Below are three model portfolios that
provide reasonable asset mixes, depending on your investing
timeline and temperament. You’re under absolutely no obligation
to follow these guidelines—we promise we won’t be checking
your brokerage statements—but they might help frame your
thinking as you dive in.
Notice that “blend” and “growth” are grouped together. A
“blend” mutual fund has both growth and value stocks; S&P 500
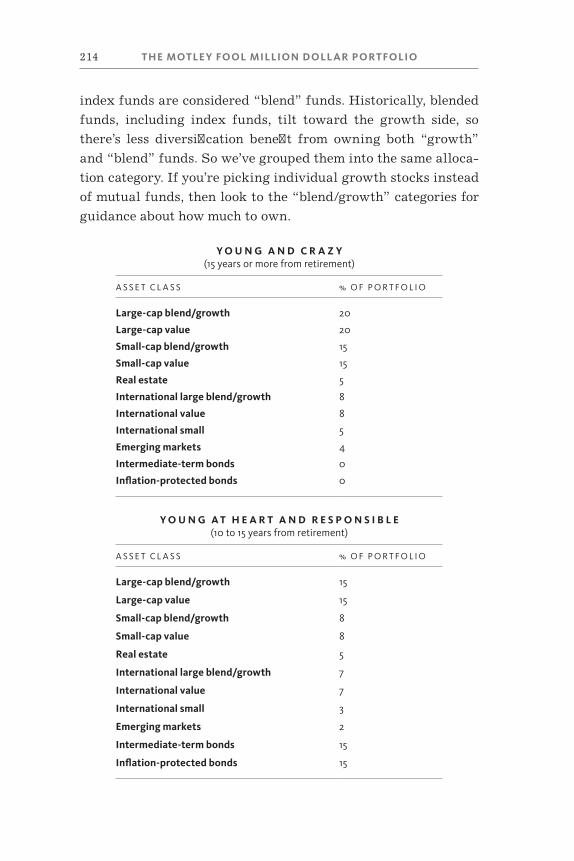
214 THE MOTLE Y FOOL MILLION D OLL AR PORTFOLIO
index funds are considered “blend” funds. Historically, blended
funds, including index funds, tilt toward the growth side, so
there’s less diversifi cation benefi t from owning both “growth”
and “blend” funds. So we’ve grouped them into the same alloca-
tion category. If you’re picking individual growth stocks instead
of mutual funds, then look to the “blend/growth” categories for
guidance about how much to own.
Y O U N G A N D C R A Z Y (15 years or more from retirement)
A S S E T C L A S S % O F P O R T F O L I O
Large- cap blend/growth 20
Large- cap value 20
Small- cap blend/growth 15
Small- cap value 15
Real estate 5
International large blend/growth 8
International value 8
International small 5
Emerging markets 4
Intermediate- term bonds 0
Infl ation- protected bonds 0
Y O U N G A T H E A R T A N D R E S P O N S I B L E (10 to 15 years from retirement)
A S S E T C L A S S % O F P O R T F O L I O
Large- cap blend/growth 15
Large- cap value 15
Small- cap blend/growth 8
Small- cap value 8
Real estate 5
International large blend/growth 7
International value 7
International small 3
Emerging markets 2
Intermediate- term bonds 15
Infl ation- protected bonds 15
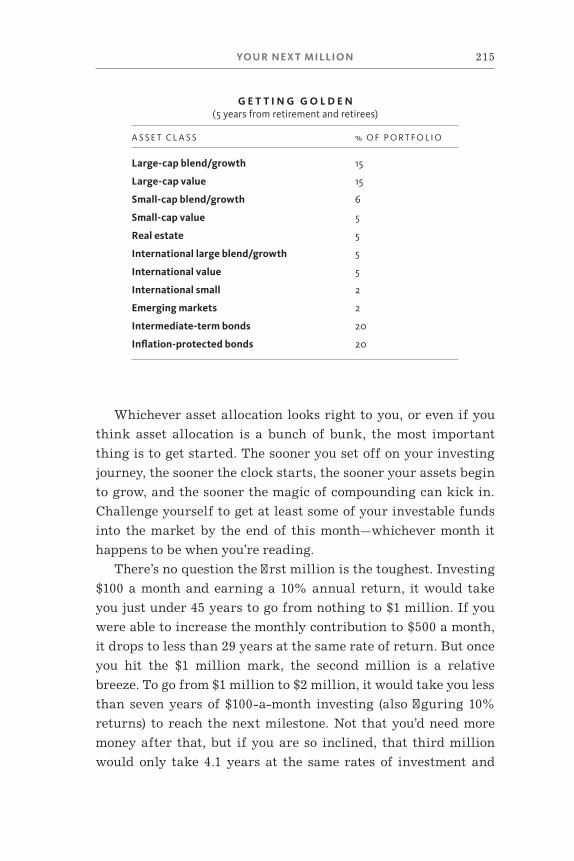
YOUR NE X T MILLION 215
G E T T I N G G O L D E N (5 years from retirement and retirees)
A S S E T C L A S S % O F P O R T F O L I O
Large- cap blend/growth 15
Large- cap value 15
Small- cap blend/growth 6
Small- cap value 5
Real estate 5
International large blend/growth 5
International value 5
International small 2
Emerging markets 2
Intermediate- term bonds 20
Infl ation- protected bonds 20
Whichever asset allocation looks right to you, or even if you
think asset allocation is a bunch of bunk, the most important
thing is to get started. The sooner you set off on your investing
journey, the sooner the clock starts, the sooner your assets begin
to grow, and the sooner the magic of compounding can kick in.
Challenge yourself to get at least some of your investable funds
into the market by the end of this month—whichever month it
happens to be when you’re reading.
There’s no question the fi rst million is the toughest. Investing
$100 a month and earning a 10% annual return, it would take
you just under 45 years to go from nothing to $1 million. If you
were able to increase the monthly contribution to $500 a month,
it drops to less than 29 years at the same rate of return. But once
you hit the $1 million mark, the second million is a relative
breeze. To go from $1 million to $2 million, it would take you less
than seven years of $100- a-month investing (also fi guring 10%
returns) to reach the next milestone. Not that you’d need more
money after that, but if you are so inclined, that third million
would only take 4.1 years at the same rates of investment and
216 THE MOTLE Y FOOL MILLION D OLL AR PORTFOLIO
return. But to get to that money- printing stage, you need to start
as soon as possible.
Granted, this book has provided you a whole lot of strategies
and ideas—some of them seemingly contradictory—and you
might not know where to jump in. But don’t allow yourself to be
paralyzed by information overload.
Start by purchasing some of the index funds we’ve discussed
to get some skin in the game and to begin seeing how much com-
pounding can help you. Or check Appendix A to fi nd a couple of
high- quality mutual funds that made sense to you and your in-
vesting interests. Then start researching individual stocks. If
you’re like most people, one of these chapters spoke to you more
than the rest—dividends make nothing but sense, you might have
said as you dog- eared that chapter, or, I’m all about innovation
and risk, sign me up for the Rule Breaker strategy. Use CAPS and
your own expertise and experience to fi nd a company that in-
trigues you, then fi nd out as much as you possibly can about that
business, its leadership, its competition, its fi nancial situation, and
how others view it as a potential investment—it’s likely that there’s
at least an article or two on Fool .com about the company and quite
possibly an enlightening thread on our discussion boards. If it
looks promising, buy some shares. If your investment increases in
value, good for you. If it drops, also good for you.
Because either way, you’re an investor. Welcome to the club!
Motley Fool Advisor Robert Brokamp contributed to this
chapter. The fearless leader of the Rule Your Retirement ser vice,
and a Fool for 10 years, Robert would have liked to contribute
more, but he had to see a horse about a man.
Visit mdpbook .com to learn more about how we’re building a
diversifi ed portfolio—using all the strategies outlined in this
book—in our Million Dollar Portfolio investing ser vice.
CH A PTER 11
WHAT NEXT?
Did you think you were done? Though we’ve walked through
your fi rst stock purchase, detailed our fi ve most profi table
investing philosophies, introduced you to our powerful CAPS
community, and showed you how to map out the path to your
next million, none of this book’s lessons will help you become a
better investor unless you put them into action today. What does
that mean?
THREE ACTION STEPS
1. Buy a stock. If you already own stock, buy another stock
using the strategy that most appeals to you. If you’re not
quite ready to buy a stock, buy some shares of an index
fund. That single action will pay for this book many
times over. Remember, the best time to start investing is
right now.
2. Keep learning. Reread this book. Read the books on the
recommended reading list we provide on page 241. Read
218 THE MOTLE Y FOOL MILLION D OLL AR PORTFOLIO
the newspaper daily. The more you know about invest-
ing, the world economy, and the companies that keep it
going, the more likely you are to succeed as an individ-
ual investor.
3. Get more help if you need it. Appendix A will give you
some keys on how to invest successfully in mutual funds.
If stock picking seems overwhelming to you, start there.
Also, you can visit Fool .com to read premium research
from analysts who work within each of these strategies,
or in the case of Million Dollar Portfolio, all of them! We
also offer free trials to every one of the newsletter ser-
vices we’ve mentioned throughout the book.
Finally, don’t forget to visit mdpbook .com, where we offer top
stock picks from each of the investment strategies we’ve dis-
cussed here, provide additional research and tools, and invite
your feedback on the book.
Thank you for allowing us to guide you along your investing
journey. We hope to be your partners for life.
Fool on!
A PPENDIX A : PICK ING THE R IGHT MUTUA L FUNDS
Throughout this book, we focused on stock investing, which
we believe is the single best path to investing riches. But that’s
not to say it’s the only way, and it’s certainly not the most preva-
lent. Given their popularity in 401(k) and other retirement plans,
mutual funds are actually the most common type of investment
for most Americans. In many retirement plans, funds are the
only option. So even though we’re predominantly stock guys, we
wanted to offer some insight into how to fi nd the best funds
available.
There’s a lot to be said for mutual funds—theoretically, they
allow the average investor to put his dollars and faith in the ex-
pert stock- pickers who helm the funds, limiting their downside
risk while earning solid if unspectacular returns on their money
with relatively little effort.
Unfortunately, there is no way to invest in theory.
In reality, there are roughly 8,000 stock and bond funds on
the market in the U.S., the majority of them overpriced, over-
hyped underperformers that in the long run serve primarily to
make you feel better about your own individual investing. “I
could have lost that money myself,” is the common lament of the
frustrated fund investor. “And without the fees.”
220 APPE NDIX A
With so many funds—and so many bad ones—how can inves-
tors fi nd the winners that successfully turn theory into practice?
That’s the $64,000 question—or however much you happen to
have to invest. The majority of mutual funds are proven under-
performers. For the 15 years that ended with April 2008, fewer
than 450 domestic stock funds delivered an annualized return
greater than the S&P 500’s mark of 10% over the period.
Following that math to a seemingly logical conclusion, many
investors understandably choose to park their money in index
funds. After all, if you can’t beat the market with actively man-
aged funds—in which managers scour the market for the stocks
they think stand the best chance of big returns—you can at least
match it by investing in a low- cost S&P 500 index fund. Well, not
quite. Investing exclusively in index vehicles means you only get a
B-grade: Your funds will lag the market each year by about the
amount of their expenses.
BUT WAIT, THERE’S MORE
Just when our quest for quality funds is looking its most dire, it
gets a bit worse. Per for mance is perhaps the worst of the mutual
fund industry’s woes, but it’s far from our only concern. Scan-
dals abound in the world of money management, which counts
among its numerous lowlights a handful of shops that permitted
favored clients to buy and sell fund shares after the market’s
close—a practice that Eliot Spitzer (in his pre- disgrace days)
aptly compared to betting on yesterday’s horse races.
Some fund companies also encouraged their teams to funnel
“hot money” into and out of funds—also known as market-timing.
While this practice isn’t illegal, it almost never benefi ts long-
term fund investors. Managers working in such a rapid- fi re
environment have to make trades based not on sound investing
strategy and research, but in order to meet redemptions or to put
short- term cash to work. That leads to higher transactions costs,
which means lower returns for investors.
APPE NDIX A 221
While market- timing and blatantly illegal abuses made head-
lines and led to fi nancial penalties for many fi rms, there are nu-
merous other “silent scandals” that await investors who choose
the wrong funds.
Many funds have unacceptably high expenses, fattened up by
costs such as 12b–1 fees, charges investors pay to help market
and distribute funds they have already purchased, and loads,
fees that the fund company charges just because. These fees make
it difficult, if not impossible, for investors to understand just
how much they’re paying for their funds. Fund companies even
obfuscate their overall per for mance by closing lousy funds or
merging them into more successful offerings. This practice—
which leads to so- called survivorship bias—makes it difficult to
gauge the company’s true per for mance.
90 MILLION INVESTORS CAN’T BE WRONG—OR CAN THEY?
Despite all these pitfalls, mutual funds are the centerpiece of
most investors’ portfolios. According to the Investment Company
Institute (ICI)—the fund industry’s keeper of facts and fi gures—
roughly 90 million Americans own mutual funds and, at the close
of March 2008, the sum total of their investments hovered near
the $12 trillion mark.
And if you do your homework and choose intelligently at the
outset, a fund portfolio can turn into a set- it- and- forget- it
long- term investing machine, like the fund-dominated real-
money Ready-Made Millionaire portfolio we offer at the Motley
Fool. There’s no need to dive into a pile of earnings reports every
quarter, no vague sense of guilt if you prefer not to scour balance
sheets and fi nancial statements, no nagging suspicion that maybe
you should have dumped your shares yesterday.
Even better, you’re always free to invest more when a fi ckle
market puts your favorite funds on sale. No single corporate
event, no matter how dire, is likely to decimate a diversifi ed
mutual fund. You also have an all- star fund manager on your
payroll to contend with the slings and arrows of outrageous mar-
ket fortunes.
The upshot? If you want to build wealth intelligently over
time without constantly fi ghting the urge to click over to your
minute- by- minute stock value, funds are, as investment lumi-
nary and Vanguard found er Jack Bogle put it, the “fi nest vehicle
for long- term investing ever designed.”
That is, if you know how to separate the fund industry’s wheat
from its plentiful chaff.
AYE, THERE’S THE RUB
Did we mention that the vast majority of funds are overpriced
duds without proven management teams, long- haul track rec-
ords, or strategies that allow their stock- pickers- in- chief to take
advantage of varying market conditions? What’s more, with
thousands to choose from, the odds of throwing a dart and hit-
ting a winner come in two fl avors: slim and none.
Good thing we don’t believe in dart- throwing. At the Fool, we
believe that if you bring the same level of scrutiny to bear on
funds as we do on stocks, it’s possible to fi nd funds with the po-
tential to beat the market. What’s more, you can relatively pain-
lessly put these funds together in a diversifi ed portfolio that
outperforms the market while keeping volatility in check.
That’s precisely what we’ve been doing at the Fool for roughly
fi ve years and counting in our Champion Funds newsletter. Our
track record (all data through March 2008) demonstrates that it’s
possible to leave the vast majority of the fund universe in the
dust by focusing on the traits that we think make for a potential
champion:
• Long manager tenure (eight years for Champion Funds
versus just over four years for the broad domestic- stock
fund average)
222 APPE NDIX A
APPE NDIX A 223
• Low expense ratio (0.92% vs. 1.37%)
• Low 12b–1 fees (0.02% vs. 0.32%)
• Low turnover (64% vs. 87%)
By focusing on those characteristics, Champion Funds has
bested the S&P 500 by 3.03% over the past three years (compared
to 0.12% for domestic- stock funds) and 5.87% (vs. 0.72%) over the
past fi ve.
THE MAKING OF A CHAMP
In order to determine if a fund is worthwhile—and whether it
has what it takes to beat the market over time—investors should
drill down on these key criteria.
Managerial Tenure
With funds, you’re investing in the manager. Lots of otherwise
intelligent folks get stars in their eyes when perusing past-
per for mance fi gures in the glossy brochures fund companies dis-
tribute in order to lure in prospective shareholders. But if that
impressive track record doesn’t belong to the manager who’s cur-
rently calling the shots, that showing—in the immortal words of
Elvis Costello—means less than zero.
There’s nothing inherently magical about a mutual fund, af-
ter all. Fidelity’s world- famous Magellan fund was an incredible
wealth- creater for its shareholders when investment great Peter
Lynch was at its helm, but not so much under Bob Stansky, a
Lynch successor who turned Magellan into a so- so mutual fund.
Moreover, while there are a handful of exceptions, fi ve years is
just about the minimum tenure a manager needs to weather at
least one market cycle—and to learn how a par tic u lar strategy
will play out against various economic backdrops.
Perhaps most importantly, as you go about the business of
vetting and conducting due diligence on your prospective money
managers, approach the decision as if you’re hiring someone
for a mission- critical job. After all, that’s exactly what you’re
doing.
Style- Neutral Outper for mance
If you come across a foreign large- cap growth fund that deliv-
ered an annualized gain of 18% over the past fi ve years, it might
well grab your attention. But before you buy, remember that con-
text is critical. In this case, it turns out that the typical foreign
large- cap growth fund delivered an annualized gain of roughly
20% over that same period. In relative terms, then, the former
fund’s seemingly impressive 18% gains are actually rather under-
whelming.
Similarly, though small- cap stocks as a group began return-
ing to earth during 2007, they have outperformed the market’s
bigger boys for most of this de cade. If fi ve years ago you invested
$10,000 in a so- so small- cap fund, you would have nearly doubled
your money. A similar investment in a large- cap fund, on the
other hand, would have risen to $16,700 and change.
The moral of the story? When you’re trying to pick the cream
of a category’s crop in order to put together a diversifi ed port-
folio, it’s all relative. While stock picking is a fund manager’s
focus, part of any fund’s success is owed to where it falls on the
market- cap and growth/value spectrums—its “style.” Given the
way investors favored smaller stocks over large caps for most
of this de cade, for instance, it would be unrealistic to expect
even the most talented large- cap manager to have outperformed
smaller rivals. Similarly, when value holds sway, investors
shouldn’t expect growth funds to lead the pack.
As you research individual funds, the way to control for the
infl uence of style is to make apples- to- apples comparisons based
on, among other things, relative returns. If a manager has out-
classed his direct competitors, that’s a good sign he has added
value through stock picking or timely asset allocation calls. On
the other hand, if a fund looks great in absolute terms but comes
224 APPE NDIX A
APPE NDIX A 225
up short compared with its peers, that may mean the manager
just happened to be in the right place at the right time.
Reasonable Expenses
Another great thing about fund investing is that it’s possible to
do it on the cheap. The brokerage arms of Fidelity, Vanguard, and
Charles Schwab (to name but three) offer scads of funds that
carry no transaction fees. If the fund you’re after isn’t one of
them, you can typically go directly through the shop that offers
the fund and invest without paying a dime.
Whether or not you pay a brokerage commission, you’ll still
have to pay the fund’s expense ratio—the percent of your assets
fund companies shave off your cash in exchange for the ser vices
they provide.
Don’t make the mistake of thinking you’ll get better returns if
you pay up for a fund. All things being equal, the lower the price
tag, the better the fund is likely to be. The fact is that money that
goes into the fund’s pockets comes out of yours. So if you’re pay-
ing less, you’re investing more, and your money is doing more for
you.
Beyond that, a cheap price tag provides a built- in competitive
advantage for managers: They have a lower hurdle to clear rela-
tive to pricier rivals when it comes to competing against fee- free
benchmarks such as the S&P.
Before you assume that means you should invest in a low- cost
index tracker such as Vanguard 500 Index—whose expense ratio
is a dirt- cheap 0.15%—remember that with index funds, the best
you can do is to underperform the market each year by about the
amount of your annual expenses.
We think you can do far better than that. Through a combina-
tion of well- chosen funds and individual stocks, you should eas-
ily best the benchmark.
The bottom line? While index funds certainly have their place
when it comes to providing strategic diversifi cation—indexing
is a strategy, just like growth or value investing—we think you
should shoot higher without paying to do so. With that in mind,
consider that while the typical domestic- stock fund will ding
you roughly 1.4% each year, those that have made the grade with
Champion Funds cost less than 1% on average and, as a group,
have handily beaten the market.
A Winning Risk- Reward Profile
Risk and reward go hand in hand, so it’s critical to select funds
that carry a level of risk commensurate with the returns the
fund has delivered over time. This risk- reward profi le is critical
to consider when it comes to judging whether a fund strikes the
right profi le in light of your temperament and timeline as an in-
vestor.
We also know that losing money is no fun at all. We think the
best way to avoid that is through smart asset allocation, divvy-
ing up your assets in a way that spreads your bets among asset
classes. When one portion of your holdings drops precipitously,
another can be there to prop up your assets.
This is where mathematical means of assessing risk come in
handy: These quantitative tools can help all of us design smarter
portfolios—investment lineups that can weather the market’s in-
evitable ups and downs while allowing us to sleep at night. Pick-
ing the par tic u lar funds to slot into our personalized pie charts
is, for many a fund geek, the fun part of fund investing. But
without an asset- allocation game plan—a portfolio construction
strategy that suits your timeline and tolerance for risk—that fun
can fi zzle and fade.
Just ask those poor folks who haphazardly backed their way
into a portfolio heavy with tech exposure around the turn of the
millennium. In the late 1990s, the sky seemed to be the limit for
tech stocks and the funds that invested in them. As we all learned,
what goes up must come down, particularly when it comes to
high- fl ying equities with a century’s worth of future earnings
already priced in.
226 APPE NDIX A
APPE NDIX A 227
Judging from conversations on The Motley Fool discussion
boards, a good many smart investors lived through and learned
from the tech sector’s meltdown, the “tech wreck” of fi nancial
folklore. The most important of their discoveries may be that
even aggressive investors need to practice portfolio risk man-
agement.
On one level, the decision to invest in high- caliber mutual
funds mitigates risk. Still, every investment carries risk. With
that in mind, here’s a guide to help you develop and execute your
asset- allocation strategy in light of your own risk/reward profi le.
Standard Deviation: When it comes to gauging the volatility
of mutual funds, standard deviation is a con ve nient blunt instru-
ment. Standard deviation mea sures how far from its mean return
a fund’s per for mance has swung. The bigger the number, the
more volatile the fund.
That’s straightforward enough, but standard deviation needs
context to be useful. Otherwise, you could end up comparing
bond- fund apples with equity- fund oranges. For a quick and
useful take on a fund’s relative volatility, compare it with the ap-
propriate broader- market benchmark tracker. Over the past
three years, for instance, SPDRs—an S&P 500- tracking ETF that
comes with a rock- bottom price tag—returned an annualized
8.1% and posted a standard deviation of roughly 9%, while Van-
guard’s Total Bond Market Index fund gained 4.9% with a stan-
dard deviation of approximately 3%.
Translation: As you may recall from your college statistics
class, those numbers mean we can be 66.7% certain that, over the
three- year mea sure ment period, the per for mance of SPDRs
ranged between roughly –0.9% and 17.1%, while Total Bond Mar-
ket gave investors a far smoother ride, staying within the com-
paratively narrow range of 1.9% to 7.9%.
Alpha and Beta: There are certainly techniques more nuanced
than standard deviation to help determine a fund’s volatility,
and in that regard, alpha and beta are useful tools as well. In a
user- friendly nutshell, a fund’s beta compares its showing with

that of a given benchmark, while its alpha fi gure provides in-
sight into just what, if anything, the fund’s manager has brought
to the table in terms of stock- picking acumen.
Here’s an illustration: A fund with a beta of 0.97 relative to
the S&P 500 should lag that benchmark when the market rises
while outperforming it when things go south. Notice, however,
the word “should.” Actively managed funds aren’t statistical
models, and mathematically elegant though its formulation may
be, beta needs what investing scholar Aswath Damodaran calls a
“companion variable” to be useful.
That’s where alpha comes in, and here’s just about everything
non- fi nance geeks need to know about alpha: If the fi gure is
positive, the fund’s manager has likely added value. If it’s nega-
tive, he probably hasn’t.
R-Squared: This metric is another of our favorite analytical
tools because it helps gauge whether a fund that purports to be
actively managed might really be an overpriced index- hugger
in disguise. An R-squared score of 100 indicates that a fund has
a perfect correlation with a given benchmark. Lower scores in-
dicate the degree to which a manager goes his or her own way.
Admittedly, some managers perform wonders on relatively
short benchmark leashes. Nonetheless, when you’re trying to
zero in on actively managed picks that give you the most for your
money, there’s simply no reason to pay up for a fund that merely
shadows its bogey. R-Squared is a no- muss, no- fuss way of de-
termining if that has been the case.
Each of the above quantitative gauges has limitations. Stan-
dard deviation doesn’t tell you much in isolation, and alpha and
beta are only useful in tandem and if you’re mea sur ing your
fund’s relative risk against an appropriate benchmark. One sure-
fi re way to gauge risk, however, is to ask a simple question: How
well has the manager played defense? Successful fund investors
should seek out reliable capital preservationists whose track rec-
ords include few calendar- year losing campaigns and who, when
they have hit rough patches, have navigated them better than
most peers.
228 APPE NDIX A
APPE NDIX A 229
Evidence of a Shareholder- Friendly Culture
Last but far from least, the shop behind the fund should stand
behind the fund in a way that puts shareholders fi rst. If making
that kind of qualitative determination sounds like a head-
scratcher to you, not to worry: While many fund companies are
far- fl ung behemoths with dozens, and sometimes hundreds, of
offerings to sort though and choose from, getting a sense of their
corporate culture in a way that can help you make smarter
investment choices is easier than you might imagine.
Here are three core items you should be on the lookout for at
the level of the fund shop.
1. Expense ratios that decline as assets under management
rise: Some of the most successful mutual funds are also
some of the cheapest—and that’s no coincidence. A low
price tag, as we’ve suggested, provides a built- in com-
petitive advantage because managers of cheaper funds
have less of a “cost drag” to contend with relative to
those who captain pricier offerings.
Beyond that, as a fund’s assets grow, the fund com-
pany has more shares to spread its costs across, and a key
way of determining whether a fund has its investors’
interests at heart—perhaps the key way—is to note
whether they pass “economy of scale” savings onto their
investors. If a fund’s expense ratio doesn’t decline as its
assets under management increase, that’s ample reason
to believe that the fund company is putting its own
interests above those of its shareholders.
2. Funds that close well before they suffer dreaded “asset
bloat”: There is an inherent confl ict of interest built
into the money management business: Fund companies
have an economic incentive to grow their assets. The
more money they manage, the higher their fees in
absolute dollar terms. Trouble is, what’s good for the
fund company’s bottom line can be bad news for
shareholders—particularly when it comes to smaller- cap
funds.
As a fund with a massive asset base trades in and
out of smaller- cap companies, it risks moving stock
prices in the wrong direction—up while building a
position and down while trying to exit one. These are
the so- called “frictional costs” of mutual- fund trading,
and while they don’t show up in shareholder reports,
they affect an investor’s returns in the same way as a
fund’s expense ratio does: These costs are exacerbated
by asset bloat, which occurs when fund companies
allow infl ows to swell beyond the point where even the
most talented stock pickers can execute their strategies
effectively.
Good thing, then, that there’s a simple solution to the
problem of mutual fund obesity: The best and most
responsible shops close funds to new investors (this is
called a “soft” close) and sometimes to all investors (a
“hard” close) in order to stave off the ill effects of asset
bloat.
If you suspect a fund you hold may have put on a few
pounds, here’s a tip sheet to help determine if that
development is weighing on returns.
The fund’s cash position is huge. If your holding’s
cash stake remains sizable over a protracted length of
time, the manager may be having difficulty putting new
money to work. A cash position of 15% or more over two
consecutive reporting periods (the annual and semian-
nual reports, for example) is worth investigating. Any-
thing over 20% may well indicate that better investment
opportunities lie elsewhere.
The portfolio is concentrated. Funds that invest in 20
or fewer stocks are especially vulnerable to asset bloat. A
big base means the manager must stuff new money into a
compact portfolio, dialing up the potential for volatility.
Adding new stock holdings is an alternative, but the risk
230 APPE NDIX A
APPE NDIX A 231
is that doing so will water down the strategy (and the
returns) that attracted you to the fund in the fi rst place.
If you own a concentrated fund and per for mance seems
to be dragging as assets under management rise, that’s
cause for concern—and a possible sale.
The fund is a drifter. A fund that starts drifting up
the market’s cap range may be too fl ush with cash,
sending its managers outside their circle of compe-
tence. True, some managers are “go- anywhere” types,
scrounging for values wherever they can fi nd them. A
successful low- turnover strategy can lead to a
bigger- cap orientation, too, as successful small- cap
selections morph into mid caps and beyond—remember
that Wal- Mart was a small cap then a mid cap before it
was a world- eating behemoth. Nonetheless, it pays to
look out for “style drift,” particularly among
smaller- cap funds. In addition to being a symptom of
asset bloat, a fund that drifts from small cap to large
or from growth to value can wreak havoc on your asset
allocation.
3. Management that puts its money where its mouth is:
Another key ingredient when it comes to cooking up a
mutual- fund winner is a candid manager. In a fund’s
annual and semiannual shareholder reports, clear
per for mance attribution breakdowns are helpful, par-
ticularly when it comes to determining whether your
manager has added value through stock selection or
timely sector calls (avoiding fi nancials during the sub-
prime debacle, for example, or loading up on shares of
energy companies as the price of fuel has soared).
But even if your managers favor a more minimalist
style of reportage, there is a quick way to determine if
their interests are aligned with yours. Do they eat their
own cooking? That is, do they invest their own
hard- earned money alongside their shareholders? If they
don’t, why should you?
Thanks to the SEC, fund investors now have an easy
way of determining whether their managers put their
money where their mouths are: the Statement of Addi-
tional Information (SAI). The SAI supplements the
prospectus and lays out, within dollar ranges, just how
much of their own money a fund’s manager has riding
alongside yours. It’s hard to imagine a better
values- aligning litmus test: If your managers are
signifi cant investors in the funds you own, their inter-
ests are your interests too.
WHY THE CHAMPION-FUNDS APPROACH WORKS
As investors, many of us are our own worst enemies when it
comes to making buy and sell decisions, purchasing stocks dur-
ing phases marked by a condition that former Federal Reserve
chairman Alan Greenspan famously characterized as “irratio-
nal exuberance” and, alternately, selling during periods we might
characterize as “irrational despair.”
The main advantage of the Champion Funds philosophy is
that it’s tough to screw up. No investment approach comes with a
guarantee, of course, but if you put your funds and their manag-
ers through the paces we’ve outlined above—and if you keep in-
vesting through good times and bad—odds are strong that you’ll
grow your portfolio as well as, if not better than, your average
stock jock who has to overcome the disadvantage of his outsized
brokerage bill.
You’ll also avoid “complexity fatigue”: If an investing game
plan is comparatively easy to follow, you’re more likely to stick
with it over time. With funds, once your lineup is in place, you’re
set. You can put your portfolio on autopi lot, making regular con-
tributions, rebalancing annually, and tweaking your equity ex-
posure as retirement draws near.
You’ll also avoid hyperactive trading. By design, quality mu-
232 APPE NDIX A
APPE NDIX A 233
tual funds are buy- to- hold propositions, a profi le that serves
long- term investors well and helps keep their inner day- trader
at bay, too. When it comes to stocks, after all, the temptation to
trade in and out can be nearly irresistible. Great companies
can be lousy investments if the price isn’t right, and trying to
determine if Google, say, is a great investment at $450 but not
at $600 is enough to drive even the most patient investor to
distraction. Should you harvest gains and deploy the proceeds
into picks with greater upside potential or, as the saying goes,
should you let your winners run? It’s a tough call. Valuation
work (gauging a stock’s price relative to such mea sures as
earnings, book value, and cash fl ow) isn’t for the idle investor.
With well- chosen funds, on the other hand, you’ve hired top-
notch money managers to do the heavy valuation lifting for you
while you vet them with a relatively straightforward set of cri-
teria.
PARTING IS SUCH SWEET SORROW
We’ve outlined the qualities to look for when hiring managers,
but what about when it comes time, perhaps, to fi re them?
Any decision to sell an investment should be considered in
light of the potential tax hit you would take on the transaction,
but as a rule, these are the main reasons you should consider
parting ways with a mutual fund:
The manager has departed. You should own a fund on the
strength and reputation of the manager. If the manager has left
the building and you don’t have confi dence in the replacement,
you should consider moving on, too.
The strategy has changed. If your fund’s strategy seems to
change over time—or worse, with the winds—you should con-
sider cutting it loose.
A prolonged period of underper for mance. Anything over
three years is worth looking at, but only if you determine that
the reasons you bought the fund are no longer valid. Market
trends—for which no manager is to blame—can be surprisingly
durable.
Expenses are high or on the rise. Costs count. You want them
low to begin with and you want them to stay that way. Creeping
expense ratios demand a watchful eye, and as we’ve noted, you
should expect a fund’s price tag to fall as its assets under man-
agement rise.
Getting too darn big. If a fund shop lets a fund grow to the
point where it’s no longer nimble, this can be murder on per for-
mance.
Lack of shareholder friendliness. If expansive shareholder
letters turn evasive or terse, or if the management team isn’t
meaningfully invested in the fund they run, take a hard look. Be
especially on guard when small shops are absorbed by bigger
companies.
Scandal. If the unlikely happens and we experience another
pervasive scandal like the one that pockmarked the money-
management industry earlier this de cade—and if you hold an
implicated fund—consider moving on.
A QUINTESSENTIAL CHAMP
Now that we’ve laid out the core principles that investors need
for mutual fund research, let’s jump from the magical land of
theory into reality. Below, we look at a fund that hails from an
exemplary shop that has enriched its shareholders over the
course of many years, all while hewing to the highest ethical
standards.
Investors in Bridgeway Small Cap Value have been well
served for many years, both in terms of per for mance and candid
shareholder communications. At just 0.88%, its expense ratio
falls more than 30 basis points (0.30%) below that of its average
rival. Se nior manager John Montgomery has racked up many years
of outsized success at other offerings utilizing the same quantita-
234 APPE NDIX A
APPE NDIX A 235
tive tack he and his team take here. Even better, Montgomery is
ethical in the extreme, and his interests are clearly aligned with
those of his shareholders. The only way he can invest in the stock
market at all is through the funds his shop manages.
The Nitty GrittyWhat goes up must come down. Just ask investors in small- cap
stocks about their experience for the 12 months that ended with
April 2008, a stretch of time that saw the Russell 2000 index (a
widely used small- cap benchmark) decline by 11% while the
large- cap- dominated S&P 500 shed “just” a little under 5%.
Ouch. But that’s the way reversion to the mean works: As rel-
ative valuations stretch, the smart money eventually goes where
the bargains are, taking down erstwhile high- fl iers along the
way. Few asset groups have fl own higher than small- cap stocks
during the current millennium.
That track record has been especially pronounced among
small- cap stocks of the value persuasion. Despite the small- cap
sell- off (which began in earnest during the summer of 2007), the
Russell 2000 Value benchmark posted an annualized gain of
14.1% for the trailing fi ve- year period that ended with April
2008, a mark that outpaced the S&P by nearly four annualized
percentage points.
Missed that rally? Not to worry. The recent bursting of the
small- cap bubble has created strong opportunities for investors
in search of exposure to that area, and Bridgeway’s Small- Cap
Value fund is among the very best of them, meeting—and often
exceeding—every standard outlined above.
Volatility—and Opportunity—Knock
As small caps are generally among the market’s most volatile
stocks, astute investors will want to consider using a value-
oriented fund to anchor the small- cap portions of their portfolios.
Buying stocks that trade at a discount to their industries or the
broader market—a good working defi nition of “value” when it
comes to gauging equities—can insulate that portion of your
portfolio from price risk. When the market hits the skids, your
value- priced securities won’t have as far to fall as more expen-
sive rivals.
That notion is core to the appeal of Bridgeway Small- Cap
Value, which opened for business in 2003. Owing in part to the
small- cap downturn, the fund doesn’t have a huge backlog of
capital gains that new investors—those who were not around to
enjoy the gains generated by the protracted rally in small caps—
would be liable for, tax- wise, as those gains are realized.
Combined with a sensible, emotion- free, closely held quanti-
tative strategy, these qualities add up to a top- notch choice for
small- cap exposure.
Hit List
That’s the big picture. Here’s the drill down, beginning with
manager John Montgomery. The force behind Bridgeway Capital
Management is a successful stock picker with an outstanding
track record and a rock- solid commitment to his shareholders, of
which he is one.
Of course, the bottom line when it comes to judging share-
holder friendliness is whether a manager has made money for his
investors. Montgomery and his team come up big- time winners
in that department, too. Through the close of March 2008, for
example, the shop’s Ultra- Small Company fund has earned a
remarkable annualized return of 18.6% since its inception in Oc-
tober 1994. Another fund, Bridgeway Aggressive Investors I, de-
livered a gain of more than 19% over roughly the same period.
(Both those marks best their relevant benchmarks by wide mar-
gins.)
Both those funds are currently closed to new investors—an-
other key illustration of the way in which Bridgeway adheres to
236 APPE NDIX A
APPE NDIX A 237
our Champion Funds philosophy. Rather than allowing these
funds to grow assets to a point where it would become difficult if
not impossible for the management team to execute its strategy
effectively, Bridgeway ratcheted down the infl ow, putting the
funds’ current shareholders fi rst and forgoing the additional fees
it could have raked in with bigger asset bases.
Montgomery pursues a similarly successful strategy at Bridge-
way Small- Cap Value, though Bridgeway is careful not to di-
vulge too much information about the inner workings of its
team’s modeling pro cess. After all, if the shop were to reveal its
secrets, the industry’s lesser lights could arbitrage away Bridge-
way’s competitive advantages.
That said, Bridgeway’s investment strategy isn’t a black box.
During a chat with Bridgeway co- manager Elena Khoziaeva, we
discussed the par tic u lar ways in which the shop’s approach plays
out with Small- Cap Value—and how the team takes a quantita-
tive approach to portfolio construction as well.
Said Khoziaeva: “We have a library of models, each of which
has been historically back- tested. We use as much data as possi-
ble, and we pay a lot of attention to risk. Our pro cess is not just
about the returns; it is about the balance between risk and re-
turn.”
Finally, strategic consistency is practically a mantra at
Bridgeway. Indeed, we once asked Montgomery if he would, for
the sake of strategic diversifi cation, ever consider rolling out a
more qualitative offering to complement his shop’s quantita-
tive lineup. The answer was swift and assured: “A non- quant
fund? No. We said we believe in sticking to the knitting, but the
knitting at Bridgeway isn’t style box: It’s numbers and statis-
tics.”
A Small- Cap Foundation
Of course, even the best of the best funds aren’t bulletproof.
Bridgeway Small- Cap Value didn’t escape the small- cap
meltdown. The fund is down roughly 9% for the 12 months that
ended with April 2008 hit by the small-cap meltdown. Remember
what we said earlier about relative per for mance: To judge a fund
during stylistic downturns as well as upticks, you have to mea sure
its showing against its peers and benchmarks. And—surprise,
surprise—doing so confi rms just what an ace pick this Bridgeway
offering is, with the fund outclassing the Russell 2000 Value index
by more than 6 percentage points and landing in the top 20% of
Morningstar’s small- cap value category over the period.
Add to that per for mance profi le a cheap price tag of just
0.88%, rigorous strategic consistency, and a track record of
outper for mance in one of the market’s most volatile areas, and
you have a winner. Chip in an unwavering commitment to share-
holders and an unemotional investing philosophy and you’ve got
a top- notch fund that exemplifi es the Champion Funds approach,
one that could easily serve as a building block for the small- cap
portion of any portfolio.
CHEAT SHEET
Now that you know what makes for a true champ, you’re ready to
venture out on your own. To guide you, here’s a handy checklist
of our fund screening criteria:
• Managerial Tenure: At least fi ve years
• Five- Year Returns: Higher by 1% or more (on an annual-
ized basis) relative to a relevant benchmark
• Expense Ratio: Preferably 1% or less, though you may
fi nd rare exceptions among younger funds still in
base- building mode
• Load: None
• Alpha: Positive; the higher the number the better
You’ll want to use the other information we’ve outlined in the
previous pages to gauge more qualitative factors such as strate-
238 APPE NDIX A

APPE NDIX A 239
gic consistency and shareholder friendliness. Still, vetting funds
based on the this fi ve- point set of criteria will go a long way to-
ward helping you focus on the very best funds the money man-
agement business has to offer.
Motley Fool Advisor Shannon Zimmerman contributed to
this section. We’re pretty sure Shannon—founding advisor of our
Champion Funds ser vice and current leader of Ready- Made Mil-
lionaire—is the only PhD/music critic/fund geek in the world.

A PPENDIX B : FURTHER R E A DING
All About Asset Allocation, by Richard Ferri
Asset Allocation: Balancing Financial Risk, by Roger Gibson
Beating the Street, by Peter Lynch*
The Black Swan, by Nicholas Taleb
The Book of Investing Wisdom, by Peter Krass
Buffett: The Making of an American Capitalist, by Roger Lowenstein*
Common Stocks and Uncommon Profi ts, by Philip Fisher
The Davis Dynasty, by John Rothchild
Expectations Investing, by Michael Mauboussin and Alfred Rappaport
The 5 Keys to Value Investing, by J. Dennis Jean- Jacques
The Four Pillars of Investing, by William Bernstein
Forbes’ Greatest Investing Stories, by Richard Phalon
The Future for Investors, by Jeremy Siegel*
Global Investing: The Templeton Way, by Norman Berryessa and Eric
Kizner
Good to Great: Why Some Companies Make the Leap . . . and Others
Don’t, by Jim Collins*
The Innovators Dilemma, by Clay Chris tiansen
The Intelligent Investor, by Benjamin Graham
Investing in Small- Cap Stocks, by Christopher Graja and Elizabeth
Ungar
Investment Fables, by Aswath Damodaran
*Must-reads!
242 FURTHE R RE ADING
John Neff on Investing, by John Neff
The Little Book of Value Investing, by Christopher H. Browne
The Little Book that Builds Wealth, by Pat Dorsey
The Money Masters, by John Train
One Up on Wall Street, by Peter Lynch*
The Only Guide to a Winning Investment Strategy You’ll Ever Need, by
Larry Swedroe
Passport to Profi ts, by Mark Mobius
Poor Charlie’s Almanac, by Charlie Munger, edited by Peter Kaufman
A Random Walk Down Wall Street, by Burton G. Malkiel
The Single Best Investment: Creating Wealth with Dividend Growth,
by Lowell Miller
Stocks for the Long Run, by Jeremy Siegel*
Valuegrowth Investing, by Glen Arnold
Value Investing with the Masters, by Kirk Kazanjian
The Vest Pocket Guide to Value Investing, by C. Thomas Howard
You Can Be a Stock Market Genius, by Joel Greenblatt*
*Must-reads!
ACK NOW LEDGMENTS
How many acknowledgments pages have you encountered that begin
with a complaint?
Well, here’s your fi rst, then.
The two of us have always felt that the Academy Awards ceremony
could be so much more engaging. How? By requiring the winners to
shed light on the magic of their fi lm. Pull the curtain back. Tell a story.
Reward us. Say anything other than simply reciting the names of char-
acter actors we’ll never know or meet, along with every makeup artist,
set designer, visual effects coordinator, stunt double, dolly grip, second
assistant accountant, line producer, and shop foreman on the fi lm. (And
then we’re supposed to hold our breath past midnight just to see if they
remember to mention their spouse.)
Please!
Every great show is for the audience, not the performer. (Shouldn’t
Hollywood know this?) Likewise, we believe that every great book
should be for the reader. Of course, then, the most important person
to recognize and thank in the acknowledgements is you, the reader. In
order to thank you for taking a chance on the counsel of Fools, we’re go-
ing to offer some rewards to those of you who actually made it to—and
through—this page.
But fi rst, yes, we are going to mention the names below of the many
all- stars who helped us deliver this book on time, edited, fact- checked,
bound, and stitched for you. They are:
• Our William Morris agent, Suzanne Gluck, for negotiating our
two- book deal. What’s the second book? You’ll just have to wait
and see!

244 ACKN OWLE D G M E NT S
• Collins President and Publisher Steve Ross, for signing up, with
enthusiasm.
• Collins Se nior Editor Ben Loehnen, for truly being the best—and
nicest—book editor we’ve ever encountered.
• Collins publishing gurus Margot Schupf, Hollis Heimbouch,
Angie Lee, Larry Hughes, and Matt Inman, for believing in a
couple of Fools.
• Fool Communications Czar Jonathan Mudd, for rallying us to
this project.
• Fool product guru Robyn Gearey, for living and breathing every
single page.
• Fool Advisors Bill Mann, Andy Cross, Robert Brokamp, Tim
Hanson, and Shannon Zimmerman for their investing genius.
• Fool Analysts Bill Barker, Rich Greifner, Karl Thiel, and
Matthew Argersinger for their thorough work on every chapter.
• Fool Managing Editor Roger Friedman, for giving it all the
once- over—thrice.
• Fool business leaders Kate Ward and Randy Coon, for keeping
us on the rails.
• Fool Publicity Swami Chris Hill, for making sure you’ve heard
of this book.
Now, these Fools put in a lot of hard work on your behalf, so if you
would like to thank them with a gratuity, we will divide anything you
send evenly among everyone above. Send your gifts to:
The Motley Fool
c/o MDP Book Tributes
2000 Duke Street, 4th fl oor
Alexandria, Virginia 22314
And now, what are your rewards?
Here are two.
First—who could have expected this?—we’re going to offer a single
stock recommendation. It’s a company that we expect will qua dru ple in
value by 2019, returning investors a neat 15% per year. Of course there
are no guarantees, but Dolby Laboratories (NYSE : DLB) meets the criteria
of greatness that run throughout this book: great leadership, sterling
fi nancials, strong market positioning, and a tremendous opportunity—

ACKN OWLE D G M E NT S 245
delivering next- generation audio and video technologies to the world of
entertainment.
And for our second reward, we are offering Motley Fool baseball
caps to the fi rst fi ve readers who fi nd a typographic error in this book
(horrors!) and report them to us at MDPBook .com .
Who knew that acknowledgement pages could be so profi table?
Fool on!
David and Tom Gardner

INDEX
Abrams, Leigh, 103–9
accounting methods, of
foreign companies, 168
acquisitions, 48, 49
active stock trading, 14–15,
232–33
Activision, 17–18
Add and Subtract Strategy,
211
ADR (American Depositary
Receipt), 168
Afl ac, 159, 167
AIG, xiv, xviii, xix
All About Asset Allocation
(Ferri), 196, 241
alpha, 227–28
Amazon, 137
America Movil, 161
American Express, 89
American Machinery and
Foundry (AMF), 85
Amgen, 123–24
Anthropologie, 19
Apple, 21, 39, 50
Applegate, Jeffrey, 205
Argentina, 158, 168, 174, 196
Argersinger, Matthew, xiv
assets, 47, 75, 77–78, 82
asset allocation, 183–87, 202
four Foolish rules for, 205–8
patience for, 203–4
three model portfolios,
213–16
Asset Allocation (Gibson),
188, 204, 241
asset bloat, 229–31
assignment, 12 stock, 4–5
asymmetrical competition,
141
AT&T, 49
Australia, 121–22, 162
Azerbaijan, 157
BAE Systems, 150
balance sheet, 77–78
balancing your portfolio,
187–89, 209–13
Bank of America, 20–21, 160
banks, xiv–xvii, 20–21, 65–66,
77, 163
Barker, Bill, 92
Bassoul, Selim, 113
Baupost Group, 11
bear markets, xvii–xviii
Bear Sterns, xiv, xvi
bear traps, dividend, 65–66
248 INDE X
behavioral fi nance, 8
Belair, Scott, 32
Bell curves, 151–52
Belsky, Gary, 8
Bergstresser, Daniel,
186–87
Berkshire Hathaway, xiii,
22–23, 28, 40, 94, 195,
202
Bermuda, 170, 174
Bernstein, William, 70
Best Buy, 58
beta, 227–28
“blend” mutual funds, 213–16
Blockbuster, 147–48
blue- chip bargains (value
investing), 73–92
defi ned, 74–75, 81
80 cents for the dollar, 73,
74–75
growth vs. value, 82–84,
97–99, 126–27
margin of safety, 80
patience in, 87–89
price vs. price, 75–77, 80
sample companies, 83–87
three keys to, 77–79
value trap and, 81–82
in your portfolio, 89–92
Blue Moon Brewing, 19
board of directors, 31–32, 38
dividends and, 48
executive compensation,
34–36
Bogle, Jack, 222
bond funds, 206–7
bonds, 25–26, 206–7, 208
bonuses, 34–36
books about investing, 6, 8,
177
recommended, 217, 241–42
book- to- market ratio, 195
book value, 77–78, 79, 195
bottom line, profi t as, 45–50
Boyer, Herbert, 123
brain, and investing, 7–11
brands, 19–20, 132, 134, 139,
140
Bratti, Ginni, ix–x
Brazil, 157, 158, 162
Bridgeway Small Cap Value,
234–38
Brin, Sergey, 31
Brokamp, Robert, 216
bubbles, xix–xx. See also
dot-com bubble
budgets (budgeting), xix
Buffalo Wild Wings, 54,
101–2, 114–15
Buffett, Warren
asset allocation plans and,
202
fi nancial collapse of 2008
and, xiii
holding stock and, 8–9, 11,
14–15, 88–89
investing brain and, 8–9
margin of safety, 75, 80
picking stocks, 21–23, 26,
28, 32, 36, 39–40, 42, 43
small- cap investing, 94, 98,
100
“too hard” pile, 21, 39
value investing, 76, 79–82,
88–89
business model, 39–40
dividend investing and,
59–60, 63
small- cap investing and,
104–5
business momentum, 132–33,
139
BusinessWeek, 184
buy backs, 48–49
“buy what you know,” 16–20,
58
INDE X 249
“called strikes” in investing,
32
Campbell Soup, 49
Canada, 158, 162, 174
capital gains, 15, 59, 62–63
capitalization (cap) rate,
108–9, 193–94
CAPS, 177–82, 216
best uses for, 181–82
how it works, 179–81
ratings, 178–80
cash earnings, 23–24
dividend investing and,
53–55
growth stock investing and,
126, 129
small- cap investing and,
108–9
value investing and, 78–79,
87
cash fl ow, 107, 126
cash on hand, 75–78
small- cap investing and,
105–6
CDs (certifi cates of deposit),
206
Cemex, 164–66, 167, 174
CEOs (chief executive offi-
cers), 30–32
compensation, 34–36, 54
relative intelligence of,
37–39
tenure and track rec ords of,
37
Chalmers, John, 186–87
Champion Funds, 222–23,
226, 232
Charles Schwab, 15–16, 225
Chavez, Hugo, 167
cheap money, and fi nancial
crisis of 2008, xv
Chevron, 50
Chile, 158, 169, 174
China, 154, 156, 158, 160, 162,
168, 170, 174
Chokkavelu, Anand, xiii
Cisco Systems, 50, 98
Citigroup, xviii
Citizens Communications,
66
Coach, ix
Coca- Cola, 19, 86, 89, 167
dividends, 49
earnings growth rate, 24
insider own ership stake, 34
interest coverage ratio, 27
long- term debt, 26
pre- tax earnings, 23
return on equity, 25
Web site, 20
Cohen, Abby, 205
Cohen, Stanley, 123
Colgate- Palmolive, 89–91
Columbia University, 74–75,
77, 80–81
commodities, 184–85, 188,
197–98
company found ers, 30–32
own ership stake, 32–34
company size, 60, 65, 193–94
compensation, 34–36
competitive advantage
dividend investing and, 60,
63–64
growth stock investing and,
131–32, 139
complexity fatigue, 232
compound annual return,
188–89
conference calls, 31–32, 38, 133
confi rmation bias, 42
ConocoPhillips, 50, 167
consensus sentiment, 11
conservatism bias, 136
consumer appeal, 134, 140
Cook, James, 121–22

250 INDE X
core values, 30–32
corporate bonds, 206–7
correlation, 189
cost basis, 212
Costco, 58, 102
country risk, 171
Cramer, Jim, 140
creative disruption and
growth stock investing,
122–25
credit crisis, 20–21, 35, 65–66,
77, 163
credit crisis of 2008, xiii–xx
Credit Suisse, 52
Cross, Andy, 72
currency concerns, 163–64
currency risk, 171
current assets, 47, 75, 77–78,
82
current share price, 51
Customer Insights, ix–x
Czech Republic, 158
Daedalus, 142–43
Dahlberg, Kenneth, 114
Dart Truck, 62, 63–64
Davidson, Arthur, 85
Dawson Geophysical, 119
debt, 25–27
small- cap investing and,
105–6
debt- to- equity ratio, xix, 26
default and pricing volatility,
110–12
Dell, 19
Diageo, 68–69, 174
discounting, 135–37
diversifi cation
asset allocation vs., 183–84
correlation, 189
dividend stocks, 66, 70–71
foreign stocks, 155–56, 161,
172–75
by industry, 197–98
patience for, 203–4
dividend baggers, 58–59
dividend bear traps, 65–66
dividend investing, 44–72
building your dynasty,
71–72
cash earnings, 53–55
defi ned, 45
diversifi cation and, 66,
70–71
dividend yield and, 51
in foreign companies, 168
lower volatility and, 57–58,
70–71
multibaggers, 58–59
payout ratio and, 51–52, 59,
62
pitfalls to, 65–67
profi t as bottom line in,
45–50
reinvesting dividends, 52–53
sample companies, 61–65,
67–70
secrets of our strategy,
59–65
smaller companies, 56–57
on the S&P 500, 49–50,
55–57
dividend overloading, 66
dividend yield, 51, 66
Dodge & Cox Income Fund,
207
Doerr, John, 31
dollars, U.S., 163–64
domestic vs international
stocks, 159–60, 167–69,
172, 195–97
dot- com bubble, xv, 195, 197
Drew Industries, 103–10, 129
drifters, 231
Duckwall- ALCO, 101
Durell, Philip, 89–90
INDE X 251
EAFE Index, 162–63, 175–76,
191–93, 196
Early, James, 67–68
earnings growth, 23–24,
129
dividend investing and,
53–55
small- cap investing and,
108–9
value investing and, 78–79,
87
Eaton Vance, 52–53, 54
eBay, 145–46
educational background of
management, 38–39
Eli Lilly, 124
emerging industry, fi rst
mover in, 122–24,
130–31, 138–39
emerging markets, 74, 163,
167, 169, 172, 214–15
emotional response to invest-
ing, 9–10, 12
Endeavour, 121–22
Entercom, 69–70
ETFs (exchange- traded
funds), 175–76
Eu ro pe an Union, 169
Every Portfolio Is an Island
Strategy, 211
excess leverage, and fi nancial
crisis of 2008, xv–xvi,
xix
executives. See CEOs; man-
agement
executive compensation,
34–36, 54
expense ratio, 223, 225–26,
229, 234
ExxonMobil, 50, 167
Fama, Eugene, 74, 195
Fannie Mae, xiv, 25
Fatal Shore, The (Hughes),
121–22
Federal Reserve, 163
fees, mutual fund, 212, 219,
221, 223, 225–26
FEMA (Federal Emergency
Management Agency),
106–7, 129
Ferri, Richard, 196, 241
Fidelity International Discov-
ery Fund, 200, 201
Fidelity Magellan Fund,
16–17, 223
fi nancial collapse of 2008,
xiii–xx, 20–21, 65–66,
77, 163
fi nancial media, company
overvaluation by, 135,
140–41
fi nancials, xiv–xvii, 20–21,
65–66, 77, 163
fi rst- mover businesses,
122–24, 130–31, 138–39
fi rst stock, 14–43
fi nding, 16–21
goal of, 16–17
learning from, 42–43
screening criteria for,
21–42
business model, 39–40
debt, 25–27
earnings growth, 23–24
management, 27–39
pre- tax earnings, 22–23
return on equity, 24–25
what can go wrong, 40–42
Fool.com, 177, 178
Foolish investing, 10–12,
46–47
Force Protection, 149–51
foreign investing. See inter-
national investing
Form 4, 33

252 INDE X
found ers, 30–32
own ership stake, 32–34
401k accounts, 71, 211, 212,
219
frame of reference risk, 204
France, 162, 173, 174
Frankfort, Lew, ix
Freddie Mac, xiv
French, Kenneth, 74, 95, 98,
195
frictional costs, 8, 15, 230
Future for Investors (Siegel),
166–67, 172–73, 176, 241
future predictions, 204–5
Galvin, Thomas, 205
GDP (gross domestic prod-
uct), 157–58
GEICO, 89
Genentech, 123–24
General Electric, 11, 49, 100,
110
Genuine Parts, 56–57
Gerstner, Lou, 83–84
Gibson, Roger, 188, 191, 204,
241
Global Gains, 67, 159, 161, 167,
173
global investing. See interna-
tional investing
Goldman Sachs Commodity
Index, 184, 197–98
Google, 39, 40–41
board of directors, 31
business model, 39–40
dividends, 50
earnings growth rate, 24
insider own ership stake, 34
interest coverage ratio, 27
long- term debt, 26
pre- tax earnings, 23
price- to- earnings, 40–41
return equation, 48–49
return on equity, 25
Web site, 20
Graham, Benjamin, 49, 74–76,
80–81, 241
greed, 2, 46
role in fi nancial crisis of
2008, xvi–xvii
Greenberg, Herb, 140
Greenblatt, Joel, 78, 242
Greenspan, Alan, xv, 232
Greenwald, Bruce, 77–79
Greifner, Rich, 120
growth rate, 23–24, 78–79,
108–9
growth stock investing,
121–52
creative disruption and,
122–25
discounting and, 135–37
Rule Followers and, 141–42
sample companies, 136–41,
143–48
saturation point and, 142–48
screening criteria for,
130–35
competitive advantage,
131–32, 139
consumer appeal, 134, 140
fi rst mover in emerging
industry, 122–24,
130–31, 138–39
management and back-
ing, 133–34, 139–40
overvaluation in fi nancial
media, 135, 140–41
price appreciation,
132–33, 139
sustainable advantage,
131–32, 139
small- cap investing and,
97–99, 108
as stock- picker’s game,
127–28
INDE X 253
two catches to, 128–29
value vs. growth, 79, 82–84,
97–99, 126–27
in your portfolio, 142,
151–52
growth vs. value, 79, 82–84,
97–99, 126–27, 195
Hanes, 17
Hanson, Tim, 7–8, 43
Harley, William, 85
Harley- Davidson, 84–87
Hartzell, Buck, 7–8
Hastings, Reed, 37
Hayne, Richard, 32
HDFC Bank, 160, 174
Heinz, 58
Hewlett Packard, 50
Hidden Gems, xi, 54, 94, 96,
99, 120, 127
“hip” brands, 19–20
holding periods, 10, 208
holding stocks, 8–9, 10, 14–16
Home Depot, 20, 23, 24, 35,
58, 101
home equity bias, 166–67
Hong Kong, 156, 158, 174
hot investments, 97, 186–87
Hughes, Robert, 121–22
Hurricane Katrina, 106–7, 129
hyperactive trading, 14–15,
232–33
IBM, 50, 83–84
incentive plans, executive,
35–36
Income Investor, xi, 67, 68
income statements, 46–47
index funds, 202, 213–16,
225–26
India, 154, 157, 158, 168, 174
individual stock investing,
14–43
fi nding, 16–21
screening criteria for,
21–42
business model, 39–40
debt, 25–27
earnings growth,
23–24
management, 27–39
pre- tax earnings, 22–23
return on equity, 24–25
what can go wrong, 40–42
Indonesia, 158
industry diversifi cation,
197–98
Inefficient Pond Theory,
100–101
Infosys, 159, 174
insiders own ership stake,
32–34
insider trading, 33
Inside Value, 73, 87–91
Intel, 50
intelligence of management,
37–39
interest coverage ratio,
26–27
interest rates, 163
role in fi nancial crisis of
2008, xv
international investing,
153–76
the 0%/100% Rule, 161,
172–73
40% allocation, 172–73
currency concerns for,
163–64
diversifi cation and, 155–56,
161, 172–75
domestic stocks vs, 159–60,
167–69, 172, 195–97
ETFs, 175–76
fi ve- year annualized
returns, 162–63
254 INDE X
international investing,
(continued)
home equity bias and,
166–67
how to approach, 171–72
real GDP growth rate,
158
sample companies,
164–66
setting up foreign stock
brokerage account,
169–71
top 20 stock exchanges,
156–57
in your portfolio, 172–75
intrinsic value, 75, 76, 79, 80,
81
Intuitive Surgical, 136–41
investing books, 6, 8, 177
recommended, 217,
241–42
investing brain, 7–11
investing temperament, 7–9,
12, 76–77
investment fads, 97, 186–87
IPG Photonics, 146–47
Iraq War, 149–50
Israel, 158, 161, 170, 174
Japan, 95, 156, 162, 174, 175,
196
Johnson, Paul, 98
Johnson & Johnson, 49
Jones Apparel, 55
Jordan, Michael, 3
JPMorgan Chase, 49
Kahneman, Daniel, 9–10
Khoziaeva, Elena, 237
Klarman, Seth, 11–12
Koski, Robert, 115–16
Kovaleski, David, 127–28
Kozlowski, Dennis, 28
Kozmo.com, 131
Kraft Foods, 58
Krispy Kreme, 20, 23
large- caps, 185–86, 188,
193–94
small- caps vs., 93–94, 110,
112, 119
value stocks, 74–75
Large Caps in Every Pot
Strategy, 211–12
leadership. See management
legacy of leadership, 30–32
Lehman Brothers, xiv, xvi,
xix
letter to shareholders, 38
leverage, and fi nancial crisis
of 2008, xv–xvi, xix
Levinson, Arthur, 31
liabilities, 77–78
liquidity, 99–102
Liu, Crocker, 28
long- view of investing, 8–9,
10, 14–16, 76–77, 87–89,
203–4
Lynch, Carolyn, 17
Lynch, Peter, 6, 110–11, 202
“buy what you know,”
16–17, 58
PEG Ratio, 108–9
McDonald’s, 167
dividends and, 54–55
earnings growth rate, 24
insider own ership stake,
34
interest coverage ratio, 27
long- term debt, 26
pre- tax earnings, 23
return on equity, 25
McGuigan, Thomas, 202
Mackey, John, 29–30, 32–33
McLaughlin, Bill, 117
INDE X 255
Macy’s, 58
Mad Money (TV show), 140
management, 27–39. See also
board of directors;
CEOs
dividends and, 60, 64–65
executive compensation,
34–36
found er and core values,
30–32
growth stock investing and,
133–34, 139–40
of mutual funds, 223–24,
231–32
own ership stake of, 32–34
relative intelligence of,
37–39
small- cap investing and,
106–7
tenure and track rec ords of,
37
Mann, Bill, xi, 120, 154, 155,
176
margin of safety, 75, 80
market capitalization, 108–9,
193–94
market- timing, 220–21
Merck, 56, 124
Merrill Lynch, 35
Mexico, 162, 164–66, 174
Microsoft, 50, 96, 131,
144–45
Middleby, 112–14
Miles, Frank, xii
Moll, Fred, 139–40
Molson Coors, 19, 20, 23, 24,
25
money market funds, 205
monopolies, 144–45
Montgomery, John, 234–38
Morgan Stanley, 33, 191, 196
Morningstar, 178, 194, 195,
238
mortgage crisis, 20–21, 35,
65–66, 77, 163
mortgage crisis of 2008,
xiv–xvii
Mother Ship Strategy, 211
Motley Fool Investment Guide (Gardner and
Gardner), 153
Motley Fool Pro, xviii, 179
Motley Fool Web site, 6
MSCI EAFE Index, 162–63,
175–76, 191–93, 196
Muhlenkamp, Ron, 11, 22
multibaggers, 58–59
Munger, Charlie, 202
mutual funds, 213–16,
219–39
expenses, 225–26, 229, 234
managerial tenure of,
223–24, 231–32
risk- reward profi le and,
226–28
screening criteria for,
222–32, 238–39
selling your, 233–34
shareholder- friendly
culture and, 229–32
style- neutral outper for-
mance and, 224–25
Nardelli, Bob, 35
Nasdaq, 139, 156, 207
Ned Davis Research, 53
Netfl ix, xviii, 37, 131, 147–48
Newton’s First Law of Mo-
tion, 132–33
New York Stock Exchange,
156, 170
Nike, 58
Nokia, 159, 170, 174
no- load funds, 212, 219,
225–26
Norfolk Southern, 49
256 INDE X
Odean, Terrance, 10
O’Neal, Stan, 35
One Up on Wall Street (Lynch), 17, 242
operating costs, 46–47
Otellini, Paul, 31
“Out of sight, out of mind,” 14
overconcentration, 66–67
overloading, dividend, 66
overseas markets. See inter-
national investing
over- the- counter exchanges,
170–71
overvaluation in fi nancial
media, 135, 140–41
own ership stake, 32–34
Paccar, 61–65
Page, Larry, 31
patents, 131–32, 139
patience in investing, 8–9,
14–16, 87–89, 203–4
payout ratio, 51–51, 59, 62, 66
PEG Ratio, 108–9
Pep Boys, 6
PepsiCo, 58, 59
P/E (price- to- earnings) ratio,
40–41, 81, 108–9
Peterbilt Motors, 62, 63–64
Petrobras, 67–68
Pfi zer, 49
Philip Morris, 49
Pigott, James, 64
Pigott, Mark, 64–65
Pigott, William, 61–62, 64
Pink Sheets, 170–71
Poland, 158
po liti cal risk, in international
investing, 171
portfolios
balancing your, 187–89,
209–13
building the perfect, 205–8
dividend investing in, 70–72
four hypothetical, 190–93
glass is always half some-
thing, 203
growth stock investing in,
142, 151–52
small- cap investing in,
109–12, 118–19
value investing in, 89–92
present cash earnings, 23–24
dividend investing and,
53–55
growth stock investing and,
126, 129
small- cap investing and,
108–9
value investing and, 78–79,
87
present value, and discount-
ing, 135–37
pre- tax earnings, minimum
of $75 million in,
22–23
price appreciation, 132–33,
139
price- to- book value, 78, 82, 90
price- to- earnings (P/E) ratio,
40–41, 81, 108–9
price vs. value, 75–77, 80
pricing volatility, and
small- cap investing,
110–12, 235–36
Procter & Gamble, 45, 50, 58,
124
product demand, 104, 134, 140
profi t as bottom line, 45–50
proxy statement, 35–36
Pure Software, 37
Rachor, Jeff, 6
Rational Software, 37
Ready- Made Millionaire,
221–22
INDE X 257
realistic expectations, 3,
12–13
rebalancing your portfolio,
187–89, 209–13
reinvested dividends, 52–53,
59
reinvested earnings, 48–49
REITs (real estate investment
trusts), 184–85, 188,
197–98
relative intelligence of man-
agement, 37–39
research and development
(R&D), 48–49, 64
Research In Motion, 19
return equation, 45, 48–49
return on equity, 24–25, 107
Richards, Brian, 176
risk, 111, 188–89. See also
volatility
in mutual funds, 226–28
risk takers. See growth stock
investing
Robertson Stephens, 98
roller coasters, 57–58
Roth IRA, 71, 211, 212
R-squared, 228
Rule Breakers, 121–52
discounting and, 135–37
sample companies, 136–41,
143–48
screening criteria for,
130–35
competitive advantage,
131–32, 139
consumer appeal, 134, 140
fi rst mover in emerging
industry, 122–24,
130–31, 138–39
management and back-
ing, 133–33, 139–40
overvaluation in fi nancial
media, 135, 140–41
price appreciation,
132–33, 139
sustainable advantage,
131–32, 139
two catches to, 128–29
Rule Breakers (newsletter),
xi, 125
Rule Breakers, Rule Makers
(Gardner and Gardner),
137
Rule Followers, 141–42
Russell 1000, 82–84, 127–28
“safe” assets, 206–7
SAI (Statement of Additional
Information), 232
salaries, 34–36
S&P 500, xiii, xvii, 187,
191–93, 207, 220
dividend investing, 49–53,
55–57
index fund, 199–201, 202,
225–26
saturation point and growth
stock investing, 142–48
savings accounts, 205
Schering- Plough, 124
Schloss, Walter, 110–11
Schlumberger, 50
Schmidt, Eric, 39
Scott, Lee, 32
SEC (Securities and Ex-
change Commission),
33, 232
second opinions, 181–82
Security Analysis (Graham),
49
SEI Investments, 127–28
Select Comfort, 116–18
self- discipline in investing,
12, 88–89
Sellers, Mark, 38

258 INDE X
se nior management. See
management
Senk, Glen, 32
Shanghai, 154, 156, 170
Sharpe, William, 189
Sharpe Ratio, 189
Sherman Antitrust Act of
1890, 144
Sherwin- Williams, 60
short- term compensation, 36,
46, 54
Siegel, Jeremy, 166–67,
172–73, 176, 208, 241
Singapore, 158
size of company, 60, 65,
193–94
Skrainka, Alan, 205
sleeping point, 70–71
small- cap investing, 93–120
business model and, 104–5
debt and, 105–6
growth vs. value, 97–99,
127–28
large- caps vs., 93–94, 110,
112, 119
leadership team and, 106–7
liquidity and trading
volume, 99–102
market cap and, 193–94
pricing volatility and,
110–12, 235–36
rate of return and, 107
reasonable price and, 108–9
sample companies, 101–9,
112–18
in your portfolio, 109–12,
118–19
Smith, Sally, 114–15
South Africa, 162, 174
South Korea, 157, 158, 162,
174
Spain, 157, 158, 162
speculation, xiv
SPDRs (Standard & Poor’s
Depositary Receipts),
175–76, 227
standard deviation, 227
Stanford Research Institute,
138
Staples, 58
Starbucks, 111–12, 131, 134,
143–44
Stock Advisor, xi, 61, 148
stock appreciation, 45, 48–49
stock liquidity, 99–102
stock options, and executive
compensation, 34–36
stock valuation, 74–75
stock volatility. See volatility
subprime mortgage default
crisis, xiv–xvii, 20–21,
35, 65–66, 77, 163
Sun Hydraulics, 115–16
survivorship bias, 221
sustainable advantage,
131–32, 139
Sweden, 158, 174
Taiwan, 157, 158
Taleb, Nassim, 8, 241
Target, 133
taxes, 15–16
dividend investing and, 67,
71
international investing and,
168
rebalancing your portfolio
and, 212, 213
temperament, 7–9, 12, 76–77
tenures, executive, 37
Teva Pharmaceuticals, 161,
174
TheStreet.com, 140
Thiel, Karl, 152
Thomson, 33
Tillinghast, Joel, 111
INDE X 259
Tim Hortons, 164
“too hard” pile, 21, 39
track rec ords, 37
trading costs, 15–16
trading volume, 99–102
Trea sury notes and bills, 163,
206
Triumph of the Optimists
(Dimson, Marsh and
Staunton), 52
Tufano, Peter, 186–87
Tukey, John, 130
Tversky, Amos, 9–10
12b- 1 fees, 221, 223
Twain, Mark, xiii
Twinem, Mary, 114
U-Haul, 105–6
United Arab Emirates, 158
Urban Outfi tters, 19, 32
earnings growth rate, 24
insider own ership stake, 34
interest coverage ratio, 27
long- term debt, 26
pre- tax earnings, 23
return on equity, 25
Web site, 20
value investing, 73–92
defi ned, 74–75, 81
80 cents for the dollar, 73,
74–75
growth vs. value, 82–84,
97–99, 126–27
margin of safety, 80
patience in, 87–89
price vs. price, 75–77, 80
sample companies, 83–87
three keys to, 77–79
value trap and, 81–82
in your portfolio, 89–92
Value Investing (Greenwald),
77–79
value trap, 81–82
value vs. growth, 79, 82–84,
97–99, 126–27, 195
value vs. price, 75–77, 80
Vanguard 500 Index Fund,
199–201, 202, 225–26
Vanguard Short- Term Bond
Index Fund, 207
Venezuela, 167
Vietnam, 158, 159
Vitamin Water, 19
volatility
diversifi cation and, 189
dividend investing and,
57–58, 70–71
fi nancial collapse and, xix
four hypothetical portfolios
and, 190–93
growth stock investing and,
142
small- cap investing and,
110–12, 235–36
Waddell & w Science & Tech
Fund, 200, 201
Wall Street Journal, 135, 140,
162–63
Wal- Mart, 40–41, 112
business model, 39–40
dividends, 50
earnings growth rate, 24
insider own ership stake,
34
interest coverage ratio, 27
long- term debt, 26
management and found er,
30–31, 32
pre- tax earnings, 23
price- to- earnings, 41
return on equity, 25
Web site, 20
Walton, Sam, 30–31
Washington Mutual, xiv
260 INDE X
Washington Post Company,
89
Whole Foods, 29–30, 131
earnings growth rate, 24
insider own ership, 32–33
insider own ership stake,
34
interest coverage ratio,
27
long- term debt, 26
pre- tax earnings, 23
return on equity, 25
Web site, 20
XM Satellite Radio, 31
Yermack, David, 28
You Can Be a Stock Market Genius (Greenblatt), 78,
242
Your Money & Your Brain
(Zweig), 8, 9–10
Zambrano, Lorenzo, 165–66
Zimmerman, Shannon, 239
Zinn, Fredric, 103–9
Zweig, Jason, 8, 9–10

Brothers DAVID GARDNER & TOM GARDNER co-founded The Motley Fool, a multimedia invest-ment advisory company dedicated to building the world’s greatest investment community, in 1993. They have co-authored four New York Times bestsellers, including The Motley Fool Investment Guide, The Motley Fool You Have More Than You Think, and The Motley Fool’s Rule Breakers, Rule Makers. Tireless advocates for the individual investor, the Gardners also oversee the award-winning personal finance and investment Web site Fool.com (attracting millions of visitors each month); a nationally syndicated newspaper column, carried by more than two hundred newspapers; and a broad suite of highly-regarded investment newsletter services.
www.fool.com
About the Autho
Visit www.AuthorTracker.com for exclusive
on your favorite HarperCollins author. information
rs
AL SO BY DAVID GARD NE R AND TOM GARD NE R
Nonf iction
The Motley Fool You Have More Than You Think
The Motley Fool Investment Guide
The Motley Fool Investment Guide for Teens
The Motley Fool Investment Workbook
The Motley Fool Personal Finance Workshop
The Motley Fool’s Money After 40
The Motley Fool’s Rule Breakers, Rule Makers
The Motley Fool’s What to Do with Your Money Now

Credits
Jacket design by The Designworks Group

Copyright
THE MOTLEY FOOL MILLION DOLLAR PORTFOLIO. Copyright © 2009 by The
Motley Fool, Inc. All rights reserved under International and Pan-American
Copyright Conventions. By payment of the required fees, you have been
granted the non-exclusive, nontransferable right to access and read the text of
this e-book on-screen. No part of this text may be reproduced, transmitted,
down-loaded, decompiled, reverse engineered, or stored in or introduced into
any information storage and retrieval system, in any form or by any means,
whether electronic or mechanical, now known or hereinafter invented,
without the express written permission of HarperCollins e-books.
Adobe Acrobat eBook Reader December 2008
ISBN 978-0-06-174238-5
10 9 8 7 6 5 4 3 2 1
Australia
Pymble, NSW 2073, Australia
Canada HarperCollins Publishers Ltd.
New Zealand HarperCollinsPublishers (New Zealand) Limited
Auckland, New Zealand
United Kingdom HarperCollins Publishers Ltd. 77-85 Fulham Palace Road London, W6 8JB, UK
United States HarperCollins Publishers Inc. 10 East 53rd Street
http://www.harpercollins.co.nz
http://www.harpercollinsebooks.co.uk
About the Publisher
HarperCollins Publishers (Australia) Pty. Ltd. 25 Ryde Road (PO Box 321)
http://www.harpercollinsebooks.com.au
55 Avenue Road, Suite 2900 Toronto, ON, M5R, 3L2, Canada http://www.harpercollinsebooks.ca
P.O. Box 1
New York, NY 10022 http://www.harpercollinsebooks.com