the mortality of miners and ex-miners in the rhondda fach
TRANSCRIPT

BMJ
The Mortality of Miners and Ex-Miners in the Rhondda FachAuthor(s): A. L. Cochrane, R. G. Carpenter, F. Moore and J. ThomasSource: British Journal of Industrial Medicine, Vol. 21, No. 1 (Jan., 1964), pp. 38-45Published by: BMJStable URL: http://www.jstor.org/stable/27721905 .
Accessed: 25/06/2014 08:03
Your use of the JSTOR archive indicates your acceptance of the Terms & Conditions of Use, available at .http://www.jstor.org/page/info/about/policies/terms.jsp
.JSTOR is a not-for-profit service that helps scholars, researchers, and students discover, use, and build upon a wide range ofcontent in a trusted digital archive. We use information technology and tools to increase productivity and facilitate new formsof scholarship. For more information about JSTOR, please contact [email protected].
.
BMJ is collaborating with JSTOR to digitize, preserve and extend access to British Journal of IndustrialMedicine.
http://www.jstor.org
This content downloaded from 194.29.185.145 on Wed, 25 Jun 2014 08:03:41 AMAll use subject to JSTOR Terms and Conditions
Brit. J. industr. Med., 1964, 21, 38.
THE MORTALITY OF MINERS AND EX-MINERS IN THE RHONDDA FACH
BY A. L. COCHRANE, R. G. CARPENTER, F. MOORE, and J. THOMAS
(RECEIVED FOR PUBLICATION MAY 2, 1963)
From the Department of Tuberculosis and Chest Diseases, Welsh National School of Medicine, Sully Hospital, near
Penarth, the Medical Research Council's Epidemiol?gica! Research Unit, Cardiff, the Department of Human Ecology'?
Cambridge, and the Medical Research Council's Pneumoconiosis Research Unit,Llandough Hospital, near Penarth, Glam.
A six-year follow-up of 6,474 miners and ex-miners, originally radiographed in 1950-51, has been
completed. They represent 97 % of all those who were then resident in the Rhondda Fach. In
addition, 2,750 non-miners living in the same area were also studied. Death certificates were
obtained for all those who had died, including those who had left the area. Standardized mortality ratios (S.M.R.s) have been calculated for the various age and x-ray category groups.
The results suggest that (1) progressive massive fibrosis (P.M.F.) is a more serious disease than
a previous study suggested; (2) the S.M.R. of miners and ex-miners without P.M.F. is also sig
nificantly raised ; (3) there is no sign of any relation between the x-ray category of simple pneumo coniosis and the S.M.R. ; and (4) the S.M.R. of ex-miners is significantly higher than that of miners.
In a previous paper (Carpenter, Cochrane, Clarke, Jonathan and Moore, 1956) an attempt was made to
see whether the international radiographie classifica
tion of the pneumoconioses could be validated
predictively by reference to mortality rates of coal
miners. On that occasion the results of a two-and-a
half-year follow-up were reported ; the present paper concerns a six-year follow-up of the original
population.
Material
The material consists of (1) the male population in
the Rhondda Fach defined by nominal census during the winter 1950-51 ; (2) their ages at that time; (3) the
x-ray category of coal-workers' pneumoconiosis (International Labour Organisation, 1953) of those
miners and ex-miners who were radiographed at that
time; (4) information as to who was alive and who was dead on December 1, 1956, including those who had left the area ; and (5) copies of the death certifi cates of all those who had died. The coding of the death certificates was carried out by the Registrar General's Department.
The word 4 miner
' in this paper refers to a man
who was working as a coal-miner at the time of the
survey in 1950-51 ; '
ex-miner '
refers to a man who was not working as a coal-miner at that time, but who had previously worked as a coal-miner for at
least one year ; a ' non-miner
' refers to a man not
working as a coal-miner at the time of the survey and
who had in the past worked less than one year as a
miner. The material is summarized in Table 1.
The material differs from the previous material not
only in the longer follow-up, but also in the fact that
those who were not radiographed in 1950-51 have
been divided into non-miners, on the one hand, and
miners and ex-miners on the other. We also made a
small retrospective reduction in the numbers of
miners and ex-miners who had previously refused to
be radiographed. In the previous paper we pointed out the high S.M.R. of those who were not radio
graphed and discussed how it might have influenced the results. To minimize this possible error we made
a search for films taken by other agencies of those
who had previously refused to be radiographed by us.
We also relaxed our standards about the date on
which the radiographs had been taken, accepting some films which had been taken a considerable
time after the survey. This was, we thought, justified
by the fact that the majority were radiographs of ex
miners in which progression of simple pneumoconio sis was unlikely to have occurred. In the case of
massive fibrosis, the use of these later films may lead
to an over-estimate of the category of P.M.F. at the
time of the initial survey. However, as the subjects were mostly in the higher age groups, the error
should be small because the rate of progression of
38
This content downloaded from 194.29.185.145 on Wed, 25 Jun 2014 08:03:41 AMAll use subject to JSTOR Terms and Conditions
THE MORTALITY OF MINERS AND EX-MINERS IN THE RHONDDA FACH 39
Table 1
population of non-miners, miners, and ex-miners in 1950-51
Non-miners Miners and Ex-miners
Age Group Total
No. Lapses
Total Radiographed
No. %
Total No. Lapses
Total Radiographed
No.
15 - 20 - 25 - 35 - 45 - 55 - 65 - 75 - 85 +
All ages
20 64
606 493 737 447 223 148 64 27
5
2750
2048
25 - 74
19 14 33 29 24 17 12 6 2
117
115
587 479 704 418 199 131 52 21
3
2594
1931
1504
96-9 97-2 95-5 93-5 89-2 88-5 81-3 77-8 60-0
94-3
94-3
92-9
289 324
1146 1346 1337 1173 765 275
20
6675
5326
5767
14 13 32 58 66
9
68
289 323
1138 1332 1324 1141 707 209
11
6474
5642
1000 99-7 99-3 990 990 97-3 92-4 760 550
970
97-8
P.M.F. decreases with increasing age (Cochrane,
Carpenter, Clarke, Jonathan and Moore, 1956;
Cochrane, Moore and Thomas, 1961a). A few
corrections were also made to the ages, after com
paring the statement on the death certificate with our
previous estimate. Similarly, a few radiographs were
reclassified when we found radiographs of better
technique, or of a date closer to that of the survey in
1950-51. For example, in the age group 20-64 with
radiographs showing category 0 the number of
deaths fell from 72 to 63. This was due to four deaths
being transferred to higher age groups and eight being transferred to higher x-ray categories. At the same
time three deaths were transferred to this age group
from those who had previously been '
lapses '.
The net result of these changes is to increase the
number of radiographed miners and ex-miners from
6,128 to 6,474, thereby reducing the refusal rate from
5% to 3%. It will also be noted from Table 1 that the percentage radiographed in the 20-64 age group,
with which we are chiefly concerned, was 98-7%.
Method of Analysis
The method we have used for the analysis of this
material is that of the standardized mortality ratio
(S.M.R.), i.e. 100 times the ratio of the number
observed to the number of expected deaths in any
group. The method of calculating the expected number of deaths from the death rates of England and Wales is not the same as that previously des
cribed by one of us (R.G.C.) (Carpenter et ai, 1956).
Had the previous method of estimating the expected
number of deaths been used for the longer follow-up
period, the S.M.R.s would for the most part have
been appreciably nearer 100 than the ones shown.
The method used in this paper is such as to give an
S.M.R. as comparable as possible with the definition
5
used in the Registrar General's tables of Occupa
tional Mortality (1958), although our S.M.R.s are
based on a follow-up study. The formulae required for calculating the S.M.R. and its standard error are
given in the first section of the appendix, and a full
discussion of the problem will be published elsewhere.
Results
General.?Table 2 summarizes the S.M.R.s for the
two age groups (20 to 64 and 25 to 74) at the time of the first survey. The first point that will be noted in
Table 2 is that the S.M.R. of non-miners is close to
100. This is reassuring as it implies that the effects of
mining on mortality may be reasonably assessed by
comparing the observed and expected numbers of
deaths. Other points of interest in Table 2 are: (1) the close similarity between the S.M.R.s for
' all
miners and ex-miners '
(1490) and '
all radiographed
miners and ex-miners '
(145-5) in spite of the high
S.M.R. of those not radiographed. This suggests
that the lapse rate for the original x-ray survey is no
longer a source of error as far as the whole group is
concerned. It could, of course, still be a source of
error in some of the x-ray category sub-groups ; (2)
the high S.M.R. for those with P.M.F. (198-9); (3)
the raised S.M.R. for those without P.M.F. (1321);
and (4) the similarity between the S.M.R. of those
with category 0 (1340) and those with simple pneumoconiosis (128-8).
Comparison with Previous Data.?Table 3 has been
constructed to be comparable with Table 5 of our
previous paper (Carpenter et al., 1956). In that
table categories 1, 2, and 3 simple pneumoconiosis were grouped with category A, so the same group
ing has been used here. Table 3 suggests that when
the few x-ray films were re-classified and the ages
This content downloaded from 194.29.185.145 on Wed, 25 Jun 2014 08:03:41 AMAll use subject to JSTOR Terms and Conditions

40 BRITISH JOURNAL OF INDUSTRIAL MEDICINE
Table 2
standardized mortality ratios for males in the rhondda fach 1950/51-1956
Group 1950-51 No. in Group Observed Deaths S.M.R. S.E.
Ages 20 to 64 All non-miners All miners and ex-miners
Miners and ex-miners radiographed Miners and ex-miners not radiographed
Pneumoconiosis categories 0, 1,2, and 3 Pneumoconiosis category 0 Pneumoconiosis categories 1, 2, and 3 Pneumoconiosis categories A, B, and C
Ages 25 to 74 All non-miners All miners and ex-miners
Miners and ex-miners radiographed Miners and ex-miners not radiographed
Pneumoconiosis categories 0, 1,2, and 3 Pneumoconiosis category 0 Pneumoconiosis categories 1,2, and 3 Pneumoconiosis categories A, B, and C
2048 5326
5258 68
4456 2909 1547 802
1619 5767
5642 125
4654 2960 1694 988
62 456
438 18
318 207 111 120
88 787
725 62
517 331 186
208
106-2 1490
145-5 361-8
132-1 1340 128-8 198-9
114-9 143-4
136-4 357-3
1261 126-9 124-9 170-8
? 13-48 ? 6-99
? 6-95 ? 94-38
? 7-41 ? 9-28 ? 12-26 ? 1818
? 12-02 ? 511
? 506 ? 48-32
? 5-55 ? 6-96 ? 9-22 ? 11-76
Table 3
COMPARISON WITH PREVIOUS DATA
Period of
Follow-up
1950/51-53 1950/51-53 1950/51-53 1950/51-56
Old Revised Revised Revised
Method of
Calculating Expected Deaths
Old Old
New New
Miners and Ex-miners
Category 0
2797 2909 2909 2909
Obser ved
Deaths
72 63 63
207
Expec ted
Deaths
60-1 62-4 62-6
154-5
119-8 100-9 100-6 134-0
?14-12 ?12-71 ?12-60 ? 9-28
Categories 1, 2, 3 and A
No.
1772 1860 1860 1860
Obser ved
Deaths
52 60 60
135
Expec ted
Deaths
40-7 43-6 43-1
107-1
127-8 137-7 139-2 126-1
?17-72 ?17-78 ?17-80 ?10-85
Categories B and C
460 489 489 489
Obser ved
Deaths
22 28 28 96
Expec ted
Deaths
15-8 16-7 16-4 39-4
S.M.R.
139-2 167-6 170-3
243-6
25-74 1950/51-53 1950/51-53 1950/51-53 1950/51-56
Old Revised Revised Revised
Old Old
New New
2826 2960 2960 2960
115 111 111 331
104-4 110-6 110-4
260-9
110-2 100-3 100-5 126-8
?10-27 ? 9-52 ? 9-53 ? 6-96
1950 2065 2065 2065
82 97 97
228
73-9 81-4 80-5
191-3
111-0 119-2 120-4 119-2
?12-25 ?1210 ?12-18 ? 7-88
579 617 617 617
47 53 53
166
33-9 36-2 35-4 79-4
138-6 146-6 149-9
209-2
Note: The expected deaths are shown corrected to the first decimal place. The S.M.R.s shown are calculated before correcting.
corrected, the grade of pneumoconiosis was in
creased, especially among the younger men who died.
Thus, the population of men with category 0 aged 20 to 64 was increased by 4 % due to the reduction of the lapse rates, but the number of deaths in this age
group in the 1950/51 to 1953 period was reduced by 12-5 %. Among those with categories B and C in this
age group, the changes have increased the population
by 6-3% and the number of deaths by 27%. This change is of the type to be expected if lapse rates are
reduced, i.e. the proportion of deaths would be
expected to rise because the death rates are in general
higher among the defaulters than in the rest of the
population. The results of the two methods of computing
S.M.R.s are compared in Table 3 on the revised
1950/51 to 1953 data. For men with pneumoconiosis, whose mortality experience generally exceeds expec
tation, the new method, as might be predicted from
theoretical considerations, gives an S.M.R. which is
larger than that obtained by the old method. When the mortality experience of a group does not show a
consistent deviation from expectation, the new
method of calculating S.M.R.s will not necessarily be
further from 100 than the old, and in fact in the case
of men in category 0 the reverse is true.
The S.M.R.s for the period of the six-year follow
up are also shown in Table 3. Neither the revision of
the data nor revising the method of calculating S.M.R.s nor extending the duration of the follow-up has greatly affected the S.M.R.s of men in categories
1, 2, 3, and A. However, the prolonged follow-up has enabled us to say that the deviation of their
S.M.R. from 100 is unlikely to be fortuitous.
In the category 0 group there seems to be a signifi cant increase in the S.M.R. associated with the
increased length of the follow-up. The reason for this
is not clear. In the category B and C group there is a
similar but much more striking effect which requires a more detailed discussion. A recent paper (Coch
This content downloaded from 194.29.185.145 on Wed, 25 Jun 2014 08:03:41 AMAll use subject to JSTOR Terms and Conditions
THE MORTALITY OF MINERS AND EX-MINERS IN THE RHONDDA FACH 41
Table 4
COMPARISON OF AVERAGE AREA OF P.M.F. IN EACH AGE GROUP, 1950-51 AND 1958
Age Group No. in Group
Average Area of P.M.F.
(cm2.) S.E. No. in Group
Average Area of P.M.F.
(cm2.) S.E.
25-34 35-44 45-54 55-64 65-74 75-84
60 177
201 231 165 38
23-29 34-77 33-41 33-24 33-36 29-73
?4-19 ?2-67 ?2-51 ?2-13 ?2-34 ?3-21
79 160 157 128 44
25-31 47-55 56-59 43-55 38-38 30-81
?6-34 ?404 ? 3-40 ?2-93 ?2-74 ?418
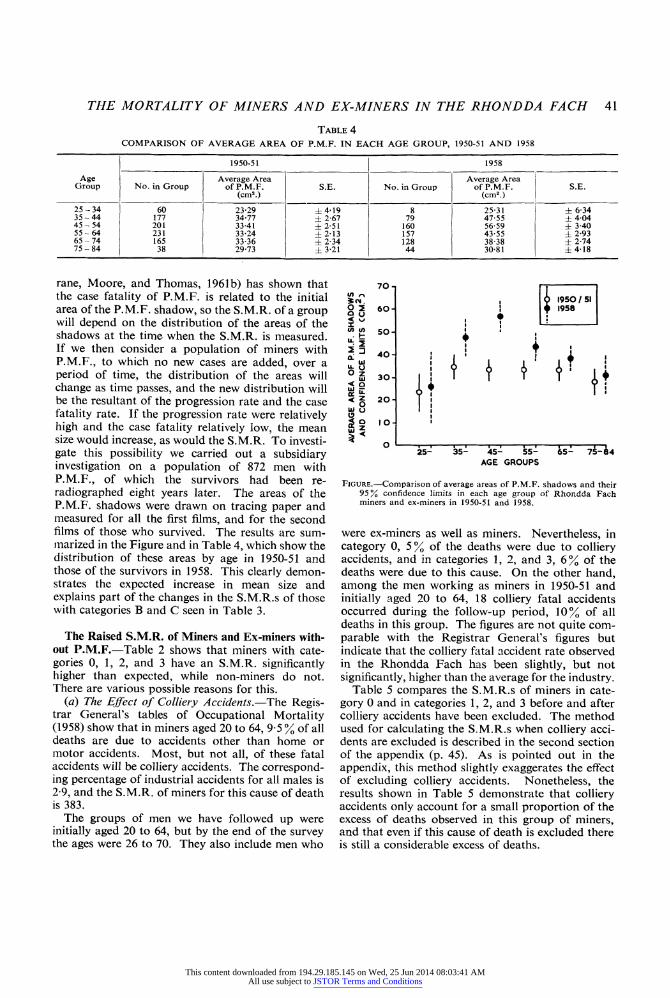
rane, Moore, and Thomas, 1961b) has shown that
the case fatality of P.M.F. is related to the initial area of the P.M.F. shadow, so the S.M.R. of a group will depend on the distribution of the areas of the shadows at the time when the S.M.R. is measured. If we then consider a population of miners with
P.M.F., to which no new cases are added, over a
period of time, the distribution of the areas will change as time passes, and the new distribution will be the resultant of the progression rate and the case
fatality rate. If the progression rate were relatively high and the case fatality relatively low, the mean
size would increase, as would the S.M.R. To investi
gate this possibility we carried out a subsidiary
investigation on a population of 872 men with
P.M.F., of which the survivors had been re
radiographed eight years later. The areas of the
P.M.F. shadows were drawn on tracing paper and
measured for all the first films, and for the second films of those who survived. The results are sum
marized in the Figure and in Table 4, which show the distribution of these areas by age in 1950-51 and those of the survivors in 1958. This clearly demon strates the expected increase in mean size and
explains part of the changes in the S.M.R.s of those with categories B and C seen in Table 3.
The Raised S.M.R. of Miners and Ex-miners with
out P.M.F.?Table 2 shows that miners with cate
gories 0, 1, 2, and 3 have an S.M.R. significantly higher than expected, while non-miners do not.
There are various possible reasons for this.
(a) The Effect of Colliery Accidents.?The Regis trar General's tables of Occupational Mortality
(1958) show that in miners aged 20 to 64, 9-5 % of all deaths are due to accidents other than home or
motor accidents. Most, but not all, of these fatal
accidents will be colliery accidents. The correspond
ing percentage of industrial accidents for all males is
2-9, and the S.M.R. of miners for this cause of death
is 383.
The groups of men we have followed up were
initially aged 20 to 64, but by the end of the survey the ages were 26 to 70. They also include men who
I950 / 51 1958
i
i?i i?i-1?i-1?i-r~-i-T?l 25- 35- 45- 55- 65- 75-84
AGE GROUPS
Figure.?Comparison of average areas of P.M.F. shadows and their 95% confidence limits in each age group of Rhondda Fach
miners and ex-miners in 1950-51 and 1958.
were ex-miners as well as miners. Nevertheless, in
category 0, 5 % of the deaths were due to colliery accidents, and in categories 1, 2, and 3, 6% of the
deaths were due to this cause. On the other hand,
among the men working as miners in 1950-51 and
initially aged 20 to 64, 18 colliery fatal accidents occurred during the follow-up period, 10% of all deaths in this group. The figures are not quite com
parable with the Registrar General's figures but
indicate that the colliery fatal accident rate observed
in the Rhondda Fach has been slightly, but not significantly, higher than the average for the industry.
Table 5 compares the S.M.R.s of miners in cate
gory 0 and in categories 1, 2, and 3 before and after
colliery accidents have been excluded. The method
used for calculating the S.M.R.s when colliery acci
dents are excluded is described in the second section
of the appendix (p. 45). As is pointed out in the appendix, this method slightly exaggerates the effect
of excluding colliery accidents. Nonetheless, the
results shown in Table 5 demonstrate that colliery accidents only account for a small proportion of the
excess of deaths observed in this group of miners, and that even if this cause of death is excluded there
is still a considerable excess of deaths.
70
O 2 60 2 u < \j v)
j/> so
O Z < Q
30
20
IO
!
I1 \ t
This content downloaded from 194.29.185.145 on Wed, 25 Jun 2014 08:03:41 AMAll use subject to JSTOR Terms and Conditions

42 BRITISH JOURNAL OF INDUSTRIAL MEDICINE
Table 5
the effect on standardized mortality ratios of excluding colliery accidents
Age Range 1950-51
Group
Miners and Ex-miners
Category 0
No. in Group
Observed Deaths S.M.R. S.E.
Categories 1, 2, and 3
No. in Group
Observed Deaths S.M.R. S.E.
20-64 Including colliery accidents Excluding colliery accidents
2,909 2,909
207 196
134-0 126-8
?9-28 ?9-00
1,547 1,547
111 104
128-8 120-5
? 12-26 ? 11-79
25-74 Including colliery accidents Excluding colliery accidents
2,960 2,960
331 323
126-9 123-7
?6-96 ?6-85
1,694 1,694
186 179
124-9 120-1
?9-22 ?8-99
Table 6
STANDARDIZED MORTALITY RATIOS BY X-RAY CATEGORY OF PNEUMOCONIOSIS EXCLUDING COLLIERY ACCIDENTS
Group No. in Group
Observed Deaths
Colliery Accident Deaths
Other Deaths S.M.R. S.E.
Ages 20 to 64 Non-miners
Miners and ex-miners Pneumoconiosis category 0 Pneumoconiosis category 1 Pneumoconiosis categories 2 and 3 Pneumoconiosis categories 1, 2, and 3 Pneumoconiosis categories A, B, and C
Ages 25 to 74 Non-miners
Miners and ex-miners Pneumoconiosis category 0 Pneumoconiosis category 1 Pneumoconiosis categories 2 and 3 Pneumoconiosis categories 1, 2, and 3 Pneumoconiosis categories A, B, and C
2,048
2,909 681 866
1,547 802
1,619
2,960 755 939
1,694 988
62
207 61 50
111 120
331 94 92
186 208
11 3 4 7
196 58 46 104 120
323 91 88
179 208
106-2
126-8 140-2 102-3 120-5 198-9
123-7 1200 1201 1201 170-8
? 13-48
? 9 00 ? 18-43 ? 1503 ? 11-79 ? 18-18
? 1202
? 6-85 ? 12-61 ? 12-68 ? 8-99 ? 11-76
The question of the relation between the risk of
dying from colliery accidents and that of dying from
P.M.F. is one that is sometimes raised, and the
material here enables us to attempt an answer by
relating the number of colliery accidents to the
excess deaths due to P.M.F. For the age group 20 to
64, over this particular period and in this particular
community the ratio would be 18 colliery accidents
to 59-6 excess deaths in the P.M.F. group or 1:3-3.
It should, however, be stressed that the ratio is very sensitive to age, because few colliery accidents occur
in men over 65 years of age, and to region, owing to
the variation in the prevalence of P.M.F.; and it
would be very different if only working miners were
concerned.
(b) The Effect of Category of Simple Pneumoconio
sis.?If simple pneumoconiosis were an important cause of the raised S.M.R., one would in general
expect that there would be an increasing S.M.R. with
increasing category of simple pneumoconiosis. The
break down by x-ray category of simple pneumo coniosis is shown in Table 6. In the 20 to 64 age group the effect of category is irregular, while in the
25 to 74 age group there is clearly no effect at all.
There is thus no evidence that simple pneumoconio sis per se has any effect on life expectancy.
(c) With what Causes of Death is this Raised S.M.R. Associated??This has been investigated by
calculating '
expected '
deaths from respiratory and
non-respiratory diseases (Table 7). The methods
used are described in the third section of the ap
pendix. Table 7 shows that for non-miners aged 20
to 64 there was an excess of respiratory deaths com
pared with the number expected, but the excess only amounts to three deaths in six years and is not
statistically significant. Table 7 also shows that
colliery accidents and respiratory deaths together account for much of the excess mortality observed in
men with simple pneumoconiosis. The respiratory S.M.R.s for P.M.F. (A, B, and C) are, as expected,
very high but the low non-respiratory S.M.R.s in
this group serve as a reminder of the possibility that
doctors in an area with a known high prevalence of
pneumoconiosis may have a bias in favour of giving a
respiratory rather than a non-respiratory cause of
death in a doubtful case.
This content downloaded from 194.29.185.145 on Wed, 25 Jun 2014 08:03:41 AMAll use subject to JSTOR Terms and Conditions

THE MORTALITY OF MINERS AND EX-MINERS IN THE RHONDDA FACH 43
Table 7
STANDARDIZED MORTALITY RATIOS FOR RESPIRATORY AND NON-RESPIRATORY DISEASES OF NON-MINERS AND MINERS AND EX-MINERS BY CATEGORY OF PNEUMOCONIOSIS
Age Group Group Respiratory Deaths
No. Observed Deaths
Expected Deaths S.M.R S.E.
Non-respiratory Deaths (excluding colliery accidents)
No. Observed Deaths
Expected Deaths S.M.R. S.E.
Non-miners
Miners and ex-miners Category 0 Categories 1, 2, 3 Categories A, B, C
2,048
2,909 1,547
802
51 25 74
9-9
25-9 15-0 10-7
197-3 166-8
699-2
?36-48
?27-63 ?33-36 ?81-28
2,048
2,909 1,547
802
145 79 46
128-6 71-2 49-7
113-3 1110 92-5
? 14-43
? 9-36 ? 12-48 ? 13-65
25-74 Non-miners
Miners and ex-miners Category 0 Categories 1, 2, 3 Categories A, B, C
1,619
2,960 1,694
988
86 44 122
12-7
41-1 25-7 19-9
117-8
209-2 171-4
611-5
?30-41
?22-56 ?25-84 ?55-36
1,619
2,960 1,694
988
237 135 86
219-6 123-3 101-8
114-4
107-9 109-5 84-5
? 13-39
? 701 ? 9-42 ? 911
Table 8
STANDARDIZED MORTALITY RATIOS OF MINERS AND EX-MINERS
Age Range
Miners (1950-51) Miners (1950-51)
(excluding colliery accidents) Ex-miners (1950-51)
^^ Observed I Expected o m p op No- I Deaths Deaths ' SMRI SE Observed Deaths
Expected Deaths S.M.R. N Observed Expected c M R op No- I Deaths Deaths ' ?.M.R. I ^t"
20-64 25-74
2789 2613
174 192
134-3 162-7
129-6 1180
?9-78 ? 8-49
2789 2613
156 177
134-3 162-7
116-2 108-8
?9-25 ? 8-16
2537 3154
282 595
171-7 386-3
164-3 1540
? 9-85 ? 6-35
The S.M.R.s of Miners and Ex-miners.?The
Registrar General is the accepted authority on the
mortality of occupied and retired miners, and the
size of his populations makes our numbers seem
puny. However, our population has an advantage in
that it contains those who left the mining industry and took other jobs. Such men should be auto
matically excluded from the Registrar General's
populations since the death certificate only refers to
the last occupation of the deceased. In South Wales
particularly, many miners have left the industry because of pneumoconiosis and taken other jobs, so
it is possible that our population may be, for this
particular area, more representative than the
Registrar General's '
occupied and retired miners '.
Table 8 gives the S.M.R.s for our ' miners
' and
* ex-miners
' as previously defined. Our
' miners
'
are not exactly the same as the Registrar General's 4 occupied and retired miners
' but must approxi
mate closely to them. The most recent of the
Registrar General's S.M.R.s for coal-miners, as
corrected by Heasman and his colleagues (Heasman,
Liddell, and Reid, 1958), was 1000. The same material has been analysed (but not published) by Professor D. D. Reid for the different regions of the National Coal Board. The figure for the South
western Region was 117 (Reid, personal communica
tion, 1961). Our figure for miners is higher and the
figure for ex-miners higher still. This certainly sug
gests, without of course proving, that the S.M.R.s for fc
occupied and retired '
coal-miners may under
estimate the risks associated with the industry in some areas.
Discussion
As regards the miners and ex-miners without
P.M.F., all the evidence suggests that their S.M.R. is
higher than that for non-miners, but that the excess,
although probably respiratory in origin, is not related
to the category of simple pneumoconiosis. This
agrees surprisingly well with the results of pulmonary
disability surveys in the Rhondda Fach. The average
ventilatory function of miners and ex-miners aged 55 to 64 without P.M.F. is significantly lower than
that of non-miners of the same age living in the same
area. There was also no relation between the cate
gory of simple pneumoconiosis and the average
ventilatory function. In an area in Derbyshire, the
average ventilatory function of miners and ex-miners
without P.M.F. is very similar to that of the non
miners (Cochrane, Higgins, and Thomas, 1961) so it
seems possible that S.M.R.s might be similar too.
At any rate it is clearly inadvisable to assume that the
S.M.R.s found in the Rhondda Fach are generally
applicable. Our results as regards the lack of relation between
the category of simple pneumoconiosis on the one
This content downloaded from 194.29.185.145 on Wed, 25 Jun 2014 08:03:41 AMAll use subject to JSTOR Terms and Conditions

44 BRITISH JOURNAL OF INDUSTRIAL MEDICINE
hand and ventilatory function and mortality on the other are not in agreement with those of the National
Coal Board which finds a clear-cut relation between
category and ventilatory function (Rogan, Ashford,
Chapman, Duffield, Fay, and Rae, 1961). Their
results are admittedly closer to what one might have
expected, and the discrepancy may well be explained
by a greater degree of occupational self-selection
amongst miners in the Rhondda Fach.
The S.M.R. of those with P.M.F. raises similar and
also additional problems. If the raised S.M.R. of
those without P.M.F. is due to non-mining causes, the S.M.R. of those with P.M.F. should be pro
portionately reduced, i.e. from 198-9 to 156, but the
present evidence is too uncertain. The alteration of
the S.M.R. with time makes an estimate of the 'true'
S.M.R. even more difficult. It seems probable that
the lethality of P.M.F. is better characterized by case
fatality ratios standardized by age and the original area of shadow (Cochrane et al., 1961b).
Such a long-term study could not be completed without the co-operation of a very large number of people. To
mention them all would be invidious. We can only express our gratitude to everyone concerned.
References
Carpenter, R. G., Cochrane, A. L., Clarke, W. G., Jonathan, G., and Moore, F. (1956). Brit. J. industr. Med., 13, 102.
Cochrane, A. L., Carpenter, R. G., Clarke, W. G., Jonathan, G., and Moore, F. (1956). Ibid., 13, 177.
-, Higgins, I. T. T., and Thomas, J. (1961). Brit. J. prev. soc. Med.,
-, Moore, F., and Thomas, J. (1961a). Tubercle {Lond.), 42, 72.
-,-,-(1961b). Ibid., 42, 64.
Heasman, M. A., Liddell, F. D. K., and Reid, D. D. (1958). Brit. J. industr. Med., 15, 141.
International Labour Organisation (1953). Third International Con ference of Experts on Pneumoconiosis, Sydney 1950. Record of Proceedings, Vol. 1, p. 104.
Registrar General's Decennial Supplement, England and Wales, 1951. Occupational Mortality Part II, Vol. 1, p. 95 (H.M.S.O. 1958).
Rogan, J. M., Ashford, J. R., Chapman, P. J., Duffield, D. P., Fay, J. W. J., and Rae, S. (1961). Brit. med. J., i, 1337.
APPENDIX
Method of Calculating the S.M.R.s and their Standard Errors
by
R. G. Carpenter
The first step in calculating the S.M.R. for a group or
cohort of men who have been followed up for a number of
years is to calculate the expected death rates for each 10
year cohort sub-group for each year of the period covered by the follow-up.
The population that we have followed up in the
Rhondda Fach was divided into five- and 10-year cohort
groups by sorting on age last birthday on January 1,195J. The Registrar General tabulates death rates for groups based on age last birthday at the mid-year. Thus in 1951 our cohort groups were on the average six months older than the corresponding age groups for which death rates are tabulated. In 1952 the cohorts were one and a
half years older, and in 1953 two and a half years older, than the tabulated age groups, and so on. The expected death rates for age groups corresponding to those of the cohorts were derived as described in the appendix of our
previous paper (Carpenter et al., 1956). That is, the death rates for these age groups were derived by linear inter
polation on the logarithms of the tabulated death rates.
The follow-up only covered the first 11 months of 1956. The analysis for this year is the same as for other years
except that the tabulated death rates for England and
Wales are replaced by 1,000 times the ratio of deaths in the country during the first 11 months of the year to the
mid-period (taken as the mid-year) population.
Both J. Thomas and I, using different methods, have
independently investigated the accuracy of deriving the
expected death rates of intermediate age groups by this method of interpolation, and we both concluded that it is
satisfactory.
In the appendix of the previous paper, I gave a formula for deriving the expected number of deaths in a cohort from the initial population and the expected death rates.
But the formula does not take account of the mortality experience of the group concerned. To derive an S.M.R. as comparable as possible to the Registrar General's
definition, as used in his tables of Occupational Mortality (1958), it is necessary to take account of the mortality experience of the group. The longer the period of follow
up the more important this becomes. The following formulae make the necessary adjustments.
Let the group of people followed up be divided into / five- or 10-year cohorts, and at the start of the survey let there be p{ subjects in each cohort (i goes from 1 to /).
The follow-up lasts for/years, and it is assumed, as in the
present study, that all the subjects are traced. Of the /th cohort dij die in theyth year of the follow-up. Let
/
Di = S da
This content downloaded from 194.29.185.145 on Wed, 25 Jun 2014 08:03:41 AMAll use subject to JSTOR Terms and Conditions

THE MORTALITY OF MINERS AND EX-MINERS IN THE RHONDDA FACH 45
Also denote the expected death rate in the ith cohort the
7*th year of the follow-up by r{j, where r is calculated from
the national death rates as already described.
Define
an =
ru!2 and for j
= 1 to / ? 1
an = mil + 2
r".0) / = J + l
Also let
Ai =Pi2Jrij .(2) j
Bt = S cruda .(3)
j
Ci =
2Jaijdij .(4) j
Then if we denote the fact that the S.M.R. is derived
from a cohort study by a subscript c, the definition, which
is comparable to that of the Registrar General's, is :?
100 EDt
S.M.R.c = ?--- = 100 S.(5)
Z(At- Cd i
It may also be shown that the variance of this expres sion is given by:?
^{Di+2SCi+BiS*--(Di+SCd*}lV Var (S.M.R.c)
=
{f (*-?}' .(6)
The derivation of these formulae and the assumptions involved will be published elsewhere.
The S.M.R.S, Colliery Accidents Excluded.?The
method used for calculating the S.M.R.s, colliery acci
dents excluded, was to assume that the men concerned
would otherwise have survived. The effect of assuming that these men survived, instead of regarding them as lost
from the population from the time they died, has a
negligible effect on the calculated expected numbers of
deaths and on the standard error of the S.M.R.
The expected death rates have also not been revised to
exclude 'other accidents' since they form so small a
fraction of the total expected deaths, and also because
'other accidents' are not all industrial accidents. In
consequence, the S.M.R.s, colliery accidents excluded, may be under-estimated by as much as 2\ %.
The S.M.R.s for Respiratory and Non-respiratory Deaths.?The S.M.R.s for respiratory and non-respira tory deaths were calculated by J. Thomas as follows. For
the standard age groups the proportion of deaths in
England and Wales due to respiratory causes, including tuberculosis, may be derived for any year from the
appropriate volume of the Registrar General's Statistical
Review. The expected proportions of respiratory deaths in the non-standard five- and 10-year age groups, corre
sponding to those of the cohorts, were obtained from these
figures by linear interpolation. Let bij be the expected proportion of deaths due to
respiratory causes in theyth year of the survey and in the
age group corresponding to that of the /th cohort in that
year. Then the expected respiratory death rate is :?
r'a =
ra bij
and the expected non-respiratory death rate is :?
ra -
r'ij
Let a'ij, A\, and C"? correspond to a^, Ai9 and Cit as
defined by equations (1), (2), and (4), when r\j and a'ij replace r^ and an in the right-hand side of these equations.
Then the expected number of respiratory deaths in the cohort is given by:?
27 04',- C\) i
and the S.M.R. for respiratory deaths is given by 100 times the observed respiratory deaths divided by the
expected respiratory deaths. The S.M.R. for non
respiratory deaths is :?
100 (total observed non-respiratory deaths)
(total expected deaths) -
(total expected respiratory deaths)
Determining the S.M.R. of deaths due to a particular cause is analogous to determining the S.M.R. of a cohort which is being depleted by losses other than death. An approximate formula for the standard error
of such an S.M.R., comparable to that given by equation (6), has been derived, but it is complicated, and the computations required to evaluate it are substantial.
For the present purpose it is sufficient to over-estimate the standard error (s.e.) by using the simple first approxi
mation given by:?
100 ^/(observed respiratory deaths)
expected respiratory deaths
A similar expression was used to estimate the standard error of the S.M.R. for non-respiratory deaths.
This content downloaded from 194.29.185.145 on Wed, 25 Jun 2014 08:03:41 AMAll use subject to JSTOR Terms and Conditions