the molten moment
TRANSCRIPT

The
Molten
Moment
The Moment Where ObesityInterventions Have The Greatest Impact
Tracy Flood, MD, PhD
© 2013, All rights reserved

OutlineBackground
• Define the Molten Moment• Obesity as a Growing Concern• Define Obesity in Children
1) Story of Fat Cell • Not too Big = Metabolic Synd• Not too small = Hunger• But Just Right
2) Many interventions reduce Metabolic Risk & CVD
3) Only interventions performed at the MOLTEN MOMENT can “cure” obesity forever.

The Molten Moment
Background
The Obesity Crises
Defining Obesity

The Molten Moment
A Cold Iron, Solid A HOT Iron, Malleable
DEFINITION of Mol-ten: liquefied by heat; having warmth and brilliance, glowing

The Molten Moment
Where do you strikeFor the biggest impact?

The Molten Moment
Where do you strikeFor the biggest impact?

The Molten Moment
Where do you strikeFor the biggest impact?

The Molten Moment
Where do you strikeFor the biggest impact?

Obesity is a Growing problem
7%
20%
1980 2008
Children aged 6-11 yo
5%
18%
1980 2008
Adolescents aged 12-19 yo
Since 1980, Childhood Obesity
rates have tripled
Prevalence Rates of Childhood Obesity

Obesity=Bad

If rising OW/OB trends continue, by 2030 it will reach 16-18% of total health-care costs in the United States. (Wang, Beydoun, Liang, Caballero, Kumanyika, 2008)
Obesity is a Growing problem
Atherosclerosis
Currently, the world’s leading causes of death are the Atherosclerosis-related dz:
1. Ischemic heart disease (IHD)2. Stroke (Lopez &Mathers, 2006; Mathers et al., 2009).
OW/OB Increases Risk FactorsRisk Factors AtherosclerosisAtherosclerosis begins at a young age

Prevalence of Obesity
Throughout the Lifespan
0
0.1
0.2
0.3
0.4
0.5
0-2 yrs 2-5 yrs 6-11 yrs 12-19 yrs 20-39 yrs 40-59 yrs 60+ yrs Males
FemalesPediatric Definition Adult Definition

Obese
Over-weight
Normalweight
Body Mass Index=BMI
30
25
ADULTSCHILDREN
>
Defining Obesity

Obese
Over-weight
Normalweight
Body Mass Index=BMI
30
25
ADULTSCHILDREN
>
Defining Obesity

Obese
Over-weight
Normalweight
Body Mass Index=BMI
30
25
ADULTSCHILDREN
>
Defining Obesity
NOTE: An Obese Preschooler is as Thin as a Normal
Weight Adult

The Story of the Fat Cell
Stem Cells can become Fat Cells
Fat Cell
Triglyceride(TG)FA
FAFA
How do we become Obese?
OB
OW
NW
BMI

The Story of the Fat Cell
Stem Cells can become Fat Cells
Fat Cell
Triglyceride(TG)FA
FAFA
How do we become Obese?
OB
OW
NW
BMI

The Story of the Fat Cell
Stem Cells can become Fat Cells
Fat Cell
Triglyceride(TG)FA
FAFA
How do we become Obese?
OB
OW
NW
BMI
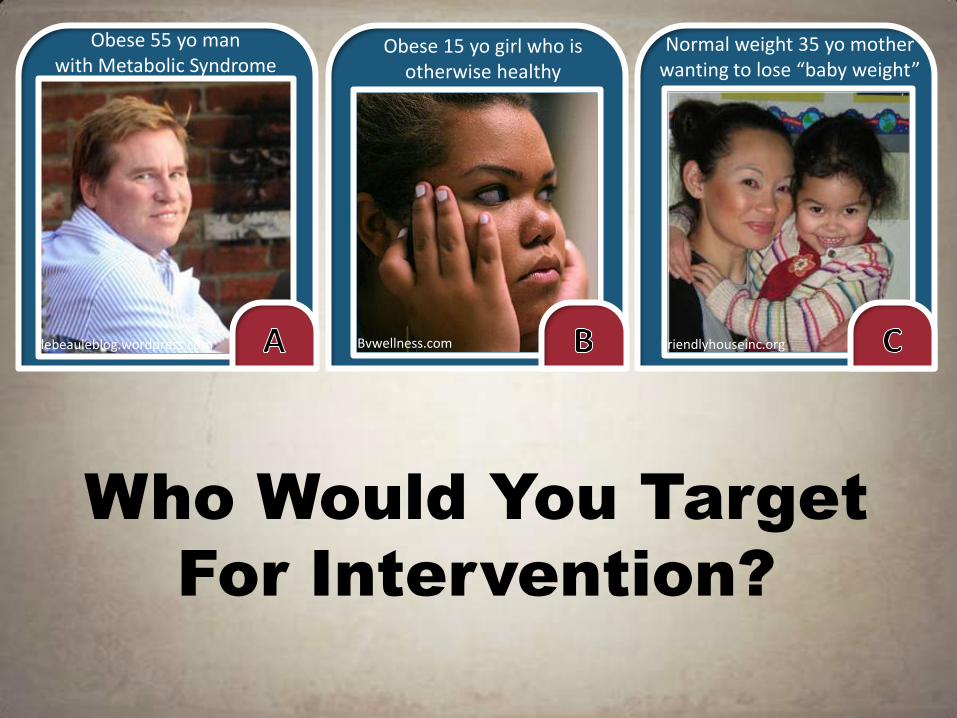
Who Would You Target
For Intervention?
lebeauleblog.wordpress.com Bvwellness.com Friendlyhouseinc.org
Obese 15 yo girl who isotherwise healthy
Normal weight 35 yo mother wanting to lose “baby weight”
Obese 55 yo man with Metabolic Syndrome
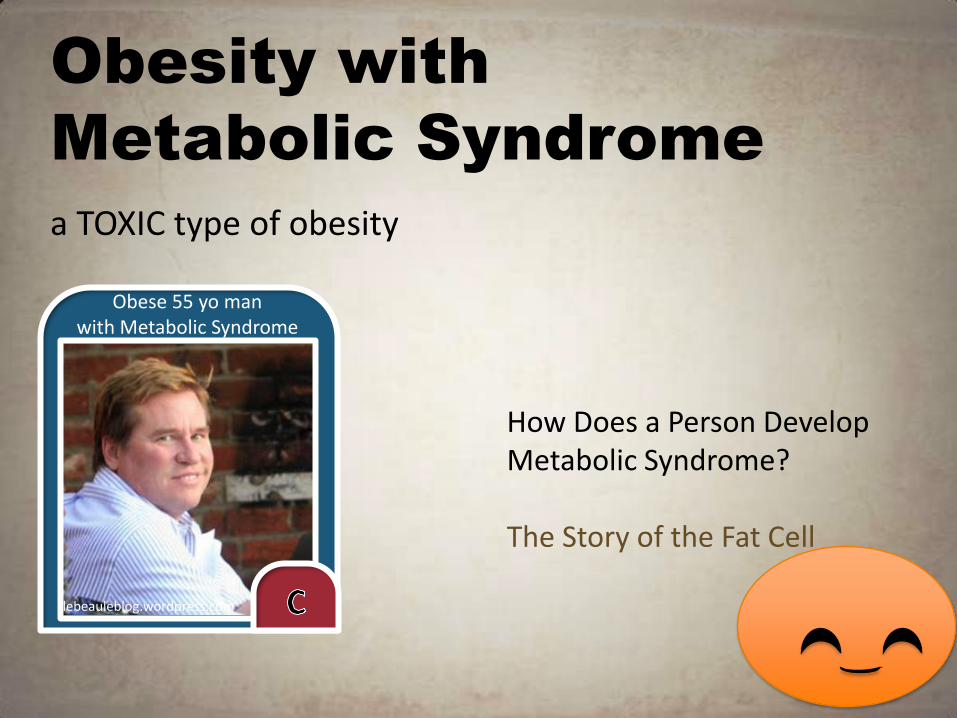
Obesity with
Metabolic Syndrome
lebeauleblog.wordpress.com
Obese 55 yo man with Metabolic Syndrome
a TOXIC type of obesity
How Does a Person DevelopMetabolic Syndrome?
The Story of the Fat Cell

The Story of the Fat Cell
Fat CellFA = Fatty Acids
Triglyceride(TG)FA
FAFA

The Story of the Fat Cell
Triglyceride(TG)FA
FAFA
Fat CellFA = Fatty Acids

The Story of the Fat Cell
FAFA FA
Triglyceride(TG)FA
FAFA
Fat CellFA = Fatty Acids

The Story of the Fat Cell
FA
Fatty LiverTG
TG
HDLTG
TG
Used for fuel if active
FAFAFA
Result:Higher TG
Lower HDLHDL is the good cholesterolScavenges Xtra TG then is destroyed

The Story of the Fat Cell
TG
TG
High TG, Low HDLHypertensionDiabetes=Metabolic Syndrome
Insulin Resistance
TG

The Story of the Fat Cell
High TG, Low HDLHypertensionDiabetes=Metabolic Syndrome
Insulin Resistance
TG
TG
TG
AtherosclerosisCardiovascular DiseasePremature Death

The Story of the Fat Cell
Insulin Resistance
= Metabolic Syndrome
Body Type& Risk

Obesity with
Metabolic Syndrome
lebeauleblog.wordpress.com
Obese 55 yo man with Metabolic Syndrome
a TOXIC type of obesity
He wants to be healthier:
--Americans spend over $60 billion/yr on
weight loss (Marketdata, 2010)
--1 in 3 adults are attempting weight loss

Testing the Effects
of Interventions
DIET EXERCISE
GOOD ADVICEMEDICATIONS
lebeauleblog.wordpress.com
STARVATION

Results of Intervention
Advice Alone
Sibutramine
Very Low Cal Diet
Average weight loss of subjects completing a minimum 1-year weight-management intervention; based on review of 80 studies (N=26,455; 18,199 completers [69%]).
(Franz et al, 2007)
3-6kg
Note: Built environment intervention not included
lebeauleblog.wordpress.com

160 lb
weight
5’6”
BMI
190 lb 30
25
OB
OW
NW
MAX6 kg13 lb
Results of Intervention
After 4 years of 26,455 people undergoing
weight-loss intervention,
the average weight loss was 13 lbs
and the obese were still obese.

160 lb
weight
5’6”
BMI
190 lb 30
25
OB
OW
NW
MAX6 kg13 lb
Results of Intervention
After 4 years of 26,455 people undergoing
weight-loss intervention,
the average weight loss was 13 lbs
and the obese were still obese.
160 lb
weight
5’6”
BMI
190 lb 30
25
OB
OW
NW
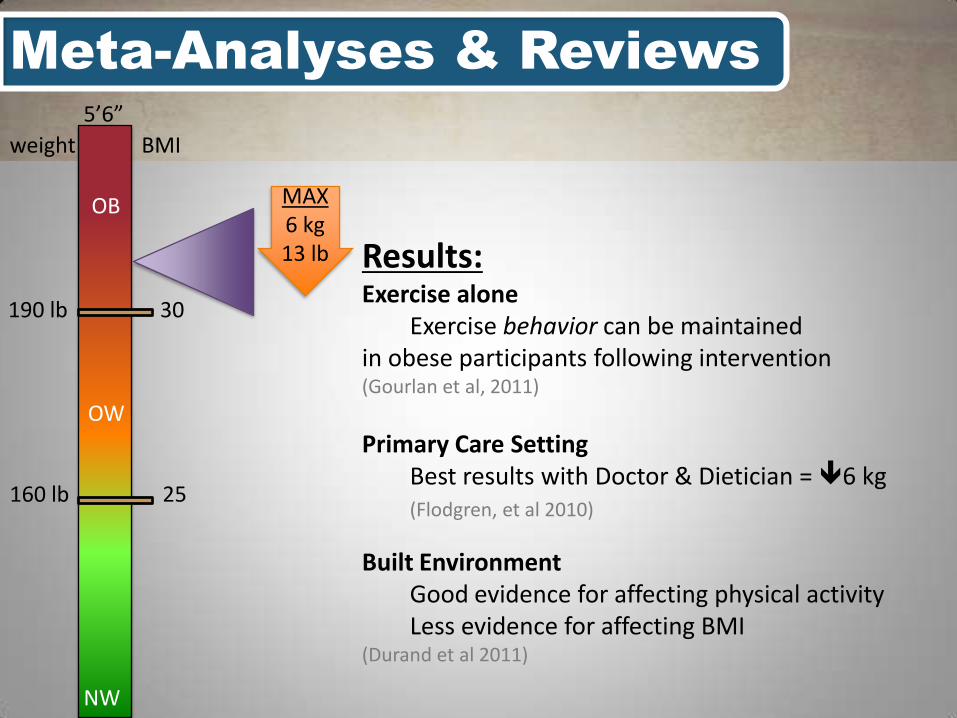
MAX6 kg13 lb Results:
Exercise aloneExercise behavior can be maintained
in obese participants following intervention(Gourlan et al, 2011)
Primary Care SettingBest results with Doctor & Dietician = 6 kg (Flodgren, et al 2010)
Built EnvironmentGood evidence for affecting physical activityLess evidence for affecting BMI
(Durand et al 2011)
Meta-Analyses & Reviews

The Story of the Fat Cell
FAFA FA
Fat Cells
7-10% weight loss = Less Insulin Resistance

The Story of the Fat Cell
Fat Cells
7-10% weight loss = Less Insulin Resistance

The Story of the Fat Cell
TG
TG
High TG, Low HDLHypertensionDiabetes=Metabolic Syndrome
Insulin Resistance
TG
Meta-Analyses: Exercise alone (Shaw et al., 2006)
hypertensiontriglyceridesfasting glucose & risk of diabetes
Diet alone (i.e. Low Fat Diets) (Avenell et al., 2004)
hypertensionrisk of developing diabetes
Diet + Exercise (Avenell et al.; Witham et al., 2009)
risk of CVD (HR 0.65, 95% CI 0.50–0.85 in those >60 yo)
7-10% weight loss = Improved Outcomes

The Story of the Fat Cell
7-10% weight loss = Improved Outcomes
“Clinically Significant” Weight Loss
16%
In 100 Adults (20-65 yo) Getting Treatment for Obesity 16% will have
clinically significant weight loss
10% Weight loss
No Weight loss

Increasing Weight Loss
lebeauleblog.wordpress.com Page2live, TopGun
Reeeeally was hoping to get back to pre-weight gain weightI want to lose more than 13 lbs

The Story of the Fat Cell
Fat Cell
If you try to lose more than 10%... Uh oh!
160 lb
weight
5’6”
BMI
190 lb 30
25
OB
OW
NW
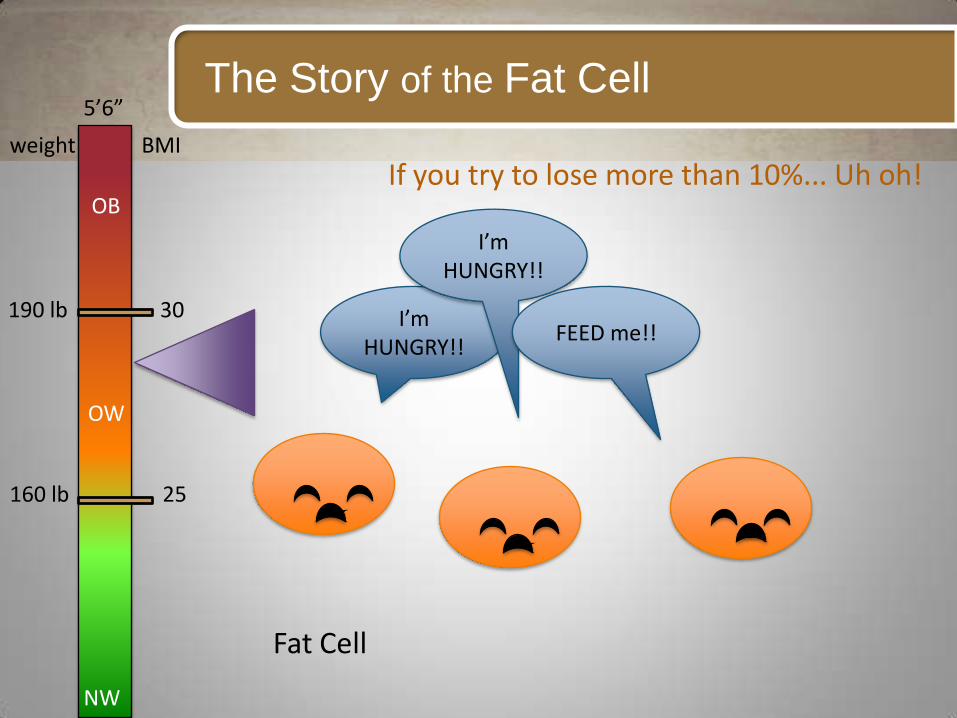
The Story of the Fat Cell
Fat Cell
If you try to lose more than 10%... Uh oh!
I’m HUNGRY!!
I’m HUNGRY!!
FEED me!!
160 lb
weight
5’6”
BMI
190 lb 30
25
OB
OW
NW

The Story of the Fat Cell
I’m HUNGRY!!
I’m HUNGRY!!
I’m HUNGRY!!
EAT MORE!BURN LESS!

The Story of the Fat Cell
EAT MORE!BURN LESS!

lebeauleblog.wordpress.com
Losing weight
I’m HUNGRY!!
I’m HUNGRY!!
I’m HUNGRY!!
30 minof moderate exercisex 5 days a week to maintain
60-90 minof moderate exercisex 7 d/wk to maintain weight loss

Summary of Adult Interventions
lebeauleblog.wordpress.comPage2live, TopGun
A) Weight gain is a wheel and ratchet= Uni-directional
B) Behavioral change is possible
C) 7-10% Weight loss is improves CVD risk
Is adulthood a Molten Moment? NO

lebeauleblog.wordpress.com Bvwellness.com Friendlyhouseinc.org
Obese 15 yo girl who isotherwise healthy
Normal weight 35 yo mother wanting to lose “baby weight”
Obese 55 yo man with Metabolic Syndrome
Who Would You Target
For Intervention?

Bvwellness.com
Obese 15 yo girl who isotherwise healthy The Obese Teen
An Obese Teenager is already at risk for early death & disease

Risk for Early Death
Bvwellness.com
Obese 15 yo
Note: Subjects with BMI 25th to 75th percentile (CDC charts) were the referent group. Adapted from Bjorge, Engeland, Tverdal, & Smith (2008).
Figure. Mortality in adulthood (<55 y/o) of OW/OB adolescents (males and females) compared to normal weight peers.
The health risk in adulthood for OW/OB adolescents
If OW/OB teen Normal Weight by adulthoodRisk Factors & Atherosclerosis associated with adiposity
DECREASE (Oren et al., 2003; Weiss et al., 2009)
But our patient has a 92% chanceof remaining obese at the age of 40.
(Nader, 2008)

BMI nadir
BMI associated with CVD
Early pressures = Later Disease
Link between Childhood BMI and adult CV deathBegins as early as:
8 yo in boys 13 yo in girls
Every 12 lb increase associated with risk of fatal cardiac death
CVD Risk: Sun et al., 2008Trajectory: Ventura, Loken, & Birch, 2009
BMI Percentile Chart
Very High Risk o’ Future CVD
Finished w/ Linear Growth
Increased Adiposity = Increased Risk of CVD

5’6”
BMI %ile
95th %ile
85th %ile
OB
OW
NW
Meta-Analyses (Teens)
MAX3
kg/m2
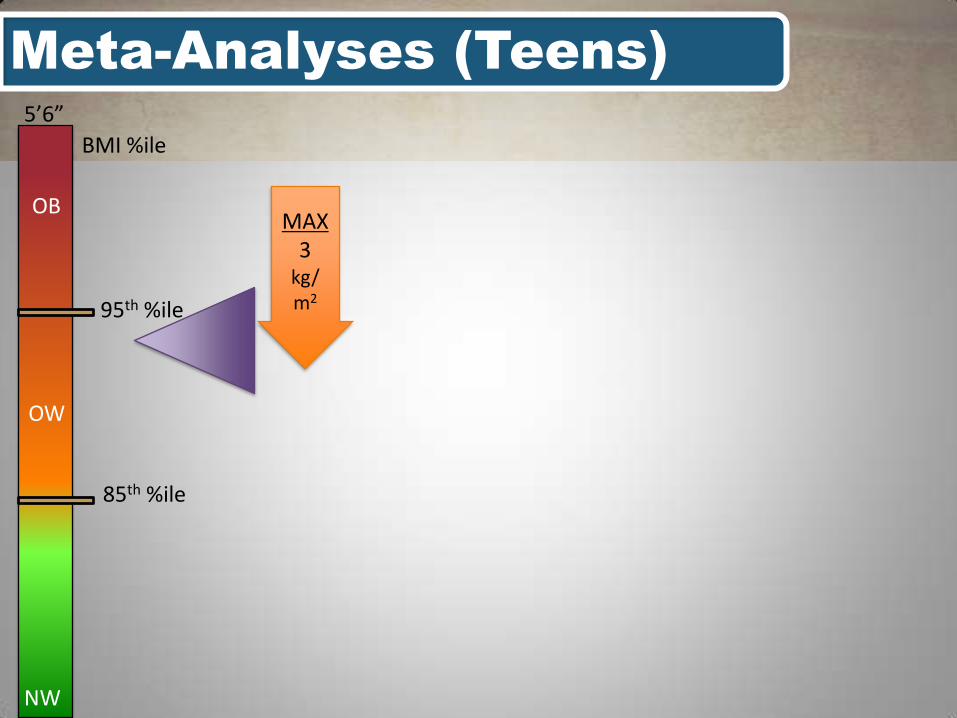
5’6”
BMI %ile
95th %ile
85th %ile
OB
OW
NW
Meta-Analyses (Teens)
MAX3
kg/m2
5’6”
BMI %ile
95th %ile
85th %ile
OB
OW
NW
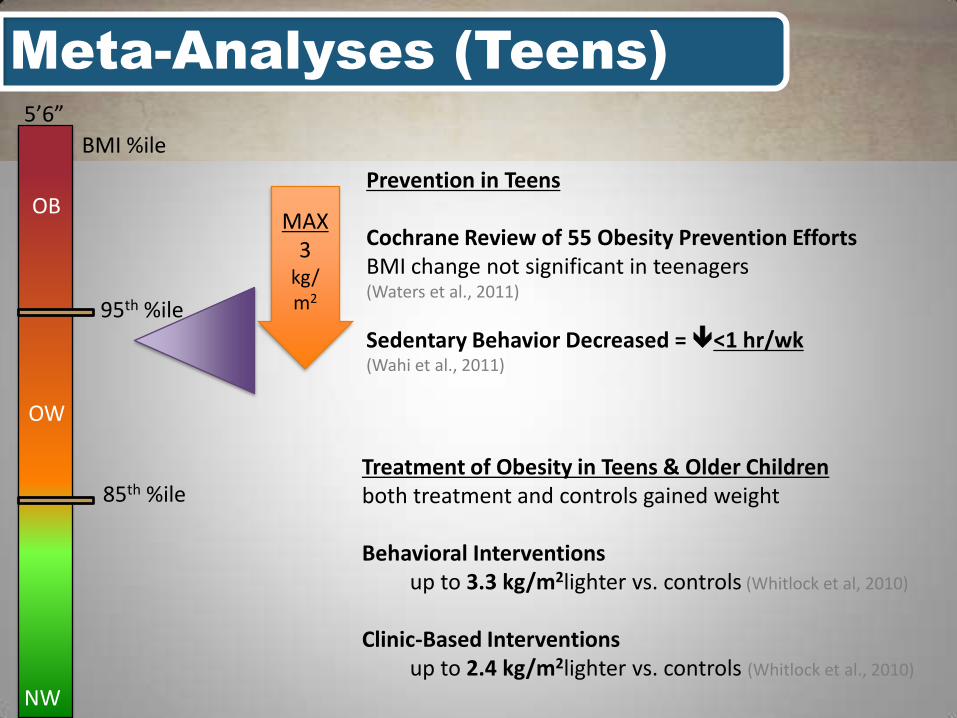
Treatment of Obesity in Teens & Older Childrenboth treatment and controls gained weight
Behavioral Interventionsup to 3.3 kg/m2lighter vs. controls (Whitlock et al, 2010)
Clinic-Based Interventionsup to 2.4 kg/m2lighter vs. controls (Whitlock et al., 2010)
Meta-Analyses (Teens)
Prevention in Teens
Cochrane Review of 55 Obesity Prevention EffortsBMI change not significant in teenagers(Waters et al., 2011)
Sedentary Behavior Decreased = <1 hr/wk(Wahi et al., 2011)
MAX3
kg/m2

BMI Percentile Chart
Very High Risk o’ Future CVD
Finished w/ Linear Growth
Increased Adiposity = Increased Risk of CVD
TEEN INTERVENTION:Alters TrajectoryPrevents wgt gainMinimal Decr BMI

BMI Percentile Chart
Very High Risk o’ Future CVD
Finished w/ Linear Growth
Increased Adiposity = Increased Risk of CVD
TEEN INTERVENTION:Alters TrajectoryPrevents wgt gainMinimal Decr BMI
Intervene

BMI Percentile Chart
Adult Obesity
20%
In 100 Teens (11-15 yo) Getting Treatment for
Obesity 20% have clinicallySignificant weight loss
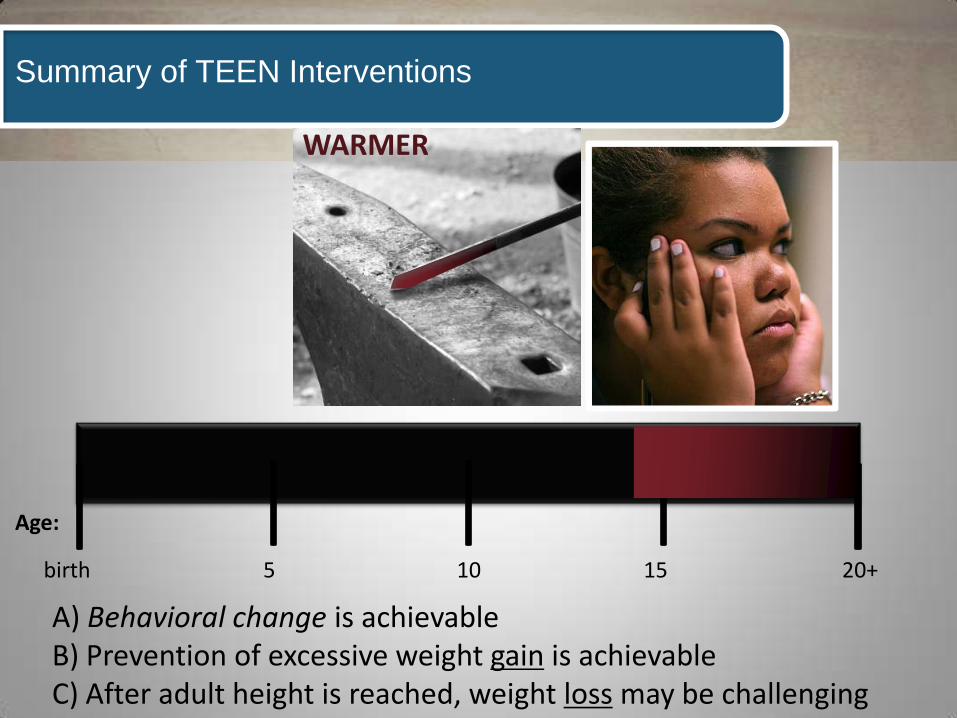
Summary of TEEN Interventions
WARMER
A) Behavioral change is achievableB) Prevention of excessive weight gain is achievableC) After adult height is reached, weight loss may be challenging
birth 10 20+ 5 15
Age:

lebeauleblog.wordpress.com Bvwellness.com Friendlyhouseinc.org
Obese 15 yo girl who isotherwise healthy
Normal weight 35 yo mother wanting to lose “baby weight”
Obese 55 yo man with Metabolic Syndrome
Who Would You Target
for intervention?

The Mother of a
Preschooler
Friendlyhouseinc.org
Normal weight 35 yo mother wanting to lose “baby weight”
Parents and Adult Caretakers must be the agent of change in this age group.
Preschoolers mimic parents’:
Fruit & Vegetable consumptionPortion sizesSnacking frequencyTVPhysical activityGrocery shopping Adult Intervent’n= Preschooler Intervent’n

The Mother of a
Preschooler
Friendlyhouseinc.org
Normal weight 35 yo mother wanting to lose “baby weight”
“When mothers improve their diets in order to control their weight, their child(1-3 y/o) improves their diet as well, even if that was not the original intent”
(Klohe-Lehman, et al., 2007)

The BMI nadir and “Adiposity Rebound” are good predictors of future OW/OB
The Preschooler
At the nadir
High TG, Low HDLHypertensionInsulin Resistance=Metabolic Syndrome

The BMI nadir and “Adiposity Rebound” are good predictors of future OW/OB
The Preschooler
At the nadir
Intervene

The Preschooler
a Problem of Perception
80% of Parents & 50% of all adults cannot see OW/OB in Preschoolers(Baughcum, Chamberlin et al., 2000)

5’6”
BMI %ile
95th %ile
85th %ile
OB
OW
NW
Promising Interventions:Diet+Exercise
Educational Setting Interventions, changing culture Parental Support for home activities (Waters et al., 2011)
Interventions to Decrease Sedentary Behavior= 4 hr/wk in Preschooler (Wahi et al., 2011)
Meta-Analyses (Children)
0
1
2
3
4
5
Preschooler Teenager
Hours Less of Sedentary Behavior After Intervention
Interventions during preschool are needed

5’6”
BMI %ile
95th %ile
85th %ile
OB
OW
NW
Built Environment (Review)Walkability& Access to Recreation = Activity (Ding et al., 2011)
Cochrane Review of 55 Obesity prevention effortsTeens BMI change not significant in teenagers
6-12 yo BMI change by 0.15 kg/mg2, significant0-5 yo BMI change by 0.26 kg/mg2, significant(Waters et al., 2011)
Meta-Analyses (Children)

6-12 yo
Intervention and Average BMI Change
OB
OW
NW
OB
OW
NW
OB
OW
NW
-0.3
-0.25
-0.2
-0.15
-0.1
-0.05
0
0-5 yrs 6-12 yrs 13-18 yrs
Weight Change After Intervention by Age (in kg/m2)
ns

20% 16%
90%
Danielsson et al., 2012 (0.5 SD BMI)
Intervention and % Success of
clinically significant weight loss
Kraschnewskiet al., 2010

BMI Percentile Chart
Beh
avio
rB
MI C
han
geSu
cces
s

lebeauleblog.wordpress.com Bvwellness.com Friendlyhouseinc.org
Obese 15 yo girl who isotherwise healthy
Normal weight 35 yo mother wanting to lose “baby weight”
Obese 55 yo man with Metabolic Syndrome
Behavior
CVD Risk
Behavior Behavior
Less Wt Gain True Change

High RiskBorderlineThinnest Weight
Successful Interventions
Moldable Habits

High RiskBorderlineThinnest Weight
Successful Interventions
Moldable Habits

High RiskBorderlineThinnest Weight
Successful Interventions
Moldable Habits

Moldable Habits
birth 10 20+ 5 15
Age:
MOLTEN MOMENT
Prevention of Obesity
High Risk
Successful Interventions
Thinnest Weight

birth 10 20+ 5 15
Age:
Define The Molten Moment
MOLTEN MOMENT
Prevention of Obesity
Strike now.
The iron is hot.

Summary
20+ birth 10 5 15Age:
MOLTON MOMENTIntervention = Prevention of OB
Behavior Change PossibleCan Improve Outcomes

Summary
Molten Moment
1) Story of Fat Cells• Not too Big = MetS• Not too small = Hunger• Just Right via Prevention
2) Metabolic Risk can be Reduced3) The MOLTEN MOMENT for
obesity is in preschool &sooner.

Part 2: The Big 5
The 5 Behaviors that protect your fat cells

Eat Five Times a Day
Recommendations: Do not skip Breakfast(Skipping Meals in General)= BMI
Eat 5x a day (3 meals, 2 snacks)Eat Family Meals at Home 5x a week

Television
Recommendations:1) Watch TV ≤ 2 hrs/day2) Those under age 2 should not watch TV3) Remove TV from where children sleep

Physical Activity
Recommendations:1 hour of physical
activity or active play accumulated
throughout the day.

Sweetened Beverages

Sweetened Beverages
Each Serving of Sugar-Sweetened Beverages per day is associated with an increase in BMI (Forshee, Anderson,Storey, 2008) Meta-analysis
Recommendations: No zero zilch sweetened beveragesand ≤ 4 oz of 100% Fruit Juice per day

Half a Plate

7 “ plate for children

How to Assess
1: What do you do after school?
Do you live in a safe neighborhood?
2: How often is the TV on?
What are your favorite shows?
Is there a TV in the bedroom?
0: What do you drink?
1/2: Is half of everything you eat a fruit
or a vegetable?
5: Describe what you eat on a regular day?
Questionnaires like REAP & WAVE

Part 2: The Big 5
SUMMARY:
You can’t kill a fat cellAfter 8 is too late.
5, 2, 1, 0… And half a plate.
Part 1: Molten Moment
