the millionaire blueprint - darwin investing...
TRANSCRIPT

The Millionaire Blueprint

Table of Contents
Overview .................................................................................................. 3
Chapter 1: New Investing Landscape – Why You Can’t Reach Your Goals .. 4 The Retirement Gap Crisis ............................................................................................ 6
Chapter 2: The Myth of Index Funds and “Safe” Investments .................. 10 The Next Fifteen Years... ............................................................................................. 13
Chapter 3: The Plan ................................................................................. 18 The Hyper-Compounding Principle ....................................................................... 19
Chapter 4: The Rules ............................................................................... 24 Introducing Decision Triggers ................................................................................. 29 Profit Posts: The Horse Racing Analogy . Error! Bookmark not defined. Introducing "Profit Posts" ............................. Error! Bookmark not defined.
Chapter 5: The Right Stocks ..................................................................... 34 The PE Gap ........................................................................................................................ 35 2 Components to the PE Gap..................................................................................... 36 The PE Gap Calculation ............................................................................................... 38
Chapter 6: The Millionaire Blueprint Portfolio ......................................... 43 The $1,000,000 Portfolio ............................... Error! Bookmark not defined.
Chapter 7: Get Started –Today! ............................................................... 43 10 Step MillIonaire Blueprint ................................................................................... 44
Chapter 8: Avoid Common Investing Mistakes ........................................ 50
Chapter 9: Asset Classes for Time Diversification Portfolio ...................... 54
Chapter 10: Review of Goals and Objectives ........................................... 55
Chapter 11: Managing Your New Portfolio .............................................. 56 Large Account Management ........................ Error! Bookmark not defined. Measuring Your Progress .............................. Error! Bookmark not defined.
Notes on Taxes........................................................................................ 57
Final Thoughts ........................................................................................ 58
The Millionaire Blueprint Program .......................................................... 61

Overview
The Millionaire Blueprint has a single purpose: to provide you with a simple plan to turn $10,000 into a $1,000,000 (or more) portfolio. By the end of this book, our goal is to help you achieve financial freedom. You'll have a plan, a strategy and a unique approach to investing so that you never worry about your money again. In the process, you will look at your portfolio in a new way – in a way that can allow you to consistently participate in the market’s gains, while protecting your hard-earned money from downside risk. You should know right up front that this book is NOT about:
High Risk Investing
Penny Stocks
Weird Forex Schemes
Real Estate Investing
Difficult Options Strategies
Day Trading Or any other high-risk, get-rich-quick scheme out there. We will be focused on investing in stocks, but perhaps not in a way that you might think. This book introduces you to a safe, simple style of investing that does not rely on the typical buy and hold models. This book will give you a PLAN to accelerate the growth of your money faster than you probably think is possible. We’ll provide you with a set of RULES to follow so that you learn how to automatically secure investing gains and prevent portfolio-wrecking losses. Then, you’ll learn a simple strategy to find the RIGHT STOCKS using a fundamental analysis tactic that’s so simple, a third-grader could do it.
When you put the Plan and the Rules together with the Right Stocks, you’ll discover why the Millionaire Blueprint is the only step-by-step investing plan specifically designed to create millionaires. If you’re at all interested in having a simple plan to build your million-dollar portfolio, turn the page and let’s get started.
Chapter 1: New Investing Landscape – Why You Can’t Reach Your Goals
If you’re an investor struggling to achieve your financial goals, know that you’re not alone. As of January 2015, according to the Employee Benefit Research Institute, more than 65% of Americans have less than $50,000 in retirement savings. If you don’t take action today, you risk living your later years in poverty. It’s no secret that the 1999-2009 stock market collapses effectively killed the growth of investors’ portfolios. What isn’t known is that, despite the stock market rebounding to all-time highs since 2009, most investors are still following the exact same investing models of the last 15 years. Today, it’s still buy and hold, mutual funds, index funds, ETFs – none of which will help you reach your goal unless you’re very, very fortunate. Buy and hold and other fund-diversification models are costing investors money because they DECREASE your annual rate of return. In fact, over the last 15 years, the average annual return for an investor is less than three percent per year (yes, 3% per year). To briefly illustrate the problem of very low annualized returns, consider this: You could invest $10,000 every single year in the stock market and at 3% per year, it would take you over 50 years to reach a million dollar portfolio.

It’s the costliest error you may be making today because what you should be focused on is INCREASING your annual rate of return. Otherwise, you can’t reach your financial goals. We’ll explain this and show you how to increase that rate of return, safely and simply, in a few moments. Like most investors, however, you probably don’t have 50 years until retirement and therein lies one of the hidden dangers for investors. It’s a problem they’re not being made aware of and certainly not being taught how to solve. It’s called the Retirement Gap.

The Retirement Gap Crisis
If you’re an investor 40 years or older, you’re likely facing a frightening problem: What Forbes Magazine calls, “The Greatest Retirement Crisis in American History.” While Forbes talked about how most
retirees will have to work later in life, they missed the most critical part of the story. It’s called the Retirement Gap—and if you don’t know what YOUR retirement gap is you are at risk today. What is the Retirement Gap? It is the difference between the amount of money you currently have saved for retirement and the amount of money you will need to enjoy a secure retirement. Let me focus on one word there: secure. This book is not about owning vineyards in France, private yachts or islands in the Bahamas. This book is about helping you achieve a level of financial security so that you are not worried about your money or your lifestyle in later years. If you don’t make a few changes to your portfolio immediately, you risk:
Relying on Social Security in retirement, assuming it still exists.
Being a financial burden on your children because you can’t afford simple things.
Being faced with rising medical expenses that you can’t afford, putting your health in serious danger.
Being forced to work into your 70s and 80s because you won’t have enough money to enjoy retirement.

If you’re worried that you won’t have enough money for retirement or if you suffer sleepless nights tossing and turning over your future financial security, you’re not alone. As of 2014, Investors across the U.S. and many other countries remain far, far behind their financial goals. We pointed out that currently, 65% of Americans have $50,000 or less saved for retirement. Of that 65%, nearly half have $10,000 or less. Let’s put that into a household income context so you see how significant this problem is for potential retirees and current retirees. The average household income in the U.S. is about $52,000 per year. To maintain an average standard of living in retirement, consider this: If you retire at 67 (the new retirement age), and live another 15 years, that means you’ll need at least $780,000 for retirement. That’s $780,000… just for retirement. That doesn't account for things like putting kids through college, having a rainy day fund, buying a house, travel or taking vacations. It doesn't provide enough security for rising medical costs, despite government-funded healthcare. This one category, alone, can destroy senior citizens’ wealth. The AARP recently estimated retirees should expect to need at least $240,000 to cover future medical expenses—over and above Medicare/Medicaid! Worse, that $780,000 provides you no protection against another financial collapse, stock market swoon or any other of life's financial surprises. No wonder many investors are nervous about their future. The Retirement Gap means the average investor today is more than $700,000 BEHIND their financial retirement needs.

To better understand your Retirement Gap, simply use the equation below. Remember that the Gap is the difference between how much money you have saved for retirement right now and how much money you believe you’ll need in retirement. Here’s how that works: [Current Portfolio Value] – [Retirement Amount Needed] = Retirement Gap So if the current value of the average portfolio is $50,000 and the average investor needs $780,000 for retirement, then the Retirement Gap calculation looks like this: [$50,000] – [$780,000] = $730,000 The average investor has a retirement gap of $730,000 – that’s how far behind saving for a secure retirement most investors are today and it’s how much they need to “make up” before reaching retirement. More than any other issue, it is the Retirement Gap, the "missing money," where most investors are misinformed or unprepared to survive their later years. To further that point, a 2013 Fidelity Investor survey discovered that Baby Boomers face a $24,000 annual income gap in retirement. Yes, $24,000. To put that in perspective, imagine living the life you lead today on $24,000 fewer dollars per year. Considering the average standard of living in the U.S. is just over $52,000 per year, you’d end up below the poverty line (around $28,000 per year) in retirement. Clearly, it isn’t hyperbole to say that most Americans will be poor in their retirement years. More and more headlines in today's media trumpet the need for a million dollars or more to have a secure retirement. Some even claim that a million dollars, alone still won’t be enough.
You may be worried that you'll never get there because the stock market is rigged, banks are run by criminals, Social Security is a Ponzi scheme destined to collapse... the list goes on. We’re here to tell you that you can have a million-dollar portfolio. You can safely and securely build a portfolio that will outlive you. In this brief chapter, we've established the need for a Million-dollar Goal. In the next chapter, we'll show you why traditional investing strategies will not get you there. Then, we'll review the step-by-step blueprint you should use to grow any amount of money into a million-dollar portfolio (or more). Let's go on...

Chapter 2: The Myth of Index Funds and “Safe” Investments
If you're like most investors or traders, you're well-versed in the adage of buy and hold. You know the story: The financial pros tell you if you had left your money in the market from 1929 until today, you'd be wealthy many times over. Wild guess: You haven't had your money in the market since 1929, though, have you? We certainly haven’t. But what if you started investing back in the 1990s, which is precisely when most investors today began plowing their hard-earned money into mutual funds and index funds. You'll probably be surprised to learn that, despite the meteoric rise of the stock markets over the last 30 years, your money ACTUALLY grew at about 4% per year. 4%! Let's illustrate that and show you why index funds are the great lie being told to the investing public. Then, we’ll show you an alternative approach that allows you to participate in the market's gains while still protecting yourself from downside risk. First, by most accounts, 1999 is the year when billions of dollars began flowing from individual investors into the stock markets—just prior to the dot.com collapse and the eventual recession of the early 2000s that followed. Over the last 15 years, if you put $10,000 into an S&P 500 Index fund at the beginning of each year, your annualized rate of return would be just 4.2%. That's how little your money would have grown, even though the S&P 500 has gained more than 50% in that time. Let's take a look at the reality—not the myth—of index funds.

This chart shows you the growth of your money of the last 16 years if you had invested $10,000 EVERY YEAR into an S&P 500 Index Fund.
The facts are as follows: You invested a total of $160,000 over the 16 years. At the end of 2014, your total investment was worth $267,796. That's an overall return of 67% over 16 years. Which means your average annualized rate of return was just 4.2%. That won't get it done for retirement. Of course, this also assumes that you had the stomach to sit tight in 2003, 2008 and 2009 when the S&P lost significant value (most investors didn't). The bottom line is this: Index funds will not grow your money fast enough to reach your financial goals. Let's take a look at that next 15 years…

Let me validate these numbers a different way:
From Morningstar.com – the Vanguard 500 Index Fund’s returns May 2015. Recall earlier I told you that index funds tend to decrease your annual returns? Had you used this S&P 500 Index fund, over the last 15 years, your actual return was 4.04% per year. I want you to notice something else, however, because this will be important in the next chapter. Notice the returns in the 1-year, 3-year and 5-year categories of 12%, 15% and 14%? Significantly higher, aren’t they? Remember that in a few moments when I share with you the Power Profit Portfolio and keep in mind two points:
1. Buy and Hold investing is not “dead” nor does it not work. It should not represent your entire portfolio, however, in our opinion.
2. Use of mutual/index funds typically will decrease your annual returns over longer periods of time.
3. Investing in individual stocks typically will increase your annual returns.

The Next Fifteen Years...
Let's assume you've already been a good investing soldier. You put that $10,000 each year into the market over the last 15 years and held on through the rough years, even though your money has barely grown. What about the next 15 years? If you continued to put $10,000 into an S&P 500 Index fund for the next 15 years and maintained the typical investors average rate of return, you'd still come up significantly short of your retirement money needs.
Your portfolio would be worth $481,697 after investing $10,000 each year for 30 years. It still doesn’t cover your retirement needs—and isn’t even halfway to that million-dollar goal. At that rate of return, it would take you 52 years to reach a million dollars. The bottom line is this: Index Funds will not help you achieve your financial goals.

This does not mean you should NOT use index funds—it does mean that index funds should not be the only investment you make in the stock market. We’re a long way from a million bucks. How will we reach that goal? In order to get there, we’re going to be blunt: You must invest in individual stocks again. Put simply, you don’t have the same low-risk choices to balance your portfolio that you would have had five or even seven years ago. That means accepting some risk is necessary. We’ll show you to limit your risk so you’ll never be in danger of losing it all when you learn our approach. Time is working against most investors now. Those typical “invest for 50 years models?” We’re willing to bet you don’t have 50 years. You probably have closer to 10 years, 5 years or no years until retirement. If you think stocks are dangerous, you may be shocked to discover they’re less dangerous than bonds, CDs, and savings accounts—all of which have crashed far worse than stock market (and at least the stock market has recovered). Look at these disturbing numbers for “safe” investments: Interest rates on CDs and savings accounts have crashed by 85% since 2008… that’s in the last 6 years.

How about U.S. Treasuries? Safest investment on the planet, right? Not if you need income from your bond holdings – Treasury yields have fallen by more than 50% in the last five years:
Along with index funds, savings accounts, CDs and now bonds, all of the traditional safe havens for your money are providing you lower and lower returns. How the heck will we get to a million-dollar portfolio? Maybe you believe all the rosy forecasts out there that claim investors can expect to get 7% returns per year... maybe THAT will get you to your goal. Not anytime soon. At 7% per year, you could throw $10,000 every year into the stock market and it would take you THIRTY years to reach a million-dollar goal. That also assumes the market NEVER goes down in a single year Realistic? Of course not.

Here’s a chart showing you that it takes 30 years to reach $1 million by putting $10,000 into the market every year:
You’ll reach that million-dollar goal only if you put $10,000 into the stock market every year and only if you get that 7% per year. Not only are there too many ifs in that scenario, but the reality is this: most investors simply do not have 30 years to wait. Investors who WANT to achieve their retirement goals and still BELIEVE in the retirement dream can no longer simply buy and hold. That doesn't mean buy and hold is dead, however—it isn't. But buy and hold models are projected to return that 7% per year, and we've already proven that won't get it done for you, but if you can follow some simple rules…

That's a million dollars in about eight years. Now, we expect you to be a little skeptical, but the purpose of this report is to show you HOW it can be done. First, it's done by making one simple change in how you think about your portfolio. We know many are concerned (rightly so) that stocks have gone up so far, so fast since the 2008-09 financial crisis. You may think that we’re in another bubble. Perhaps you don’t believe stocks can keep going higher. Maybe you’re worried that you’re about to “buy the top” only to “sell the bottom” yet again. We have the same concerns. That’s why what you’re about to learn is incredibly powerful for you, because if you can follow some simple rules, you’ll discover: 1. It doesn’t matter whether the market is rising or falling—you’ll have a strategy to profit in any market condition. 2. You’ll never need to worry about buying the top of the market, because our “one number” strategy ensures you buy the right stocks at the right time. 3. Using our unique investing plan, your portfolio is protected—automatically shielded—against bear markets and huge losses. You’ll see why and how in this report. This book focuses on investing in stocks using a principle called Hyper-Compounding, which allows you to accelerate the growth of your money. It breaks all of the so-called rules by giving YOU control of your money. Turn the page to learn more…
Chapter 3: The Plan
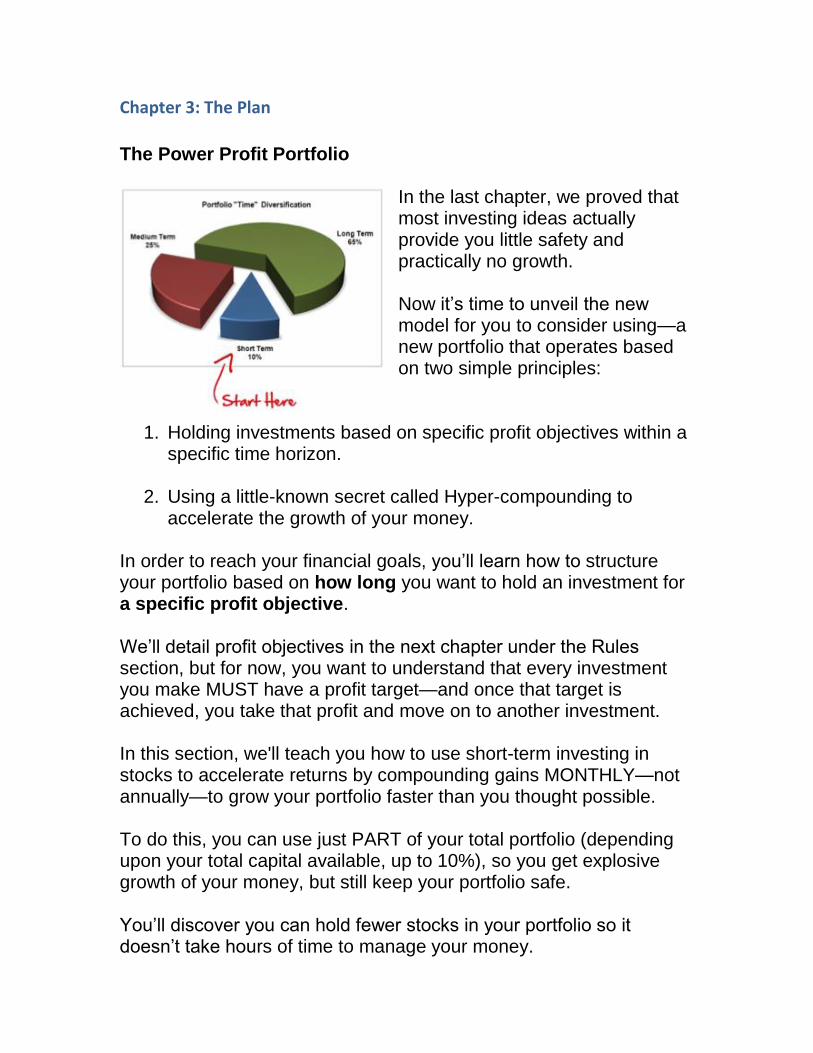
The Power Profit Portfolio
In the last chapter, we proved that most investing ideas actually provide you little safety and practically no growth. Now it’s time to unveil the new model for you to consider using—a new portfolio that operates based on two simple principles:
1. Holding investments based on specific profit objectives within a specific time horizon.
2. Using a little-known secret called Hyper-compounding to accelerate the growth of your money.
In order to reach your financial goals, you’ll learn how to structure your portfolio based on how long you want to hold an investment for a specific profit objective. We’ll detail profit objectives in the next chapter under the Rules section, but for now, you want to understand that every investment you make MUST have a profit target—and once that target is achieved, you take that profit and move on to another investment. In this section, we'll teach you how to use short-term investing in stocks to accelerate returns by compounding gains MONTHLY—not annually—to grow your portfolio faster than you thought possible. To do this, you can use just PART of your total portfolio (depending upon your total capital available, up to 10%), so you get explosive growth of your money, but still keep your portfolio safe. You’ll discover you can hold fewer stocks in your portfolio so it doesn’t take hours of time to manage your money.

As your portfolio grows, you’ll be able to incorporate additional “time horizons” into it—medium and long-term investments. The key here, however, is to begin by investing in stocks with short-term time horizons of 30-90 days, with a specific profit objective in mind. When you do this, you accelerate the rate at which your money grows. Remember, in the Index Fund chart you just reviewed, an S&P 500 index fund barely returned 3% per year—even though the S&P was up 15-25% during some of those years! That brings us to an important lesson. You may want to write this down: The key to successfully growing your portfolio is determined by increasing the annualized rate of return on your money.
The Hyper-Compounding Principle
Hyper-compounding is a strategy to increase the annual rate of return on your money by compounding your gains monthly instead of annually. Let us demonstrate the power of hyper-compounding for you.
Let’s assume you’re starting with $10,000 and you get an average Return per Month from your investments of 4%... not per year, but per month. After 12 months, you’d have $16,000. That’s an Annual Return of 60%.

We told you the key is to increase your annual rate of return, so that 4% per month is the compounding strategy. Here’s the “hyper” part of the strategy:
If you follow that same plan for a second year, starting with your $16,000 and still generating that 4% return per month, your money would grow to over $26,658 at the end of the second year. Now your annualized rate of return is over 83%.
Notice that in just two years, you more than DOUBLED your money—but you never added a single penny. Now that you’ve seen the power of hyper-compounding in action, let’s get into the simple details behind the Millionaire Blueprint Power Portfolio PLAN. Step one is to determine how much money you can start with. Remember, you’re investing in the short-term part of your new portfolio first. As your short-term portfolio grows, it feeds the medium- and long-term parts of your portfolio. This is important because most investors get frustrated trying to do everything at once when it comes to investing. You don’t have to. Start here: short-term investing. A quick note: short-term investing does not mean day trading. It means stocks or other assets you hold up to 90 days or until your specific profit objective is achieved.

The most important point here: If you have a larger portfolio, you do NOT have to take stupid risks with your money. You can take a small part—perhaps 10% of your total portfolio—and allocate it to your short-term investing “account”. Here are some potential allocations of your money, based on portfolio size:
If possible (and this will make more sense shortly), you can start with about $10,000, although we’ve had people be successful starting with just $2,500. The reason you’re doing this is risk management—to ensure that no

one stock you invest in can ever hurt your full portfolio. Again, we’ll be blunt: If you have less money to begin with, you’ll have to take on more risk because you need faster growth to get to that $10,000 point; more on that later, though. The next step is to divide your short-term investing capital into 10 equally weighted groups or “buckets”. If you’re starting with $10,000, you’ll have 10 capital buckets each with $1,000 in it to start, like this:
Short Term Investing Portfolio: $10,000 Starting Capital
Bucket #1
Bucket #2
Bucket #3
Bucket #4
Bucket #5
Bucket #6
Bucket #7
Bucket #8
Bucket #9
Bucket #10
$1,000 $1,000 $1,000 $1,000 $1,000 $1,000 $1,000 $1,000 $1,000 $1,000
Each bucket holds one stock at a time, so the maximum number of stocks you’ll hold in your Short-term Investing Portfolio is 10. This is an additional risk management tool to reduce your overall risk exposure further. This step protects your portfolio from those big losses that most people experienced in 2008-09. You begin with short-term investing to get fast growth of your money so that you start the hyper-compounding process. There’s more to our power profit portfolio, however. It includes the ability to “roll-up” a stock to a medium-term or long-term section of your portfolio. We’re only focusing on the short-term part in this training session so that we can keep it simple, but here’s what you can expect to happen in the future: Some stocks can be held for up to six months for twice the original short-term profit objective. Some stocks can continue to be held for up to one year for five times the original profit objective—and all the while, every month, you’re still

investing in that short-term part of your portfolio to get those monthly returns you need. Reminder: This is NOT day-trading. Short-term investments are stocks or other assets held from one to three months that have a specific profit objective. Once that profit objective is reached, you take your gains and repeat the process. This is how you tap into monthly compounding. In our Millionaire Blueprint program, we target between 2% and 8% returns monthly, which gives us a potential annual rate of return of 80%. What you’ll discover is that you will make more money faster with just part of your portfolio by using short-term investing with these goals in mind—and never risk losing it all. Which brings us to the second costly mistakes most investors make and segues us to The Rules part of the training… That mistake: Hope is not a strategy. In the next chapter, we’ll explain why and I’ll even share my own embarrassing mistake – one that cost me $24,000.

Chapter 4: The Rules
To be successful with this or any investment plan, you must have three things:
1. A simple, repeatable plan to come out ahead
2. Easy-to-follow rules that don’t take a lot of time
3. A smart way to protect your money
But why do most people actually LOSE money? In one word: emotion. To understand why, we’ll share a little story here. A number of years ago, I was on a Las Vegas-bound flight, seated next to a very successful man from New York. The conversation turned to gambling. I asked him why he thought most people lose money in Las Vegas. “People lose money because they don’t have triggers to quit,” the man answered. “Their emotional highs or lows get in the way of making rational decisions.” “I have two triggers: a profit trigger and a loss trigger,” he explained. “Whichever one I hit first, I pull that trigger and leave the tables for the night.” The more I thought about that idea, the more he realized that it’s the same principle when you invest: You MUST have triggers. But most investors don’t have loss triggers, they have “hope” triggers… they just hope the stock will come back. They don’t have profit triggers—they just hope the stock keeps going higher. Think about the last time you bought a stock. Did you think to yourself, “Well, I hope this works out”?

Have you ever had a stock fall by 10 or 20 or 30% and say, “Well I hope it comes back”? And have you ever had a stock go up 10, 20 or 30% and say, “Come on baby, keep going higher!”? What happened next? The stock went down and you gave back all your gains and went back to square one. Can you see why hope is a recipe for disaster—why it can wreck your money? What most investors have are “Indecision” triggers caused by fear and greed. When an investor has a stock that is performing poorly, or, when the market declines or even when the threat of a market decline exists, and surprisingly enough, fear even when the markets are moving substantially HIGHER, Fear creates indecision – that is, the failure to take action to capitalize on the market without regard to direction. Those actions can be any of, or all of, the following:
Closing a losing trade or position to preserve capital and prevent larger losses.
Leaving money off the table to protect your overall portfolio from market corrections or crashes.
Putting money into the short side of the stock market using inverse ETFs (which short the market for you).
Fear can also prevent investors from putting their money to work when markets are moving higher because they believe they’ve either missed the opportunity (buying the high) or because they believe the markets are going to suddenly “crash” leaving them with losses. Greed, on the opposite end of the spectrum, creates indecision because most investors rely on “paper” gains instead of actual returns. Paper gains are pretty. Paper gains are great for water-cooler or happy hour bragging rights. They’re still only paper gains.

Actual returns mean you took money from Wall Street. That greed factor, however, causes indecision because investors are afraid to “secure an investing gain” because they MIGHT miss out on higher gains. We call this foregone profit. Or, woulda, coulda, shoulda gains. They’re simply another form of paper gains. Chasing them is for gamblers and foolish investors. Smart investors have a system to limit losses and capture realistic gains CONSISTENTLY. I know firsthand how true that statement is. In fact, I have an embarrassing secret to share with you. It’s something I have never told anyone… Many have wondered and even asked where the concept for the Millionaire Blueprint came from. It came from my 24,000 mistake. Yes, $24,000. Here's how it happened: A number of years ago, I owned 400 shares of a company called Conexant Systems. I had acquired them at around $60 per share, which was a pretty big sum of money for me at the time. By March 2001, the stock had raced up to over $100 per share, while I was closing in on a down payment for a house. Glued to my laptop at work, I checked the price every 30 minutes. With every $5 or $10 gain, I pumped his fists as if I’d just homered off of Roger Clemens in the World Series. I stayed glued as the price went up: $110…$115…$125. The more it went up, the bigger my smile every day. Conexant closed on a Friday at $128 per share. The TV experts said it could go to $150. Internet message boards predicted $200 per share.

I couldn’t contain his excitement that weekend. I was suddenly sitting on over $51,000—and given the predictions, maybe $60,000, $80,000… even $100,000 I went to Starbucks on Sunday morning, paper in hand, to begin house hunting. Monday, I walked into work, popped open my laptop, fired up my online broker's platform when the market opened… and nearly fainted. I couldn’t believe what I saw. I refreshed the screen. Was this right? Conexant opened at $92 per share. It fell $36 per share in the first 60 seconds. A $14,000 loss—just like that. Shell-shocked, I watched all day as the price bounced between $88 and $94, but I couldn't find any reason for the drop in price. Later that night, I scoured the message boards, chat rooms and news sites, searching for something—ANYTHING—that would explain the price drop… all the while, HOPING for something or someone to say the stock would climb right back up. I couldn't eat or sleep. My dream of owning a home vanished in the blink of an eye. Worst of all, I still didn't know what to do. I was lost. Over the next several days, it was like watching a bad horror flick as the price continued to fall… $86… $82… $77… $71… Finally, at $68, I pulled the trigger and sold all 400 shares.
In the process, I’d given back $24,000! It took a mere 60 seconds for my dream of buying a home to vanish, all because I made a series of compounding errors. One: I didn't have a profit trigger or an exit strategy. I knew I WANTED to sell, but I set $60,000 as the total VALUE I wanted, rather than setting a percentage target, taking my profit and protecting it. I forgot the Cardinal Rule of Investing: You never have a gain OR a loss until you SELL. The mistake here was Indecision based on Greed and paper gains. Two: I didn't have a loss trigger. I had no protective stops in place to guard against a significant price collapse, and no plan to preserve capital. The mistake here was Indecision based on Fear following a sharp corrective move in the price of the stock. Three: I hesitated. Even when the stock did fall $36 that first day, I still failed to TAKE ACTION. Yet another fear-based indecision moment. Instead of looking at the value of the overall gain on the stock at that point in time (despite the short term decline) and protecting what profit had been achieved, I remained indecisive, because… Four: Instead of accepting the new price, I searched for reasons the stock might go back up. I was so focused on the price I WANTED that I looked for any reason to give me hope that it would recover.

In which case, Greed again exacerbated the indecision problem by looking at lost paper profits, rather than protecting EXISTING paper profits. I was lucky just to get out instead of waiting for the price to recover, because it never did. Ultimately, it became a $2 stock. This brings us back to the quotes we shared with you: “Most investors don’t have loss triggers, they have “hope” triggers… they just hope the stock will come back.” “And they don’t have profit triggers—they just hope the stock keeps going higher.” Talk about an expensive lesson. This one event caused a major shift in my life. It drove me to learn what they DON'T teach investors: things like money management, risk management and portfolio management.
Introducing Decision Triggers
As part of our Millionaire Blueprint rules, we give you the key to success: Remove emotion from the equation. Now, we’ll be honest: We, too, get excited when our stocks go up and mad when our stocks go down. However, by using what we call Decision Triggers, we can remove emotion from the equation—and by emotion, we mean that deadly trio of Fear, Greed and Hope. What are decision triggers? They are your specific profit and loss targets that you “pull” when one or the other is reached. By using Profit and Loss Triggers, you establish your profit target and
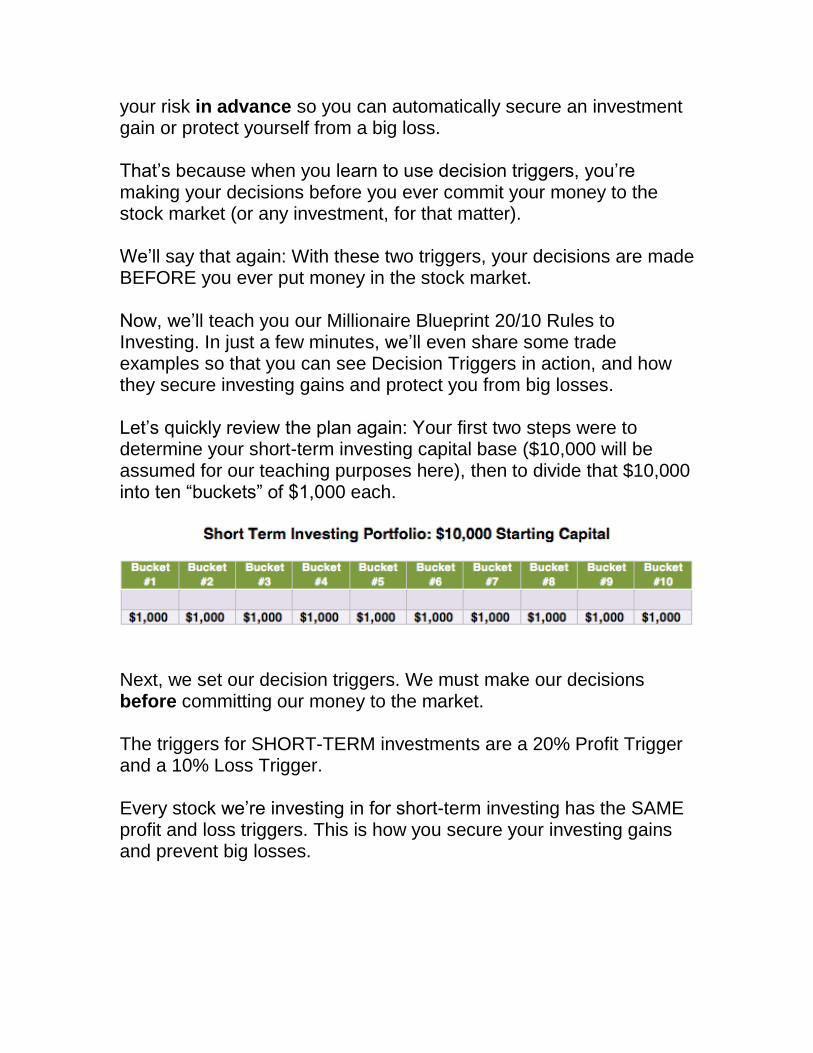
your risk in advance so you can automatically secure an investment gain or protect yourself from a big loss. That’s because when you learn to use decision triggers, you’re making your decisions before you ever commit your money to the stock market (or any investment, for that matter). We’ll say that again: With these two triggers, your decisions are made BEFORE you ever put money in the stock market. Now, we’ll teach you our Millionaire Blueprint 20/10 Rules to Investing. In just a few minutes, we’ll even share some trade examples so that you can see Decision Triggers in action, and how they secure investing gains and protect you from big losses. Let’s quickly review the plan again: Your first two steps were to determine your short-term investing capital base ($10,000 will be assumed for our teaching purposes here), then to divide that $10,000 into ten “buckets” of $1,000 each.
Next, we set our decision triggers. We must make our decisions before committing our money to the market. The triggers for SHORT-TERM investments are a 20% Profit Trigger and a 10% Loss Trigger. Every stock we’re investing in for short-term investing has the SAME profit and loss triggers. This is how you secure your investing gains and prevent big losses.

You use Decision Triggers to make the only important decisions necessary: When to take gains and when to keep losses small. When you hit your 20% target, you need to take those gains to begin the process of hyper-compounding, because you’ll use ALL of the capital from that first gain on the next investment or trade that you make. Here’s a quick example so that you can see the compounding process at work: Let’s assume you use one of your 10 buckets to buy stock in XYZ Corp. at $10 a share (for purposes of simple math, we won’t account for trade commissions here). You would hold 100 shares at $10 per share and set your decision triggers: 20% Profit Trigger = $12.00 per share 10% Loss Trigger = $9.00 per share Now XYZ’s price reaches your 20% profit trigger. You decide (rightly) to take your 20% gain. Your $1,000 bucket is now worth $1,200.

The next month, you invest the FULL $1,200 into ABC Corp., again at $10 per share. You now hold 100 shares at $10 per share and set your decision triggers: 20% Profit Trigger = $12.00 per share
10% Loss Trigger = $9.00 per share
Again, your 20% profit trigger is reached. You take that 20% gain and your $1,200 bucket is now worth: $1,440. That extra $40 is the compounding part. You’re now making money on the money you made from the original investment gain. THIS is what so many investors fail to do. You’ll often find the need to be realistic about gains. From time to time, you may hold a stock that gets up to 15% or 18% and just doesn’t have the oomph to hit that 20% trigger. What should you do? Take the gain. Worrying about 2% or 3% is foolish and leads to losses. You also must protect your money. To do that, you’ll rely on your Loss Trigger. Now, to be clear, no investment strategy has ever been developed that wins 100% of its trades. It simply doesn’t exist. Where most investors go wrong is letting a small loss turn into a big loss. That’s what you want to prevent by using a Loss Trigger. A quick note: A Loss Trigger does not have to be and should not be a Stop Loss Order. It is a decision point where you have time to analyze the fundamental reason for owning the stock.

Has anything changed? Are there other forces at work driving down the value of your stock holding? Has the company reported negative news or reduced future earnings expectations? If so, when the 10% Loss Trigger is reached, that’s the time to preserve capital and move on to another opportunity. To illustrate the importance of the Loss Trigger and to show you that you don’t need to “win” every trade, let’s review a Win Expectancy Chart.
Capital Gain/Loss Total Total Gain
$1,000 20% $1,200 $1,000 20% $1,200 $1,000 20% $1,200 $1,000 20% $1,200 $1,000 -10% $900 $1,000 -10% $900 $1,000 -10% $900 $1,000 -10% $900 $1,000 -10% $900 $1,000 -10% $900 $10,000 $10,200 2%
This chart shows what happens to your money following the 20/10 Rules to Investing if you LOSE six out of every 10 trades you make. This is the power of Risk/Reward, which in our rules is 2 to 1. Here, you began with $10,000, had four trades that reached their 20% profit trigger and six trades that reached their 10% loss trigger. The result? Your portfolio still made money. Read that again: Your portfolio still made money. 2% to be exact. Even if you hit just that minimal target every month, you’ll still significantly outperform the market, as 2% per month, when hyper-compounded, returns over 26% annually.

Compare that to the average investor’s 3% per year and you’re doing exceptionally well. More to the point, it means that from month to month, you can have stronger months where your overall gain is 6-8% and smaller months of 1% to 2%, and you’ll still grow your portfolio rapidly. It also removes the emotional pressure of “getting it right.” When you know that you do NOT have to win 100% of your trades, you’ll be empowered to make better decisions about keeping those losing trades small—because you know that the profits on your winning trades will more than make up the losses. When you put all of this together—the Plan and the Rules—what you’ll discover is that you don’t have to be afraid to hit singles and doubles. Coming out ahead in the stock market with your investments is just like the game of baseball: You’ll score more often with these realistic gains by consistently hitting those singles and doubles rather than swinging for the fences and the home-run trade. Now, let’s turn to those other two time frames, medium and long term. This will give you some perspective—especially if you have a larger portfolio—of how to utilize the exact same profit/loss trigger approach.
Chapter 5: The Right Stocks
If a Wall Street firm tells you exactly what kinds of companies they want to buy, would you listen? In April 2015, an investment note from Wall Street investment banking firm Morgan Stanley
did exactly that: Telegraphed to investors the kinds of stocks the company aspires to buy in the future.

Here’s the important text from that note: “A systematic way to think about this might be to look for stocks with reasonably robust long-term earnings growth forecasts that trade at a discount to the market… the flip side would be to avoid names with low expectations for earnings growth that trade at substantial premiums…” Morgan Stanley, April 2015 Let’s break this down into two simple parts:
1. Investment firms do not want to pay high prices for growing
companies.
2. Investment firms want to avoid overpriced companies with little
to no growth prospects.
How, then, can you find companies trading at a discount to the market that have long-term earnings growth? As you’re about to discover, you can find those companies quickly and simply with our unique “One Number” fundamental analysis approach. This One Number—which we call the PE Gap—instantly tells you whether a company is undervalued relative to its future earnings growth. This is exactly what Wall Street firms such as Morgan Stanley are looking for: growth at a discount.
The PE Gap
Put simply, the PE Gap is the difference between a stock’s price to earnings ratio and its expected earnings growth rate. We’ll walk through the very simple calculation to get the PE Gap in a moment, but once you master this fundamental analysis tactic, you’ll be able to find and own stocks with strong profit growth expectations that are trading at a discount to the market.
It’s the stock market equivalent of buying a stock on sale, without the market having to crash in order to do so. It should be stressed here that these are not “value” stocks. They are not beaten down, has-been companies hoping for some miraculous turnaround. Often, they are companies that have been overlooked by Wall Street, or misunderstood in the way the company creates revenue. This one tactic can get you ahead of Wall Street. Because the market doesn’t price stocks based on a company’s value today—the market prices stocks based on the future value of the company. Here is how simple this One Number is:
2 Components to the PE Gap
You need two pieces of information in order to calculate the PE Gap. Both are very simple to get. Component #1: Price-to-Earnings Ratio First, you need the price-to-earnings ratio. This is a quick way to assess whether a stock is trading at a discount or at a premium to the overall market. Historically, a PE ratio of 16 is considered a fair value for stocks on the S&P 500 Index. You’ll often find companies trading well above and well below that number, but use that simply as a guideline to begin. The problem, however, with the way PE ratios are expressed on most financial platforms is that they are presented as “rear view” numbers. That is, the PE ratio you’ll find on investment sites are based on what the company earned in the PREVIOUS 12 months—not what the company is expected to earn in the NEXT (future) 12 months.

This is an important distinction because it means investors are using a number that looks backward in time, when Wall Street is pricing stocks forward in time. PE ratios, as used presently, tell you today’s valuation. You, as a trader or investor, are not buying today’s valuation—you’re buying the future value of a company. Thus, we’ve changed the first component, the PE ratio, to determine the future valuation of the company by using a forward PE ratio instead of the rear-view mirror ratio. Component #2: Earnings Growth Rate Referring back to Morgan Stanley’s investment note, recall that Wall Street is looking for “reasonably robust long-term earnings growth forecasts.” This brings us to the second component: The Earnings Growth Rate. The earnings growth rate tells you how quickly a company is expected to grow its earnings, or profits. Earnings estimates, provided by market analysts, forecast out four quarters of earnings and two years of earnings (we’ll see an example of this shortly). From those numbers, however, we can project the rate at which a company is expected to grow those earnings. By doing so, we then have the second component to our PE Gap calculation: the earnings growth rate. Often, the fastest moving stocks are those exceeding high earnings growth expectations. Combining the Two Components When we put these two components together, what we get then is a forward-looking PE ratio which tells us instantly whether a company is over- or undervalued relative to its future earnings.

By doing so, we can, in fact buy that growth at a discounted price. The PE Gap, then, can be a predictive fundamental analysis tool.
The PE Gap Calculation
We’ve created a simple calculation for the PE Gap—so simple a third grader can do it:
We’ll walk through the entire calculation in a moment, but here are the quick rules regarding the outcome of the PE Gap calculation:
How to Get the Information You Need We use Yahoo! Finance because it's quick and simple, but most major financial portals have this information. Here is how to get the information you need in Yahoo!

First, enter the ticker symbol of the stock you’re analyzing… we’ll use American Airlines for our example here… that’s stock symbol AAL.
Then go the Analysts Estimate page… you’ll see the link circled here on the lower left.
On the Analyst Estimates Page, you’ll find the three numbers you need to calculate the PE Gap.
Current Price
Current Year’s Earnings Estimates
Next Year’s Earnings Estimates
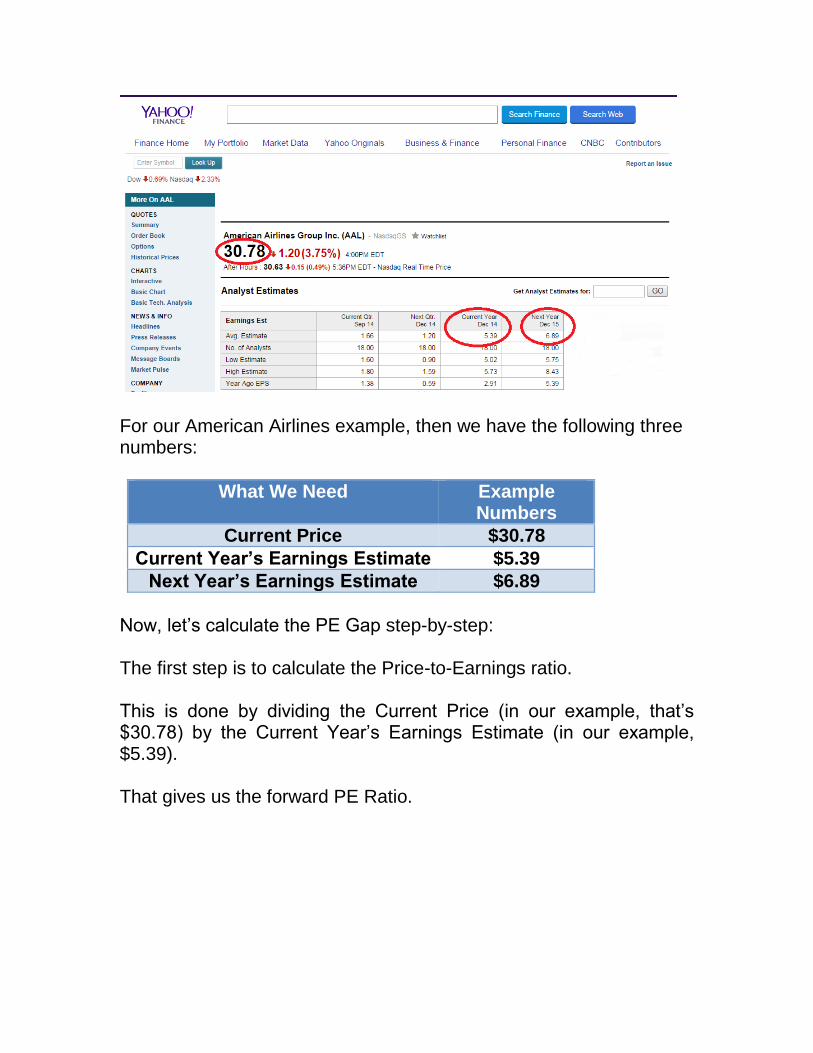
For our American Airlines example, then we have the following three numbers:
What We Need Example Numbers
Current Price $30.78
Current Year’s Earnings Estimate $5.39
Next Year’s Earnings Estimate $6.89
Now, let’s calculate the PE Gap step-by-step: The first step is to calculate the Price-to-Earnings ratio. This is done by dividing the Current Price (in our example, that’s $30.78) by the Current Year’s Earnings Estimate (in our example, $5.39). That gives us the forward PE Ratio.
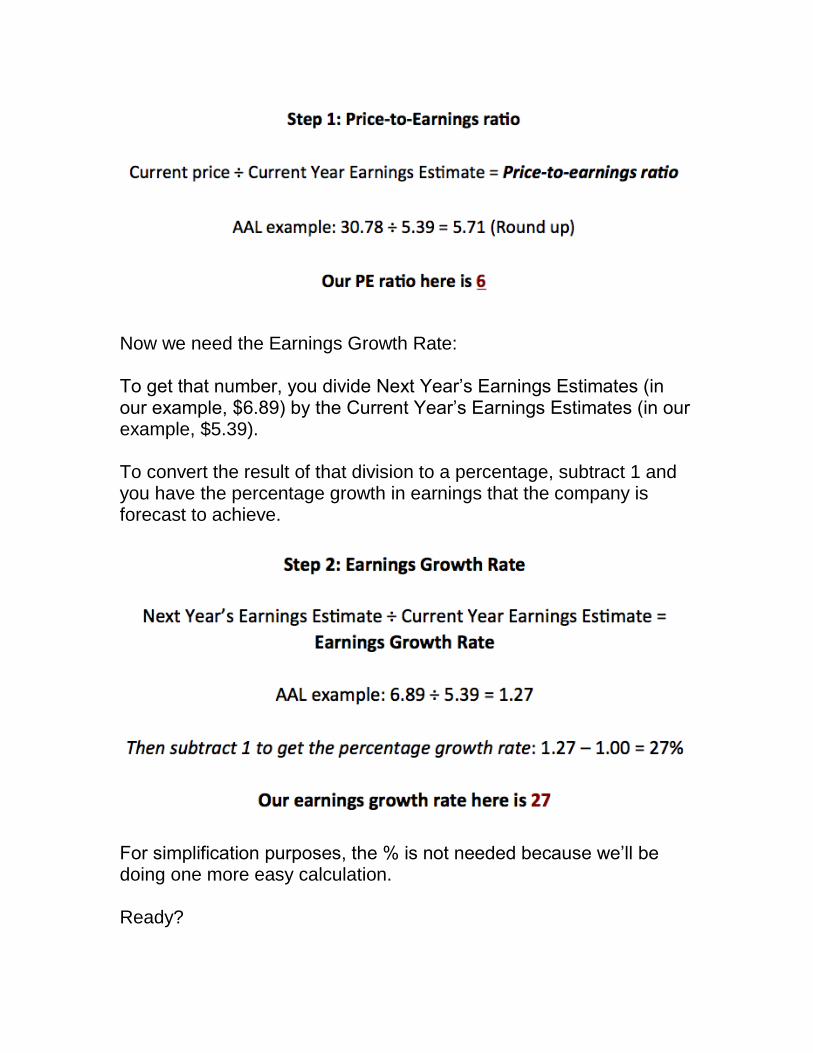
Now we need the Earnings Growth Rate: To get that number, you divide Next Year’s Earnings Estimates (in our example, $6.89) by the Current Year’s Earnings Estimates (in our example, $5.39). To convert the result of that division to a percentage, subtract 1 and you have the percentage growth in earnings that the company is forecast to achieve.
For simplification purposes, the % is not needed because we’ll be doing one more easy calculation. Ready?
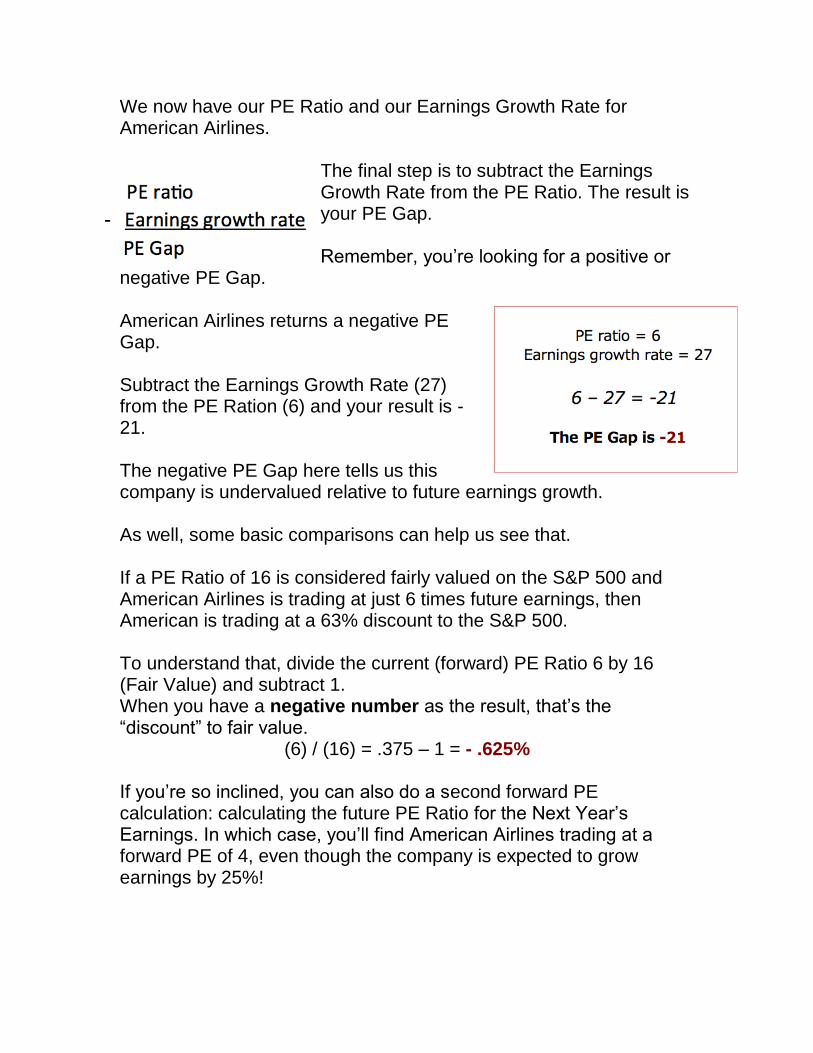
We now have our PE Ratio and our Earnings Growth Rate for American Airlines.
The final step is to subtract the Earnings Growth Rate from the PE Ratio. The result is your PE Gap. Remember, you’re looking for a positive or
negative PE Gap. American Airlines returns a negative PE Gap. Subtract the Earnings Growth Rate (27) from the PE Ration (6) and your result is -21. The negative PE Gap here tells us this company is undervalued relative to future earnings growth. As well, some basic comparisons can help us see that. If a PE Ratio of 16 is considered fairly valued on the S&P 500 and American Airlines is trading at just 6 times future earnings, then American is trading at a 63% discount to the S&P 500. To understand that, divide the current (forward) PE Ratio 6 by 16 (Fair Value) and subtract 1. When you have a negative number as the result, that’s the “discount” to fair value.
(6) / (16) = .375 – 1 = - .625% If you’re so inclined, you can also do a second forward PE calculation: calculating the future PE Ratio for the Next Year’s Earnings. In which case, you’ll find American Airlines trading at a forward PE of 4, even though the company is expected to grow earnings by 25%!

This example helps illustrate how quickly and simply you can calculate the PE Gap, and know immediately whether you have an undervalued company trading at a discount to the market. To Get More Training On the PE Gap Method, Watch this Video
Chapter 6: The Millionaire Blueprint Portfolio
You now have the three pieces to the Millionaire Blueprint Portfolio:
The Plan: Hyper-compounding your returns every month to
accelerate
The Rules: Using Decision Triggers to protect gains and
prevent substantial losses.
The Right Stocks: The only predictive fundamental analysis
tactic that consistently finds stocks with price momentum.
Now is the time to make small changes in the way you approach your investing. You'll also be able to control your money and the risks to your money more efficiently.
Chapter 7: Get Started –Today
While our goal in this book is to help you build a million dollar portfolio, the truth is we can’t simply wave a magic wand and hand you a million dollars (if we could, we’d do that for ourselves first), but what we will do is provide you with a step-by-step Blueprint you can use to achieve Millionaire status. A million dollars may seem like an arbitrary figure (it isn’t as we explained), but the reality is most investors in the U.S. and around the world remain stuck in neutral with their portfolios.

Throughout this book, we showed you why your money IS NOT growing fast enough for you to reach your financial goals, and why that million dollar goal is such an important milestone in your journey to be financially self-sufficient. To bring everything together, in this chapter we’ll give you a very simple, step-by-step blueprint that you can use to turn a small portfolio—even if you’re just beginning as an investor—into a million dollars (or more).
10 Step MillIonaire Blueprint
Here then, is the step-by-step approach using the Millionaire Blueprint as you’ve learned it. Step 1: Set your financial goal. If you watched the short video on the Retirement Gap, you had a chance to use our Retirement Gap Calculator. Using the output of that calculator, then you know how much your portfolio needs to grow each year to achieve your financial goals. Watch the Retirement Gap Video Here (link) We’ve set the initial goal for you at $1,000,000. You may choose to raise or lower that goal. Either way, this is a critically important step because most investors don’t have a goal – they have arbitrary numbers or ideas, like “having enough to retire” without knowing how much they’ll need.

Step 2: Determine how much money you have to get started. This is the important step to solving the problem of having enough money so that you never have to worry about it. How much is your portfolio worth right now? Do you have a portfolio? Are you new to investing? Do you have sizable savings already but are looking to add to your nest egg? Once you know how much you have to begin with, you can move on to executing the Millionaire Blueprint plan. Step 3: Allocate capital to your Millionaire Blueprint short-term portfolio. Now that you know how much money you have to begin with, the next step is to “fund” your short-term portfolio. For simplicity, we recommend starting with $10,000 as the minimum. If you have a larger portfolio you have the option of starting with that amount, or, using up to 10% of your total portfolio. For example, a $250,000 portfolio could begin the Millionaire Blueprint plan with a short-term investing portfolio of $25,000. The remaining portfolio amount could be allocated to other trading or investing activities. Smaller portfolios should target the $10,000 minimum starting point. At the outset, as we explained previously, this means you will take on some short-term risk because you need growth. Using the rules, however, you’ve seen that your portfolio is still protected against downside risk. Important note: it is not necessary to start a new portfolio or brokerage account to do this. As you’ve seen in the Portfolio Management section, you can download the capital management spreadsheets to keep track of your 10 buckets and to track your overall progress.

Step 4: Divide the short-term portfolio into ten (10) capital groups (or buckets). This is the capital division step in the Millionaire Blueprint plan and serves as your money management and risk management strategy. By dividing your short-term portfolio into 10 buckets, you are ensuring that no one stock that you hold can wreck your total portfolio. A $10,000 starting portfolio, then, would have 10 capital groups of $1,000 each to begin with. Step 5: Find the right stocks to use with your short-term portfolio. We’ve shared with you the PE Gap methodology we use in the Millionaire Blueprint program. Do-it-yourself investors now have a powerful strategy to find stocks on their own without hours and hours of research. (MB Link for short video or webinar invitation) Step 6: Once you’ve found 10 stocks to buy, use one capital group for each stock. Pretty simple step, isn’t it? This is, however, the hardest step for most investors because they “worry” about getting the best price, or the lowest price, or whether you should buy at the open, or buy on Tuesday…and on and on and on. Quick tip: Get out of your own way and put your money to work for you. Don’t chase prices on stocks because you think you’ll save a nickel or a dime. Let the market do the work for you and let the rules protect you. Step 7: Apply the 20:10 Rules to your stocks Once you’ve bought shares in each of the 10 stocks in your short-term portfolio, you must apply the “Decision Triggers,” to ensure you secure your investing gains or protect and preserve capital in the event of a loss.
You’ve seen the simplicity of applying the rules: multiply your entry price by 1.2 to set your 20% Profit Trigger and multiply your entry price by .9 to set your Los Trigger. You now have set a ceiling and a floor – let the market go to work for you. Step 8a: Close trades at 20% Profit Trigger. This is the all-important “remove emotion (greed) from the equation” step. When you hit that 20% Profit Trigger, do not rethink or try to outsmart yourself. Take your 20% gain and move on to the next trade opportunity. This is how you begin the process of hyper-compounding, after all. You can’t compound a gain if you don’t take it, right? So, take the gain. Step 8b: Close trades at 10% Loss Trigger. The opposing emotion (fear) must also be removed from the equation. If your stock reaches the 10% Loss Trigger, protect and preserve capital. The rationale for the trade no longer exists and you do not want a small loss turning into a big loss. It should also be stated here that another emotional factor is “ego” – that is, the inability to let go of a trade because it means admitting your were wrong. Please don’t do this to yourself. You had a good reason for making the trade in the first place. It didn’t work out. Go find another trade and let the next one work out. Step 9: Allocate the full capital in your buckets to each successive trade you place. This step means you will repeat Steps 5 through 8. You will likely discover that you may not necessarily buy ten new stocks every single month as some trades will not have reached either the 20% Profit Trigger or the 20% Loss Trigger.
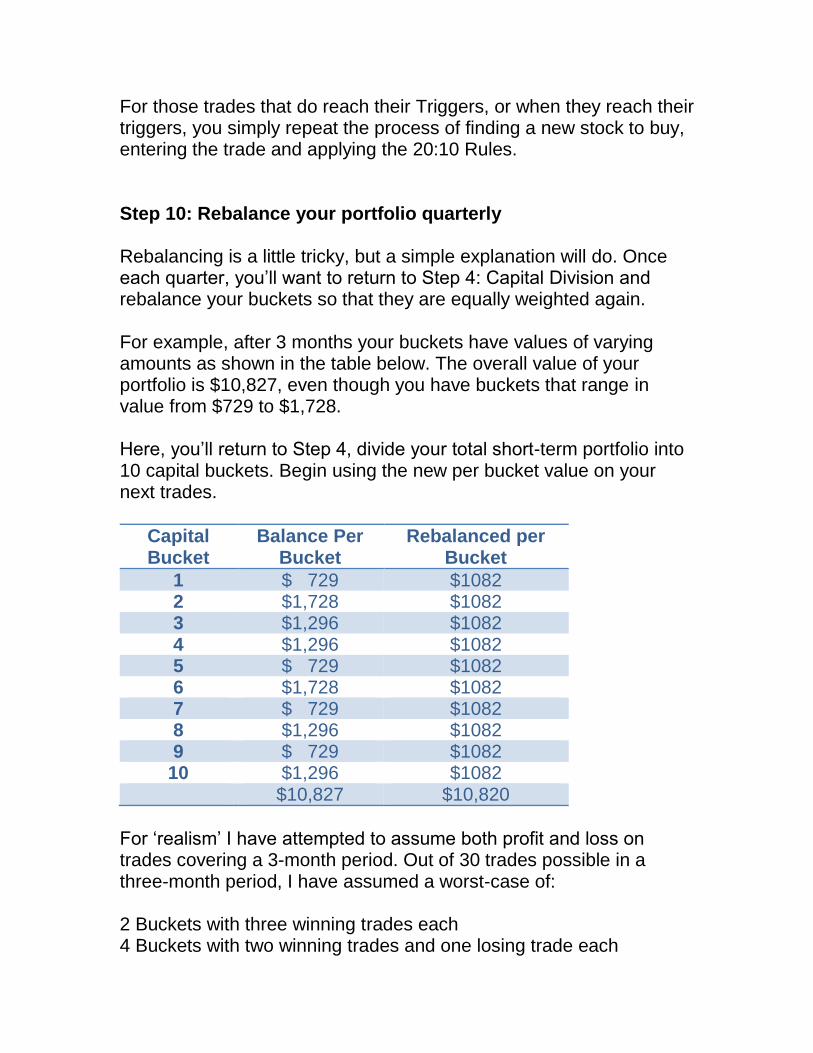
For those trades that do reach their Triggers, or when they reach their triggers, you simply repeat the process of finding a new stock to buy, entering the trade and applying the 20:10 Rules. Step 10: Rebalance your portfolio quarterly Rebalancing is a little tricky, but a simple explanation will do. Once each quarter, you’ll want to return to Step 4: Capital Division and rebalance your buckets so that they are equally weighted again. For example, after 3 months your buckets have values of varying amounts as shown in the table below. The overall value of your portfolio is $10,827, even though you have buckets that range in value from $729 to $1,728. Here, you’ll return to Step 4, divide your total short-term portfolio into 10 capital buckets. Begin using the new per bucket value on your next trades.
Capital Bucket
Balance Per Bucket
Rebalanced per Bucket
1 $ 729 $1082 2 $1,728 $1082 3 $1,296 $1082 4 $1,296 $1082 5 $ 729 $1082 6 $1,728 $1082 7 $ 729 $1082 8 $1,296 $1082 9 $ 729 $1082
10 $1,296 $1082 $10,827 $10,820
For ‘realism’ I have attempted to assume both profit and loss on trades covering a 3-month period. Out of 30 trades possible in a three-month period, I have assumed a worst-case of: 2 Buckets with three winning trades each 4 Buckets with two winning trades and one losing trade each
4 Buckets with three losing trades each That’s 16 losing trades and 14 winning trades. Notice that your portfolio is still ahead by 8% over those three months, which means your average return per month is 2.67%. And if you’ll recall, we told you our goal is to achieve between 2% and 8% returns each month. While this example is on the lower end of that scale, it should impress upon you that you do not need every trade to be a winner (see also: greed, ego). This is the value of the 2:1 Risk to Reward ratio you’ll experience when using the 20:10 Rules. Your winners will more than make up for cutting losers fast. You now have a simple plan, a set of rules and a strategy to selecting stocks which when put together and followed will help you achieve that Million Dollar portfolio.

Chapter 8: Avoid Common Investing Mistakes
As we mentioned earlier, two simple emotions—fear and greed—can kill your investing success. Both emotions are equally destructive and can shove you completely off the path to a quality retirement… unless you can stick to some very easy rules, which we’ll teach you in the next few chapters. Investors who risked even a single penny in the stock or real estate markets over the past 14 years—or know someone who has—understand intimately the pain of losing money and how it can alter your mindset. If they deny it, they’re bold-faced liars or subconsciously blocking their memories. No one went unscathed in the longest bear market in history between 2000 and 2003. The same holds true for the financial fiasco of 2008-2009. During those periods, trillions of dollars evaporated from retirement accounts at the same time that the immense wealth created by home equity disappeared in the blink of an eye. With each disaster, investors should have walked away with hardcore lessons and learned how to weather financial storms. However, to this day, many still suffer hangovers from the past and don’t know quite how to kick them. They keep making the same mistakes, yet expect results—the true definition of insanity inside and outside the investment community. The cure, as you will soon read, is within reach. What are the biggest contributors to losing money with investments? A few of the regular suspects include:
Not having the discipline to sell positions at a profit or even a
small loss

Buying too late and chasing performance
Lack of portfolio diversity
General ignorance about the stock market or real estate market
Taking on too much risk
Being too conservative
Emotions can explain all of the above and more. Here’s why: Now that we are all expected to be on this earth a very long time—much longer than our parents—outliving our money in retirement or not being able to retire at all are huge concerns. Here are some greedy behaviors that can throw you off course. Holding Investments too Long. This can hold true in bull, sideways or bear markets—it all depends on what stocks, mutual funds, ETFs, bonds, even money markets you’re invested in at the time. For a worst-case scenario, let’s look at the destructive power of a bear market. Since most investors don’t take the time to do market research, they’re unaware of the precious time and earning power lost in bears—time that only the very youngest investors can afford to lose. Many think it’s no big deal to gain 50% then lose it all back (or more) because it takes them back to square one. That’s simply not the case. If you suffer a 50% loss on your portfolio, you’ll need 100% to bring it back where you started. For example, a 50% loss on $10,000 leaves you with $5,000. In order to get back to $10,000 you need 100% growth on that $5,000 just to break even. The reverse is also true. If you attain 50% growth on $12,000, you’ll have $18,000. Yet a decline of just 33% (the average decline during a bear) will put you back to ground zero. Here’s why: 1/3 of $18,000 is $6,000. Subtract $6,000 from $18,000 and you’re back to your original $18,000.

Now you really need to make up for lost time and money, so you … Take on Too Much Risk and in the Wrong Places It’s one thing to be young, in your prime earning years, and itching to dabble in the stock market. So you invest in a stock a coworker may have told you about that tripled in price and is expected to go even higher. No harm, no foul—as long as you can afford to lose that amount you invest. And, if the stock does triple in price again, your office pal is a hero. However, if you are 15-20 years from retirement, risk is something you need to seriously consider. All too often, we have our eye on the prize (what we can make) instead of the risk (what we can lose). That’s when costly mistakes can happen. When investors experience losses in their portfolios (think: the 2008-2009 financial crisis and 2000-2003’s tech bubble), they often panic and look for ways to make up for lost principal and time. They invest in stocks with tremendous growth potential, ignoring the tremendous risk that accompanies it—a perfect strategy if you want to work the rest of your life! Even worse, investors fall for scams like Bitcoin, false real estate bottoms, or speculative marijuana stocks that aren’t even regulated by the SEC. It’s hard to “just say no” when the media continuously talks up the triple- and quadruple-digit gains investors are pocketing. If they’re as greedy as we suspect, though, many haven’t realized a penny of profit, instead waiting for that next pop in price that sends them over the selling edge—which, of course, may never come. Even legitimate investments like commodities and emerging markets can pose dangers. Look at gold in the last five years. If you bought at $800 an ounce in March 2009 and sold at the peak price of $1,884 in
Sept. 2011, you were golden, indeed. If you bought gold at that same high two years ago and still own it today, you’re down about 30%. Same goes for emerging markets, represented by the stability of the BRIC nations of Brazil, Russia, India and China. A five-year chart of the MSCI Emerging Markets index looks like an EKG reading of a heart attack waiting to happen. Greed can get you in a heap of trouble, and so can… Investing too Conservatively or Not at All On the contrary, becoming paralyzed after losing money in investments can also permanently scar your portfolio and odds of retiring on time or at all. Perhaps you no longer contribute to your company-matched 401(k) and give up on the beauty of compounded growth. Consider this: a $10,000 annual contribution increasing at a clip of 14% will be worth over $2 million in 25 years. You just need to know how to navigate around your choices, select the right allocation for the right time and let it ride. It’s just as bad to continue contributing and leave it in one of those bland mutual funds that 401(k) plans tend to offer, designed to reflect your age and appropriate risk. Even worse, you choose a bond fund or plain vanilla Treasuries, when interest rates are at historic highs and stocks and equity ETFs are on the rise. Maybe you have your savings sitting in a bank account or money market when interest rates are at all-time lows, collecting little more than dust. Lost opportunity can have just as many consequences as lost principal when retirement is creeping up on you, and time is of the essence. If you’re like most people today, wealth is not your primary goal. Buying a home, sending your children to college and having enough
left over to fund a quality retirement long after you hang up your working shoes are top priorities. Of course, if you become a multi-millionaire in the process, that’s just hollandaise sauce on the nest egg. Unfortunately, if you’re like most people today, you may be too reliant on the government to add to your coffers with Social Security, yet there’s never been a more important time to cut the ties. According to the National Academy of Social Insurance, one-third of seniors today are in that boat, counting on Social Security for 90% or more of their income. Considering the deteriorating state of the system, we can’t even rely on its survival, let alone our crutch in retirement. Approximately 63 million Americans collect Social Security benefits today. By 2035, that number could soar to 91 million. With a potential $124 trillion shortfall over the next 75 years, we may very well live to see its demise. Add another $222 trillion in unfunded pension and healthcare obligations for government retirees, and you’re better off not expecting a dime from Uncle Sam. It’s time to take matters into your own hands by following an investment strategy with your unique goals in mind. What you’re about to read is a new strategy for your portfolio—a model that allows for better control over risk, better control over returns and smarter control over your future. It’s called the Millionaire’s Blueprint and it only requires 15 minutes of your time each month. In exchange, you’ll get a lifetime of financial security and peace of mind when you most deserve it.

Chapter 10: Review of Goals and Objectives
The Millionaire Blueprint is based on setting realistic goals with clearly defined objectives that allow you to build wealth over time. There’s a famous line from Lewis Carroll’s masterpiece, Alice in Wonderland, which nicely sums up most investors’ approach to managing their money. The line is delivered by the inimitable Cheshire Cat, who tells Alice, “If you don’t know where you are going, any road will take you there.” The fact is that you must know where you’re going when it comes to your investment plan—that’s the first critical component addressed by the Millionaire Blueprint. The second critical component is to provide you with the knowledge and the tools necessary to carry out that plan. It’s not enough to simply know where you’re going. You must also have to have a reliable vehicle to get there. If we were forced to boil the Blueprint down to one sentence, it may read something like this: This plan is designed to help you take small, consistent profits that build up to big numbers over time. If given the luxury of a corollary sentence, it might read like this: The plan also helps reduce risk by never allowing big losses. Sounds easy, doesn’t it? Yet as we all know, sometimes the easiest things are arrived at through a whole lot of painstaking effort. Small, Consistent Wins the Race The real key to successfully growing your money is to achieve small, consistent profits over time. Now, ask yourself this question: How much does a $10 stock have to rise in price to grab a 20% profit?

If you’ve done your Sell Limit calculation, you already know the answer is a mere two dollars. But what do most people hope to achieve when buying a $10 stock? They think about the stock jumping to $15, $20, $30 or even $50 per share. Of course, these kinds of moves happen, but they represent totally unrealistic expectations. Moreover, failure to achieve these kinds of results in one or two stocks often leads to frustration and disappointment with more modest gains. Our advice: Don't be afraid to hit singles and doubles. As mentioned earlier, winning in the markets is a lot like baseball: You’ll score more often and win more games by consistently hitting singles and doubles than swinging for the fences at every at bat. If you seek consistent, realistic profits with your trading capital, you’ll find the market will give you those 20% returns far more frequently than it will give you those 50%, 100% or 1,000% returns. That, in essence, is the foundation of the Millionaire Blueprint and the 20/10 rules. It’s also another reason why we recommend using a percentage of your total portfolio with this plan—so you can be excited, knowing that you’re regularly growing your portfolio on a monthly basis. Just like a building, you must start with a solid foundation before you begin construction. That’s exactly what you possess now: a foundation to build your portfolio over the next decade and beyond.
Notes on Taxes
Inevitably, a skeptic will complain that we have not addressed issues of taxes. They're correct. Here's why: First, no two persons have exactly the same tax structures. Therefore, it is impossible to model out the impact of your personal tax situation and the impact it would have on you reaching the million-dollar goal. Second, you'll be dealing with a broader range of tax issues: Capital gains on short-term investments, dividend and interest income (from stocks and bonds), capital gains on long-term investments, income from investments (taxed at the individual's tax rate), write-downs from losses incurred in short- and long-term investments, and more. That's the problem with trying to forecast taxes: It's too broad to accurately apply. Also, given the current political environment, it's impossible to predict future changes to tax codes, tax rates and state-based taxes. Suffice it to say, if you follow this strategy, your money will grow very fast and you will likely face tax issues. Taxes will not significantly impede your progress. It MAY delay your timeline in reaching your million-dollar goal by a few months to a year. But at the end of the day, if you're making a decision NOT to grow your portfolio by using Time Diversification simply because you might have to pay taxes, you will fall behind and fail to reach your financial goals. Never, ever make an investing decision—or fail to make one—simply because you might owe taxes to your respective federal or state government. Get qualified tax investment advice and understand what taxes you may be liable for. Be sure to get corresponding write-off advice, as well. Finally, please make sure that you use or take advantage of tax-deferred accounts (that's what they're there for) to help you avoid taxes until you NEED the income—and at that, potentially lowering your tax exposure.

Final Thoughts
In any portfolio model, inherent flaws will appear. I’m going to address the key flaws in the Millionaire Blueprint and use them to help you navigate around those flaws. Understand that a “flaw” does not mean something doesn’t work; it does not mean you can’t still reach that million-dollar goal. It means you have to be prepared for times when things don’t go according to “plan." I’ll give you an example: If you’ve ever been to Las Vegas (and I have, too many times to recount), what is the noisiest, most crowded gaming table in the casinos? The craps table. Why? In a word: Action. Constant action. Between the rolls of the dice and the myriad bets that can be placed, you have no shortage of “action” to take part in at the craps table. Gamblers crave action. Do you know who else tends to crave action? Investors and Traders. It’s one reason futures and options continue to see rises in popularity. Constant action. One of the flaws in the Millionaire Blueprint is that you do not have a great deal “to do.” I guess you could call it “boring-vesting”. Even in our program, we enter trades at the beginning of each month and do nothing until, typically, one of our Triggers is reached. I know most of you like ‘action’ - that’s why the Millionaire Blueprint
Power Portfolio is structured to use just part of your overall portfolio’s capital. I’m giving you “play money” with the rest of your capital. If you’ll stick to the plan and the rules and use the right stocks, you’ll find you’ll capture realistic, consistent gains in this little slice of your portfolio pie. In the long run, this slice of pie will become the fastest growing piece of your portfolio. Just realize that you won’t have daily excitement. A second flaw, though I have attempted to address it, revolves around what to do when your short-term portfolio reaches significantly larger levels. By that I mean $100,000, $250,000 and larger. Here’s the flaw exposed: You will find that you will not want to “lay” $25,000 on a single stock position; you’ll also find that, in some cases, you may not be able to get enough shares; or, that trading costs increase when buying more than 1,000 or 5,000 shares (depending upon your broker). And if you reach that million-dollar mark, you probably won’t want to risk $100,000 on a single position. The math behind reaching the million-dollar goal is designed to show you what’s possible and what it takes to get there. You will likely find that some months slow you down, while other months speed you up. The larger your portfolio, however, the more you can slice your portfolio pie. You’ll also be able to invest in more stocks for gains and break your portfolio capital down to maintain your risk and money management integrity. That’s the reason we created the Millionaire 50 - to provide large portfolio investors a safe way to get consistent market-beating returns, without additional risk.

We’ve covered a lot of ground in the Millionaire Blueprint, and we hope you’ve come away with a good sense of what the plan is all about, and how the trading and portfolio management techniques we use can help you accumulate a lot of wealth over a relatively short time. If you simply do nothing else but execute the 20/10 trading rules in your own portfolio, we’ve succeeded in helping you evolve. With these simple strategies for managing your money, protecting your downside, capturing gains and diversifying risk, you effectively have the plans needed to build a sturdy financial structure. The next phase of construction is all about picking the right materials for the job—that involves the right stocks to use with the Millionaire Blueprint Rules. Thank you for reading. We wish you Godspeed in your future trades.

The Millionaire Blueprint Program
In our discussions with investors and from surveys we've conducted, one important point we learned was how difficult it can be for investors to find the right stocks to use with this Short-term Investment plan. That's why we created the Millionaire Blueprint Program. It contains everything you need to combine the right stocks with the right plan to grow your portfolio with consistent, realistic gains, month after month. The Millionaire Blueprint Program provides monthly stock selections to its exclusive group of investors, based on the probability of reaching that 20% target price (or better). Millionaire Blueprint Members benefit from the Three R's of the Millionaire Blueprint Program: Research, Recommendations and Rules Market Research and Monthly Stock Recommendations are made by Lead Investor, Jim Woods and Main Street Investor editor, John Hutchinson. Together they offer over 40 years of stock market experience to members of the program. Each month, James and John provide members with a special report, which includes an overall assessment of the stock market, and up to five (5) new stock selections. The report is simple to read, easy to execute and contains the top stock selections to be used with the Millionaire Blueprint Rules. Stock selections include WHEN TO BUY and at what prices to buy stocks, specific Profit Targets and Stop Losses. Essentially, Jim and John do all the work for members. All members need to do is enter their orders, set their profit targets and stop losses and go on about their day.

How do we select the right stocks? We use a unique, proprietary program that uses both fundamental and technical analysis to scour the stock market each week to find those stocks that have the best opportunity for short-term gains. Remember, we're looking for stocks that will appreciate 20% or more in a time frame of one to six months. That requires using BOTH technical and fundamental analysis to eliminate the usual suspects and get down to real prospects for gains. Overall, we employ specific technical indicators and fundamental data points to assess stocks. While we use our model on a daily basis, we wait until the end of each month to find those stocks that have the odds in our favor. As well, we've recently introduced a unique barometer that quantifies short-term outlooks. You may not have heard of or paid much attention to PE Gaps, so we'll brief you here on the importance. PE Gaps tell us when the odds favor a short term re-pricing of a company's stock price. This is critical, especially when considering whether a stock has the probability of going up in price. Together, it is the combination of Qualitative, Quantitative, Fundamental and Technical Analysis that gives Millionaire Blueprint members their advantage in the markets. To learn more and to see all of the pieces of this Million Dollar Puzzle put together for you, use the link below for our online video-based mini-class (it’s complimentary). Take The Millionaire Blueprint Mini-Class Here

About Jim Woods
Jim Woods is a contributing writer to Traders Reserve and the Expert Stock Analyst for the Millionaire Blueprint Program (www.millionaire-blueprint.com). Jim has a long and distinguished career in the investment industry as a writer with reputable publications, including Traders Reserve, Main Street Investor, IBD, InvestorPlace, Street Authority and others.
He formerly worked directly with William O’Neill of Investors Business daily and authored training courses in the CAN-SLIM stock selection methodology. He’s is the co-author of The Wealth Shield (Amazon.com) with John Hutchinson, and Billion Dollar Green: Profit from the Eco Revolution. Jim is independently ranked by TipRanks as the #2 stock picker on the web with a verified 75% success rate and average gain of 17.5%. Jim holds a B.A. in Philosophy from UCLA, is a former Army Paratrooper, and a self-described radical for capitalism. He's described in professional circles as "The Renaissance Man" for his expertise in composing and performing music, horsemanship and rodeo competitions, martial arts and combat marksmanship. About John Hutchinson

John has been involved with the stock markets for over 18 years, managing investments, studying portfolio models and teaching technical and fundamental analysis techniques. John is a Managing Partner at Traders Reserve and a contributing analyst and writer for The Millionaire Blueprint Program (www.millionaire-blueprint.com) and the
Millionaire 50. He is the developer of the Millionaire Blueprint and Millionaire 50 investing strategies and the 20/10 Rules. He is a member of the Forbes Finance Council, and together with Jim Woods, co-authored The Wealth Shield (Amazon.com). He lives in the suburbs of Detroit. As the joke goes, he’s always the last to leave Detroit…and yes he remembers to turn out the lights.
Traders Reserve Copyright All material in this report is, unless otherwise stated, the property of Traders Reserve, LLC. Copyright and other intellectual property laws protect these materials. Reproduction or retransmission of the materials, in whole or in part, in any manner, without the prior written consent of the copyright holder, is a violation of copyright law. A single copy of the materials available through this course may be made, solely for personal, noncommercial use. Individuals must preserve any copyright or other notices contained in or associated with them. Users may not distribute such copies to others, whether or not in electronic form, whether or not for a charge or other consideration, without prior written consent of the copyright holder of the materials. Contact information for requests for permission to reproduce or distribute materials available through this report is listed below: