the marketing bill for agricultural products - agecon...
TRANSCRIPT
The Marketing Bill for Agricultural Products
By Kenneth E. Ogren
Statistics on the marketing bill for agricultural products presented in this article supplement and amplify those originally prepared by the author for the chapter "How Much Does Market-ing Cost Us?" published in Marketing—The Yearbook of Agriculture, 1954 (pp. 14-18). In the article published here the author discusses the interpretation of these statistics with special reference to the use of a "value added" concept.
AMERICAN CONSUMERS spend a consid-erable proportion of their income each year
for goods derived from agricultural products. A large part of these expenditures is for charges added to the cost of farm products after the first sale by the farmer-producer. Questions fre-quently arise as to the amount of the total market-ing bill 1 and why farmers receive such a small part of consumer expenditures for agricultural products.
A marketing bill of almost $50 billion.—The es-timated marketing bill for consumer goods de-rived principally from domestically produced agricultural products was $48.7 billion in 1954 (table 1). A comparable estimate of the value of these products at the farm level gives $21.3
Consumer expenditures for the products to-$75 billion, but that amount includes about
$5 billion in excise taxes for tobacco products and alcoholic beverages. These excise taxes were de-ducted from the marketing bill.
Users of data in table 1 are reminded that these statistics are not comparable with estimates of consumer expenditures for these product groups, which are available from the United States De-partment of Commerce, nor with total cash re-ceipts of farmers from sales of their products.
As used in this article, the marketing bill measures the difference between consumer expenditures for farm products and payments received by farmers for equiva-lent quantities of produce. In this context, marketing includes all operations involved in moving agricultural products from farms on which they are produced to con-sumers at the time and in the form they are bought. This definition of marketing differs from the concept ac-cepted in some industries. As Frederick V. Waugh has commented, "agricultural economists have rather gen-erally followed a broad definition of marketing, covering not only buying and selling but also such subjects as transportation, processing, and storage." (Readings on Agricultural Marketing. Iowa State College Press. Ames, Iowa. 1954. Page 2.)
Total consumer expenditures for food, clothing and shoes, alcoholic beverages, and tobacco prod-ucts, in 1954, as reported by the Department of Commerce are about a third higher. The esti-mate of $75 billion in table 1 excludes expendi-tures for imported products such as coffee, tea, bananas, sugar, pineapples, wool, and silk. Also excluded are some nonfarm products such as sea-foods, and clothing made from synthetic fibers. In addition, a part of consumer expenditures for food as reported by the Department of Commerce represents the valuation of food consumed on farms where produced, and does not enter the marketing system.
Cash receipts from farm marketings in 1954 likewise were more than a third higher than the farm value given in table 1. The difference be-tween the $21.3 billion and total cash receipts of $30 billion is accounted for by sales of products for export, industrial, and military use; by sales of nursery products, forestry products, and other miscellaneous products not included in consumer expenditures for the subgroups in table 1; by CCC loans and an increase in stocks; 2 and by interf arm sales of livestock, feed, and seed. In addition to its narrower scope, the farm value in table 1 is more of a "net" figure than total cash receipts, because it does not include these "interplant" transfers of livestock, feed, and seed.
A final note should be added regarding the scope of this estimate of the marketing bill for agricultural products. This bill was estimated only for the major groups of consumer items that are derived principally from agricultural prod-
A net increase in CCC loans and a net increase in stocks also added to the difference between farm cash receipts in 1954 and the farm value of products bought by consumers. Receipts from CCC loans, which are in-cluded in cash receipts from farm marketings, represent value of loans minus value of redemptions.
• 101
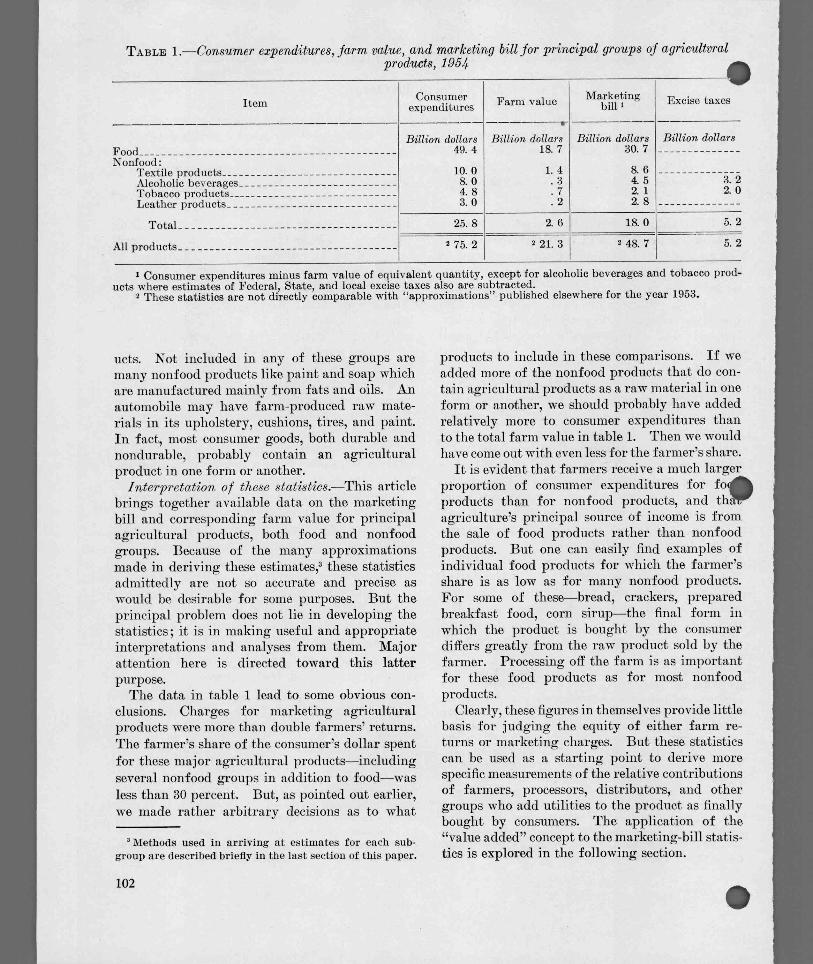
TABLE 1.—Consumer expenditures, farm value, and marketing bill for principal groups of agricultvral products, 1954
Item Consumer expenditures Farm value
--.-
Marketing bill 1
'goy
Excise taxes
Food Nonfood:
Textile products Alcoholic beverages Tobacco products Leather products
Total
All products
Billion dollars 49. 4
10. 0 8. 0 4. 8 3. 0
Billion dollars 18. 7
1. 4 . 3 . 7 . 2
Billion dollars
4. 5 2. 1
30. 7
8. 6
2. 8
Billion dollars
3. 2 2. 0
25. 8 2. 6 18. 0 5. 2
2 75. 2 2 21. 3 2 48. 7 5. 2
1 Consumer expenditures minus farm value of equivalent quantity, except for alcoholic beverages and tobacco prod-ucts where estimates of Federal, State, and local excise taxes also are subtracted.
2 These statistics are not directly comparable with "approximations" published elsewhere for the year 1953.
ucts. Not included in any of these groups are many nonfood products like paint and soap which are manufactured mainly from fats and oils. An automobile may have farm-produced raw mate-rials in its upholstery, cushions, tires, and paint. In fact, most consumer goods, both durable and nondurable, probably contain an agricultural product in one form or another.
Interpretation of these statistics.—This article brings together available data on the marketing bill and corresponding farm value for principal agricultural products, both food and nonfood groups. Because of the many approximations made in deriving these estimates,3 these statistics admittedly are not so accurate and precise as would be desirable for some purposes. But the principal problem does not lie in developing the statistics; it is in making useful and appropriate interpretations and analyses from them. Major attention here is directed toward this latter purpose.
The data in table 1 lead to some obvious con-clusions. Charges for marketing agricultural products were more than double farmers' returns. The farmer's share of the consumer's dollar spent for these major agricultural products—including several nonfood groups in addition to food—was less than 30 percent. But, as pointed out earlier, we made rather arbitrary decisions as to what
Methods used in arriving at estimates for each sub-group are described briefly in the last section of this paper.
products to include in these comparisons. If we added more of the nonfood products that do con-tain agricultural products as a raw material in one form or another, we should probably have added relatively more to consumer expenditures than to the total farm value in table 1. Then we would have come out with even less for the farmer's share.
It is evident that farmers receive a much larger proportion of consumer expenditures for fo products than for nonfood products, and thill agriculture's principal source of income is from the sale of food products rather than nonfood products. But one can easily find examples of individual food products for which the farmer's share is as low as for many nonfood products. For some of these—bread, crackers, prepared breakfast food, corn sirup—the final form in which the product is bought by the consumer differs greatly from the raw product sold by the farmer. Processing off the farm is as important for these food products as for most nonfood products.
Clearly, these figures in themselves provide little basis for judging the equity of either farm re-turns or marketing charges. But these statistics can be used as a starting point to derive more specific measurements of the relative contributions of farmers, processors, distributors, and other groups who add utilities to the product as finally bought by consumers. The application of the "value added" concept to the marketing-bill statis-tics is explored in the following section.
102 •
"Value Added" as a Yardstick
"Value added by manufacture" is a statistic that for many years has been used by the United States Bureau of the Census in its periodic Census of Manufactures. Value added is calculated, accord-ing to the Bureau, "by subtracting the cost of ma-terials, supplies, containers, and fuel consumed, purchased electric energy, and contract work from the value of products shipped." This statistic "measures the approximate value created in the process of manufacture. It provides the most satisfactory census measure of the relative im-portance of given industries. . . ." 4
Recently, the importance of developing a sim-ilar concept of "value added by marketing" has been stressed in several articles and reports.5 They point out that the general use of value added in manufacturing and costs in marketing or distribu-tion has left the impression that manufacturing adds value whereas distribution adds costs.
Standard textbooks in marketing, both agri-cultural and general, invariably emphasize that necessary functions are performed by the market-ing system in getting goods from the producer to the consumer. In the traditional utility frame-
4trk, marketing activities create time, possession, d place utilities, whereas the production process
creates form utility. To many people, however, production means something useful and necessary, because it changes the form of the product, and
4 U. S. Bureau of the Census. ANNUAL SURVEY OF MAN-UFACTURES: 1953. Washington. U. S. Govt. Printg. Off. 1955, pp. 10-11.
5 Beckman, Theodore N. THE VALUE ADDED CONCEPT AS APPLIED TO MARKETING AND ITS IMPLICATIONS, FRONTIERS IN MARKETING THOUGHT, pp. 83-99. (Contributed papers, Conference of American Marketing Association, Decem-ber 27-28, 1954; published by the Bureau of Business Research, Indiana University).
MOIlieSOIL David D., ON MEASURING VALUE ADDED BY MARKETING, FRONTIERS IN MARKETING THOUGHT, pp. 111-36.
Eggert, Robert J., and others, VALUE ADDED BY DIS-TRIBUTION, BOSTON CONFERENCE ON DISTRIBUTION. Boston Chamber of Commerce. Proc. 25 (1953) : 65-71.
In a panel review of governmental statistical pro-grams before the Joint Congressional Economic Commit-tee, the U. S. Chamber of Commerce "tagged as a 'serious gap' in the Federal statistical program the lack of data on the value added to goods as they pass through whole-sale and retail outlets." (New York Journal of Com-merce, Feb. 10, 1955, p. 6.)
•
marketing, though useful and necessary, is re-garded as less essential. Wholesaling, retailing, and other distributive activities without question do add value to agricultural products ; they are a part of the overall economic activity of creating goods and services to satisfy human needs and wants.
Actually, the derivation of statistics that apply solely to production or marketing is difficult and, for many purposes, perhaps unnecessary. Farm-ers do perform some distributive functions through roadside and door-to-door sales of prod-ucts, though with the increased specialization in our economy this is of declining importance. Manufacturing firms carry out sales activities that are clearly distributive in nature. Cutting up a beef carcass by a retailer would probably be clas-sified as the creation of form utility or production. Many other examples could be cited to illustrate the difficulties in classifying establishments as exclusively production or marketing.
Here, we shall consider the application of the value added concept in marketing by the type of establishment or institutional approach, rather than by functions. The functional approach is not without value but it is more difficult to apply with the available data.6
Value added by agriculturre.—Of the $75 billion that consumers spent for farm products in 1954 (table 1), an estimated $15 billion represent value added by agriculture. This measures the gross returns received by agriculture for its labor and capital, excluding the cost of production ma-terials and other services which are furnished by the nonagricultural part of our economy.
The definition of "value added" given by the Bu-reau of the Census was applied directly in deriving this estimate of $15 billion. The farm value which was used as a starting point is analogous to the "value of products shipped" used in the Census of Manufactures. The value of inter-mediate products originating outside agriculture of $6.3 billion was derived from total farm expen-ditures for feeds and seeds purchased (adjusted for cash farm receipts from sale of feeds and seeds), fertilizer and lime, operation of motor
° Professor Monieson concluded in his paper, referred to earlier, that "at present, it is not too practical to meas-ure value added by marketing activities or functions."
103
vehicles, electricity, containers, and other miscel-laneous supplies and expenses, and gross rents paid to nonfarm landlords. The total expendi-ture for these items was reduced by a fourth to allow for the part of the total farm output not represented here.? In some instances, gross rents paid to nonfarm landlords may appropriately be included in value added by agriculture, particu-larly if value added were being related to total investment in agriculture rather than the agri-cultural labor force and capital owned by it.
A "value added" statistic for the total agricul-tural industry was first published in 1951 by Ken-drick and Jones.8 Although the authors call their statistic "gross national farm product," they refer to it as a "value added concept" which "measures the value added by the industry to the products it consumes in production." They compute the gross national farm product by deducting value of materials used up in production (including gross rents paid to nonfarm landlords) from total value of farm output which includes cash receipts, value of products consumed on farms where pro-duced, gross rental value of farm homes, and the net change in all farm inventories. With statis-tics available for farm value (or value of ship-ments), the method used to derive value added in this paper was easier to apply than the pro-cedure used by Kendrick and Jones in deriving an estimate for the total agricultural output, al-though if allowance were made for difference in coverage the two methods should give identical results.
Value added by nonagricultural groups.—Ac-cording to data from the Annual Survey of Man-ufactures for 1953, value added by manufacturing establishments to the consumer goods included in our statistics amounted to at least $16 billion.
This relationship of the farm output (to which the statistics in this article relate) to total farm output was derived from data on the utilization of farm products prepared for Agriculture Handbook 91, MEASURING THE SUPPLY AND UTILIZATION OF FARM COMMODITIES. U. S. Dept. Agr. (in manuscript).
° Kendrick, John W. and Jones, Carl E., GROSS NATIONAL FARM PRODUCT IN CONSTANT DOLLARS, 1910-50, SURVEY OF CURRENT BUSINESS : September, 1951, pp. 13-19. An article in the August 1954 issue of that periodical, by L. Jay Atkinson and Carl E. Jones, FARM INCOME AND GROSS NATIONAL PRODUCT, revised and extended the sta-tistics and analysis presented in the first article.
Value added to farm food products amounted to an estimated $8 billion; alcoholic beverages abodli $1.5 billion ; tobacco products close to a dollars ; and leather products something over a billion dollars. Of the more than $10 billion added by the textiles and apparel industries, per-haps $5 billion was added to the value of house-hold products made from domestic farm-produced fibers. Even a rough approximation is difficult because of the importance of synthetic fibers, im-ported wool, and nonhousehold uses. Value added by manufactures is not yet available for 1954 but "national income by industrial origin" published in the July 1955 issue of the Survey of Current Business indicates that there was no appreciable change in these groups between 1953 and 1954. Trends in national income by industrial origin are similar to those in the value added data al-though the income data exclude, in addition to cost of materials, such items as depreciation charges and indirect business taxes,
Subtracting from the total marketing bill the $16 billion which represent value added by man-ufacturing firms, the remaining $33 billion rep-resent value added by distribution agencies—local assembly and wholesaling, retailing (including eating and drinking places) , and transportation. Also included in this residual are the supple and materials bought by these distributive agen-cies and manufacturing establishments from other segments of the economy (table 2).
Retailing establishments account for the largest single portion of the residual item. Wholesaling and transportation agencies take much smaller parts. In arriving at value added by distributive agencies, the cost of packaging materials, other supplies, and purchased utilities would be de-ducted from the gross margin. These data are not generally available, but financial statements for some of these companies indicate that these deductions are not a large part of gross margin. Based on available data on gross margins and sales of retailing establishments, however, it would ap- pear that value added in retailing accounts for perhaps 50 percent or more of the $33 billion. Transportation probably is around 10 percent of this residual. The transportation bill for food
For more complete description of these differences, see the footnote to a table on pp. 176-177 of NATIONAL INCOME, 1954 edition, U. S. Dept. Commerce.
104 •
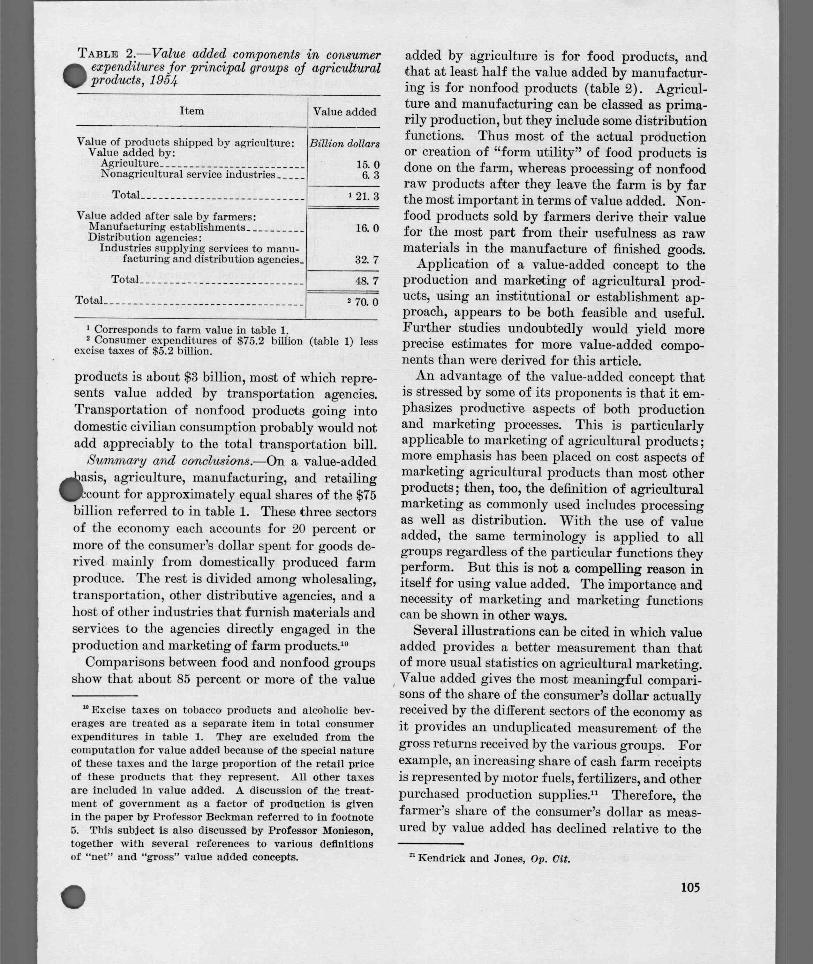
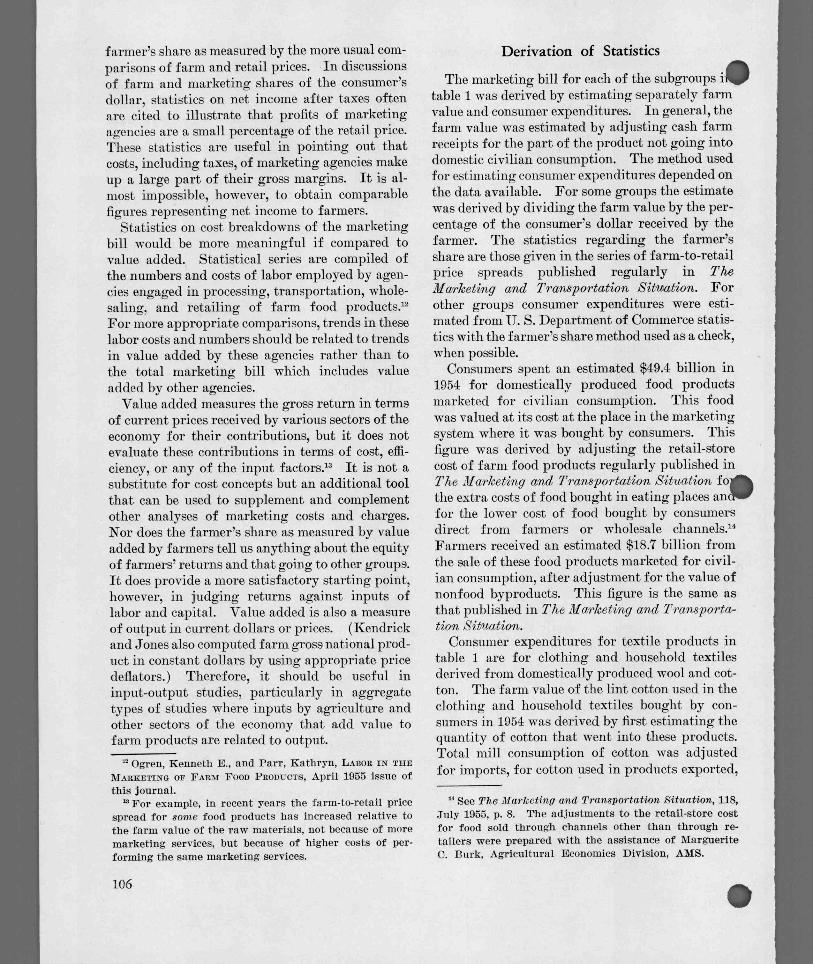
TABLE 2.—Value added components in consumer
•expenditures for principal groups of agricultural
W products, 1.954
Item Value added
Value of products shipped by agriculture: Billion dollars Value added by:
Agriculture 15. 0 Nonagricultural service industries 6. 3
Total 1 21. 3
Value added after sale by farmers: Manufacturing establishments 16. 0 Distribution agencies:
Industries supplying services to manu-facturing and distribution agencies.. 32. 7
Total 48. 7
Total 2 70. 0
I Corresponds to farm value in table 1. 2 Consumer expenditures of $75.2 billion (table 1) less
excise taxes of $5.2 billion.
products is about $3 billion, most of which repre-sents value added by transportation agencies. Transportation of nonfood products going into domestic civilian consumption probably would not add appreciably to the total transportation bill.
Summary and conclusions.—On a value-added
diasis, agriculture, manufacturing, and retailing count for approximately equal shares of the $75
billion referred to in table 1. These three sectors of the economy each accounts for 20 percent or more of the consumer's dollar spent for goods de-rived mainly from domestically produced farm produce. The rest is divided among wholesaling, transportation, other distributive agencies, and a host of other industries that furnish materials and services to the agencies directly engaged in the production and marketing of farm products.1°
Comparisons between food and nonfood groups show that about 85 percent or more of the value
" Excise taxes on tobacco products and alcoholic bev-erages are treated as a separate item in total consumer expenditures in table 1. They are excluded from the computation for value added because of the special nature of these taxes and the large proportion of the retail price of these products that they represent. All other taxes are included in value added. A discussion of the treat-ment of government as a factor of production is given In the paper by Professor Beckman referred to in footnote 5. This subject is also discussed by Professor Monieson, together with several references to various definitions of "net" and "gross" value added concepts.
added by agriculture is for food products, and that at least half the value added by manufactur-ing is for nonfood products (table 2) . Agricul-ture and manufacturing can be classed as prima-rily production, but they include some distribution functions. Thus most of the actual production or creation of "form utility" of food products is done on the farm, whereas processing of nonfood raw products after they leave the farm is by far the most important in terms of value added. Non-food products sold by farmers derive their value for the most part from their usefulness as raw materials in the manufacture of finished goods.
Application of a value-added concept to the production and marketing of agricultural prod-ucts, using an institutional or establishment ap-proach, appears to be both feasible and useful. Further studies undoubtedly would yield more precise estimates for more value-added compo-nents than were derived for this article.
An advantage of the value-added concept that is stressed by some of its proponents is that it em-phasizes productive aspects of both production and marketing processes. This is particularly applicable to marketing of agricultural products ; more emphasis has been placed on cost aspects of marketing agricultural products than most other products; then, too, the definition of agricultural marketing as commonly used includes processing as well as distribution. With the use of value added, the same terminology is applied to all groups regardless of the particular functions they perform. But this is not a compelling reason in itself for using value added. The importance and necessity of marketing and marketing functions can be shown in other ways.
Several illustrations can be cited in which value added provides a better measurement than that of more usual statistics on agricultural marketing. Value added gives the most meaningful compari-sons of the share of the consumer's dollar actually received by the different sectors of the economy as it provides an unduplicated measurement of the gross returns received by the various groups. For example, an increasing share of cash farm receipts is represented by motor fuels, fertilizers, and other purchased production supplies." Therefore, the farmer's share of the consumer's dollar as meas-ured by value added has declined relative to the
n Kendrick and Jones, Op. Cit. • 105
farmer's share as measured by the more usual com-parisons of farm and retail prices. In discussions of farm and marketing shares of the consumer's dollar, statistics on net income after taxes often are cited to illustrate that profits of marketing agencies are a small percentage of the retail price. These statistics are useful in pointing out that costs, including taxes, of marketing agencies make up a large part of their gross margins. It is al-most impossible, however, to obtain comparable figures representing net income to farmers.
Statistics on cost breakdowns of the marketing bill would be more meaningful if compared to value added. Statistical series are compiled of the numbers and costs of labor employed by agen-cies engaged in processing, transportation, whole-saling, and retailing of farm food products.12 For more appropriate comparisons, trends in these labor costs and numbers should be related to trends in value added by these agencies rather than to the total marketing bill which includes value added by other agencies.
Value added measures the gross return in terms of current prices received by various sectors of the economy for their contributions, but it does not evaluate these contributions in terms of cost, effi-ciency, or any of the input factors 13 It is not a substitute for cost concepts but an additional tool that can be used to supplement and complement other analyses of marketing costs and charges. Nor does the farmer's share as measured by value added by farmers tell us anything about the equity of farmers' returns and that going to other groups. It does provide a more satisfactory starting point, however, in judging returns against inputs of labor and capital. Value added is also a measure of output in current dollars or prices. (Kendrick and Jones also computed farm gross national prod-uct in constant dollars by using appropriate price deflators.) Therefore, it should be useful in input-output studies, particularly in aggregate types of studies where inputs by agriculture and other sectors of the economy that add value to farm products are related to output.
12 Ogren, Kenneth E., and Parr, Kathryn, LABOR IN THE MARKETING OF FARM FOOD PRODUCTS, April 1955 issue of this journal.
For example, in recent years the farm-to-retail price spread for some food products has increased relative to the farm value of the raw materials, not because of more marketing services, but because of higher costs of per-forming the same marketing services.
Derivation of Statistics
The marketing bill for each of the subgroups 1111 table 1 was derived by estimating separately farm value and consumer expenditures. In general, the farm value was estimated by adjusting cash farm receipts for the part of the product not going into domestic civilian consumption. The method used for estimating consumer expenditures depended on the data available. For some groups the estimate was derived by dividing the farm value by the per-centage of the consumer's dollar received by the farmer. The statistics regarding the farmer's share are those given in the series of farm-to-retail price spreads published regularly in The Marketing and Transportation Situation. For other groups consumer expenditures were esti-mated from U. S. Department of Commerce statis-tics with the farmer's share method used as a check, when possible.
Consumers spent an estimated $49.4 billion in 1954 for domestically produced food products marketed for civilian consumption. This food was valued at its cost at the place in the marketing system where it was bought by consumers. This figure was derived by adjusting the retail-store cost of farm food products regularly published in The Marketing and Transportation Situation foil' the extra costs of food bought in eating places an for the lower cost of food bought by consumers direct from farmers or wholesale channels.'4 Farmers received an estimated $18.7 billion from the sale of these food products marketed for civil-ian consumption, after adjustment for the value of nonfood byproducts. This figure is the same as that published in The Marketing and Transporta-tion Situation.
Consumer expenditures for textile products in table 1 are for clothing and household textiles derived from domestically produced wool and cot-ton. The farm value of the lint cotton used in the clothing and household textiles bought by con-sumers in 1954 was derived by first estimating the quantity of cotton that went into these products. Total mill consumption of cotton was adjusted for imports, for cotton used in products exported,
14 See The Marketing and Transportation Situation, 118, July 1955, p. 8. The adjustments to the retail-store cost for food sold through channels other than through re-tailers were prepared with the assistance of Marguerite C. Burk, Agricultural Economics Division, AMS.
106 •
and for cotton used in industrial products—tires,
Itgging, insulation, twine and cord, etc.15 The tio of the quantity of cotton that was used for
clothing and household textiles for United States consumption to the total quantity of lint cotton produced was applied to cash farm receipts from sales of lint cotton to obtain the farm value. As these data on the utilization and marketing of cotton are available for crop years (beginning in August) the farm value for 1954 is the average of. the 1953 and 1954 crop years.
Mill consumption of apparel wool in 1954 was about double the domestic production. -Wool used in industrial products and products exported is relatively small. Therefore, most of the cash receipts from wool in 1954 are included in the farm value of textile products.
The first step in estimating consumer expendi-tures for clothing was to prorate total expendi-tures for clothing (as reported by the Department of Commerce) by type of fabric. This prorating was based on the percentages of the value of the purchases by the apparel industry of the different fabrics—wool, cotton, rayon, and so on. The estimates for wool and cotton clothing were then adjusted to allow for imported fibers which are a
substantial part of the total for wool. It was ssumed that a major part of the $2.4 billion
reported by the U. S. Department of Commerce for semi-durable housefurnishings (towels, sheets, and so on) was made up of cotton products.
The percentage of consumer expenditures repre-sented by the farm value corresponds approxi-mately with those obtained in farm-to-retail price spread series. However, the direct estimate of consumer expenditures described in the preceding paragraph yielded more consistent year-to-year trends than those obtained by inflating the ad-justed farm receipts from cotton and wool by
Adjustment for industrial use is based on data for 1953 and preliminary data for 1954, published by the National Cotton Council of America in "Cotton Counts Its Customers," April 1955.
farmer's share percentages based on a limited number of cotton and wool items.
Cash farm receipts from the sale of tobacco leaf (adjusted for exports and change in stocks) were divided by the farmer's share of the retail cost of tobacco products to obtain an estimate of total consumer expenditures. An alternative method was used for deriving estimates of farm value and consumer expenditures. Consumer expenditures for cigarettes, cigars, and other products, re-ported separately by the Department of Com-merce, were adjusted for imports on the basis of quantity data. Farmer's share percentages were then applied to obtain farm value. The two methods gave almost identical results. Statistics on tobacco products are more adequate, partly be-cause of data collected for tax purposes, so it is not surprising to come up with better results than for some other groups, especially textile products. With the exception of local taxes, the excise taxes, which are given separately in table 1, are from data compiled by the Tobacco Division, AMS, from reports of the Internal Revenue Service, and other revenue reports.
Consumer expenditures for alcoholic beverages were derived directly from estimates by the De-partment of Commerce with a downward adjust-ment of about 10 percent to allow for value of im-ported products. With the statistics now avail-able it is impossible to arrive at an exact estimate of farm value of ingredients going into alcoholic beverages, but it is known that this is a small figure; so a large percentage error does not have a significant effect on the total farm value and marketing bill. Industry reports on quantities of ingredients formed the basis for the estimate of farm value. Federal and State taxes on alcoholic beverages are available because of tax reports.
The farm value of leather products was derived mainly from estimates of imputed byproduct values made in connection with price-spread and marketing-bill computations for meat products. Consumer expenditures are estimated from Com-merce and Census reports on shoes and other leather products.
• 107