the m 6.3 christchurch, new zealand, earthquake of ... · 2 eeri special earthquake report — may...
TRANSCRIPT
1
EERI Special Earthquake Report — May 2011
From February 22 to March 19, 2011, a team organized by the Earthquake Engineering Research Institute (EERI) and the Pacific Earthquake Engineering Research (PEER) Center investigated the effects of the Christchurch earthquake. Led by Mary Comerio, UC Berkeley, and Ken Elwood, University of British Columbia, the team included Russell Berkowitz, Forell/Elsesser; Michel Bruneau, University at Buffalo; James Dismuke, ARUP Australia; Henri Gavin, Duke University; Na- than Gould, ABS Consulting, Inc.; Kishor Jaiswal, U.S. Geological Sur- vey; Thomas Kirsch, Johns Hopkins University; Tao Lai, AIR Worldwide; Justin Marshall, Auburn University; Ronald Mayes, Simpson Gumpertz & Heger; Judith Mitrani-Reiser, Johns Hopkins University; Troy Morgan, Tokyo Institute of Technology; Tim Mote, ARUP Australia; Lori Peek, Colorado State University; Sri Sritharan, Iowa State University; Jeannette Sutton, University of Colorado-Colorado Springs; Fred Turner, California Seismic Safety Commission; Anne Wein, U.S. Geo- logical Survey; and Mark Yashinsky, Caltrans. Tom O’Rourke of Cornell University visited Christchurch the week of April 1st with the TCLEE team and contributed to this report. Robert Fleischman of the University of Arizona also contributed.Six team members received support from the National Science Founda-tion (NSF) grant #CMMI-1132381 to focus on the specific themes of building collapse, resilience, and the use of social media in risk communi-cation. Logistical and travel support was provided by PEER. Many other organizations also contributed travel support: ABS Consulting, AIR World- wide, ARUP, Auburn University, the Canadian Seismic Research Net-work, Forell/Elsesser, Johns Hop-kins University, Simpson Gumpertz and Heger, the Tokyo Institute of
Learning from Earthquakes
The M 6.3 Christchurch, New Zealand, Earthquake of February 22, 2011Technology, and the U.S. Geological Survey. Air New Zealand generously provided reduced fares for EERI team members.The publication and distribution of this report were funded by the EERI grant from NSF.
Introduction
At 12:51 pm local time on February 22, 2011, an M 6.3 earthquake shook the city of Christchurch, New Zealand. It was an aftershock of the M 7.1 Darfield earthquake of Sep-tember 4, 2010 (see the November 2010 Newsletter for a report on that earthquake). Although lower in mag- nitude than the earlier quake, the aftershock was centered closer to the city and caused significantly more damage, particularly in the Central Business District (CBD). While the September 4 earthquake struck in the middle of the night, the February 22 earthquake hit when people filled the offices and cafes of the CBD, leading to 184 confirmed
deaths. Widespread liquefaction in the CBD and the eastern suburbs caused foundation movement in housing and office buildings alike. Two reinforced concrete office build- ings and one parking garage col-lapsed, as did hundreds of unrein-forced masonry buildings, including a number of heritage structures. Many other buildings in the CBD were severely damaged, and some required demolition, which neces-sitated careful controlled access to the CBD in the weeks following the earthquake. The total losses are estimated over NZ $20 billion.Christchurch is the largest city on the South Island of New Zealand, and the country's second-largest urban area. It lies within the Canter-bury Region and has a population of 375,000. Prior to September 2010, Christchurch was not considered a high-risk seismic area and had a voluntary retrofit ordinance for its unreinforced masonry buildings. That the construction types are simi-lar to those of the United States and
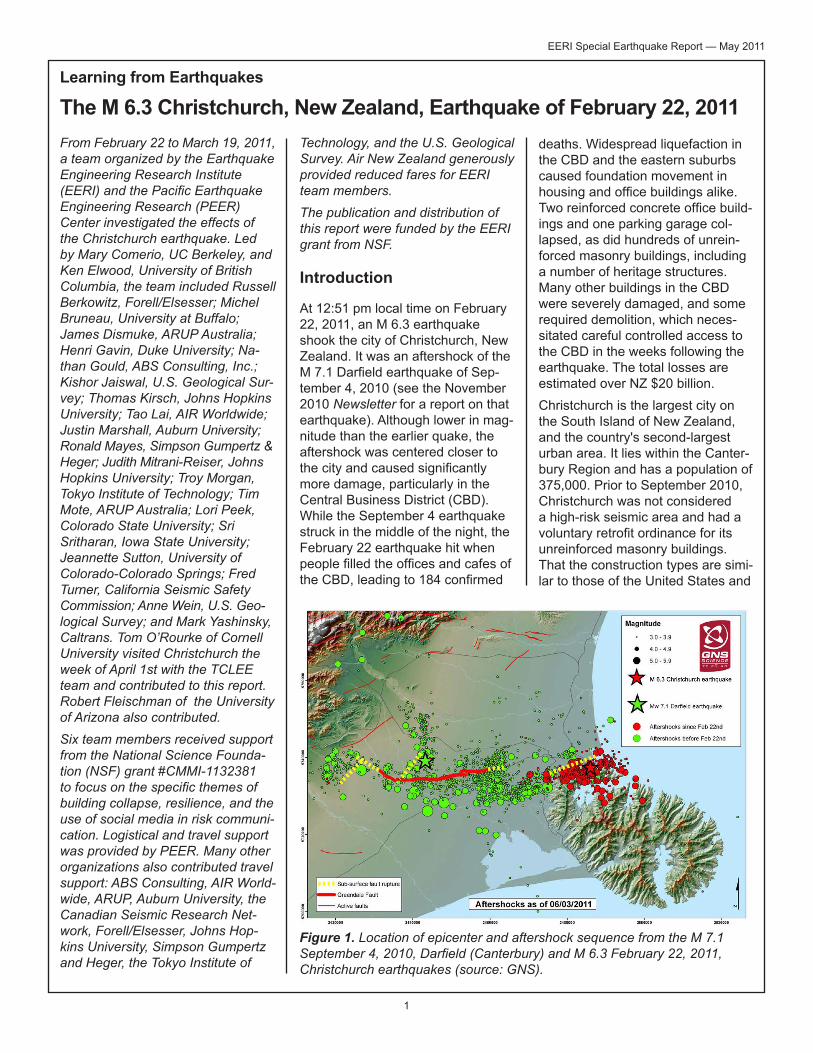
Figure 1. Location of epicenter and aftershock sequence from the M 7.1 September 4, 2010, Darfield (Canterbury) and M 6.3 February 22, 2011, Christchurch earthquakes (source: GNS).
2
EERI Special Earthquake Report — May 2011
other countries, and that the earth-quake was located on an unmapped fault within 10km of the city center make this one of the most significant earthquakes in recent years for code and standard development in the United States and internationally.
Seismicity
The earthquake struck on a fault ap- proximately 6km south of the Christ-church CBD in the Port Hills at a focal depth of 5km (see Figure 1). Focal mechanism solutions show the fault ruptured as oblique–thrust (65° from the horizontal), dipping to the south. Fault slip was as much as 2.5m along a subsurface fault rupture of about 14km. There was no evidence of surface rupture.The earthquake extended the after- shock sequence of the M 7.1 Sep-tember 2010 event considerably eastward. The complex pattern of aftershocks delineate a number of east-west and northeast-southwest trending structures. The east-west trending structures are interpreted to be older structures associated
with the Chatham Rise extending into the Pacific Ocean to the east of Christchurch. The fault respon-sible for the February quake is not believed to be an easterly projection of the fault that caused the Septem- ber quake (the Greendale fault). The earthquakes represent reactiva-tion of faults broadly associated with regional plate deformation between the Pacific and Australia plates. Before the September 2010 earth-quake, these structures were unrec-ognized under kilometers of alluvial deposits in the Canterbury Plains. Since the September earthquake, there have been more than 18 after- shocks greater than M 5.0, with the February event being the largest aftershock by a half magnitude. On December 26, 2010, an M 4.9 after-shock near the CBD caused con-siderable damage to unreinforced masonry buildings. Strong ground motion recording stations, some set up as temporary stations to record aftershocks from the September 2010 earthquake, report peak ground accelerations up
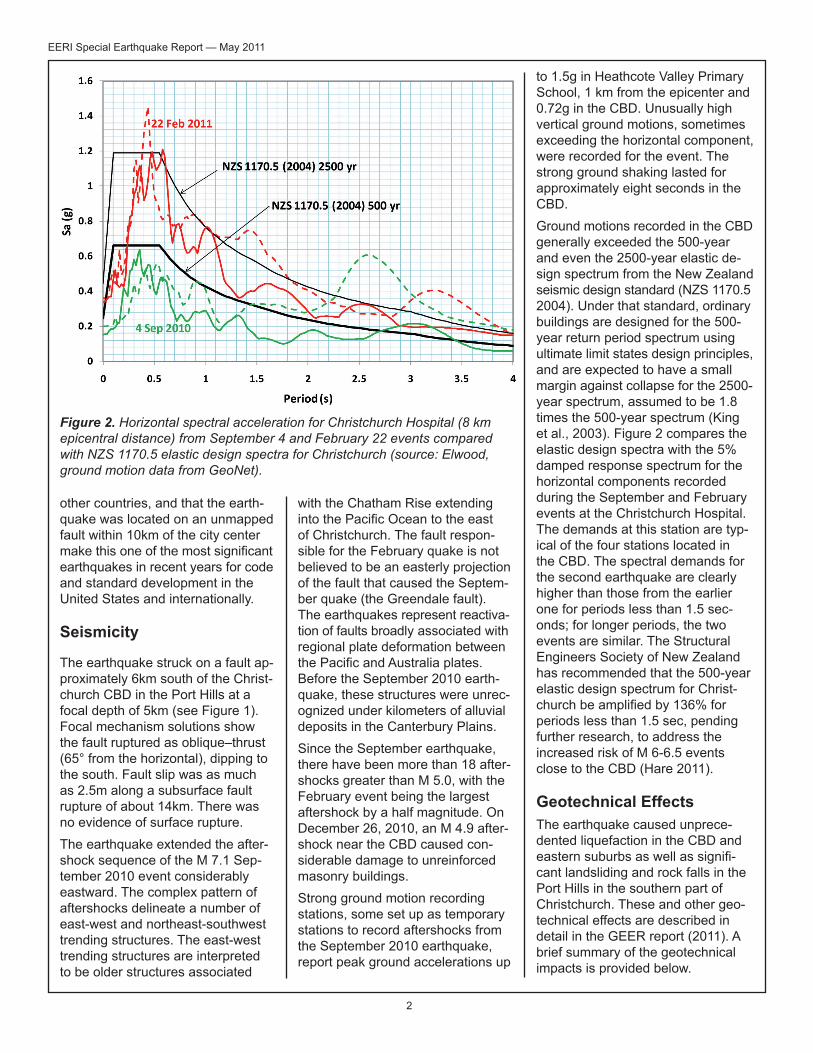
to 1.5g in Heathcote Valley Primary School, 1 km from the epicenter and 0.72g in the CBD. Unusually high vertical ground motions, sometimes exceeding the horizontal component, were recorded for the event. The strong ground shaking lasted for approximately eight seconds in the CBD.Ground motions recorded in the CBD generally exceeded the 500-year and even the 2500-year elastic de- sign spectrum from the New Zealand seismic design standard (NZS 1170.5 2004). Under that standard, ordinary buildings are designed for the 500-year return period spectrum using ultimate limit states design principles, and are expected to have a small margin against collapse for the 2500- year spectrum, assumed to be 1.8 times the 500-year spectrum (King et al., 2003). Figure 2 compares the elastic design spectra with the 5% damped response spectrum for the horizontal components recorded during the September and February events at the Christchurch Hospital. The demands at this station are typ- ical of the four stations located in the CBD. The spectral demands for the second earthquake are clearly higher than those from the earlier one for periods less than 1.5 sec-onds; for longer periods, the two events are similar. The Structural Engineers Society of New Zealand has recommended that the 500-year elastic design spectrum for Christ-church be amplified by 136% for periods less than 1.5 sec, pending further research, to address the increased risk of M 6-6.5 events close to the CBD (Hare 2011).
Geotechnical Effects The earthquake caused unprece- dented liquefaction in the CBD and eastern suburbs as well as signifi- cant landsliding and rock falls in the Port Hills in the southern part of Christchurch. These and other geo- technical effects are described in detail in the GEER report (2011). A brief summary of the geotechnical impacts is provided below.
Figure 2. Horizontal spectral acceleration for Christchurch Hospital (8 km epicentral distance) from September 4 and February 22 events compared with NZS 1170.5 elastic design spectra for Christchurch (source: Elwood, ground motion data from GeoNet).
3
EERI Special Earthquake Report — May 2011
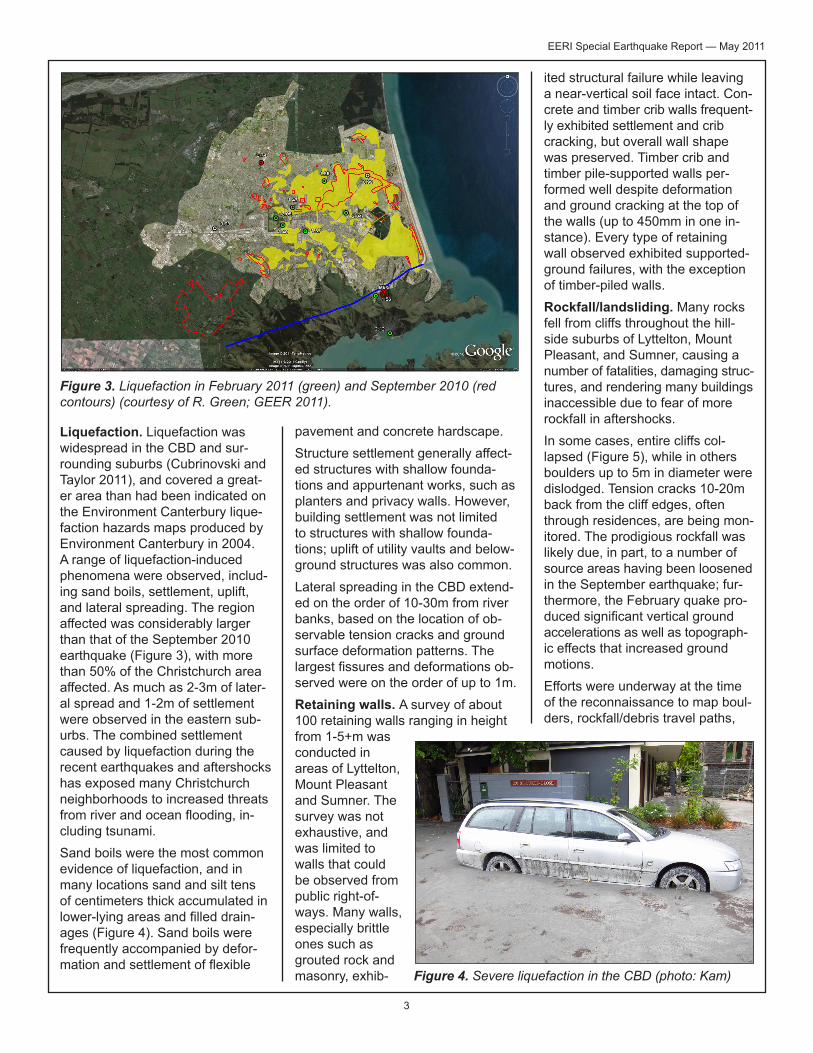
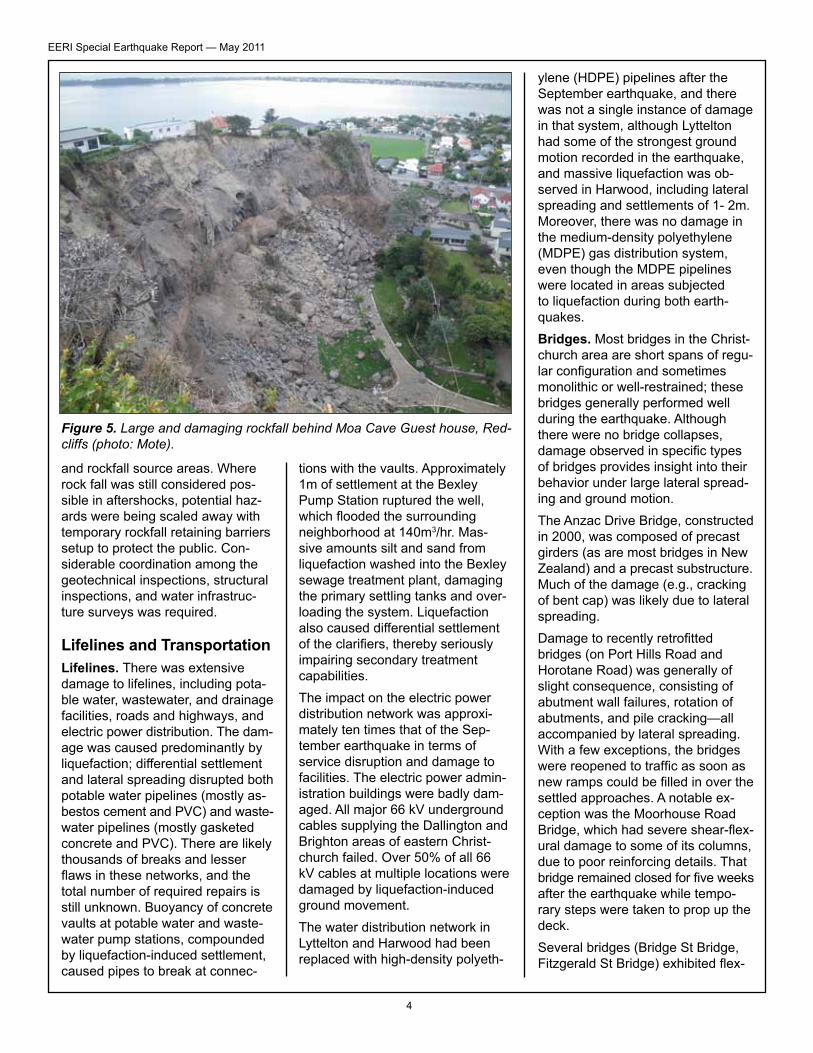
Liquefaction. Liquefaction was widespread in the CBD and sur-rounding suburbs (Cubrinovski and Taylor 2011), and covered a great- er area than had been indicated on the Environment Canterbury lique-faction hazards maps produced by Environment Canterbury in 2004. A range of liquefaction-induced phenomena were observed, includ-ing sand boils, settlement, uplift, and lateral spreading. The region affected was considerably larger than that of the September 2010 earthquake (Figure 3), with more than 50% of the Christchurch area affected. As much as 2-3m of later- al spread and 1-2m of settlement were observed in the eastern sub- urbs. The combined settlement caused by liquefaction during the recent earthquakes and aftershocks has exposed many Christchurch neighborhoods to increased threats from river and ocean flooding, in- cluding tsunami.Sand boils were the most common evidence of liquefaction, and in many locations sand and silt tens of centimeters thick accumulated in lower-lying areas and filled drain-ages (Figure 4). Sand boils were frequently accompanied by defor-mation and settlement of flexible
pavement and concrete hardscape. Structure settlement generally affect- ed structures with shallow founda-tions and appurtenant works, such as planters and privacy walls. However, building settlement was not limited to structures with shallow founda-tions; uplift of utility vaults and below- ground structures was also common.Lateral spreading in the CBD extend- ed on the order of 10-30m from river banks, based on the location of ob- servable tension cracks and ground surface deformation patterns. The largest fissures and deformations ob- served were on the order of up to 1m. Retaining walls. A survey of about 100 retaining walls ranging in height from 1-5+m was conducted in areas of Lyttelton, Mount Pleasant and Sumner. The survey was not exhaustive, and was limited to walls that could be observed from public right-of-ways. Many walls, especially brittle ones such as grouted rock and masonry, exhib-
Figure 3. Liquefaction in February 2011 (green) and September 2010 (red contours) (courtesy of R. Green; GEER 2011).
Figure 4. Severe liquefaction in the CBD (photo: Kam)
ited structural failure while leaving a near-vertical soil face intact. Con- crete and timber crib walls frequent- ly exhibited settlement and crib cracking, but overall wall shape was preserved. Timber crib and timber pile-supported walls per-formed well despite deformation and ground cracking at the top of the walls (up to 450mm in one in- stance). Every type of retaining wall observed exhibited supported-ground failures, with the exception of timber-piled walls.Rockfall/landsliding. Many rocks fell from cliffs throughout the hill-side suburbs of Lyttelton, Mount Pleasant, and Sumner, causing a number of fatalities, damaging struc- tures, and rendering many buildings inaccessible due to fear of more rockfall in aftershocks. In some cases, entire cliffs col-lapsed (Figure 5), while in others boulders up to 5m in diameter were dislodged. Tension cracks 10-20m back from the cliff edges, often through residences, are being mon- itored. The prodigious rockfall was likely due, in part, to a number of source areas having been loosened in the September earthquake; fur- thermore, the February quake pro-duced significant vertical ground accelerations as well as topograph- ic effects that increased ground motions.Efforts were underway at the time of the reconnaissance to map boul-ders, rockfall/debris travel paths,
4
EERI Special Earthquake Report — May 2011
and rockfall source areas. Where rock fall was still considered pos-sible in aftershocks, potential haz-ards were being scaled away with temporary rockfall retaining barriers setup to protect the public. Con-siderable coordination among the geotechnical inspections, structural inspections, and water infrastruc-ture surveys was required.
Lifelines and TransportationLifelines. There was extensive damage to lifelines, including pota- ble water, wastewater, and drainage facilities, roads and highways, and electric power distribution. The dam- age was caused predominantly by liquefaction; differential settlement and lateral spreading disrupted both potable water pipelines (mostly as- bestos cement and PVC) and waste- water pipelines (mostly gasketed concrete and PVC). There are likely thousands of breaks and lesser flaws in these networks, and the total number of required repairs is still unknown. Buoyancy of concrete vaults at potable water and waste-water pump stations, compounded by liquefaction-induced settlement, caused pipes to break at connec-
tions with the vaults. Approximately 1m of settlement at the Bexley Pump Station ruptured the well, which flooded the surrounding neighborhood at 140m3/hr. Mas-sive amounts silt and sand from liquefaction washed into the Bexley sewage treatment plant, damaging the primary settling tanks and over-loading the system. Liquefaction also caused differential settlement of the clarifiers, thereby seriously impairing secondary treatment capabilities. The impact on the electric power distribution network was approxi-mately ten times that of the Sep-tember earthquake in terms of service disruption and damage to facilities. The electric power admin-istration buildings were badly dam-aged. All major 66 kV underground cables supplying the Dallington and Brighton areas of eastern Christ-church failed. Over 50% of all 66 kV cables at multiple locations were damaged by liquefaction-induced ground movement.The water distribution network in Lyttelton and Harwood had been replaced with high-density polyeth-
ylene (HDPE) pipelines after the September earthquake, and there was not a single instance of damage in that system, although Lyttelton had some of the strongest ground motion recorded in the earthquake, and massive liquefaction was ob- served in Harwood, including lateral spreading and settlements of 1- 2m. Moreover, there was no damage in the medium-density polyethylene (MDPE) gas distribution system, even though the MDPE pipelines were located in areas subjected to liquefaction during both earth-quakes.Bridges. Most bridges in the Christ- church area are short spans of regu- lar configuration and sometimes monolithic or well-restrained; these bridges generally performed well during the earthquake. Although there were no bridge collapses, damage observed in specific types of bridges provides insight into their behavior under large lateral spread-ing and ground motion. The Anzac Drive Bridge, constructed in 2000, was composed of precast girders (as are most bridges in New Zealand) and a precast substructure. Much of the damage (e.g., cracking of bent cap) was likely due to lateral spreading.Damage to recently retrofitted bridges (on Port Hills Road and Horotane Road) was generally of slight consequence, consisting of abutment wall failures, rotation of abutments, and pile cracking—all accompanied by lateral spreading. With a few exceptions, the bridges were reopened to traffic as soon as new ramps could be filled in over the settled approaches. A notable ex- ception was the Moorhouse Road Bridge, which had severe shear-flex-ural damage to some of its columns, due to poor reinforcing details. That bridge remained closed for five weeks after the earthquake while tempo-rary steps were taken to prop up the deck. Several bridges (Bridge St Bridge, Fitzgerald St Bridge) exhibited flex-
Figure 5. Large and damaging rockfall behind Moa Cave Guest house, Red-cliffs (photo: Mote).
5
EERI Special Earthquake Report — May 2011
lapsed; others partially collapsed. At the same time, several modern buildings performed well (see the Tagging section for approximate statistics). Though such variations in performance can be attributed to material type, year of construction, and differences in structural layouts, the variation in soil conditions and shaking (measured peak ground acceleration within the CBD varied from 0.36-0.72g) throughout the city no doubt also played a role. Signifi-cant liquefaction adjacent to some structures led to several inches of
ural cracking of piles due to lique-faction and lateral spreading of the surrounding soil. There may have been similar cracking in piles sup-porting wall-piers, but those were hidden from inspection.Utilities carried by bridges (Bridge Street, Fitzgerald Street) were fre- quently damaged. In some instances, sewer lines spilled their effluent into the river or water mains broke and washed out embankments. In other cases, the high relative stiffness of the utilities damaged the bridge.
BuildingsReinforced concrete and masonry buildings. Most of the buildings over four stories in the city of Christ- church are either reinforced con-crete or reinforced masonry, and are generally concentrated in the CBD. Multi-story steel buildings are noticeably scarce, mainly because industrial relations issues associa- ted with site welding have signifi-cantly hindered steel construction in New Zealand since the early 1980s. Some reinforced concrete and ma- sonry structures completely col-
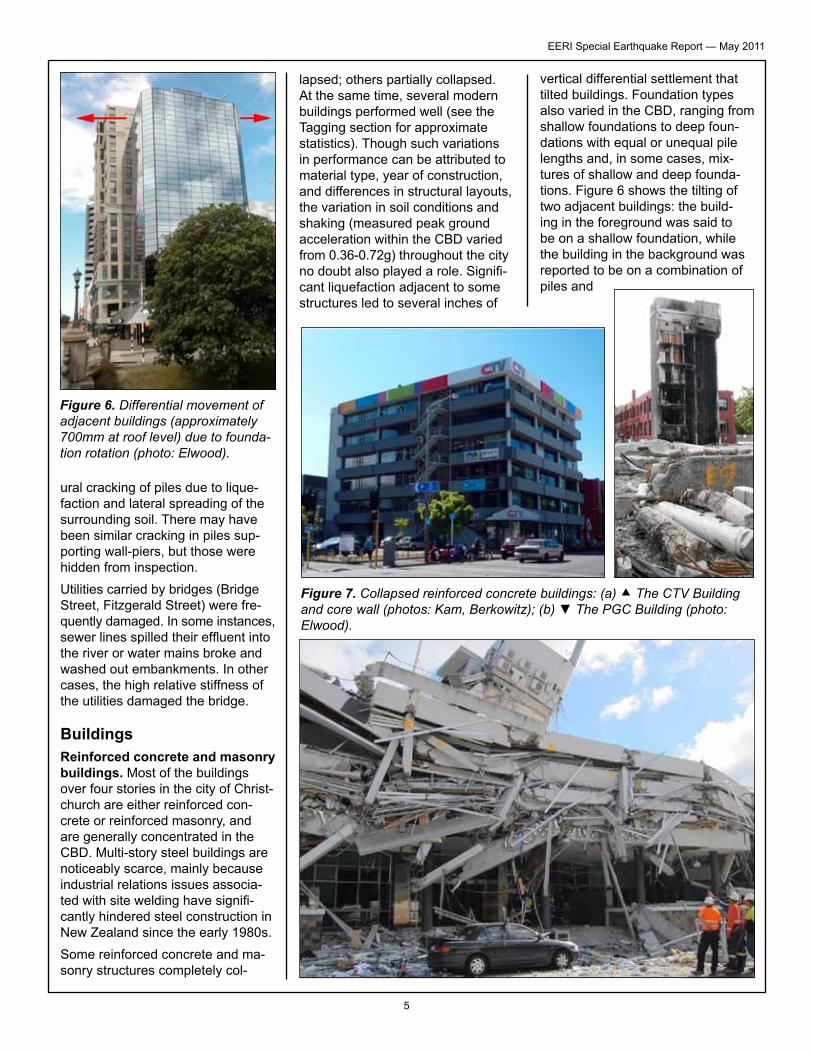
Figure 6. Differential movement of adjacent buildings (approximately 700mm at roof level) due to founda-tion rotation (photo: Elwood).
vertical differential settlement that tilted buildings. Foundation types also varied in the CBD, ranging from shallow foundations to deep foun-dations with equal or unequal pile lengths and, in some cases, mix- tures of shallow and deep founda-tions. Figure 6 shows the tilting of two adjacent buildings: the build-ing in the foreground was said to be on a shallow foundation, while the building in the background was reported to be on a combination of piles and
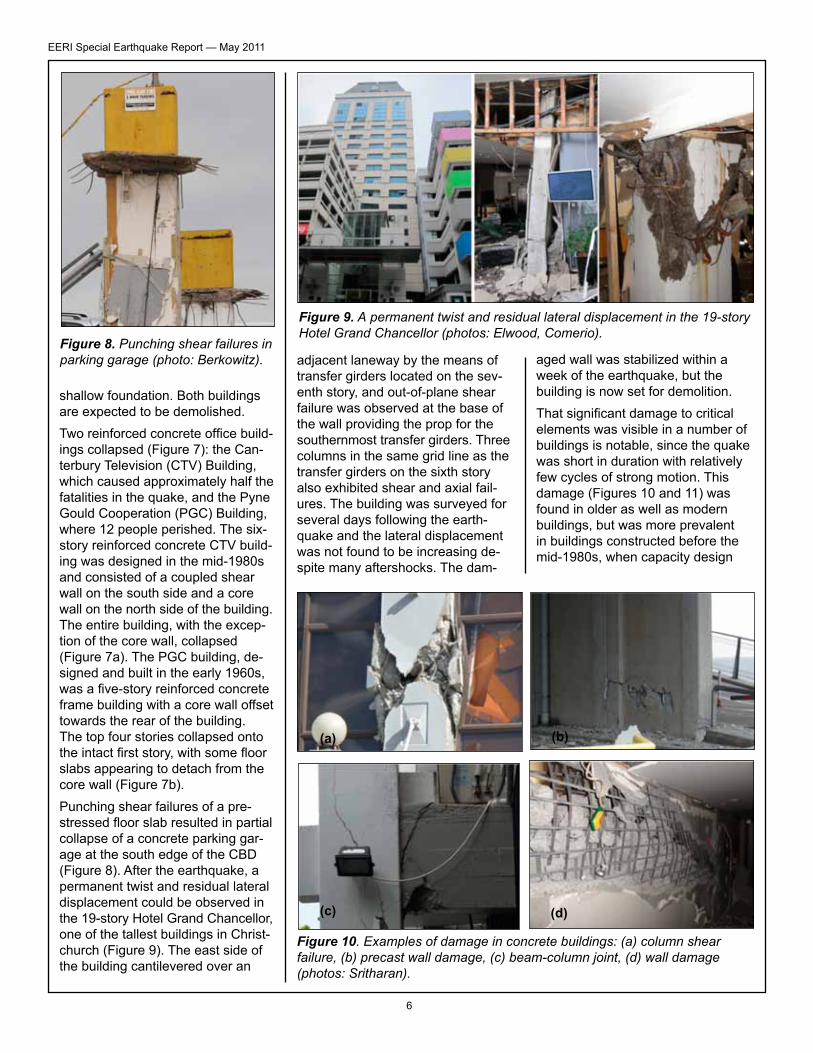
Figure 7. Collapsed reinforced concrete buildings: (a) The CTV Building and core wall (photos: Kam, Berkowitz); (b) ▼ The PGC Building (photo: Elwood).
6
EERI Special Earthquake Report — May 2011
adjacent laneway by the means of transfer girders located on the sev-enth story, and out-of-plane shear failure was observed at the base of the wall providing the prop for the southernmost transfer girders. Three columns in the same grid line as the transfer girders on the sixth story also exhibited shear and axial fail-ures. The building was surveyed for several days following the earth- quake and the lateral displacement was not found to be increasing de- spite many aftershocks. The dam-
aged wall was stabilized within a week of the earthquake, but the building is now set for demolition. That significant damage to critical elements was visible in a number of buildings is notable, since the quake was short in duration with relatively few cycles of strong motion. This damage (Figures 10 and 11) was found in older as well as modern buildings, but was more prevalent in buildings constructed before the mid-1980s, when capacity design
shallow foundation. Both buildings are expected to be demolished.Two reinforced concrete office build- ings collapsed (Figure 7): the Can-terbury Television (CTV) Building, which caused approximately half the fatalities in the quake, and the Pyne Gould Cooperation (PGC) Building, where 12 people perished. The six- story reinforced concrete CTV build- ing was designed in the mid-1980s and consisted of a coupled shear wall on the south side and a core wall on the north side of the building. The entire building, with the excep-tion of the core wall, collapsed (Figure 7a). The PGC building, de- signed and built in the early 1960s, was a five-story reinforced concrete frame building with a core wall offset towards the rear of the building. The top four stories collapsed onto the intact first story, with some floor slabs appearing to detach from the core wall (Figure 7b). Punching shear failures of a pre- stressed floor slab resulted in partial collapse of a concrete parking gar- age at the south edge of the CBD (Figure 8). After the earthquake, a permanent twist and residual lateral displacement could be observed in the 19-story Hotel Grand Chancellor, one of the tallest buildings in Christ-church (Figure 9). The east side of the building cantilevered over an
Figure 10. Examples of damage in concrete buildings: (a) column shear failure, (b) precast wall damage, (c) beam-column joint, (d) wall damage (photos: Sritharan).
Figure 9. A permanent twist and residual lateral displacement in the 19-story Hotel Grand Chancellor (photos: Elwood, Comerio).
Figure 8. Punching shear failures in parking garage (photo: Berkowitz).
(b)
(d)(c)
(a)
7
EERI Special Earthquake Report — May 2011
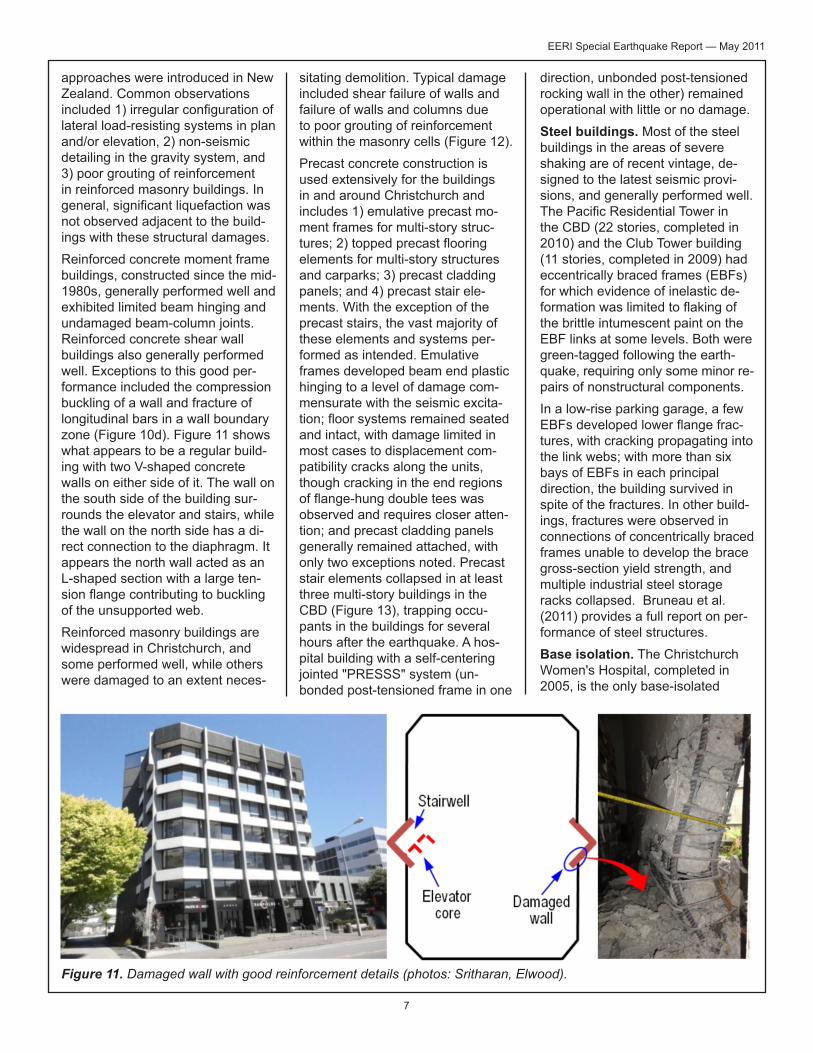
approaches were introduced in New Zealand. Common observations included 1) irregular configuration of lateral load-resisting systems in plan and/or elevation, 2) non-seismic detailing in the gravity system, and 3) poor grouting of reinforcement in reinforced masonry buildings. In general, significant liquefaction was not observed adjacent to the build-ings with these structural damages.Reinforced concrete moment frame buildings, constructed since the mid-1980s, generally performed well and exhibited limited beam hinging and undamaged beam-column joints. Reinforced concrete shear wall buildings also generally performed well. Exceptions to this good per-formance included the compression buckling of a wall and fracture of longitudinal bars in a wall boundary zone (Figure 10d). Figure 11 shows what appears to be a regular build-ing with two V-shaped concrete walls on either side of it. The wall on the south side of the building sur-rounds the elevator and stairs, while the wall on the north side has a di- rect connection to the diaphragm. It appears the north wall acted as an L-shaped section with a large ten-sion flange contributing to buckling of the unsupported web. Reinforced masonry buildings are widespread in Christchurch, and some performed well, while others were damaged to an extent neces-
sitating demolition. Typical damage included shear failure of walls and failure of walls and columns due to poor grouting of reinforcement within the masonry cells (Figure 12).Precast concrete construction is used extensively for the buildings in and around Christchurch and includes 1) emulative precast mo- ment frames for multi-story struc-tures; 2) topped precast flooring elements for multi-story structures and carparks; 3) precast cladding panels; and 4) precast stair ele-ments. With the exception of the precast stairs, the vast majority of these elements and systems per-formed as intended. Emulative frames developed beam end plastic hinging to a level of damage com-mensurate with the seismic excita- tion; floor systems remained seated and intact, with damage limited in most cases to displacement com-patibility cracks along the units, though cracking in the end regions of flange-hung double tees was observed and requires closer atten-tion; and precast cladding panels generally remained attached, with only two exceptions noted. Precast stair elements collapsed in at least three multi-story buildings in the CBD (Figure 13), trapping occu-pants in the buildings for several hours after the earthquake. A hos- pital building with a self-centering jointed "PRESSS" system (un- bonded post-tensioned frame in one
Figure 11. Damaged wall with good reinforcement details (photos: Sritharan, Elwood).
direction, unbonded post-tensioned rocking wall in the other) remained operational with little or no damage.Steel buildings. Most of the steel buildings in the areas of severe shaking are of recent vintage, de- signed to the latest seismic provi-sions, and generally performed well. The Pacific Residential Tower in the CBD (22 stories, completed in 2010) and the Club Tower building (11 stories, completed in 2009) had eccentrically braced frames (EBFs) for which evidence of inelastic de- formation was limited to flaking of the brittle intumescent paint on the EBF links at some levels. Both were green-tagged following the earth-quake, requiring only some minor re- pairs of nonstructural components.In a low-rise parking garage, a few EBFs developed lower flange frac- tures, with cracking propagating into the link webs; with more than six bays of EBFs in each principal direction, the building survived in spite of the fractures. In other build-ings, fractures were observed in connections of concentrically braced frames unable to develop the brace gross-section yield strength, and multiple industrial steel storage racks collapsed. Bruneau et al. (2011) provides a full report on per-formance of steel structures. Base isolation. The Christchurch Women's Hospital, completed in 2005, is the only base-isolated
8
EERI Special Earthquake Report — May 2011
ponents at the seismic gaps and minor cracking of partitions around window openings. The peak isola-tor displacements were estimated at 80mm-100mm, with a northward residual displacement of about 25mm. Peak isolator demands for the February quake were estimated from soil displaced by the moat covers to be about 120mm, with residual displace- ment close to zero. These isolator dis- placements are
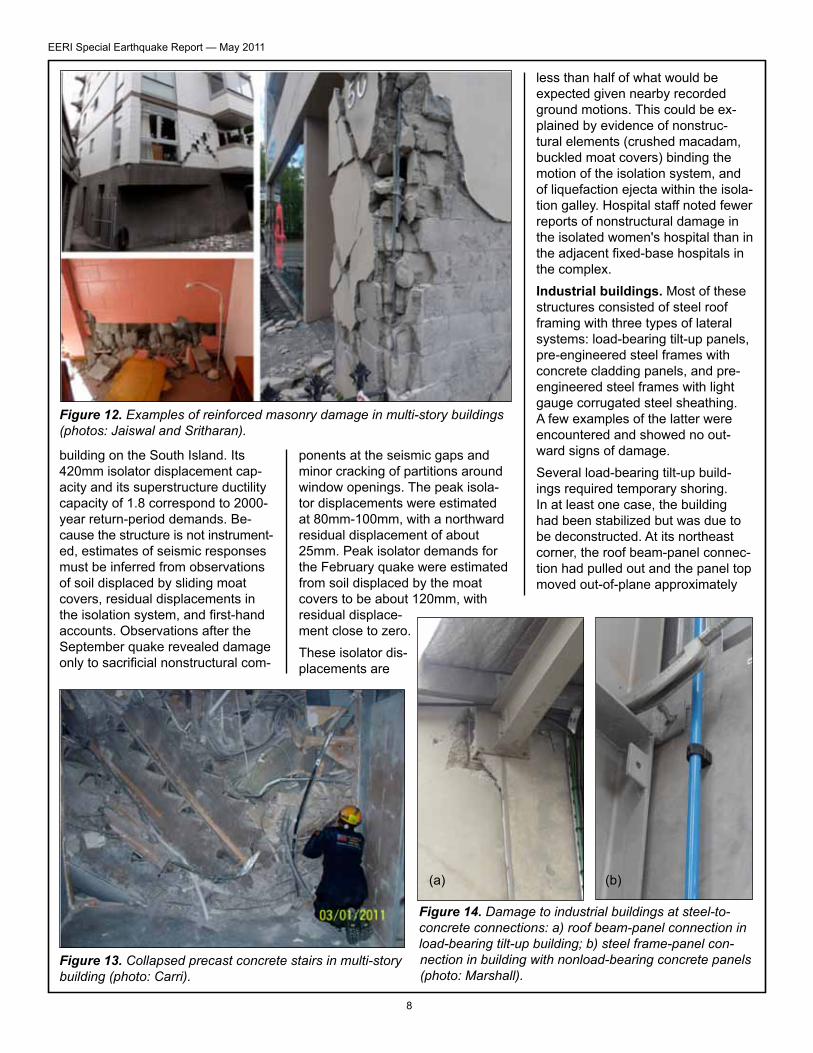
less than half of what would be expected given nearby recorded ground motions. This could be ex- plained by evidence of nonstruc-tural elements (crushed macadam, buckled moat covers) binding the motion of the isolation system, and of liquefaction ejecta within the isola-tion galley. Hospital staff noted fewer reports of nonstructural damage in the isolated women's hospital than in the adjacent fixed-base hospitals in the complex. Industrial buildings. Most of these structures consisted of steel roof framing with three types of lateral systems: load-bearing tilt-up panels, pre-engineered steel frames with concrete cladding panels, and pre-engineered steel frames with light gauge corrugated steel sheathing. A few examples of the latter were encountered and showed no out-ward signs of damage. Several load-bearing tilt-up build-ings required temporary shoring. In at least one case, the building had been stabilized but was due to be deconstructed. At its northeast corner, the roof beam-panel connec-tion had pulled out and the panel top moved out-of-plane approximately
building on the South Island. Its 420mm isolator displacement cap- acity and its superstructure ductility capacity of 1.8 correspond to 2000- year return-period demands. Be- cause the structure is not instrument- ed, estimates of seismic responses must be inferred from observations of soil displaced by sliding moat covers, residual displacements in the isolation system, and first-hand accounts. Observations after the September quake revealed damage only to sacrificial nonstructural com-
Figure 14. Damage to industrial buildings at steel-to-concrete connections: a) roof beam-panel connection in load-bearing tilt-up building; b) steel frame-panel con-nection in building with nonload-bearing concrete panels (photo: Marshall).
(a) (b)
Figure 13. Collapsed precast concrete stairs in multi-story building (photo: Carri).
Figure 12. Examples of reinforced masonry damage in multi-story buildings (photos: Jaiswal and Sritharan).
9
EERI Special Earthquake Report — May 2011
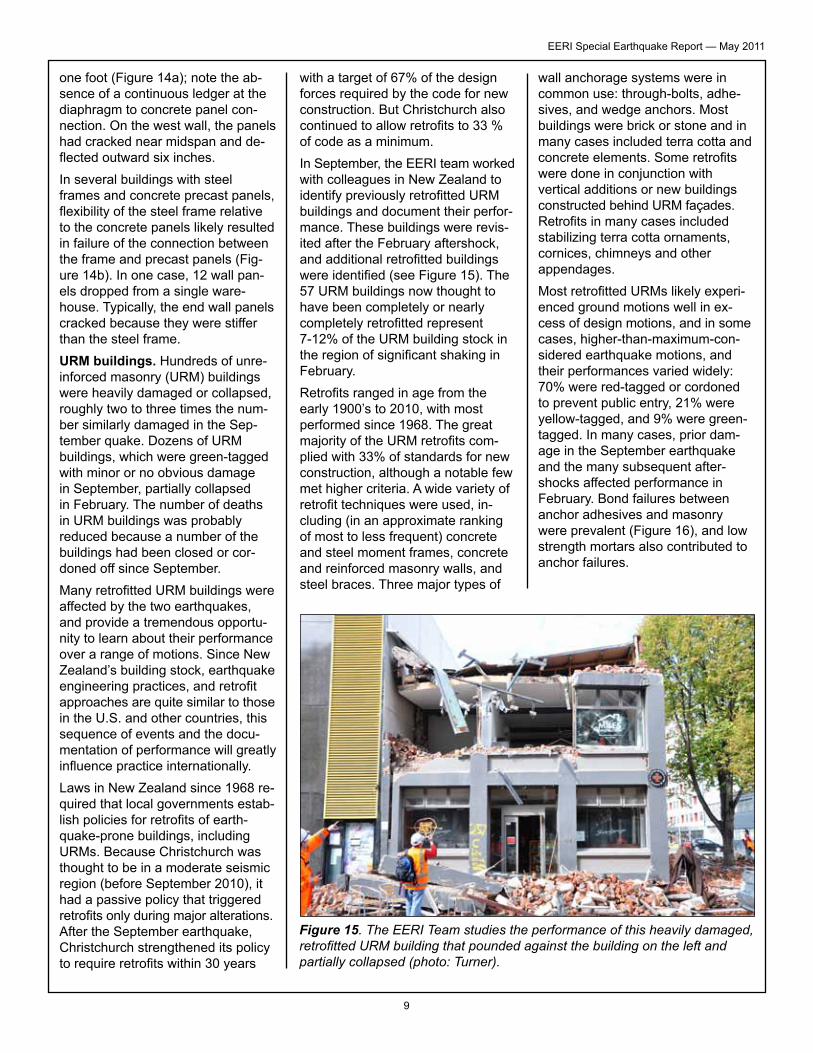
with a target of 67% of the design forces required by the code for new construction. But Christchurch also continued to allow retrofits to 33 % of code as a minimum. In September, the EERI team worked with colleagues in New Zealand to identify previously retrofitted URM buildings and document their perfor-mance. These buildings were revis-ited after the February aftershock, and additional retrofitted buildings were identified (see Figure 15). The 57 URM buildings now thought to have been completely or nearly completely retrofitted represent 7-12% of the URM building stock in the region of significant shaking in February. Retrofits ranged in age from the early 1900’s to 2010, with most performed since 1968. The great majority of the URM retrofits com-plied with 33% of standards for new construction, although a notable few met higher criteria. A wide variety of retrofit techniques were used, in- cluding (in an approximate ranking of most to less frequent) concrete and steel moment frames, concrete and reinforced masonry walls, and steel braces. Three major types of
one foot (Figure 14a); note the ab- sence of a continuous ledger at the diaphragm to concrete panel con-nection. On the west wall, the panels had cracked near midspan and de- flected outward six inches. In several buildings with steel frames and concrete precast panels, flexibility of the steel frame relative to the concrete panels likely resulted in failure of the connection between the frame and precast panels (Fig- ure 14b). In one case, 12 wall pan- els dropped from a single ware-house. Typically, the end wall panels cracked because they were stiffer than the steel frame. URM buildings. Hundreds of unre-inforced masonry (URM) buildings were heavily damaged or collapsed, roughly two to three times the num- ber similarly damaged in the Sep-tember quake. Dozens of URM buildings, which were green-tagged with minor or no obvious damage in September, partially collapsed in February. The number of deaths in URM buildings was probably reduced because a number of the buildings had been closed or cor-doned off since September.Many retrofitted URM buildings were affected by the two earthquakes, and provide a tremendous opportu-nity to learn about their performance over a range of motions. Since New Zealand’s building stock, earthquake engineering practices, and retrofit approaches are quite similar to those in the U.S. and other countries, this sequence of events and the docu-mentation of performance will greatly influence practice internationally.Laws in New Zealand since 1968 re- quired that local governments estab-lish policies for retrofits of earth-quake-prone buildings, including URMs. Because Christchurch was thought to be in a moderate seismic region (before September 2010), it had a passive policy that triggered retrofits only during major alterations. After the September earthquake, Christchurch strengthened its policy to require retrofits within 30 years
Figure 15. The EERI Team studies the performance of this heavily damaged, retrofitted URM building that pounded against the building on the left and partially collapsed (photo: Turner).
wall anchorage systems were in common use: through-bolts, adhe-sives, and wedge anchors. Most buildings were brick or stone and in many cases included terra cotta and concrete elements. Some retrofits were done in conjunction with vertical additions or new buildings constructed behind URM façades. Retrofits in many cases included stabilizing terra cotta ornaments, cornices, chimneys and other appendages. Most retrofitted URMs likely experi-enced ground motions well in ex- cess of design motions, and in some cases, higher-than-maximum-con-sidered earthquake motions, and their performances varied widely: 70% were red-tagged or cordoned to prevent public entry, 21% were yellow-tagged, and 9% were green- tagged. In many cases, prior dam- age in the September earthquake and the many subsequent after-shocks affected performance in February. Bond failures between anchor adhesives and masonry were prevalent (Figure 16), and low strength mortars also contributed to anchor failures.
10
EERI Special Earthquake Report — May 2011
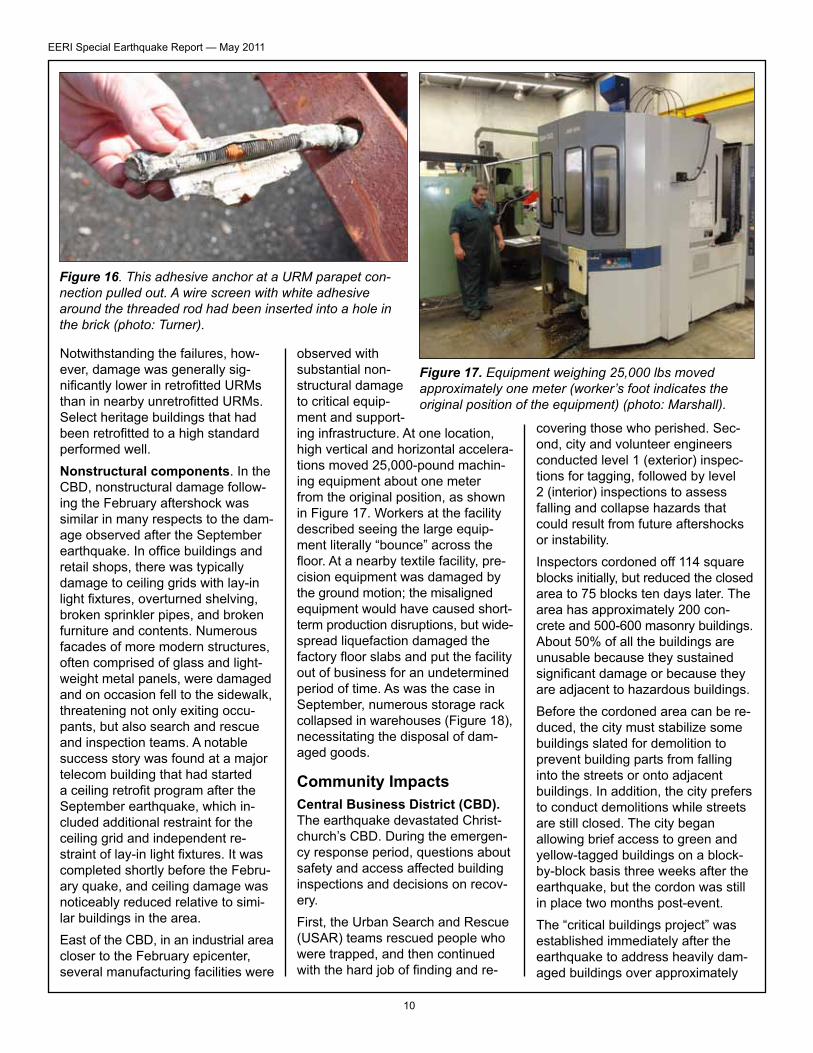
Figure 17. Equipment weighing 25,000 lbs moved approximately one meter (worker’s foot indicates the original position of the equipment) (photo: Marshall).
Notwithstanding the failures, how-ever, damage was generally sig-nificantly lower in retrofitted URMs than in nearby unretrofitted URMs. Select heritage buildings that had been retrofitted to a high standard performed well.Nonstructural components. In the CBD, nonstructural damage follow- ing the February aftershock was similar in many respects to the dam- age observed after the September earthquake. In office buildings and retail shops, there was typically damage to ceiling grids with lay-in light fixtures, overturned shelving, broken sprinkler pipes, and broken furniture and contents. Numerous facades of more modern structures, often comprised of glass and light- weight metal panels, were damaged and on occasion fell to the sidewalk, threatening not only exiting occu-pants, but also search and rescue and inspection teams. A notable success story was found at a major telecom building that had started a ceiling retrofit program after the September earthquake, which in- cluded additional restraint for the ceiling grid and independent re- straint of lay-in light fixtures. It was completed shortly before the Febru-ary quake, and ceiling damage was noticeably reduced relative to simi-lar buildings in the area. East of the CBD, in an industrial area closer to the February epicenter, several manufacturing facilities were
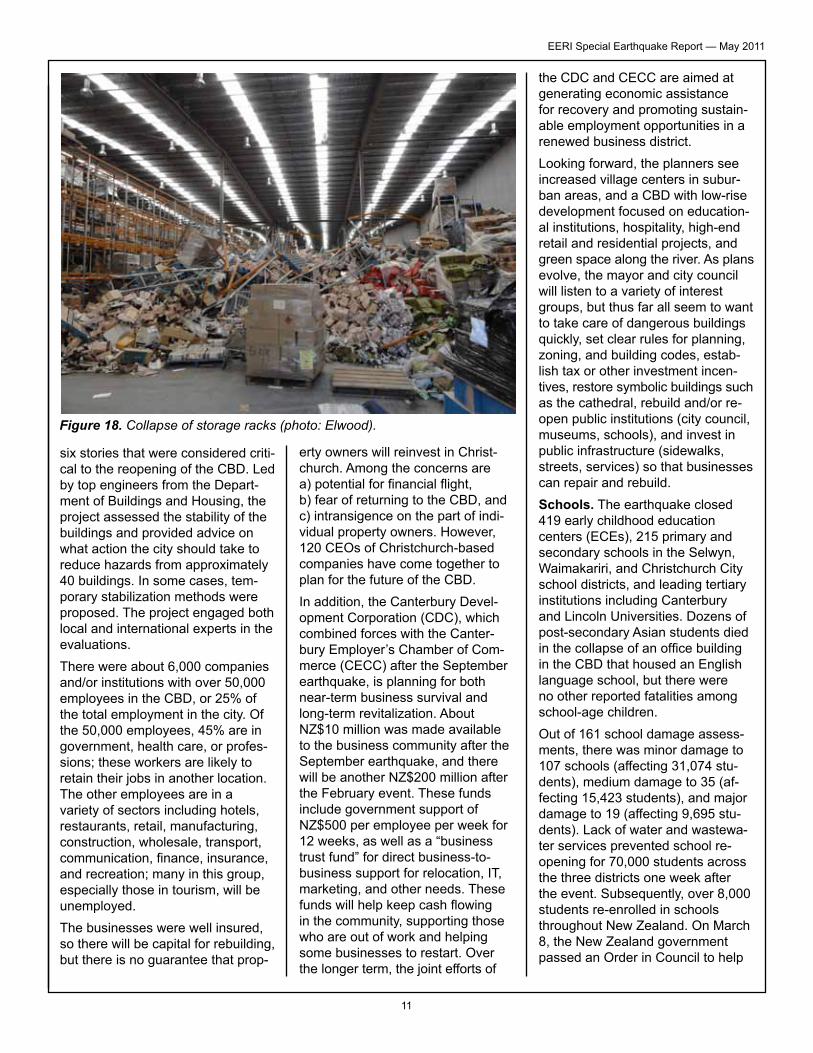
observed with substantial non-structural damage to critical equip- ment and support- ing infrastructure. At one location, high vertical and horizontal accelera-tions moved 25,000-pound machin- ing equipment about one meter from the original position, as shown in Figure 17. Workers at the facility described seeing the large equip-ment literally “bounce” across the floor. At a nearby textile facility, pre- cision equipment was damaged by the ground motion; the misaligned equipment would have caused short- term production disruptions, but wide-spread liquefaction damaged the factory floor slabs and put the facility out of business for an undetermined period of time. As was the case in September, numerous storage rack collapsed in warehouses (Figure 18), necessitating the disposal of dam-aged goods.
Community ImpactsCentral Business District (CBD).The earthquake devastated Christ-church’s CBD. During the emergen- cy response period, questions about safety and access affected building inspections and decisions on recov-ery.First, the Urban Search and Rescue (USAR) teams rescued people who were trapped, and then continued with the hard job of finding and re-
covering those who perished. Sec- ond, city and volunteer engineers conducted level 1 (exterior) inspec-tions for tagging, followed by level 2 (interior) inspections to assess falling and collapse hazards that could result from future aftershocks or instability. Inspectors cordoned off 114 square blocks initially, but reduced the closed area to 75 blocks ten days later. The area has approximately 200 con- crete and 500-600 masonry buildings. About 50% of all the buildings are unusable because they sustained significant damage or because they are adjacent to hazardous buildings.Before the cordoned area can be re- duced, the city must stabilize some buildings slated for demolition to prevent building parts from falling into the streets or onto adjacent buildings. In addition, the city prefers to conduct demolitions while streets are still closed. The city began allowing brief access to green and yellow-tagged buildings on a block-by-block basis three weeks after the earthquake, but the cordon was still in place two months post-event. The “critical buildings project” was established immediately after the earthquake to address heavily dam-aged buildings over approximately
Figure 16. This adhesive anchor at a URM parapet con-nection pulled out. A wire screen with white adhesive around the threaded rod had been inserted into a hole in the brick (photo: Turner).
11
EERI Special Earthquake Report — May 2011
six stories that were considered criti-cal to the reopening of the CBD. Led by top engineers from the Depart-ment of Buildings and Housing, the project assessed the stability of the buildings and provided advice on what action the city should take to reduce hazards from approximately 40 buildings. In some cases, tem-porary stabilization methods were proposed. The project engaged both local and international experts in the evaluations.There were about 6,000 companies and/or institutions with over 50,000 employees in the CBD, or 25% of the total employment in the city. Of the 50,000 employees, 45% are in government, health care, or profes-sions; these workers are likely to retain their jobs in another location. The other employees are in a variety of sectors including hotels, restaurants, retail, manufacturing, construction, wholesale, transport, communication, finance, insurance, and recreation; many in this group, especially those in tourism, will be unemployed. The businesses were well insured, so there will be capital for rebuilding, but there is no guarantee that prop-
erty owners will reinvest in Christ-church. Among the concerns are a) potential for financial flight, b) fear of returning to the CBD, and c) intransigence on the part of indi-vidual property owners. However, 120 CEOs of Christchurch-based companies have come together to plan for the future of the CBD. In addition, the Canterbury Devel- opment Corporation (CDC), which combined forces with the Canter- bury Employer’s Chamber of Com-merce (CECC) after the September earthquake, is planning for both near-term business survival and long-term revitalization. About NZ$10 million was made available to the business community after the September earthquake, and there will be another NZ$200 million after the February event. These funds include government support of NZ$500 per employee per week for 12 weeks, as well as a “business trust fund” for direct business-to-business support for relocation, IT, marketing, and other needs. These funds will help keep cash flowing in the community, supporting those who are out of work and helping some businesses to restart. Over the longer term, the joint efforts of
Figure 18. Collapse of storage racks (photo: Elwood).
the CDC and CECC are aimed at generating economic assistance for recovery and promoting sustain-able employment opportunities in a renewed business district.Looking forward, the planners see increased village centers in subur-ban areas, and a CBD with low-rise development focused on education- al institutions, hospitality, high-end retail and residential projects, and green space along the river. As plans evolve, the mayor and city council will listen to a variety of interest groups, but thus far all seem to want to take care of dangerous buildings quickly, set clear rules for planning, zoning, and building codes, estab-lish tax or other investment incen-tives, restore symbolic buildings such as the cathedral, rebuild and/or re-open public institutions (city council, museums, schools), and invest in public infrastructure (sidewalks, streets, services) so that businesses can repair and rebuild.Schools. The earthquake closed 419 early childhood education centers (ECEs), 215 primary and secondary schools in the Selwyn, Waimakariri, and Christchurch City school districts, and leading tertiary institutions including Canterbury and Lincoln Universities. Dozens of post-secondary Asian students died in the collapse of an office building in the CBD that housed an English language school, but there were no other reported fatalities among school-age children. Out of 161 school damage assess-ments, there was minor damage to 107 schools (affecting 31,074 stu- dents), medium damage to 35 (af- fecting 15,423 students), and major damage to 19 (affecting 9,695 stu- dents). Lack of water and wastewa- ter services prevented school re- opening for 70,000 students across the three districts one week after the event. Subsequently, over 8,000 students re-enrolled in schools throughout New Zealand. On March 8, the New Zealand government passed an Order in Council to help
12
EERI Special Earthquake Report — May 2011
speed the recovery process of the school system. The order enabled the Minister of Education and Sec- retary for Education to (a) tempo-rarily change school enrollment schemes without community consul-tation; (b) change the definition of a "half day" so schools could share sites; and (c) ensure students could return to their home school if and when it reopened.On March 14, Christchurch City schools began to reopen, and stu- dents arrived armed with bottles of boiled water. Nine learning hubs were established to replace closed primary schools. Four closed high schools shared sites with four open high schools. As of March 21, 97% of school sites were reopened, but only 600 of the 8,000 students who had left the districts had returned. The Order in Council also enabled ECE centers to relocate and/or operate in restricted spaces, such that 76% of ECE services had reopened by March 21.
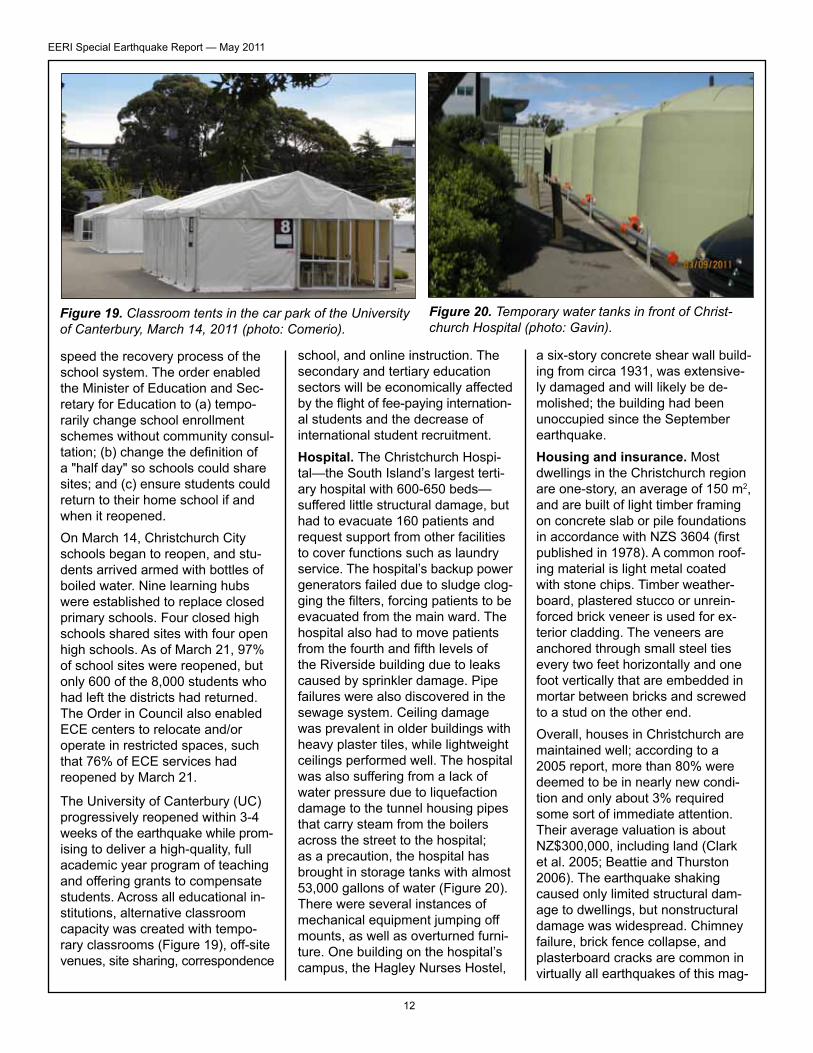
The University of Canterbury (UC) progressively reopened within 3-4 weeks of the earthquake while prom- ising to deliver a high-quality, full academic year program of teaching and offering grants to compensate students. Across all educational in- stitutions, alternative classroom capacity was created with tempo-rary classrooms (Figure 19), off-site venues, site sharing, correspondence
school, and online instruction. The secondary and tertiary education sectors will be economically affected by the flight of fee-paying internation- al students and the decrease of international student recruitment. Hospital. The Christchurch Hospi- tal—the South Island’s largest terti- ary hospital with 600-650 beds—suffered little structural damage, but had to evacuate 160 patients and request support from other facilities to cover functions such as laundry service. The hospital’s backup power generators failed due to sludge clog-ging the filters, forcing patients to be evacuated from the main ward. The hospital also had to move patients from the fourth and fifth levels of the Riverside building due to leaks caused by sprinkler damage. Pipe failures were also discovered in the sewage system. Ceiling damage was prevalent in older buildings with heavy plaster tiles, while lightweight ceilings performed well. The hospital was also suffering from a lack of water pressure due to liquefaction damage to the tunnel housing pipes that carry steam from the boilers across the street to the hospital; as a precaution, the hospital has brought in storage tanks with almost 53,000 gallons of water (Figure 20). There were several instances of mechanical equipment jumping off mounts, as well as overturned furni-ture. One building on the hospital’s campus, the Hagley Nurses Hostel,
a six-story concrete shear wall build-ing from circa 1931, was extensive- ly damaged and will likely be de- molished; the building had been unoccupied since the September earthquake. Housing and insurance. Most dwellings in the Christchurch region are one-story, an average of 150 m2, and are built of light timber framing on concrete slab or pile foundations in accordance with NZS 3604 (first published in 1978). A common roof-ing material is light metal coated with stone chips. Timber weather-board, plastered stucco or unrein- forced brick veneer is used for ex- terior cladding. The veneers are anchored through small steel ties every two feet horizontally and one foot vertically that are embedded in mortar between bricks and screwed to a stud on the other end. Overall, houses in Christchurch are maintained well; according to a 2005 report, more than 80% were deemed to be in nearly new condi-tion and only about 3% required some sort of immediate attention. Their average valuation is about NZ$300,000, including land (Clark et al. 2005; Beattie and Thurston 2006). The earthquake shaking caused only limited structural dam- age to dwellings, but nonstructural damage was widespread. Chimney failure, brick fence collapse, and plasterboard cracks are common in virtually all earthquakes of this mag-
Figure 20. Temporary water tanks in front of Christ-church Hospital (photo: Gavin).
Figure 19. Classroom tents in the car park of the University of Canterbury, March 14, 2011 (photo: Comerio).
13
EERI Special Earthquake Report — May 2011
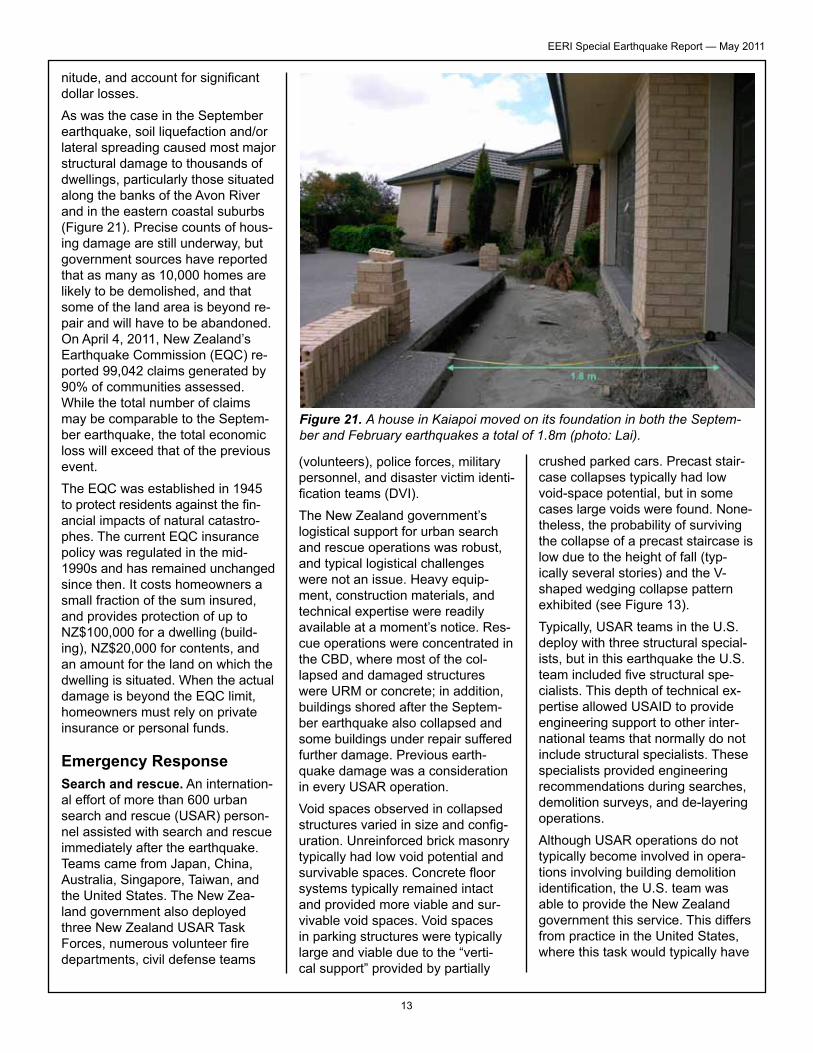
nitude, and account for significant dollar losses. As was the case in the September earthquake, soil liquefaction and/or lateral spreading caused most major structural damage to thousands of dwellings, particularly those situated along the banks of the Avon River and in the eastern coastal suburbs (Figure 21). Precise counts of hous- ing damage are still underway, but government sources have reported that as many as 10,000 homes are likely to be demolished, and that some of the land area is beyond re- pair and will have to be abandoned. On April 4, 2011, New Zealand’s Earthquake Commission (EQC) re- ported 99,042 claims generated by 90% of communities assessed. While the total number of claims may be comparable to the Septem-ber earthquake, the total economic loss will exceed that of the previous event.The EQC was established in 1945 to protect residents against the fin- ancial impacts of natural catastro- phes. The current EQC insurance policy was regulated in the mid- 1990s and has remained unchanged since then. It costs homeowners a small fraction of the sum insured, and provides protection of up to NZ$100,000 for a dwelling (build-ing), NZ$20,000 for contents, and an amount for the land on which the dwelling is situated. When the actual damage is beyond the EQC limit, homeowners must rely on private insurance or personal funds.
Emergency ResponseSearch and rescue. An internation- al effort of more than 600 urban search and rescue (USAR) person-nel assisted with search and rescue immediately after the earthquake. Teams came from Japan, China, Australia, Singapore, Taiwan, and the United States. The New Zea-land government also deployed three New Zealand USAR Task Forces, numerous volunteer fire departments, civil defense teams
(volunteers), police forces, military personnel, and disaster victim identi-fication teams (DVI). The New Zealand government’s logistical support for urban search and rescue operations was robust, and typical logistical challenges were not an issue. Heavy equip-ment, construction materials, and technical expertise were readily available at a moment’s notice. Res- cue operations were concentrated in the CBD, where most of the col- lapsed and damaged structures were URM or concrete; in addition, buildings shored after the Septem- ber earthquake also collapsed and some buildings under repair suffered further damage. Previous earth-quake damage was a consideration in every USAR operation.Void spaces observed in collapsed structures varied in size and config-uration. Unreinforced brick masonry typically had low void potential and survivable spaces. Concrete floor systems typically remained intact and provided more viable and sur- vivable void spaces. Void spaces in parking structures were typically large and viable due to the “verti-cal support” provided by partially
Figure 21. A house in Kaiapoi moved on its foundation in both the Septem-ber and February earthquakes a total of 1.8m (photo: Lai).
crushed parked cars. Precast stair- case collapses typically had low void-space potential, but in some cases large voids were found. None- theless, the probability of surviving the collapse of a precast staircase is low due to the height of fall (typ- ically several stories) and the V- shaped wedging collapse pattern exhibited (see Figure 13). Typically, USAR teams in the U.S. deploy with three structural special- ists, but in this earthquake the U.S. team included five structural spe- cialists. This depth of technical ex- pertise allowed USAID to provide engineering support to other inter-national teams that normally do not include structural specialists. These specialists provided engineering recommendations during searches, demolition surveys, and de-layering operations. Although USAR operations do not typically become involved in opera-tions involving building demolition identification, the U.S. team was able to provide the New Zealand government this service. This differs from practice in the United States, where this task would typically have
14
EERI Special Earthquake Report — May 2011
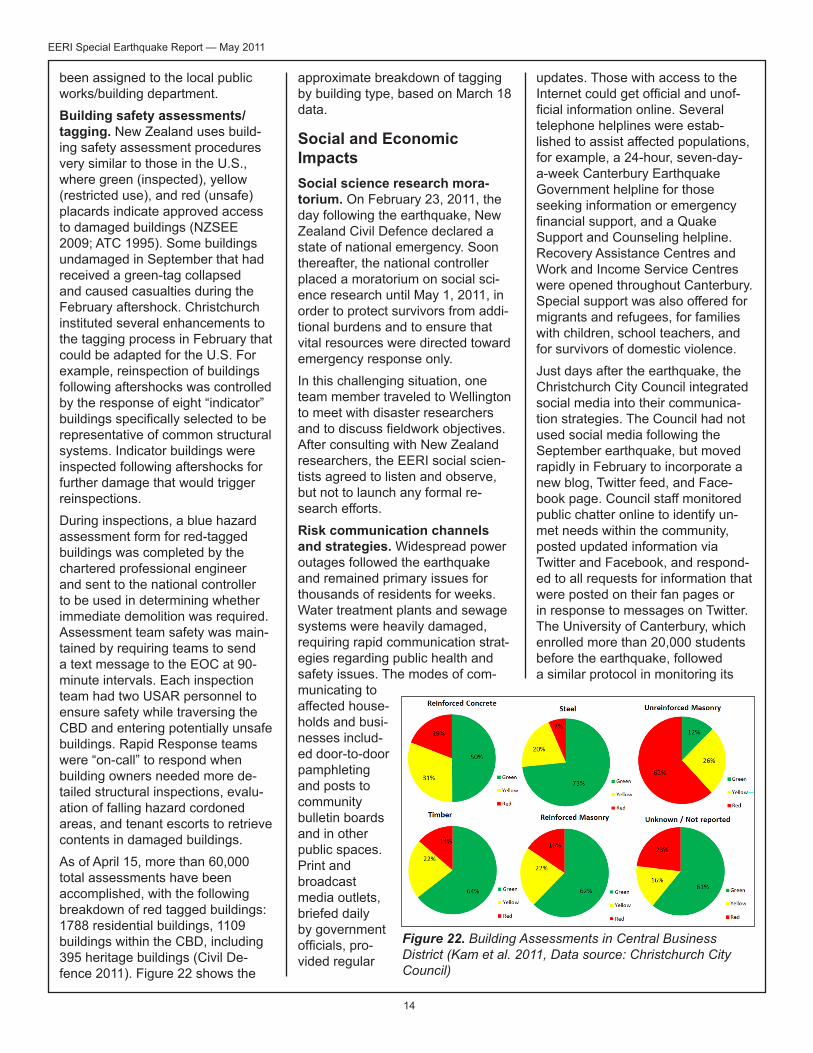
been assigned to the local public works/building department. Building safety assessments/tagging. New Zealand uses build-ing safety assessment procedures very similar to those in the U.S., where green (inspected), yellow (restricted use), and red (unsafe) placards indicate approved access to damaged buildings (NZSEE 2009; ATC 1995). Some buildings undamaged in September that had received a green-tag collapsed and caused casualties during the February aftershock. Christchurch instituted several enhancements to the tagging process in February that could be adapted for the U.S. For example, reinspection of buildings following aftershocks was controlled by the response of eight “indicator” buildings specifically selected to be representative of common structural systems. Indicator buildings were inspected following aftershocks for further damage that would trigger reinspections. During inspections, a blue hazard assessment form for red-tagged buildings was completed by the chartered professional engineer and sent to the national controller to be used in determining whether immediate demolition was required. Assessment team safety was main- tained by requiring teams to send a text message to the EOC at 90- minute intervals. Each inspection team had two USAR personnel to ensure safety while traversing the CBD and entering potentially unsafe buildings. Rapid Response teams were “on-call” to respond when building owners needed more de- tailed structural inspections, evalu-ation of falling hazard cordoned areas, and tenant escorts to retrieve contents in damaged buildings. As of April 15, more than 60,000 total assessments have been accomplished, with the following breakdown of red tagged buildings: 1788 residential buildings, 1109 buildings within the CBD, including 395 heritage buildings (Civil De- fence 2011). Figure 22 shows the
approximate breakdown of tagging by building type, based on March 18 data.
Social and Economic ImpactsSocial science research mora-torium. On February 23, 2011, the day following the earthquake, New Zealand Civil Defence declared a state of national emergency. Soon thereafter, the national controller placed a moratorium on social sci-ence research until May 1, 2011, in order to protect survivors from addi-tional burdens and to ensure that vital resources were directed toward emergency response only. In this challenging situation, one team member traveled to Wellington to meet with disaster researchers and to discuss fieldwork objectives. After consulting with New Zealand researchers, the EERI social scien-tists agreed to listen and observe, but not to launch any formal re- search efforts. Risk communication channels and strategies. Widespread power outages followed the earthquake and remained primary issues for thousands of residents for weeks. Water treatment plants and sewage systems were heavily damaged, requiring rapid communication strat-egies regarding public health and safety issues. The modes of com-municating to affected house-holds and busi- nesses includ- ed door-to-door pamphleting and posts to community bulletin boards and in other public spaces. Print and broadcast media outlets, briefed daily by government officials, pro-vided regular
updates. Those with access to the Internet could get official and unof-ficial information online. Several telephone helplines were estab-lished to assist affected populations, for example, a 24-hour, seven-day-a-week Canterbury Earthquake Government helpline for those seeking information or emergency financial support, and a Quake Support and Counseling helpline. Recovery Assistance Centres and Work and Income Service Centres were opened throughout Canterbury. Special support was also offered for migrants and refugees, for families with children, school teachers, and for survivors of domestic violence. Just days after the earthquake, the Christchurch City Council integrated social media into their communica-tion strategies. The Council had not used social media following the September earthquake, but moved rapidly in February to incorporate a new blog, Twitter feed, and Face-book page. Council staff monitored public chatter online to identify un- met needs within the community, posted updated information via Twitter and Facebook, and respond- ed to all requests for information that were posted on their fan pages or in response to messages on Twitter. The University of Canterbury, which enrolled more than 20,000 students before the earthquake, followed a similar protocol in monitoring its
Figure 22. Building Assessments in Central Business District (Kam et al. 2011, Data source: Christchurch City Council)
15
EERI Special Earthquake Report — May 2011
Facebook page and responding directly to student concerns and requests for additional information. Unofficial social media presence was also significant, led by a virtual network of online volunteers who created and staffed the Christ-church Recovery Map site. This group—whose work was driven by a determination to get people the information they needed as quickly as possible—posted the first acces-sible maps, via Google, of the CBD and outlying areas. Major print and online media sources in the Christ-church area then reproduced and published the maps.Because of the destruction in the CBD and the focus on life-saving activities among emergency re- sponders, technology volunteers launched online resources more quickly than the official responders were able to, providing early access to curated information to those who could get online. The virtual volun-teer team stopped its efforts once normal communication channels resumed and directed prior users to visit the official government site at http://canterburyearthquake.org.nz/. Rather than leading to “information overload” from competing sources, the spontaneous and official online resources performed complemen-tary functions at different points in the response and early phases of recovery. Online channels for organizing. Social media and online channels used to communicate risk and assist with the response were instrumen- tal in organizing volunteers and do- nations. Many small-scale efforts emerged in the wake of the earth-quake, but the Student Volunteer Army (SVA), which mobilized more than 12,000 spontaneous volunteers (about 90% of whom were university students), stands out. Using a Face-book page, text messaging, and a variety of other technologies, the SVA volunteers logged thousands of person hours delivering chemical toilets, shoveling silt, removing fallen bricks, sorting donations, and
delivering informational pamphlets to those directly affected by the earthquake. Many elderly residents called on the SVA for help with re- moving debris, as did government officials who needed assistance with various tasks. Social media were also used for finding missing persons and as an outlet for remem-brance and expressing grief for the deceased. Risk messaging. Communicating risk and uncertainty in the aftermath of the February earthquake was a high priority for public officials faced with reassuring the population that effective measures were in place to restore infrastructure and protect lives. The importance of these ef- forts was amplified by the back-to-back earthquakes over a six-month period and ongoing aftershocks, all of which elevated anxiety and con- cerns about safety. By mid-March, it was estimated that tens of thou- sands of residents were still dis-placed. Government officials were unsure when, if ever, these individ- uals would return and were in the process of developing a strategy for communicating with displaced residents. Risk perception and the impact on international tourism, which accounts for 9% of the nation’s GDP, was also a major concern among officials. Those who had returned to Canter-bury expressed fear of re-entering tall buildings, and there was some misinterpretation of risk regarding the various colored placards that were placed on damaged buildings. As of April 30, 2011, the state of na- tional emergency was still in place, and it will likely continue for several more weeks. Thus, many outstand-ing questions still remain regarding communicating current and future risk for residents.
Lessons and Conclusions As in the September earthquake, the liquefaction damage was dram- atic and widespread. Some resi-dential areas of Christchurch may not be rebuilt because ground
deformations have left the areas prone to flooding. With peak ground accelerations exceeding 0.5g, the February quake caused collapse in many URM buildings, some of them retrofitted. Data from this event will help us understand the poor performance of some retrofitted URM buildings and develop better design approaches and standards. There is a window of opportunity with the ongoing revisions to ASCE 31/41 guidelines to incorporate these important lessons. Similarly, the extensive damage to concrete buildings, despite the very short duration of the earthquake, holds important lessons for understanding collapse mechanisms and improv-ing seismic assessment techniques. Earthquake engineers from around the world have extraordinary op- portunities to collaborate in both academic- and practice-oriented research on building performance, soil-structure interaction, impacts of liquefaction and lateral spread-ing, consideration of aftershocks in design and post-earthquake assessments, and other key topics. With reference to post-earthquake safety assessment, it was clearly demonstrated that, when large numbers of buildings are damaged and a large portion of the city is closed, it becomes critical to have access to drawings. This earth-quake emphasizes the need for cities to create a centralized and accessible database of structural drawings for use in emergency building evaluation. On the policy side, the New Zea-land earthquakes can provide val- uable lessons to those areas of the U.S. where there is either lower seismicity or infrequent, high-con-sequence events. Some of these areas use “relaxed” or reduced seismic criteria even today and these events suggest strongly that such policies be reconsidered. In addition, this earthquake has again reinforced the need for an Earth-quake Buildings Rating System that permits design professionals to
16
EERI Special Earthquake Report — May 2011
communicate the seismic perfor-mance of buildings in terms that are easily understood by the public. The overall performance of modern buildings in the CBD may satisfy our technical performance standards, but was it acceptable to the public? Furthermore, after all the damage and psychological distress from both quakes, the public trust in all buildings within the heavily dam-aged area was shaken. The Univer-sity of Canterbury went to extreme lengths to evaluate all its buildings in order to be able to reassure stu-dents and staff that buildings were safe to occupy. This will be impor-tant in any large event in the U.S. Finally, the long-term recovery is- sues for the CBD are critical. With 25% of the buildings demolished un- der emergency orders and perhaps another 25% that could be taken down by owners, economic develop-ment and a major rebuilding program will be critical. For the engineering professions this raises again the per- ennial question: what levels of dam-age are acceptable in existing and new infrastructure, and what per- formance standards can we provide?
AcknowledgmentsThe team was ably assisted by fac- ulty and students from the Univer- sity of Canterbury, including Bruce Deam, Rajesh Dhaka, Greg Mac- Rae, Alessandro Palermo, Stefano Pampanin, Erica Seville, and Wang Kam. Equally valuable was the help provided by University of Auckland Associate Professor Jason Ingham, New Zealand Society for Earth-quake Engineering (NZSEE) pres- ident Peter Wood, consulting engi- neer and head of the Critical Build-ings Project David Hopkins, USAR engineers Des Bull and Craig Ste- venson, Chamber of Commerce chief executive Peter Townsend, and City of Christchurch officials, particularly Steve McCarthy.
ReferencesApplied Technology Council, 1995.
Procedures for Postearthquake
Safety Evaluation of Buildings, Redwood City, CA.
Beattie, G. J. and S. J. Thurston, 2006. Changes to the Seismic Design of Houses in New Zea-land, 2006 NZSEE Conference.
Bruneau, M. et al., 2011. Steel Building Damage from the New Zealand Earthquake of February 22, 2011. http://mceer.buffalo.edu/research/Reconnaissance/New_Zealand2-21-11/CHCH_EQ_Steel_damage_2011-03-11.pdf
Christchurch City Council, 2011. Christchurch Earthquake 22 Feb. 2011. http://www.ccc.govt.nz/
Civil Defence, 2011. Building Safety Evaluation Team, Christchurch, New Zealand.
Clark, S. J., M. Jones, and I. C. Page, 2005. New Zealand 2005 House Condition Survey, BRANZ 2005 ISSN: 0113-3675.
Cubrinovski and Taylor, 2011. Lique- faction Map — Drive-through Re- connaissance, University of Can-terbury NZ. www.nzsee.org.nz
Environment Canterbury and Christchurch City Council, 2011. Canterbury Earthquake. http://canterburyearthquake.org.nz/
Environment Canterbury, 2004. The Solid Facts on Christchurch Liq-uefaction. http://www.ecan.govt.nz/publications/General/solid-facts-christchurch-liquefaction.pdf
GEER, 2011. Geotechnical Reconnaissance of the 2011 Christchurch (New Zealand) Earthquake, GEER Association Report (in preparation). http://www.geerassociation.org/
GeoNet, 2011, Canterbury Quakes. http://www.geonet.org.nz
GNS Science, 2011. Canterbury Quakes. http://www.gns.cri.nz/
Hare, J., 2011. Christchurch Seismic Design Load Levels: Interim Ad- vice, Structural Engineering Soci-ety of New Zealand, April 2011.
Kam, W. Y., U. Akguzel, and S. Pampanin, 2011. 4 Weeks On:
Preliminary Reconnaissance Report from the Christchurch 22 Feb 2011 6.3Mw Earthquake. http://db.nzsee.org.nz:8080/en/web/chch_2011/structural/
King, A. B., et al., 2003. The Austra-lia/New Zealand Earthquake Load-ings Standard, AS/NZS 1170.4. 2003 Pacific Conference on Earth-quake Engineering, Paper #138. Christchurch: New Zealand Soci-ety for Earthquake Engineering,
Ministry of Education, 2011, Our Responses and Updates, 2011. http://www.minedu.govt.nz/EQNZ
New Zealand Childcare Association, 2011. Christchurch Earthquake Emergency Response Sector Briefing — Notes, March 1, 2011. http://www.nzca.co.nz/files/Sector_Briefing_Notes
New Zealand Herald, 2011. “97% of Christchurch Schools to open,” March 20. http://www.nzherald.co.nz/nz/news/article.cfm?c_id=1&objectid=10713801
NZS1170.5, 2004. “Structural De- sign Actions, Part 5: Earthquake Actions – New Zealand”, Stan-dards New Zealand.
New Zealand Society for Earthquake Engineering, 2009. Building Safety Evaluation During a State of Emergency: Guidelines for Territo-rial Authorities, August.
New Zealand Parliament, 2011. Canterbury earthquake (Edu-cation Act) Order 2011, Order in Council, March 8. http://www.legislation.govt.nz/regula-tion/public/2011/0038/latest/DLM3586764.html?search=ts_reg-ulation_canterbury+earthquake_resel&p=1&sr=1
Statistics New Zealand, 2011. http://www.stats.govt.nz/browse_for_stats/education_and_training/earthquake-schools.aspx
Various news articles between February 23 and March 20, 2011, http://www.stuff.co.nz/national/christchurch-earthquake